
A Multidimensional Fuzzy Quality Function Deployment Design for Brand Experience Assessment of Convenience Stores


1
Department of Marketing and Distribution Management, National Kaohsiung University of Science and Technology, Kaohsiung 824005, Taiwan
2
Department of Marketing Management, Kaohsiung Campus, Shih Chien University, Kaohsiung 84550, Taiwan
*
Author to whom correspondence should be addressed.
Mathematics 2021, 9(20), 2565; https://0-doi-org.brum.beds.ac.uk/10.3390/math9202565
Submission received: 25 August 2021
/
Revised: 7 October 2021
/
Accepted: 8 October 2021
/
Published: 13 October 2021
(This article belongs to the Special Issue Fuzzy Sets in Business Management, Finance, and Economics)
Abstract
:In the past, few studies have explored brand attachment and how to deliver the content of a strategic management program through brand experience. The purpose of this study is to construct an integrated model of consumer brand attachment and brand experience. It also applies the fuzzy quality function deployment (FQFD) method to develop a value competitive strategy model of convenience stores. The respondents were split across two stages. In the first stage, 265 consumers were surveyed on the importance of brand attachment; in the second stage, 38 experts and scholars were invited to evaluate the content of a strategic management program. The results showed that for three convenience store brands, the levels of brand attachment of the young and older customer groups each had their own advantages and must be strengthened. Taking 7-Eleven as a practical implications example, we can learn from the analysis that young customers believe “brand prominence” is the most important factor, followed by “brand passion”, “brand affection”, and “brand–self connection”. As for older customers, the order from most to least important was “brand–self connection”, “brand affection”, “brand prominence”, and “brand passion”. The originality value is that this study extends previous research findings in measuring and building brand attachment frameworks and importance assessments while providing a sound demonstration of enhancement strategy solutions.
1. Introduction
Brand experience and brand attachment are two important factors in the relationship between consumers and brands. Many studies have already explained the importance of brand experience, indicating that brand experience affects consumer loyalty and satisfaction [1,2,3]. Kang et al. [4] also maintained that, in addition to increasing the value of products and services, the consumer experience created by enterprises will become more substantial.
However, the idea of measuring consumer brand attachment has not received much attention. Despite increased customer-oriented marketing efforts in the service industry, relatively little attention has been given to the processes between brand attachment and brand experience. Although the general methodology or technology has focused on measuring customer perceptions of service quality and satisfaction [2,5], few studies have analyzed brand attachment for specific guidelines on how to design services of brand experience to meet the quality standards expected by consumers.
Although brand has the characteristic of material, it is also an important marketing tool for creating consumers’ experiences [6]. However, consumers cannot build profound and meaningful relationships with enterprises only through brand experience [7]. They seem to lack an emotional attachment to brand [8], and they use their attachment to brand to show their personalities, characteristics [9], and social self-identities [10]. Therefore, we believe that through the special attachment consumers hold for a brand, the brand can arouse certain types of experiences for consumers, who can also gain satisfaction. There are other ways for brands to attract consumers’ attention rather than only brand experience. In other words, in the retail or service industry, brand attachment (such as sense, emotion, self-connection, captivation, or social identity) can act as a connection and a conversation between consumers and brand experience.
In the light of this, Das et al. [11], Tafesse [12], and Schmitt [13] all believe that business strategies should be adjusted toward advantageous brand experience delivery. They think that there are already many companies that successfully manage their performance of organization through brand experience. They can also hold exiting consumers with product quality, market share, and profit rate. Therefore, we believe that the message sent by these issues does not simply emphasize that enterprises should use “brand experience” as the basis of competing advantages. Enterprises should further elevate and discover how to create brand experience and make consumers form an authentic value of brand attachment. Hence, the purpose of this study is to probe the meaning of brand experience activities. Apart from delivering brand messages, it is more important to listen to consumers’ most genuine voices at the scene. Through the conversation between consumer and brand, enterprises can find the core of attachment that consumers care about the most and create a greater actual benefit of brand experience activities.
The originality of this study was that we used the process of quality function deployment (QFD) for enterprises to truly hear every voice of the brand attachment demand attribute and further acknowledged the brand attachment demand and value treasured by consumers. In other words, through the planning and design of products or services, along with the execution of the management process, enterprises can further understand the consumer’s cognitive feel of brand attachment. By using the multiple procedures of QFD, the consumer’s genuine demand in their mind can be expressed by the internal relational structure matrix.
Hence, this study tried to integrate the procedure designs of QFD and fuzzy linguistic preference relations (FLPR) into fuzzy quality function deployment (FQFD). By doing so, we try to understand the brand attachment that consumers long for and the value that consumers demand and hence turn them into a major reference for brand experience strategy planning. The expected results and specific highlights of this study included the following: (1) establishment of a hierarchy of brand attachment through a literature review and discussion with experts; (2) construction of a QFD framework of brand attachment and a brand experience management strategy, as well as a correlation analysis between these two components; and (3) execution of a performance evaluation of different convenience stores based on the perceived difference between the desired performance and the current performance of brand experience strategy management.
The paper is organized as follows. A relevant literature review is provided in Section 2. Section 3 presents the construction of the brand attachment FQFD analysis process. The research design and empirical study are presented and discussed in Section 4 and Section 5, respectively. Finally, Section 6 provides the conclusion and implications.
2. Literature Review
2.1. Brand Attachment (BA)
The definition of brand attachment is the emotional bond between consumers and brands [14,15], and the concept of brand attachment refers to the strength of the bond connecting the brand with the self, which is very powerful in leading to satisfied, trusting, and committed relationships. The strength of the attachment varies on the basis of differences in the link between consumers and brands, and brand attachment has a significant impact on consumer behavior [16].
Carroll and Ahuvia [17] considered brand attachment as a way for consumers to show their obsession with and loyalty to products, which is a kind of profound, heartfelt emotional attachment behavior. Mishra et al. [18] defined brand attachment as the strength of the bond linking brands with the self. Park et al. [19] believed that brand attachment reflects the emotional bond between people and brands. Moreover, it enriches consumers’ memory network and the perception of the brand-self relationship. Bian and Haque [16] maintained that if consumers have a stronger brand attachment, they are more willing to engage in challenging activities that require time, money, energy, and reputation. Combining all these research results, we conclude that the external brand attachment behavior shown by consumers is actually an expression of satisfaction of their internal demands.
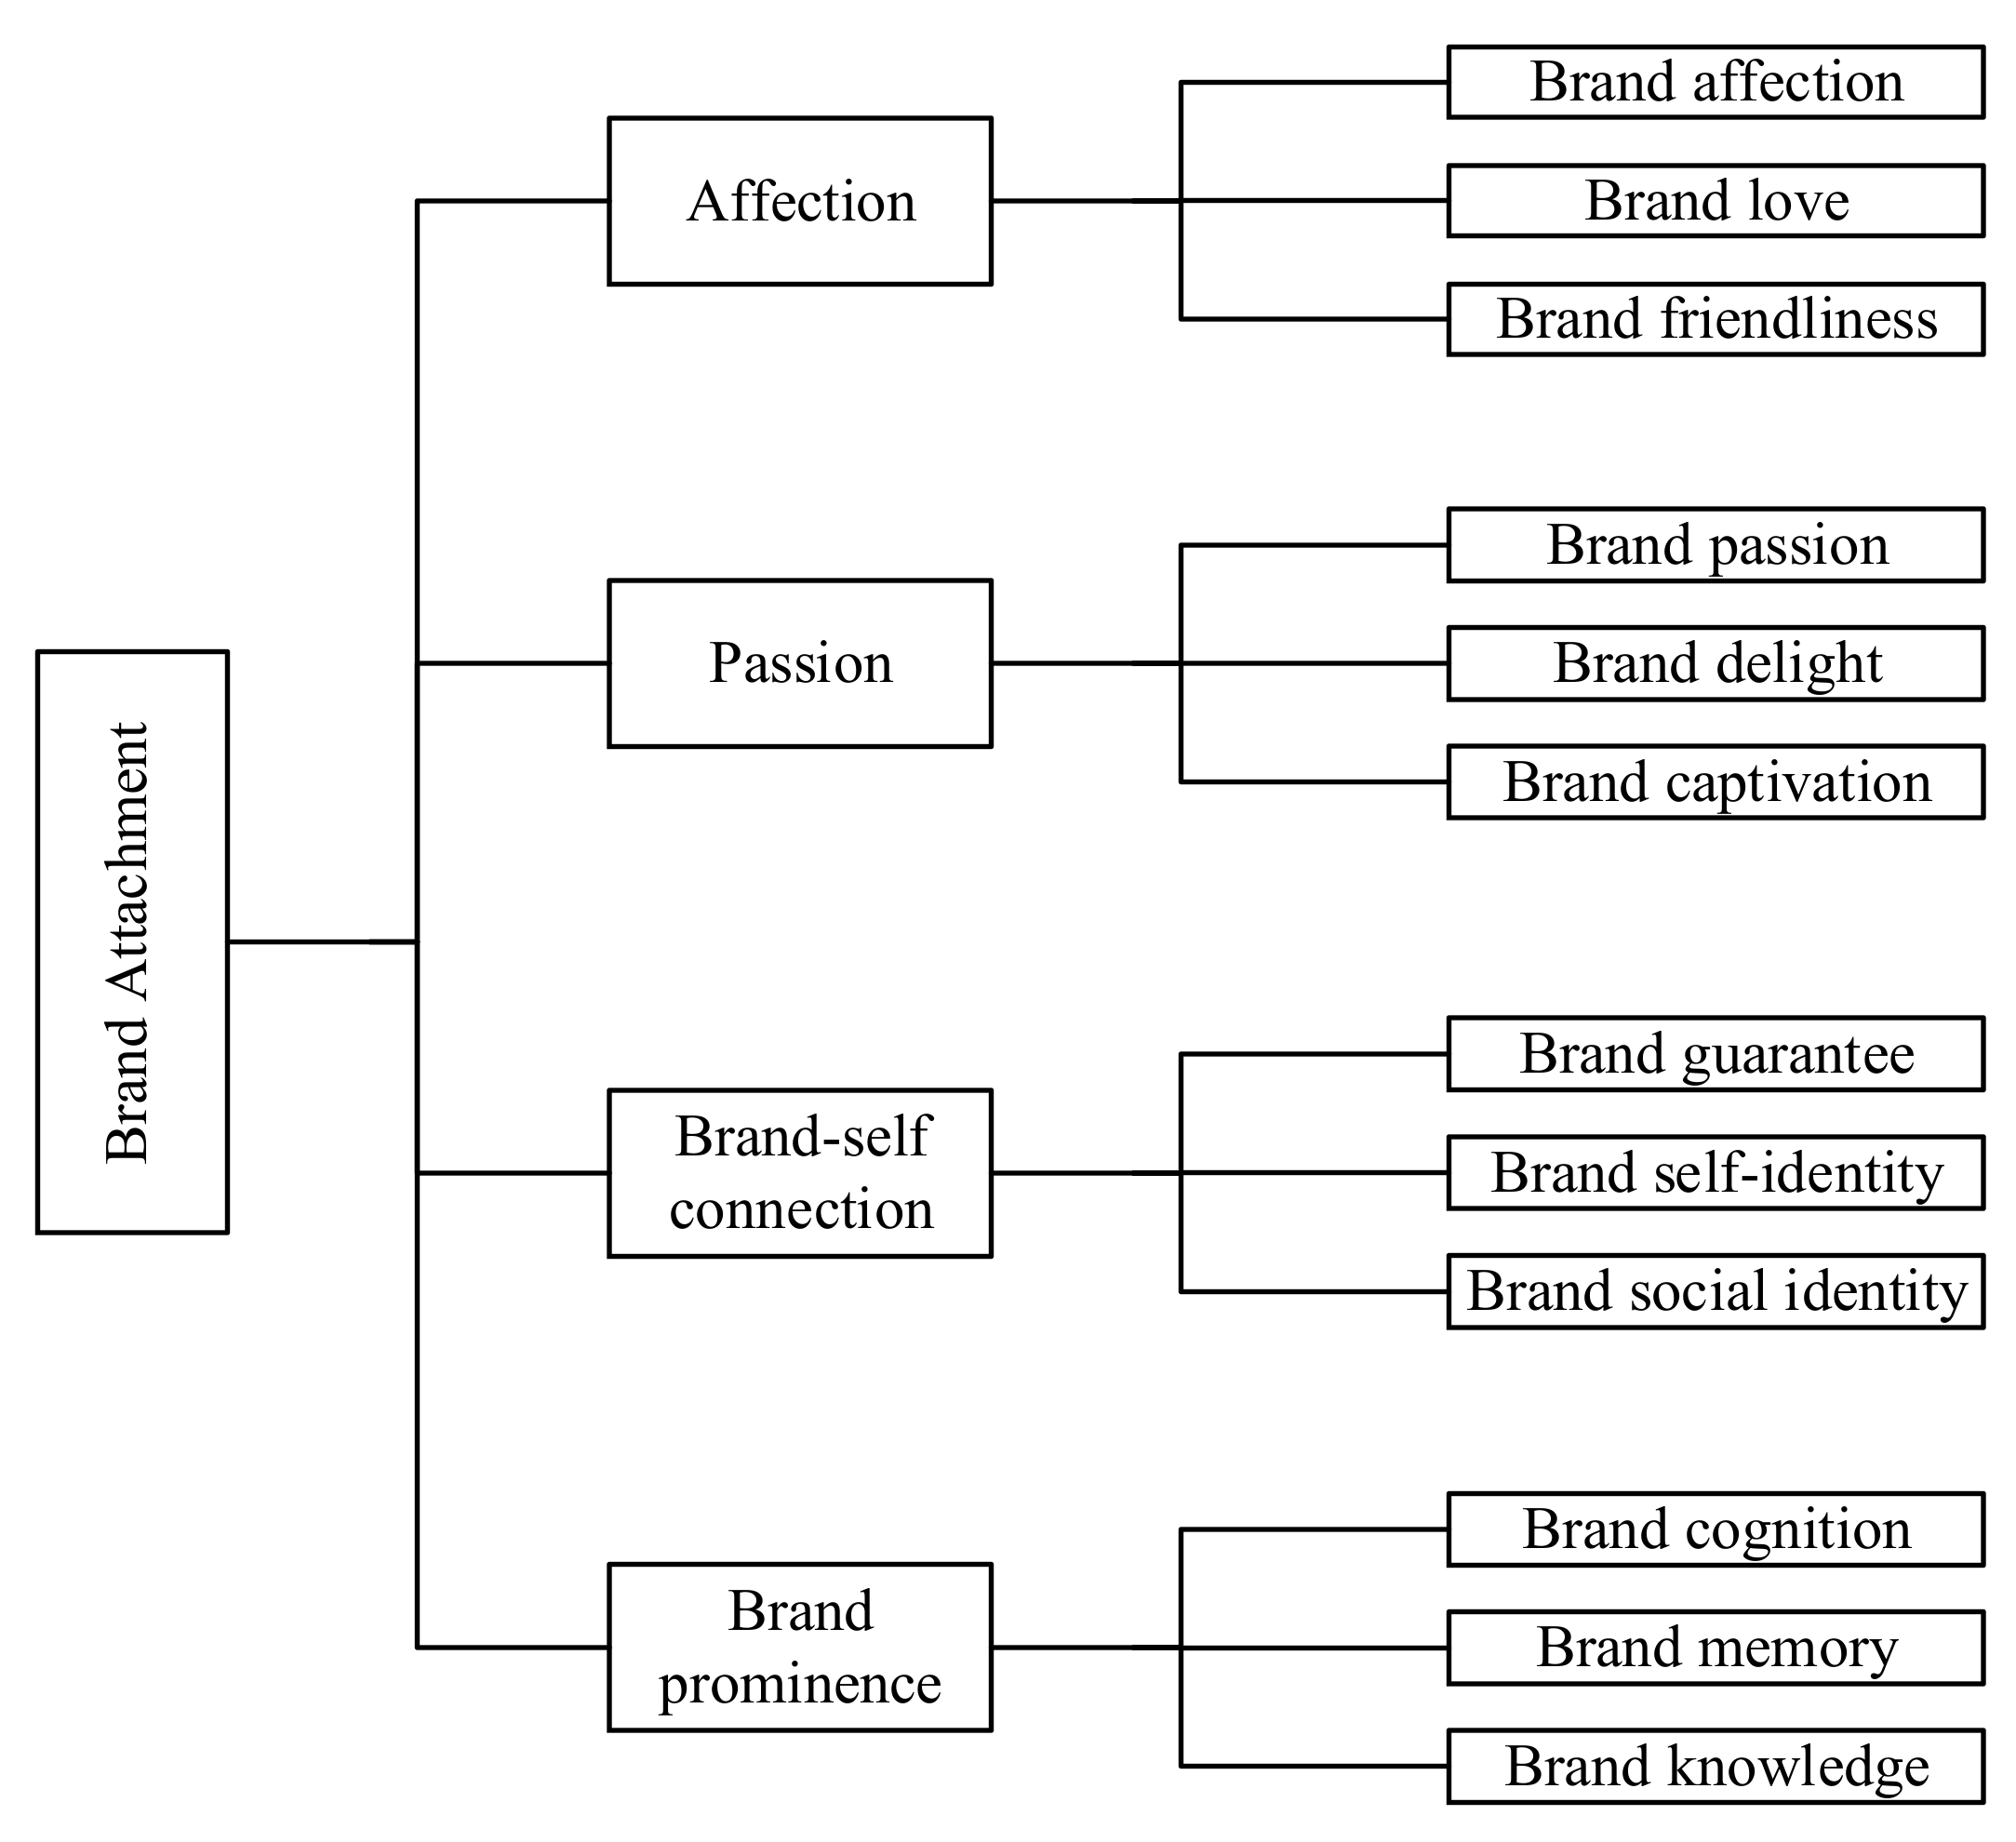
Hung and Lu [20] regarded brand attachment as an integration of the structure of emotions, which can be divided into positive and negative emotions. The results of their research demonstrate that the positive emotion of brand attachment is an effective predictive factor of brand repurchase intentions and word-of-mouth behavior. The dimensions of positive emotions are affection, passion, the brand–self connection, and brand prominence. The four dimensions of positive emotion proposed by Hung and Lu [20] are based on the pioneering empirical research on affection and brand attachment conducted by Thomson et al. [21], who elaborated that the bond of brand affection is characterized by deep connection, affection, and consumer passion. In addition, Park et al. [19] regarded the brand–self connection and brand prominence as two key factors of the brand attachment concept. On the basis of the research results above, this study adopts four key factors as brand attachment dimensions: affection, passion, the brand–self connection, and brand prominence.
Regarding the attributes of each dimension, the affection dimension is based on the study of Thomson et al. [21], who evaluated consumers’ brand affection using a scale. This factor reflects consumers’ warmth toward brands, which can be affectionate, loving, friendly, and peaceful. Among them, the peaceful attribute cannot be controlled by either consumers or businesses; therefore, it is excluded from this study. The passion dimension mainly reflects consumers’ ardor, excitement, and positive emotions, which can include passion, delight, and captivation. The brand–self connection dimension is mainly based on the brand function evaluation dimension proposed by Rio et al. [22]. It includes the brand guarantee, self-identity, social identity, and status. Among these, the status function corresponds to the personal desire to gain recognition from others. However, it does not represent the groups recognized by brands; consequently, it is excluded from this study. The brand prominence dimension is based on the brand awareness concept proposed by Aaker [23]. Aaker conceptualized brands and divided brand awareness into six attributes on the basis of brand equity: brand cognition, brand memory, brand opinion, brand dominance, top-of-mind brand awareness, and brand knowledge. Brand cognition, brand memory, and brand knowledge were chosen as the evaluative attributes of brand prominence in the present study to match the questions regarding brand prominence. The content above is organized in Table 1.
Ko et al. [25] pointed out that once a business has begun to add value, the next step is trying to increase its competitive advantages. The best way to achieve this goal is to build consumers’ emotional attachment to the business and its products. One way to build attachment is through experiential marketing. The purpose of experiential marketing is to fully understand consumers and think from the standpoint of the consumers to gain feedback from genuine experience, which can be converted into a precious resource to make brands grow.
2.2. Strategic Management Plan for Brand Experience
Brand experience is the sum of the product, shopping, service, and consumption experience gained by consumers when interacting and cooperating with brands with a clear intention to consume products and services [1,2,26]. Regarding consumers, compared with real products and intangible services, experience is the most unforgettable [27]. Bleier et al. [28] considered that there are two kinds of experiences: direct experiences, such as shopping, purchasing, and consuming products, and indirect experiences, such as consumers receiving commercials and marketing communication. Brakus et al. [2] believed that brand experience is formed by the brand-related stimuli (names, slogans, and pictures) received by consumers when searching for, purchasing, and consuming brands. These brand-related stimuli form the main source of consumers’ subjective reactions. The foundation of brand experience lies within the brand itself. Many studies have mentioned that brand experience constitutes the best chance for consumers to have a sense of passion for and differentiate between brands and that the interaction between experience and brands is very close [29].
The meaning of a brand involves creating explicit consumer reactions; therefore, deeper relationships with consumers can be developed [27]. Experience can create brand image and offer opportunities for consumers’ curiosity to be aroused and for consumers to explore, purchase, and become involved, thus creating a sense of favorability [30]. Jimenez-Barreto et al. [31] also proposed that brand experience can effectively arouse consumers’ interest in brands and products and further arouse their desire to purchase. Mclean et al. [32] also conducted a related study on brand experience activities and developed a mobile application customer experience model in which consumers keep circulating and creating valuable things with brands. Molinillo et al. [33] observed the effect of brand experience on loyalty to retailers. They believed that the purpose of brand experience activities is not only to deliver brand messages but also to listen to the real voice of consumers through the activities. Only if a brand finds the core of what consumers care the most about through conversation can brand activities create more substantial benefits.
Schmitt [34] developed strategic experiential modules (SEMs), which divided experience into five forms: sensing, feeling, thinking, acting, and relating. With regard to sensing, feeling, and thinking, consumers’ expectations of brands go far beyond the brand-related function and practicality. Maehle et al. [35] tried to satisfy consumer demands, considered that experience can achieve full customer satisfaction, and divided experience into five dimensions: definition, notification, imagination, immersion, and interest arousal. At the same time, Schmitt [34] pointed out the difference between products and experience and confirmed that the concept of brand experience genuinely depicts the spirit of a brand. He further explained that consumers’ expectations of brands, which integrate consumers’ feelings, sensations, and wisdom, go far beyond the brand-related function and practicality.
Many scholars continue to investigate experience issues, and they all propose their own views. On the basis of past research on consumers and marketing, Lam et al. [36] offered another perspective: when consumers search for products, go shopping, receive services, and consume products, experience automatically happens at the same time as such behaviors. They divided experience into sensing, feeling, cognition, and behavior. Nysveen et al. [37] believed that in addition to the four dimensions of sensing, feeling, cognition, and behavior, relating is essential and constitutes a fifth dimension. The measurement base of overall brand experience in this study adopted the brand experience factor dimensions proposed by Schmitt [9], which are recognized by major scholars and include five dimensions: sensing, feeling, thinking, acting, and relating. The five dimensions of brand experience proposed by Lam et al. [36] and Nysveen et al. [37] were also adopted, and the mobile application brand experience research conducted by Kim and Yu [38] was also included. Excluding the sensing dimension, which has little effect, this study adopted four dimensions as the structure of brand experience and strategic management planning, i.e., feeling, thinking, acting, and relating, as shown in Table 2.
2.3. Fuzzy Quality Function Deployment
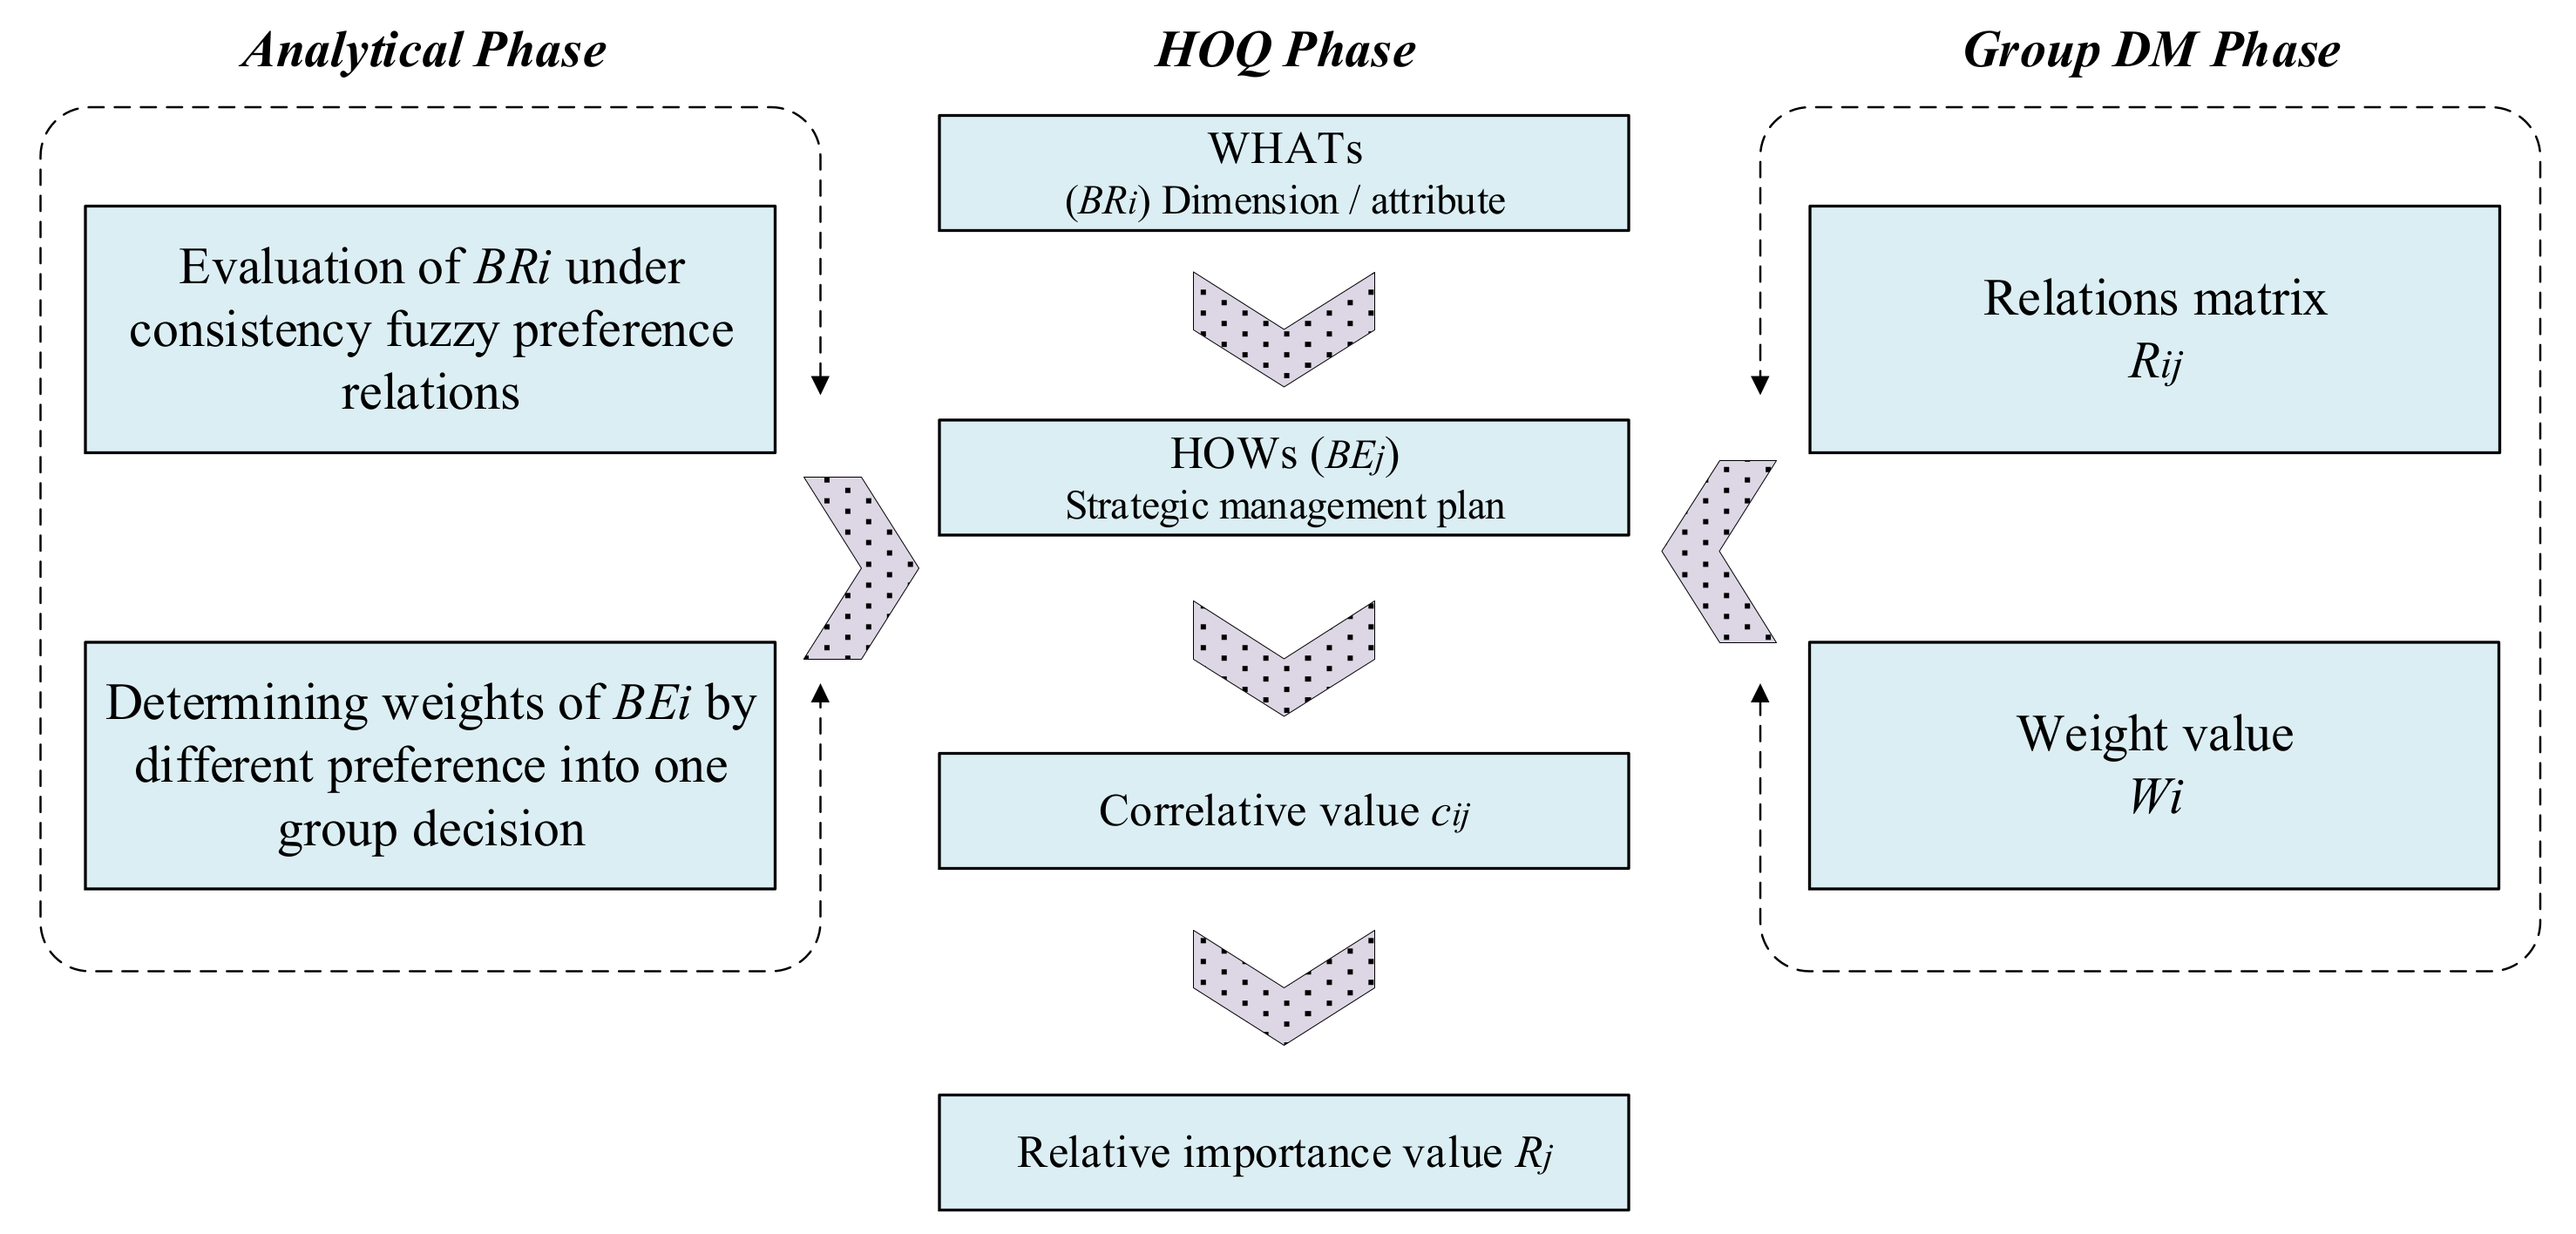
To truly understand consumers’ reactions and voices with regard to brand attachment, the QFD procedure makes it possible to understand the brand attachment felt by consumers [46] and, in turn, provide a service experience. The QFD concept originated in Japan in the 1960s and had a widespread impact on Western countries in the 1980s. It is particularly important for the business industry when trying to understand consumers’ versatile demands [47]. Through the planning and design of products or services and the execution of management procedures, QFD can help business owners understand differences in the cognition of consumers, especially when business owners are providing new services and products [48]. This multistep procedure can be expressed by an internal relational structure matrix, and the easiest method is to use the HOQ framework [48]. The relationship between WHATs and HOWs and the weight and performance values of every element can be presented in an HOQ matrix. Figure 1 shows the six parts of the HOQ matrix: (1) customer requirements (WHATs), (2) technical requirements (HOWs), (3) the relationship matrix (correlation of WHATs and HOWs), (4) the customer needs assessment, (5) competence analysis, and (6) prioritized technical requirements. However, when the demands of consumers become complex and versatile, the message provided by the HOQ will subsequently become fuzzy. For example, the key demand attribute may be overestimated, or it may not be possible to precisely show its importance. Therefore, through the explanation of fuzzy sense, the process design can be more flexible.
Thus, this study attempts to use the QFD procedure to analyze the brand attachment attributes felt by consumers. Subsequently, it makes the analyzed data the basis for designing a brand experience strategy. Applying QFD involves collecting semantic data, which include the subjective judgment or emotional uncertainty of consumers or experts. Therefore, regarding the issue of brand attachment, consumers will be inconsistent in the judgment standard of favorability because of different cognition of their internal demands. If an evaluation is performed using precise numerical values, it is possible that the study team will be unable to know consumers’ reactions and genuine feelings; thus, the evaluation may also be unreliable. In fact, using semantic data to show emotional characteristics, such as liking or attachment, is fundamentally fuzzy and uncertain. However, when the values and demands of consumers become complex and versatile, the message provided by the HOQ will subsequently become fuzzy [49]. To process these data properly, this study adopts fuzzy set theory to cope with the problem posed by the fact that traditional statistical evaluation cannot precisely measure the emotions of attachment, attitudes, and ideas.
Regarding FQFD research, Hsu and Tang [49] believed that expressing consumers’ demands through natural semantics involves fuzziness and uncertainty. Therefore, using the concept of fuzzy logic can overcome some limitations of the demand side of the HOQ and make consumers’ imprecise demands easier to understand. Yuen [50] found some limitations in the traditional QFD method: (1) the traditional QFD method cannot provide a reasonable explanation of how a consensus is reached in the process of member evaluation; (2) the presentation of traditional QFD information cannot explain the subject’s cognitive conflict; and (3) the data used in traditional QFD are assumed to be clear values, which ignores the fuzziness and differences in subjects’ attitudes and behaviors. Therefore, Yuen [50] maintained that integrating fuzzy set theory into the HOQ will make complex decision-making data easier to organize and represent in a more flexible way. In addition, Haber et al. [51] used both fuzzy values and clear values to make comparisons and see what uncertainty would cause in the demand attribute of the HoQ. Their results showed that using clear values enhanced the effect caused by uncertainty.
In recent years, studies that have combined fuzzy set theory and QFD include the following. Mehtap and Karsak [52] combined QFD and fuzzy multicriteria decision making (MCDM) to select suppliers. Hsu and Tang [53] combined QFD and the fuzzy analytic hierarchy process (FAHP) and considered the combination of customer relationship interest and the business relationship linking strategy. Ultimately, they developed a model of customer relationship management strategy. Lam and Lai [54] used the fuzzy analytic network process (FANP) and QFD to develop and design new products. Dat et al. [55] combined FQFD with the technique for order preference by similarity to ideal solution (TOPSIS) to maximize company interest and compare market segmentation, adding characteristics of different markets to companies’ existing advantages. Lu et al. [56] combined the FAHP, QFD, and the brand knowledge concept proposed by Keller to develop a model of brand revitalization. Kayapınar and Erginel [57] combined a fuzzy multiobjective decision-making model and FQFD to design airport services. Xie et al. [58] proposed a multiobjective decision-making method to choose the technical index in the HOQ; the purpose of this method was to calculate and fix the fundamental importance of the technical index. They also used mobile phone product design, for example, to verify the utility and effectiveness of the method. Zaitsev and Dror [59] applied QFD to examine the relationship between multiple indexes of corporate social responsibility and their results. Lizarelli et al. [60] used fuzzy approaches and QFD to support improvement decisions in an entrepreneurial education service. Chen et al. [61] proposed a new integrated MCDM method for improving QFD, which integrated the hesitant fuzzy linguistic term set under an uncertainty environment. Haiyun et al. [62] proposed the innovation strategies in the energy industry using the QFD-based hybrid interval valued intuitionistic fuzzy decision approach combined with a novel hybrid methodology.
Analyzing the studies above, we learn that the messages that consumers send often contain ambiguity and multiplicity in the sensing dimension. Moreover, the data or attributes oriented toward qualitative data often show subjective uncertainty in evaluations. Hence, it seems that the analytical framework of traditional QFD cannot truly represent the importance of the evaluation of consumer demand attributes. Therefore, applying the method of fuzzy set theory to analyze the semantic data expressed by the subjects and using fuzzy numbers to represent consumers’ feelings toward their favorite targets will make the analysis more objective and evidence-based.
3. Brand Attachment FQFD Analysis Process
The objective of developing the FQFD framework in this study is to solve the above-mentioned problems encountered by traditional QFD [50]. One of the main advantages of using consistency fuzzy preference relation analysis [63] in this study is that rather than the traditional method of comparing n(n − 1)/2 attributes multiple times, only (n − 1) evaluations are required. This can reduce the number of importance comparisons between attributes. Another advantage is that the FQFD analysis process allows the multiple semantic data presented by the subjects to be properly measured and avoids the subjective judgment and uncertainty of consumers that may be implied by the semantic communication in the evaluation process of traditional HOQ [55]. The strategic process of strengthening brand experience was constructed by FQFD and based on brand attachment, as shown in Figure 2. Each step is explained below.
3.1. Step 1: Building Brand Attachment Demand Attributes (WHATs) and Experience Strategic Management Plans (HOWs)
In the FQFD analysis process, the brand attachment demand attributes were WHATs, and HOWs were experience strategic management plans that could satisfy or make consumers form brand attachment. We used both a literature review and expert interviews to collect and confirm the content of each brand attachment attribute. BRi represents the brand attachment demand dimension/attribute, and BEj represents the experience strategic management plan.
3.2. Step 2: Analysis Process Platform of Brand Attachment
In the FQFD analysis platform, this study used MATLAB software with Excel to analyze the data, and the calculation process applied was as follows: (1) the calculation of the relative importance value of WHATs (Wi), (2) the calculation of the value of the relationship between WHATs and HOWs (Rij), and (3) the calculation of the final relative importance value of HOWs (Rj). This study did not include the HOWs value of cij in the calculation, and therefore, the final integrated calculation focused on the value of Rj.
3.3. Step 3: Assessing the Consistency Fuzzy Preference Relations of Brand Attachment
This study used the concept of fuzzy linguistic variables and consistency fuzzy preference relations, in addition to the nine linguistic scales proposed by Herrera-Viedma et al. [64], to build a consistent fuzzy preference relations matrix. On a practical level, consistent fuzzy preference relations can effectively rectify the inconsistency in the evaluation outcome as a result of increasing the number of constructs examined. This method can effectively solve the inconsistency problem that may occur when interviewed experts complete a questionnaire, and in turn, it increases the overall effectiveness and accuracy. This study used the characteristic of the fuzzy linguistic preference relation addition reciprocal to calculate and used defuzzification [65] to acquire the crisp relative weight value of the brand attachment attributes (,,…,).
3.4. Step 4: Developing the Technical Items of Brand Experience Strategic Management Plans
This study used the brand experience dimensions proposed by Schmitt [9] as the basis of developing a whole brand experience strategy, including sensing, feeling, thinking, acting, and relating. This study also combined the five brand experience dimensions proposed by Nysveen et al. [37] and the mobile application brand attachment items developed by Kim and Yu [38] to build the four dimensions and strategic management plan of this study. We also assumed that ,,…, are the technical items of the brand experience strategic management plan.
3.5. Step 5: Evaluating the Incidence Matrix of Brand Attachment Attributes and Brand Experience Strategic Management Plans
This study assumed that the number of subjects is k, they evaluate the ith brand attachment attribute and the jth brand experience strategic management plan, and the fuzzy incidence is ijk ··). A triangular fuzzy number is demoted simply as ··). The parameters , , and indicate the smallest possible value, the most promising value, and the largest possible value, respectively. Therefore, the average formula below can be used to organize the views from K subjects and to convert fuzzy linguistics into crisp numbers through defuzzification. Finally, we can obtain the crisp incidence matrix value, Rijk.
3.6. Step 6: Evaluating the Importance of Brand Experience Strategic Management Plan Items
The target value of brand experience strategic management plan items was calculated from the incidence matrix value, Rijk, multiplied by the relative weight value of the brand attachment attributes (,,…,), and we acquired the relative weight value of the brand experience strategic management plan Rj. To evaluate all brand experience strategic management plans on the same basis, this study used a formula to standardize each value. Then, this study obtained the technical importance evaluation value of the target brand experience strategic management plan.
4. Research Design
The subjects of this study were three major chain convenience stores: 7-Eleven, Family Mart, and Hi-Life. We discussed the differences among the three rival enterprises and analyzed the differences in various consumer groups’ brand attachments. The subjects of the questionnaire were loyal consumers who used the apps of these brands. After discussions with three experts from 7-Eleven, Family Mart, and Hi-Life, we learned that the best way to distinguish the main consumer groups of convenience stores was to divide these consumers into groups by age. Taking convenience into consideration, the experts suggested dividing these consumers into a young consumer group and an older consumer group. The young consumer group consisted of consumers 30 years of age or younger. Meanwhile, the older consumer group consisted of consumers 31 years of age or older. The analysis was performed on the basis of these definitions.
The main reference of the questionnaire was the concept of brand attachment proposed by Malär et al. [15] and Thomson et al. [21], which was adjusted to fit the purpose of this study. By interviewing chain convenience store owners, we developed a questionnaire about convenience store brand attachment containing four parts. The first part followed the standard and method of classifying brand attachment attributes, the second part tested the importance of brand attachment attributes, the third part analyzed consumers’ shopping characteristics, and the last part assessed the subjects’ shopping patterns and basic information.
In addition, this FQFD-based research was divided into two steps. The first step consisted of building the hierarchical structure of consumer brand attachment on the basis of a literature review and applying it as the basis of the evaluation of the importance of attachment attributes. We targeted consumers of 7-Eleven, Family Mart, and Hi-Life to complete the questionnaire and obtained the weight sets of all kinds of dimensions and attributes. According to McLean et al. [32], consumers who have frequently used an app for more than 6 months have more awareness of experience with the brand’s app. Therefore, if one meets the conditions listed below, he/she was defined as a consumer expert: (1) the subject “agreed” that he/she was a loyal consumer of a brand, (2) the subject had been using the brand’s app 11 or more times per month for more than 6 months, and (3) the subject had engaged in consumption using the brand’s app. The questionnaire was distributed at stores of the three brands and on the Internet. The number of questionnaires distributed at 7-Eleven stores was 71; 63 were valid, and 8 were invalid. The number of questionnaires distributed at Family Mart stores was 86; 60 were valid, and 26 were invalid. The number of questionnaires distributed at Hi-Life stores was 108; 60 were valid, and 48 were invalid. The organized data are listed in Table 3.
The second step consisted of the literature review; we organized the strategic management plan items used by brands when creating a consumer brand experience, and we used those items as test targets for the questionnaire evaluation tool. This part of the questionnaire was for senior employees and managers who were well acquainted with the operations and app of the brand. Through the questionnaire, we were able to understand the degree of relevance between consumers’ brand attachment attributes and brands’ experience strategic management plan items, as well as the self-performance evaluation of each experience strategic management plan item. In the current study, 13 questionnaires were completed by personnel from 7-Eleven, 13 were completed by personnel from Family Mart, and 12 were completed by personnel from Hi-Life. The profile of the experts, including their educational level, age group, and education, is shown in Table 4.
5. Empirical Study
5.1. Building the Hierarchical Structure of Brand Attachment Attributes and Conducting Importance Evaluation
On the basis of a literature review and consultation plus discussion with experts, we developed the “basic criterion of convenience store brand attachment” and deliberated on all kinds of principles for the evaluating factors, including brand affection, brand passion, the brand-self connection, and brand prominence. Therefore, we established the evaluation criteria of convenience store brand attachment that consumers value the most, which is illustrated in Figure 3.
This study analyzed young and older groups of consumers of three brands of convenience stores (7-Eleven, Family Mart, and Hi-Life) by fuzzy linguistic calculation and performed calculations using a fuzzy pairwise comparison matrix questionnaire completed by the subjects. Subsequently, a fuzzy average formula was used to integrate the views of all subject groups (to calculate the average). This study also obtained the fuzzy average of the consumer brand attachment factors of the young and older consumer groups and established an explicit FLPR matrix of consumer brand attachment factors. In the same way, this study continued to use the same operating procedure used to obtain the consumer brand attachment factors (second level) for calculation, and it conducted an orderly numerical value evaluation of attributes under the consumer brand attachment factors (third level): brand affection, brand passion, brand-self connection, and brand prominence. Finally, using the method of defuzzification, this study built consumer preferences for each brand’s attachment factors and attributes. Hence, the data on 7-Eleven are presented in Table 5 and Table 6. Table 5 indicates the weight value and sequence of brand attachment dimensions, and Table 6 indicates the weight value of consumer brand attachment attributes.
Table 5 shows that brand prominence was the most important for young consumers, followed by brand passion and brand affection. For older consumers, brand-self connection mattered the most, followed by brand affection and brand prominence. Brand–self connection was the factor that involved the greatest difference between the two groups.
Table 6 shows that for young consumers of 7-Eleven, the top three final weightings were brand delight (0.0904), brand friendliness (0.0895), and brand cognition (0.0887). The top three final weightings for older consumers were brand guarantee (0.0910), brand self-identity (0.0886), and brand friendliness (0.0882). The two groups had different preferences for the brand attachment attributes, especially in the attachment degree of the brand assurance function; in this respect, the preference of young consumers was significantly different from that of the older group.
5.2. Consumer’s Cognitive Difference in Brand Attachment Demand Attributes
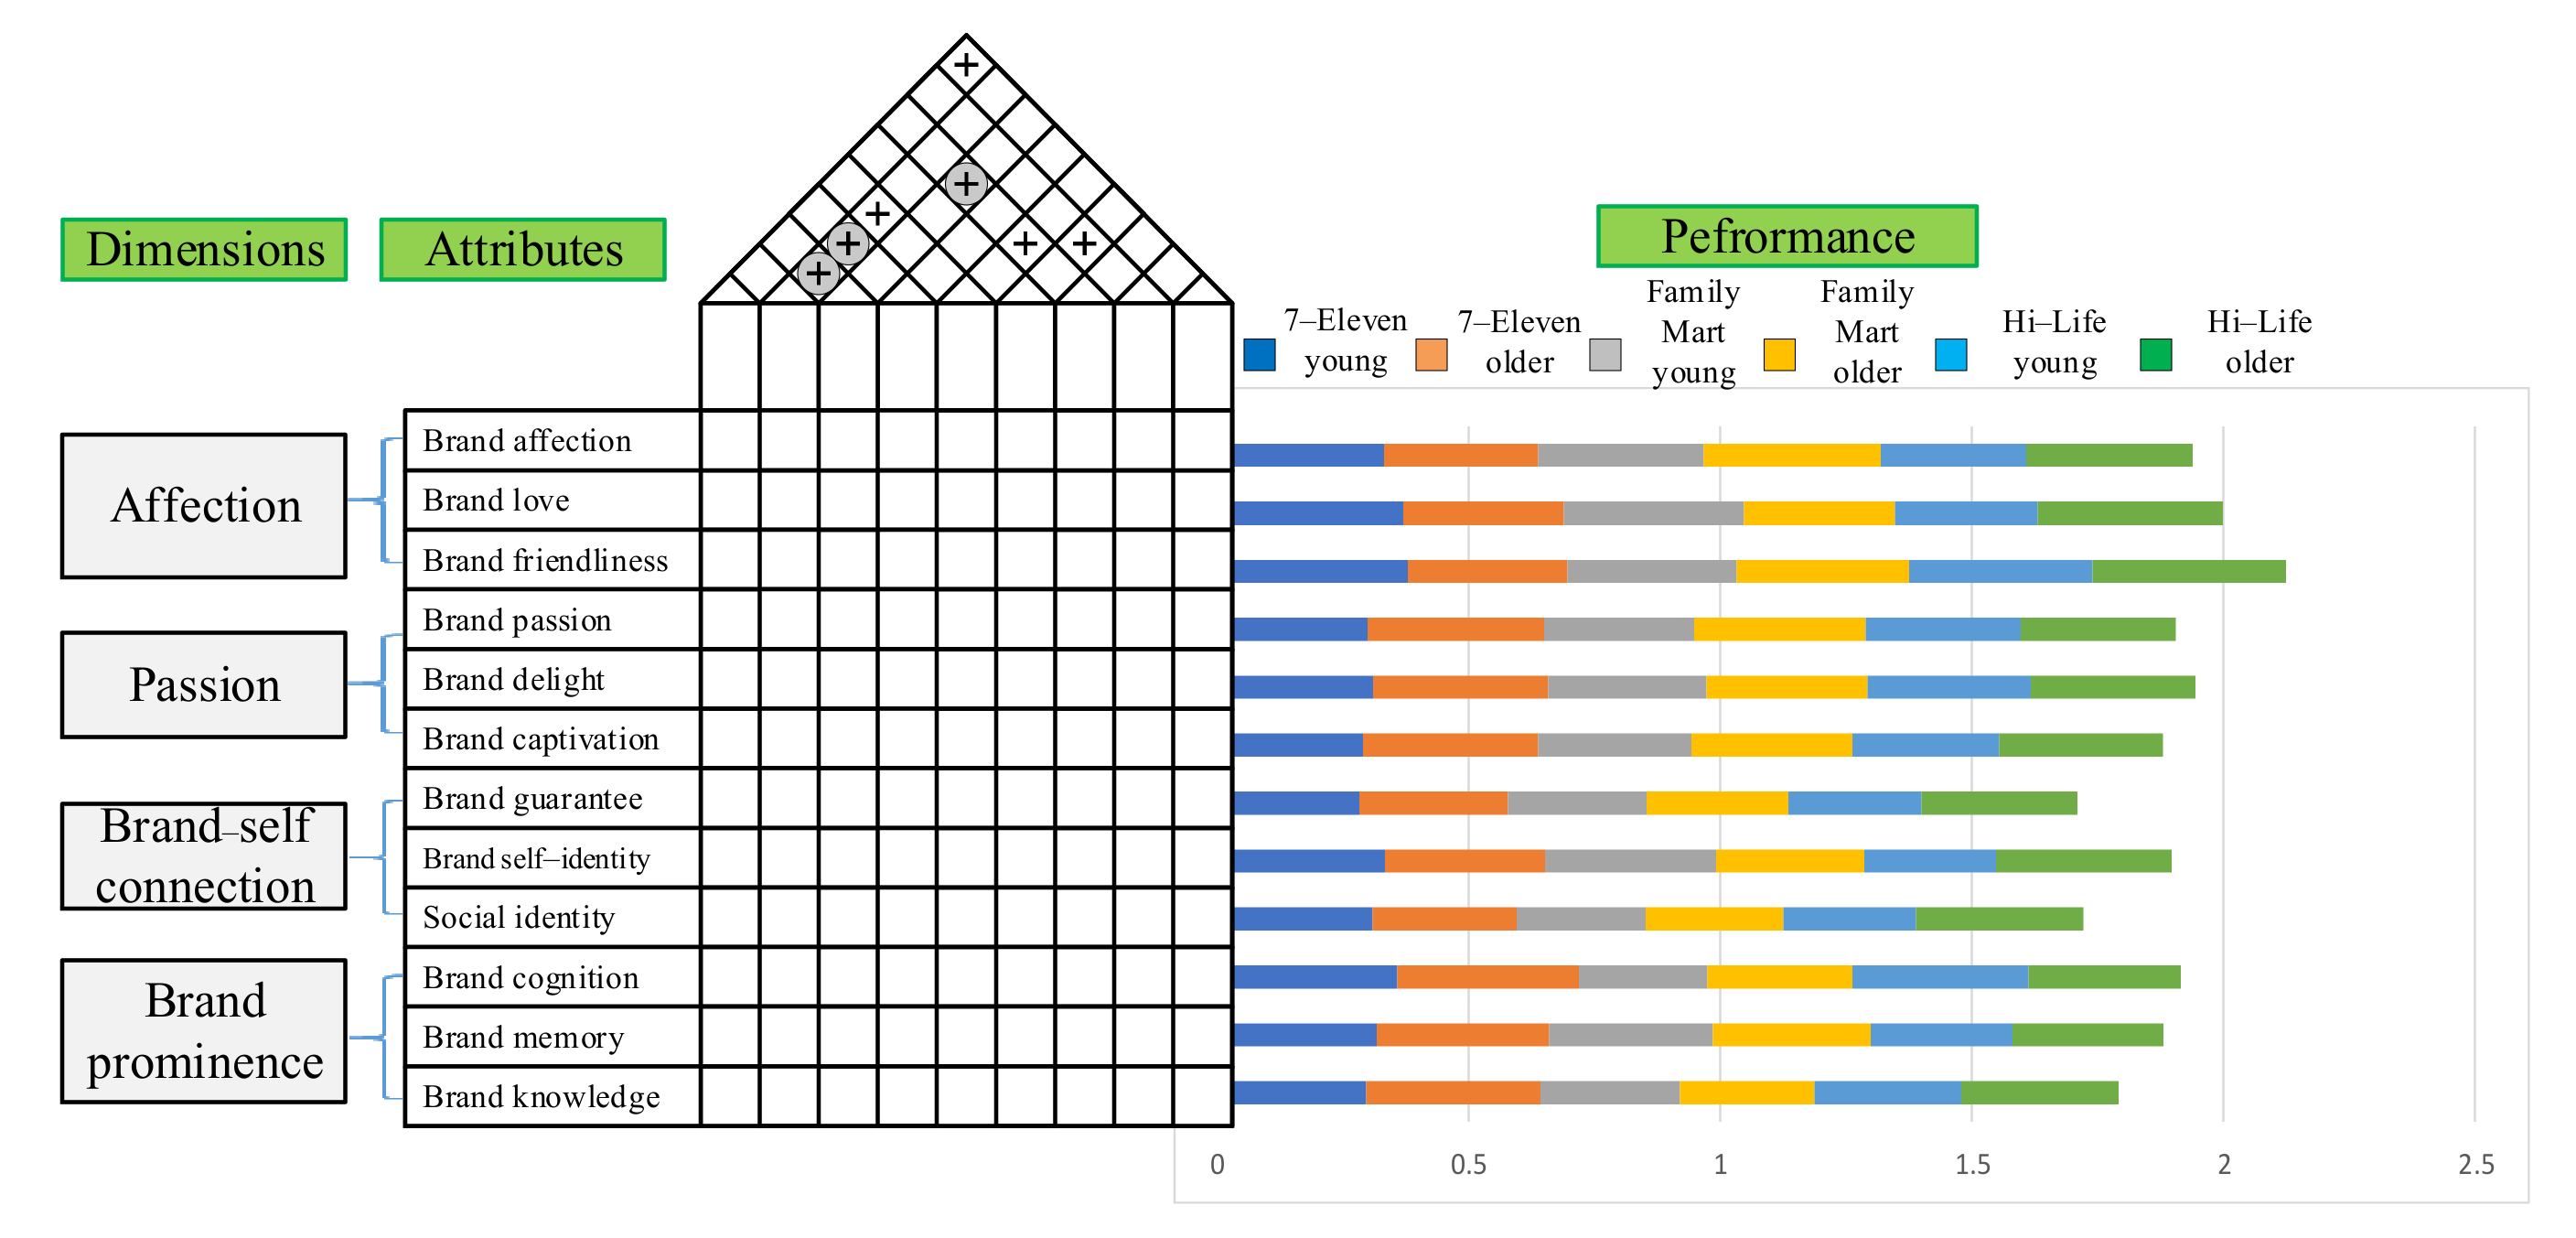
Regarding the three main brands of convenience stores, we also evaluated the brand attachment performance of the young and older consumer groups. In order to understand the current and expected performance and its relative position in the market and identify priorities for further improvement, the young and older consumers were asked to rate the relative performance of some similar commodities and services of the three convenience stores in terms of the 12 attributes of brand attachment. The results of the consumer groups’ assessments and calculations are shown in Table 7, columns 3 and 4. Taking 7-Eleven as an example, the consumers gave their current and expected performance on “brand passion” of 7-Eleven with a triangular fuzzy rating of (4, 5, 6) and (5, 6, 7), which implies that the consumers considered their performances on “brand passion” as ‘‘good” and between ‘‘fair” and ‘‘good”. The fuzzy integrated average formula was used to calculate the performance values of brand attachment and convert them into crisp numbers through defuzzification. We see from the analysis in Table 7 that for young consumers, brand cognition (0.379), brand memory (0.37), and brand friendliness (0.358) had the top 3 performance values. Additionally, brand captivation (1.1), brand passion (1.086), and brand self-identity (1.079) had the top 3 improvement rates. Meanwhile, for older consumers, brand friendliness (0.358), brand social identity (0.351), and brand guarantee (0.348) had the top 3 performance values, and brand knowledge (1.069), brand guarantee (1.061), and brand delight (1.06) had the top 3 improvement rates.
This study compared the performance of brand attachment with the numerical analysis of improvement rates to determine whether brand attachment achieved the expected performance. The data analysis of improvement rates in Table 7 clearly shows that for the young consumer group, 7-Eleven’s current performance almost meets the expected performance. However, for the older consumer group, 7-Eleven’s improvement rates in brand captivation, brand delight, brand cognition, and brand knowledge were all greater than 1.07, and all failed to meet the expected performance. 7-Eleven can work on making improvements in these areas. The HOQ in Figure 4 shows the overall performance of the three convenience stores. The young consumers of Family Mart were familiar with 7-Eleven, and the older consumers of Family Mart were slightly lacking in brand cognition, but the current performance in brand knowledge was far above the expected performance. This is a great advantage that should be carefully maintained. The older consumers of Hi-Life had excellent performance in brand love and brand captivation, but there was a severe lack of brand passion, brand cognition, and brand knowledge. These are the areas that need to be improved.
5.3. Associative Analysis of Brand Attachment and Brand Experience Management Strategy
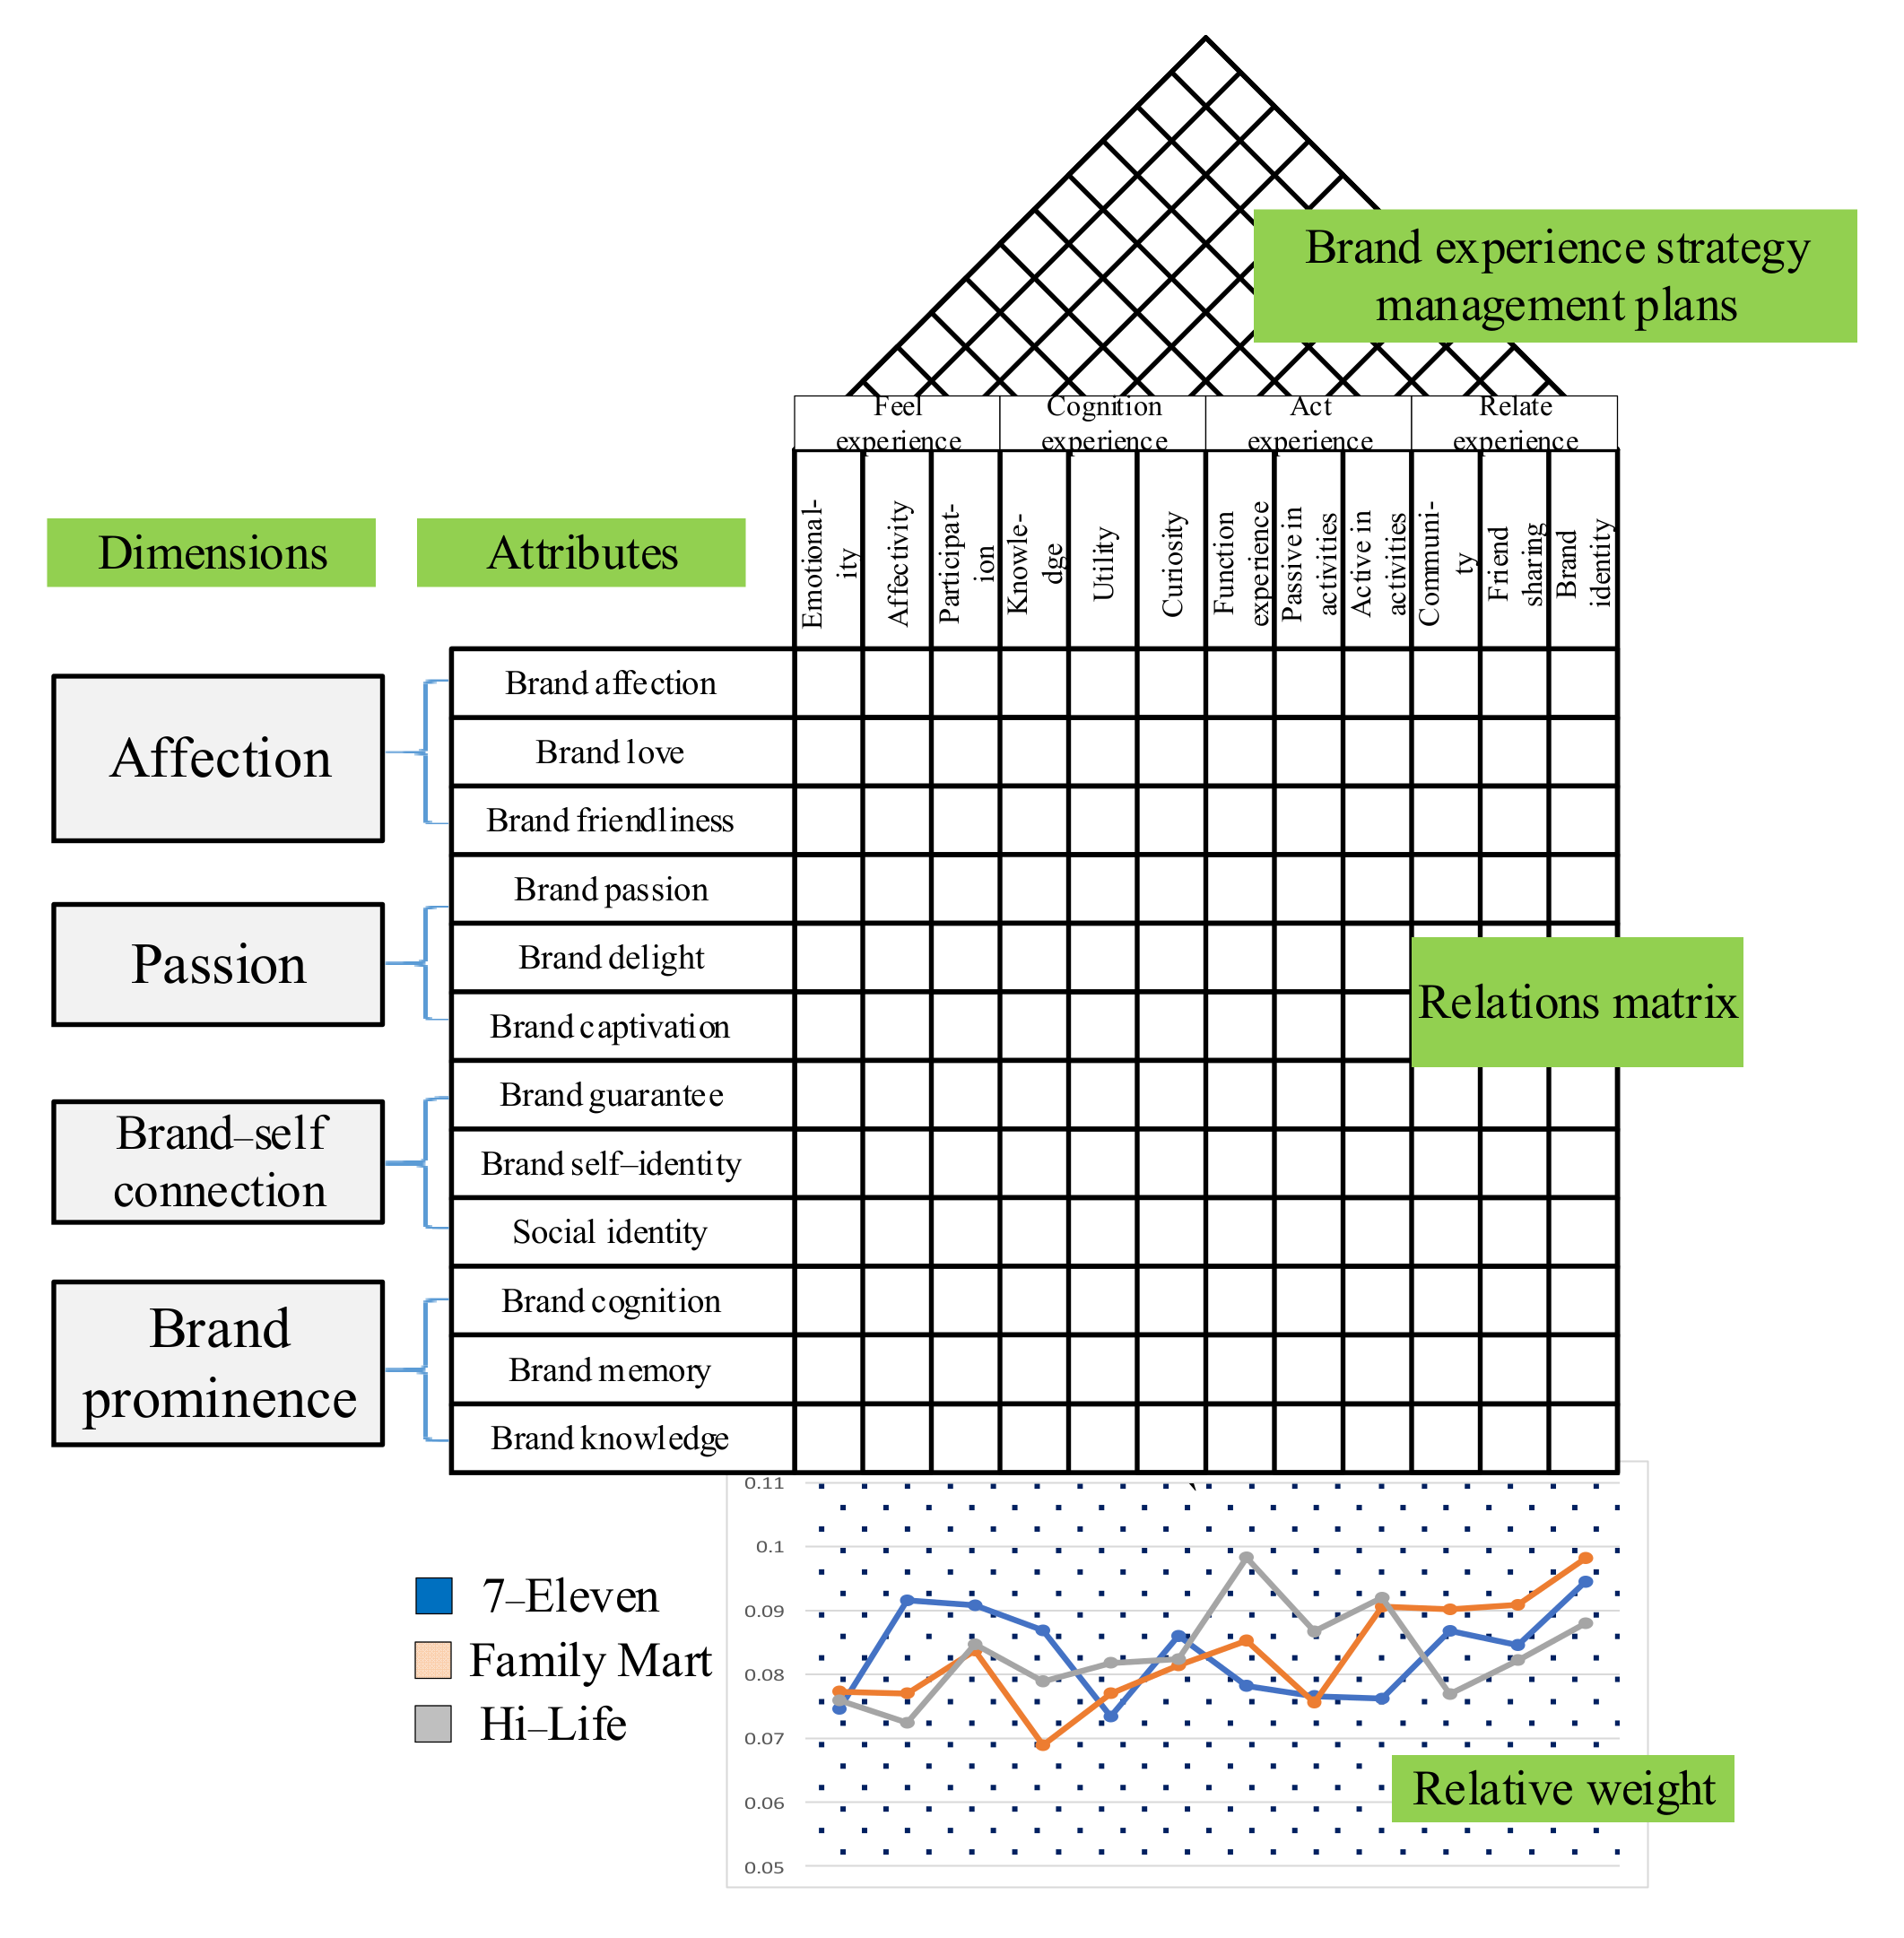
We listed 12 consumer brand attachment attributes (Table 1) and 12 brand experience strategic management plans (Table 2) and asked the brand manager subjects to evaluate the degree of correlation that they have with each other. We also integrated all subjects’ incidence matrices (taking the average) and ultimately obtained the fuzzy incidence matrix of brand attachment attributes and experience strategic management plans. Then, through defuzzification and by multiplying the relevant overall brand attachment attribute weight value, we obtained the correlation value of the attachment attributes and the experience strategic management plans using the brand experience concept. Hence, we present the data on 7-Eleven in Appendix A. The data in the upper left corner are the values after defuzzification, and the data in the bottom right corner are the correlation values of the attachment attributes and experience strategic management plans based on the brand experience concept. Ultimately, we summed the values in the bottom right corner and acquired the initial weight value of the brand experience strategic management plans. Through standardization, we obtained the critical relative weight value of each brand experience strategic management plan.
We compared all analyses of the three main brands of convenience stores mentioned above to understand how consumers connect brand attachment through brand experience and how enterprises maintain their advantage. Enterprises can increase their competitive advantages by comparing the advantages and disadvantages of rival brands, as shown in Figure 5.
Figure 5 shows that 7-Eleven was outstanding in knowledge, affection, and participation. The highest relative weight values of the convenience store brand experience strategy management plans for Family Mart were brand identity, active involvement in activities, community belongingness, and friend sharing. For Hi-Life, the function experience was the most excellent, followed by active involvement in activities and passive involvement in activities.
5.4. Performance Evaluation of the Brand Experience Strategic Management Plan of Each Brand
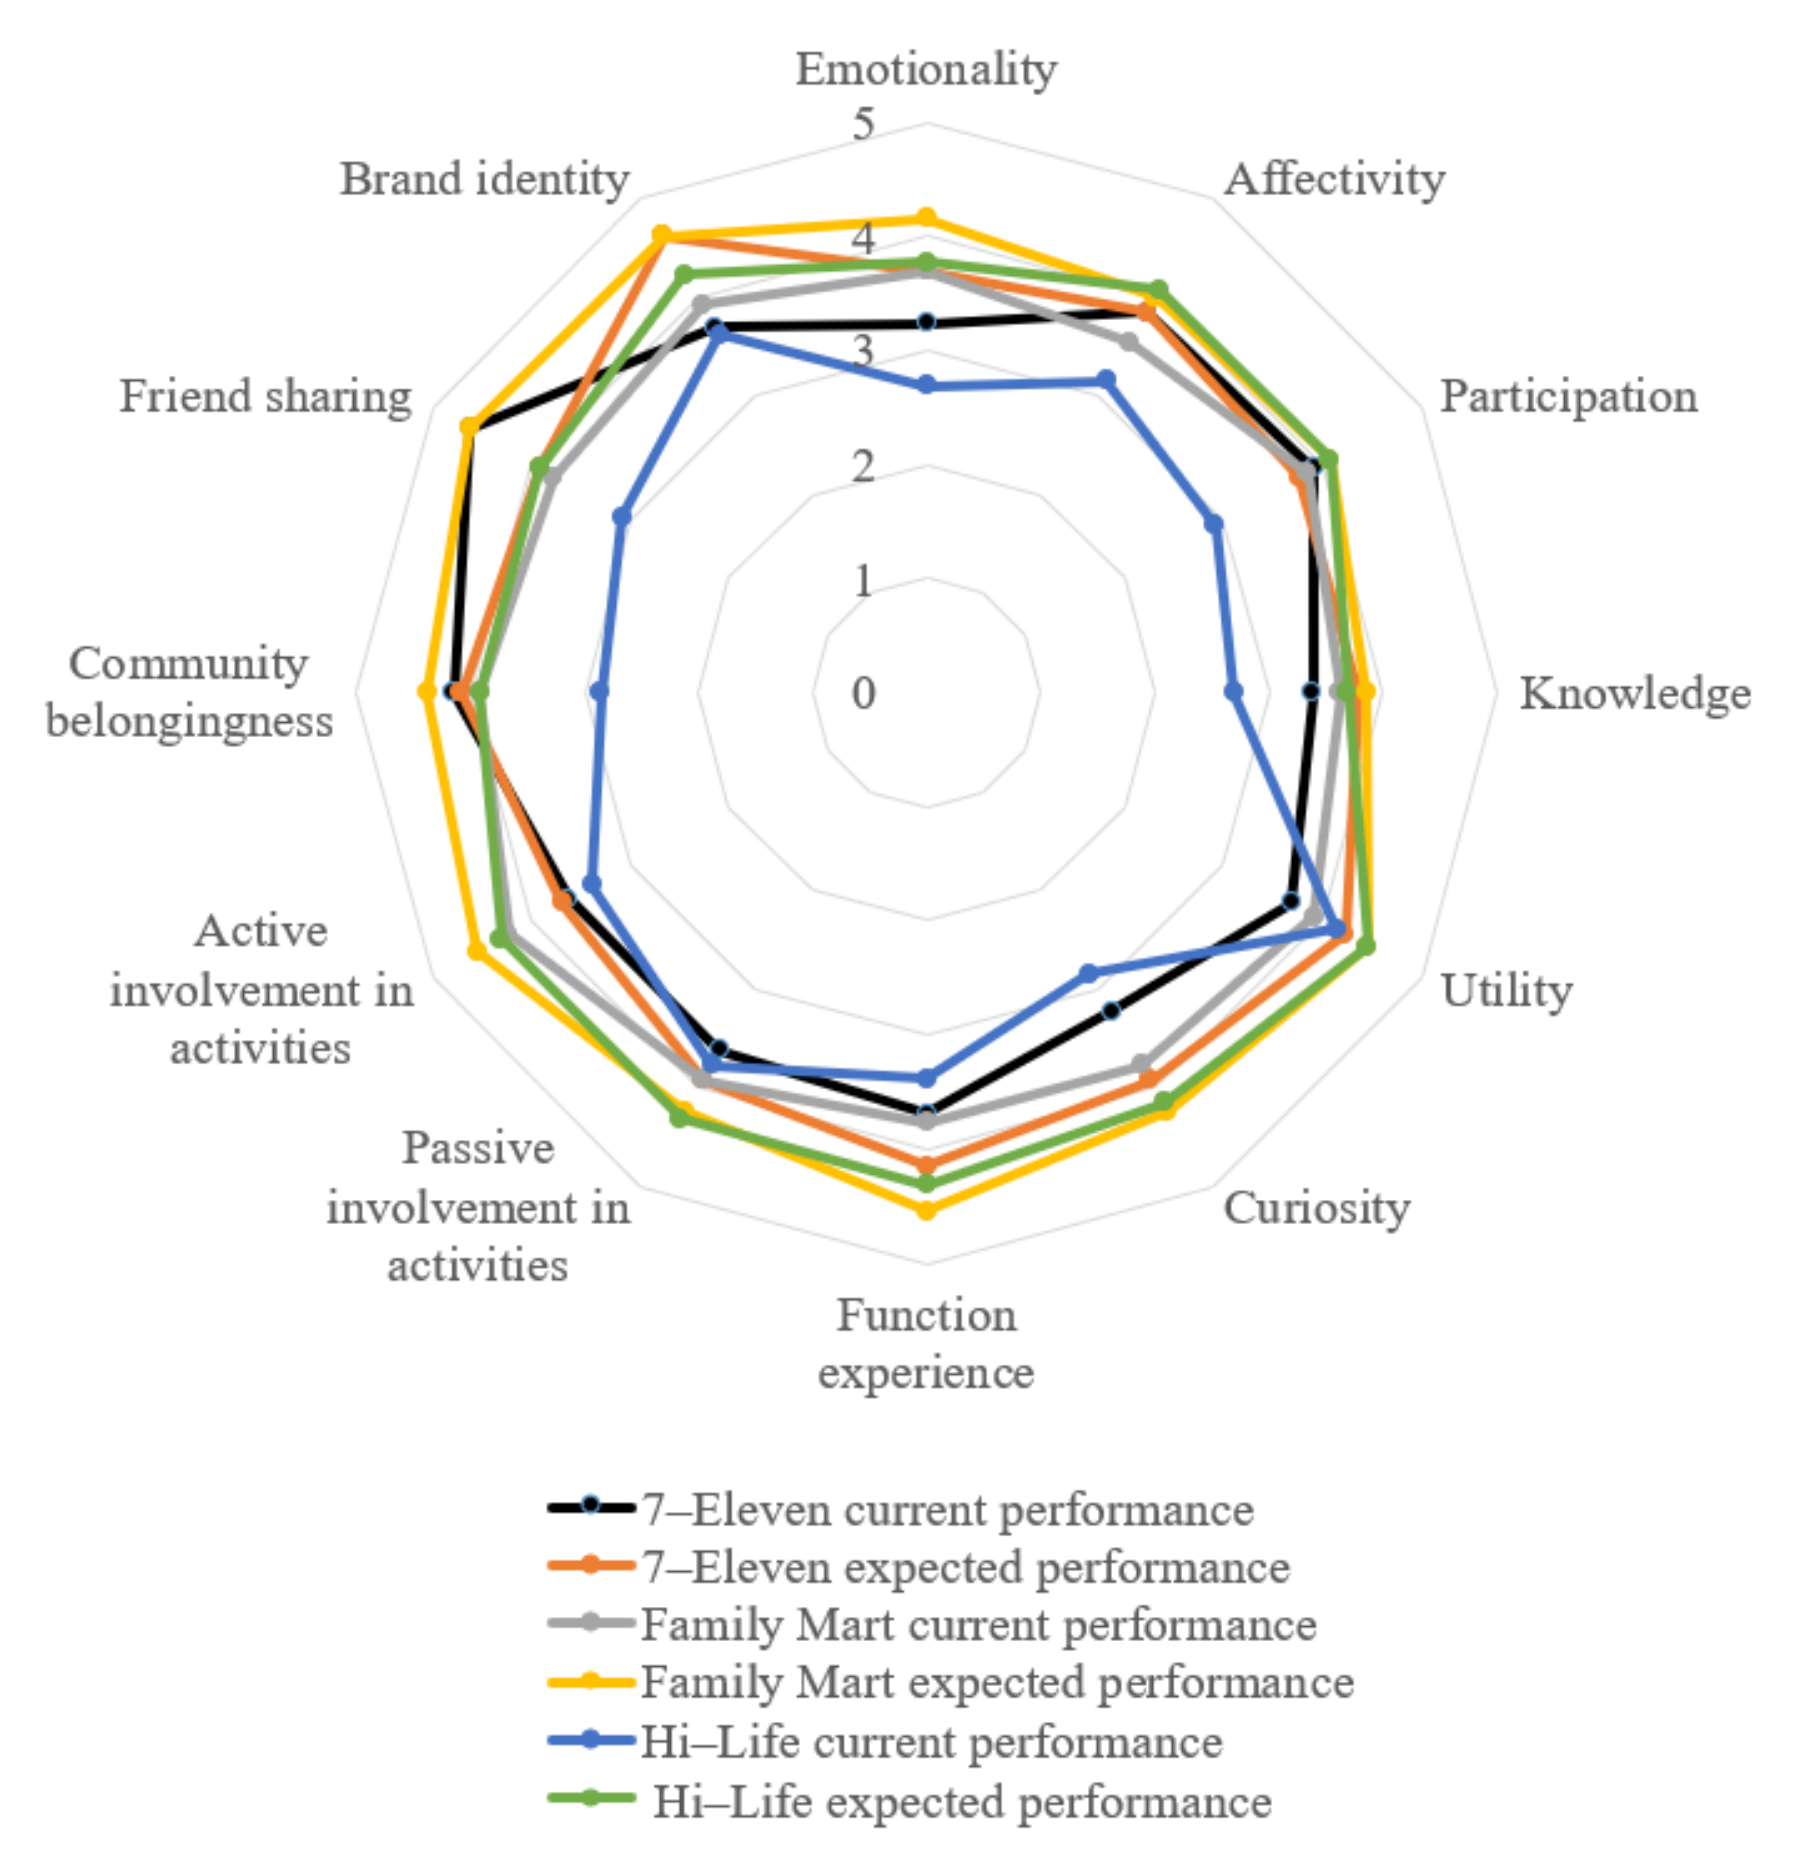
We used scores of 1 to 5 as evaluation scores to measure the cognitive perception of professional managers of the subject convenience stores to understand the differences among the execution, expected performance, and current performance of the brand experience strategic management plans. The higher the evaluation score was, the more highly the subjects rated the performance. Through the specific value calculation of expected performance and current performance, we observed differences in the subjects’ evaluation of overall performance and the improvement rate for all brand experience strategic management plans. Appendix A shows that the best current performance of 7-Eleven was in friend sharing (4.62), the best expected performance was in brand identity (4.62), the best performance was in participation (3.49), and the highest improvement rate was for function experience (1.286). Hence, the performance evaluation of brand experience strategic management plans is illustrated in Figure 6.
Figure 6 shows that the best current performance of 7-Eleven was in friend sharing, followed by participation. The current performance of both already surpasses the original expected performance, which was outstanding. However, with regard to brand identity, function experience, and utility, there is still much room for improvement. For Family Mart, the current performance of participation and active involvement in activities was the closest to the expected performance, but with regard to friend sharing and function experience, there is still much room for improvement. Finally, we clearly observed that for Hi-Life, only utility performed well, and all the other brand experience strategic management plans did not meet expectations, which was very different from 7-Eleven and Family Mart.
5.5. Discussion of Results
This study performed a traditional AHP calculation of brand attachment attribute items to observe different attributes’ order and differences in importance attachment in different evaluation models. We found that the value of brand attachment attributes showed greater variability and fluctuation amplitude in the calculation process of traditional AHP, especially for older consumers. As for consistency fuzzy preference relation analysis, the fluctuation amplitude of both young and older consumers was relatively smooth, which showed the consistency and stabilization of this method. In addition, in the consistency fuzzy preference relation analysis, both young and older consumers had higher attachment levels toward “brand cognition” and “brand memory”; however, in the traditional AHP, higher attachment levels for young consumers were found for “brand memory” and ”brand friendliness”, whereas higher levels were found for “brand friendliness” and “brand affection” for older consumers. Hence, this study found that the priority order of brand attachment attributes had a greater fluctuation amplitude in the traditional AHP.
In addition, this study found that brand experience could be driven by brand attachment to create consumer value, and according to the psychological characteristics of consumer attachment to services or products, it could be considered by business organizations as an important component of brand experience strategic management plans. These results are consistent with Shamim and Butt’s [66] study and Yu and Yuan’s [67] study, which validated differences in the psychological constructs of brand experience strategies on consumer attachment. Following Shamim and Butt’s study, this study further extends the results in the service industry. Furthermore, in line with the findings of Huang et al. [68], they suggested that brand attachment is a mutually reinforcing outcome of the brand experience strategies. On this basis, this study integrated the attributes of brand attachment with brand experience management strategies to develop a framework for the analysis process of FQFD.
Finally, the FQFD analysis of this study revealed that brand attachment has a significant influence on the choice of brand experience strategy management plans, both in the data sets analyzed and in different groups (young and older consumers) [69]. In other words, when consumers experience a brand, it evokes positive and multiple psychological attachments and has a favorable impact on the emotional bond between consumers and the brand [70]. This confirms the findings of Japutra et al.’s [71] exploratory study, which found that young consumers in the UK showed attachment to Fatface Clothing because of their enjoyment of the service experience offered by the retailer. The results of this study are also consistent with Dolbec and Chebat’s [72] findings that young North American consumers develop more attachment to brands that offer an impressive fashion brand experience. This study thus provides a new perspective on brand experience management strategies. In contrast to previous studies that focused on satisfaction, brand equity, or word-of-mouth as influential factors of brand experience, we considered more emotional bonds, i.e., brand attachment. This is the expression of emotion, passion, and connection that is associated with valuable behavioral consequences, such as improving brand cognition and creating favorable consumer reactions [73].
6. Conclusions and Implications
6.1. Conclusions
This study discussed consumers’ degree of brand attachment to different brands of convenience stores and analyzed how business owners use brand experience strategic management plans to meet consumers’ cognitive demands and reactions. We used the FLPR method and the analysis procedure of QFD to properly measure multilinguistic data provided by subjects and avoided consumers’ subjective judgment and uncertainty hidden in linguistic communication in the traditional HOQ evaluation process. We performed analysis through FQFD to determine the relevance between brand attachment and brand experience strategic management plans and discover useful coping strategies for convenience store brand owners. By using useful brand experience strategies, convenience store brand owners can cause consumers to have stronger brand attachment, which they can convert into a competitiveness advantage to boost their own brands.
The theoretical implications and the linkage with previous studies are as follows. First, this study extended previous research findings on measuring and building brand attachment frameworks and importance assessments [74,75]. Second, this study supported the theoretical concept from quantitative empirical findings that the importance of brand attachment should be integrated into the interaction between consumers’ requirements and brand values, which could be embedded in the content of the brand experience [2]. Last but not least, this study also found explicit theoretical evidence for the relevance and importance of brand attachment in the development of brand experience management strategies in the literature [76,77,78].
The conclusions are listed below:
- (1)
- Understanding the cognitive demands and perceptions associated with consumers’ brand attachment: The results showed that young consumers of 7-Eleven had a stronger perception of brand prominence. Brand prominence is the degree of perception of brand affection and memory in consumers’ minds, reflecting the significance of the connection between consumers’ brand affection and self-recognition. This finding also showed that 7-Eleven had good results in developing young consumers and causing them to be attached to the brand, making it possible for consumers to maintain long-term loyalty to the brand. Regarding young consumers of Family Mart and Hi-Life, both consumer groups had stronger reactions to the brand-self connection, which means that the level at which these consumers integrate these brands into their self-concept is higher. Compared with 7-Eleven, this could be an advantage for Family Mart and Hi-Life. Combining the analyses of the young and older consumer groups, we noted that although the consumers of the three brands valued the factors of brand attachment differently, most of them still thought highly of brand prominence and the brand–self connection. This finding means that if retailing enterprises can connect with consumers through the brand-self connection and integrate the brand-self connection into their perception, affection, and self-concept, they will flourish because these elements are crucial.
- (2)
- Analyzing the differences in brand attachment between different consumer groups: The results showed that for the young consumer group, 7-Eleven had the best performance in brand cognition and brand memory; for the older consumer group, it had the best performance in brand friendliness and brand social identity. However, the young consumer group believed that the performance in brand attachment was not good enough and that some improvements needed to be made. Meanwhile, the older consumer group thought that brand knowledge and brand guarantee needed to be respected and that they play important roles in linking with consumers. For Family Mart, the young consumer group maintained that the aspect that needed to be improved was brand self-identity, whereas for the older consumer group, brand guarantee was the aspect that needed to be improved. Young consumers of Hi-Life had a strong perception of brand cognition, but brand friendliness and brand passion were lacking. By contrast, the older consumer group had a strong perception of brand love and brand memory, but brand cognition was lacking. Using the results of this study, enterprises can direct marketing strategies to different consumer groups to achieve the best brand attachment.
- (3)
- Comparing the brand experience strategic management plans of different brands: Among all experience strategic plans of the three different brands, 7-Eleven had great advantages in brand identity, function experience, and utility. Although 7-Eleven is the leading convenience store enterprise in Taiwan, there are still strong competitors. In the future, 7-Eleven can enhance the experience strategic plans mentioned above to effectively arouse brand attachment and consumers’ shopping desire. Moreover, the participation and friend sharing of 7-Eleven showed strong performance and should be maintained. Family Mart performed well in active involvement in activities, passive involvement in activities, and knowledge, but other aspects, such as brand identity and friend sharing, were behind those of 7-Eleven. The performance in function experience was plain, but it had higher relevance to consumers’ attachment attribute, which means that function experience is the experience strategic item that Family Mart should enhance and invest in. Hi-Life’s performance in utility was better than that of 7-Eleven and Family Mart, and it is a great advantage and should be maintained. Function experience was also highly relevant to consumers’ attachment attributes, as with Family Mart, and Hi-Life should invest in it. Except for utility and function experience, all the other brand experience strategic management plans of Hi-Life were suboptimal. It must dedicate resources and improve its brand experience to compete with 7-Eleven and Family Mart.
6.2. Implications for Practice
In regard to the discussion of the research findings above, this study makes the following recommendations for the three convenience stores to implement brand experience strategy management programs.
- (1)
- Suggestions for 7-Eleven to enhance its brand experience strategy: 7-Eleven’s important factors of brand attachment are brand friendliness, brand social identity, and brand delight, and the most relevant strategic management plans are affection, knowledge, and brand identity. Therefore, the suggestions are as follows: (a) design interesting games to stimulate consumers’ feeling experience and form friendly relationships with them; (b) provide informative articles and messages through apps to make consumers think, identify, and feel pleasant in the hope that they can understand more about the brand and become part of it.
- (2)
- Suggestions for Family Mart to enhance its brand experience strategy: Family Mart’s important factors of brand attachment are brand social identity, brand knowledge, and brand self-identity, and the most relevant strategic management plans are brand identity, friend sharing, and function experience. Therefore, the suggestions are as follows: (a) Promote campaigns to encourage consumers to actively share brand messages (such as sharing messages to qualify for a lucky draw). Through friend sharing to promote the brand, more people can have a deeper understanding of the brand. (b) Provide versatile and convenient apps (such as a take-out-later service, a mobile wallet, and online shopping). Consumers will identify more with the brand when they become used to the convenient app and even make associations with the brand when they see those functions.
- (3)
- Suggestions for Hi-Life to enhance its brand experience strategy: Hi-Life’s important factors of brand attachment are brand guarantee, brand cognition, and brand self-identity, and the most relevant strategic management plans are function experience and community belongingness. Therefore, the suggestions are as follows: (a) Provide a convenient app to attract consumers and let them identify with the brand’s promise and commitment. Although Hi-Life performs well in function experience, trending and special campaigns are still lacking. We suggest that Hi-Life should discover what kinds of campaigns attract consumers the most and “find excuses” to attract consumers to enter stores and shop. (b) Interact with consumers on brand social media to arouse their belongingness and identification with the brand. Through the connection of the subscription economy and product presales, consumers will have the feeling that they can obtain discounts when shopping and pick them up when they have needs. This could allow them to realize the concept that businesses give priority to consumers’ demands through subscription.
6.3. Limitations and Future Research
Brand attachment is a subjective concept of the consumer. In the highly competitive market, the impression consumers hold for brand attachment is constantly changing. In addition, convenience stores are highly dense and have different styles and characteristics according to different neighborhoods. Under the influence of the external environment, the brand positioning of convenience stores and attachment links of consumers can easily be altered, which makes the classification and weight of the original attachment element change accordingly. For future research, researchers can duly retest the brand attachment dimension element and check whether the brand experience strategic management plan is suitable or not to make sure that the brand experience strengthening strategy is effective during the execution process.
In addition, because the subject experts of this study were brand professional managers who were mostly in charge of southern Taiwan, they probably cannot fully understand the market environment of different areas. We can broaden the range of subjects for further studies to add to the completeness of the study. Finally, in the area of brand experience strategic management plans, we lack a rolling discussion with experts and scholars. For further research, researchers can use the Fuzzy Delphi Method to acquire the brand attachment consensus dimension factor identified by experts, screen common attachment attribute factors, and revise the content of the brand experience strategic management plan. By carrying out the steps above, we can make the management plans closer to the real market.
Author Contributions
Conceptualization, T.-H.H. and L.-Z.L.; methodology, L.-Z.L.; software, L.-Z.L.; validation, L.-Z.L.; formal analysis, L.-Z.L.; investigation, T.-H.H.; resources, T.-H.H.; data curation, T.-H.H.; writing—original draft preparation, T.-H.H. and L.-Z.L.; writing—review and editing, T.-H.H. and L.-Z.L.; visualization, L.-Z.L.; supervision, T.-H.H.; project administration, T.-H.H.; funding acquisition, L.-Z.L. All authors have read and agreed to the published version of the manuscript.
Funding
This research received no external funding.
Institutional Review Board Statement
Not applicable.
Informed Consent Statement
Not applicable.
Conflicts of Interest
The authors declare no conflict of interest. The funders had no role in the design of the study; in the collection, analyses, or interpretation of data; in the writing of the manuscript; or in the decision to publish the results.
Appendix A

Table A1.
7-Eleven’s incidence matrix of whole consumer group brand attachment and brand experience strategic management plans.
Table A1.
7-Eleven’s incidence matrix of whole consumer group brand attachment and brand experience strategic management plans.
| Strategic Management Plan of Brand Experience | ||||||||||||||||||||||||||
|---|---|---|---|---|---|---|---|---|---|---|---|---|---|---|---|---|---|---|---|---|---|---|---|---|---|---|
| Feel Experience | Cognition Experience | Act Experience | Relate Experience | |||||||||||||||||||||||
| Emotionality | Affectivity | Participation | Knowledge | Utility | Curiosity | Function Experience | Passive Involvement in Activities | Active Involvement in Activities | Community Belongingness | Friend Sharing | Brand Identity | |||||||||||||||
| Brand Attachment | Affection | Brand affection | 4.23 | 6.00 | 5.62 | 4.15 | 4.38 | 5.23 | 4.77 | 4.15 | 4.15 | 5.69 | 5.54 | 6.69 | ||||||||||||
| 0.34 | 0.49 | 0.45 | 0.34 | 0.36 | 0.42 | 0.39 | 0.34 | 0.34 | 0.46 | 0.45 | 0.54 | |||||||||||||||
| Brand love | 4.54 | 5.92 | 5.15 | 5.69 | 4.54 | 5.15 | 4.92 | 4.00 | 4.31 | 5.69 | 4.92 | 5.92 | ||||||||||||||
| 0.38 | 0.50 | 0.43 | 0.48 | 0.38 | 0.43 | 0.41 | 0.34 | 0.36 | 0.48 | 0.41 | 0.50 | |||||||||||||||
| Brand friendliness | 4.85 | 6.08 | 5.62 | 5.38 | 4.38 | 5.54 | 4.92 | 4.46 | 5.08 | 4.92 | 5.38 | 5.69 | ||||||||||||||
| 0.43 | 0.54 | 0.50 | 0.48 | 0.39 | 0.49 | 0.44 | 0.40 | 0.45 | 0.44 | 0.48 | 0.51 | |||||||||||||||
| Passion | Brand passion | 4.54 | 4.92 | 5.77 | 3.92 | 4.77 | 5.08 | 4.62 | 3.69 | 4.77 | 5.54 | 5.08 | 5.85 | |||||||||||||
| 0.35 | 0.38 | 0.45 | 0.31 | 0.37 | 0.40 | 0.36 | 0.29 | 0.37 | 0.43 | 0.40 | 0.46 | |||||||||||||||
| Brand delight | 4.54 | 5.85 | 5.62 | 5.85 | 4.08 | 5.69 | 4.77 | 5.85 | 4.77 | 5.69 | 5.54 | 6.00 | ||||||||||||||
| 0.39 | 0.51 | 0.49 | 0.51 | 0.35 | 0.49 | 0.41 | 0.51 | 0.41 | 0.49 | 0.48 | 0.52 | |||||||||||||||
| Brand captivation | 4.62 | 5.69 | 5.62 | 5.85 | 4.00 | 5.23 | 4.77 | 5.54 | 5.38 | 4.77 | 5.85 | 4.77 | ||||||||||||||
| 0.37 | 0.45 | 0.45 | 0.47 | 0.32 | 0.42 | 0.38 | 0.44 | 0.43 | 0.38 | 0.47 | 0.38 | |||||||||||||||
| Brand-self connection | Brand guarantee | 5.08 | 5.62 | 5.92 | 6.54 | 5.00 | 5.08 | 5.85 | 5.54 | 5.08 | 5.69 | 5.38 | 6.15 | |||||||||||||
| 0.42 | 0.46 | 0.49 | 0.54 | 0.41 | 0.42 | 0.48 | 0.46 | 0.42 | 0.47 | 0.44 | 0.51 | |||||||||||||||
| Brand self-identity | 4.85 | 5.85 | 5.92 | 6.23 | 4.69 | 5.85 | 4.92 | 4.77 | 5.08 | 6.00 | 6.00 | 6.15 | ||||||||||||||
| 0.40 | 0.48 | 0.49 | 0.51 | 0.39 | 0.48 | 0.40 | 0.39 | 0.42 | 0.49 | 0.49 | 0.51 | |||||||||||||||
| Brand social identity | 4.54 | 4.92 | 6.23 | 6.38 | 5.85 | 5.23 | 4.62 | 4.77 | 4.31 | 5.08 | 4.46 | 6.00 | ||||||||||||||
| 0.38 | 0.41 | 0.52 | 0.54 | 0.49 | 0.44 | 0.39 | 0.40 | 0.36 | 0.43 | 0.38 | 0.51 | |||||||||||||||
| Brand Attachment | Brand prominence | Brand cognition | 4.69 | 6.38 | 5.92 | 4.85 | 4.77 | 5.38 | 4.77 | 5.54 | 4.92 | 4.77 | 5.54 | 6.00 | ||||||||||||
| 0.41 | 0.56 | 0.52 | 0.42 | 0.41 | 0.47 | 0.41 | 0.48 | 0.43 | 0.41 | 0.48 | 0.52 | |||||||||||||||
| Brand memory | 4.69 | 5.54 | 5.46 | 5.00 | 4.38 | 5.38 | 4.92 | 4.54 | 4.46 | 5.69 | 4.31 | 5.69 | ||||||||||||||
| 0.39 | 0.46 | 0.46 | 0.42 | 0.37 | 0.45 | 0.41 | 0.38 | 0.37 | 0.48 | 0.36 | 0.48 | |||||||||||||||
| Brand knowledge | 4.69 | 5.77 | 5.15 | 5.15 | 4.15 | 5.54 | 4.77 | 4.46 | 4.77 | 5.54 | 5.38 | 5.85 | ||||||||||||||
| 0.39 | 0.48 | 0.43 | 0.43 | 0.34 | 0.46 | 0.40 | 0.37 | 0.40 | 0.46 | 0.45 | 0.49 | |||||||||||||||
| Evaluations | Current performance | 3.23 | 3.85 | 3.92 | 3.38 | 3.69 | 3.23 | 3.69 | 3.62 | 3.62 | 4.15 | 4.62 | 3.69 | |||||||||||||
| Expected performance | 3.69 | 3.85 | 3.77 | 3.77 | 4.23 | 3.92 | 4.15 | 3.92 | 3.69 | 4.08 | 3.92 | 4.62 | ||||||||||||||
| Improvement rate | 1.143 | 1 | 0.961 | 1.115 | 1.146 | 1.063 | 1.125 | 1.083 | 1.019 | 0.983 | 0.848 | 1.252 | ||||||||||||||
| Initial weights | 4.66 | 5.72 | 5.67 | 5.43 | 4.59 | 5.37 | 4.89 | 4.79 | 4.76 | 5.42 | 5.28 | 5.9 | ||||||||||||||
| Relative weights | 0.0746 | 0.0916 | 0.0908 | 0.0869 | 0.0734 | 0.086 | 0.0782 | 0.0766 | 0.0762 | 0.0868 | 0.0846 | 0.0945 | ||||||||||||||
| Performance value | 0.254 | 0.315 | 0.349 | 0.248 | 0.342 | 0.293 | 0.284 | 0.322 | 0.304 | 0.32 | 0.333 | 0.375 | ||||||||||||||
References
- Chattopadhyay, A.; Laborie, J.L. Managing brand experience: The market contact audit. J. Advert. Res. 2005, 45, 9–16. [Google Scholar] [CrossRef]
- Brakus, J.J.; Schmitt, B.H.; Zarantonello, L. Brand experience: What is it? How is it measured? Does it affect loyalty? J. Mark. 2009, 73, 52–68. [Google Scholar] [CrossRef]
- Kamboj, S.; Sarmah, B.; Gupta, S.; Dwivedi, Y. Examining branding co-creation in brand communities on social media: Applying the paradigm of Stimulus-Organism-Response. Int. J. Inf. Manag. 2018, 39, 169–185. [Google Scholar] [CrossRef] [Green Version]
- Kang, J.; Manthiou, A.; Sumarjan, N.; Tang, L. An investigation of brand experience on brand attachment, knowledge, and trust in the lodging industry. Int. J. Hosp. Manag. 2017, 26, 1–22. [Google Scholar] [CrossRef]
- Li, C.Y.; Fang, Y.H. Predicting continuance intention toward mobile branded apps through satisfaction and attachment. Telemat. Inform. 2019, 43, 201–248. [Google Scholar] [CrossRef]
- Holt, D.B. Why do brands cause trouble? A dialectical theory of consumer culture and branding. J. Consum. Res. 2002, 29, 70–90. [Google Scholar] [CrossRef] [Green Version]
- Fournier, S. Consumers and their brands: Developing relationship theory in consumer research. J. Consum. Res. 1998, 24, 343–373. [Google Scholar] [CrossRef]
- Lim, X.J.; Cheah, J.H.; Cham, T.H.; Ting, H.; Memon, M.A. Compulsive buying of branded apparel, its antecedents, and the mediating role of brand attachment. Asia. Pacific. J. Mark. Logist. 2020, 32, 1539–1563. [Google Scholar] [CrossRef]
- Swaminathan, V.; Stilley, K.M.; Ahuluwalia, R. When brand personality matters: The moderating role of attachment styles. J. Consum. Res. 2009, 35, 985–1002. [Google Scholar] [CrossRef] [Green Version]
- Escalas, J.E.; Bettman, J.R. Self-construal, reference groups, and brand meaning. J. Consum. Res. 2005, 32, 378–389. [Google Scholar] [CrossRef]
- Das, G.; Agarwal, J.; Malhotra, N.K.; Varshneya, G. Does brand experience translate into brand commitment? A mediated-moderation model of brand passion and perceived brand ethicality. J. Bus. Res. 2019, 95, 479–490. [Google Scholar] [CrossRef]
- Tafesse, W. Conceptualization of brand experience in an event marketing context. J. Promot. Manag. 2016, 22, 34–48. [Google Scholar] [CrossRef]
- Schmitt, B. The consumer psychology of brands. J. Consum. Psychol. 2012, 22, 7–17. [Google Scholar] [CrossRef]
- Japutra, A.; Ekinci, Y.; Simkin, L. Positive and negative behaviours resulting from brand attachment. Eur. J. Mark. 2018, 52, 1185–1202. [Google Scholar] [CrossRef] [Green Version]
- Malär, L.; Krohmer, H.; Hoyer, W.D.; Nyffenegger, B. Emotional brand attachment and brand personality: The relative importance of the actual and the ideal self. J. Mark. 2011, 75, 35–52. [Google Scholar] [CrossRef]
- Bian, X.; Haque, S. Counterfeit versus original patronage: Do emotional brand attachment, brand involvement, and past experience matter? J. Brand. Manag. 2020, 27, 438–451. [Google Scholar] [CrossRef] [Green Version]
- Carroll, B.A.; Ahuvia, A.C. Some antecedents and outcomes of brand love. Mark. Lett. 2006, 17, 79–89. [Google Scholar] [CrossRef]
- Mishra, A.S.; Roy, S.; Bailey, A.A. Exploring brand personality-celebrity endorser personality congruence in celebrity endorsements in the Indian context. Psychol. Mark. 2015, 32, 1158–1174. [Google Scholar] [CrossRef]
- Park, C.W.; MacInnis, D.J.; Priester, J.; Eisingerich, A.B.; Iacobucci, D. Brand attachment and brand attitude strength: Conceptual and empirical differentiation of two critical brand equity drivers. J. Mark. 2010, 74, 1–17. [Google Scholar] [CrossRef] [Green Version]
- Hung, H.Y.; Lu, H.T. The rosy side and the blue side of emotional brand attachment. J. Consum. Behav. 2018, 17, 302–312. [Google Scholar] [CrossRef]
- Thomson, M.; MacInnis, D.J.; Park, C.W. The ties that bind: Measuring the strength of consumers’ emotional attachments to brands. J. Consum. Psychol. 2005, 15, 77–91. [Google Scholar] [CrossRef]
- Rio, A.B.; Vazquez, R.; Iglesias, V. The effects of brand associations on consumer response. J. Consum. Mark. 2001, 18, 410–425. [Google Scholar]
- Aaker, D.A. Measuring brand equity across products and markets. Calif. Manag. Rev. 1996, 38, 102–120. [Google Scholar] [CrossRef]
- Xu, X.; Xue, K.; Wang, L.; Gursoy, D.; Song, Z. Effects of customer-to-customer social interactions in virtual travel communities on brand attachment: The mediating role of social well-being. Tour. Manag. Perspect. 2021, 38, 100790. [Google Scholar] [CrossRef]
- Ko, E.; Phau, I.; Aiello, G. Luxury brand strategies and customer experiences: Contributions to theory and practice. J. Bus. Res. 2016, 69, 5749–5752. [Google Scholar] [CrossRef]
- Kumar, A.; Paul, J. Mass prestige value and competition between American versus Asian laptop brands in an emerging market—Theory and evidence. Int. Bus. Rev. 2018, 27, 969–981. [Google Scholar] [CrossRef]
- Barnes, S.J.; Mattsson, J.; Sorensen, F. Destination brand experience and visitor behavior: Testing a scale in tourism context. Ann. Tour. Res. 2014, 48, 121–139. [Google Scholar] [CrossRef]
- Bleier, A.; Harmeling, C.M.; Palmatier, R.W. Creating effective online customer experiences. J. Mark. 2019, 83, 98–119. [Google Scholar] [CrossRef]
- Chen, H.; Papazafeiropoulou, A.; Chen, T.K.; Duan, Y.; Liu, H.W. Exploring the commercial value of social networks: Enhancing consumers’ brand experience through Facebook pages. J. Ent. Inform. Manag. 2014, 27, 576–598. [Google Scholar] [CrossRef] [Green Version]
- Dwivedi, A.; Nayeem, T.; Murshed, F. Brand experience and consumers’ willingness-to-pay (WTP) a price premium: Mediating role of brand credibility and perceived uniqueness. J. Retail. Consum. Serv. 2018, 44, 100–107. [Google Scholar] [CrossRef]
- Jimenez-Barreto, J.; Sthapit, E.; Rubio, N.; Campo, S. Exploring the dimensions of online destination brand experience: Spanish and north American tourists’ perspectives. Tour. Manag. Perspect. 2019, 31, 348–360. [Google Scholar] [CrossRef]
- McLean, G.; Al-Nabhani, K.; Wilson, A. Developing a mobile applications customer experience model (MACE)-implications for retailers. J. Bus. Res. 2018, 85, 325–336. [Google Scholar] [CrossRef] [Green Version]
- Molinillo, S.; Navarro-García, A.; Anaya-Sánchez, R.; Japutra, A. The impact of affective and cognitive app experiences on loyalty towards retailers. J. Retail. Consum. Serv. 2020, 10, 19–48. [Google Scholar] [CrossRef]
- Schmitt, B. The concept of brand experience. J. Brand. Manag. 2009, 16, 417–419. [Google Scholar] [CrossRef] [Green Version]
- Maehle, N.; Otnes, C.; Supphellen, M. Consumers’ perceptions of the dimensions of brand personality. J. Consum. Behav. 2009, 10, 290–303. [Google Scholar] [CrossRef]
- Lam, S.K.; Ahearne, M.; Schillewaert, N. A multinational examination of the symbolic–instrumental framework of consumer–brand identification. J. Int. Bus. Stud. 2012, 43, 306–331. [Google Scholar] [CrossRef]
- Nysveen, H.; Pedersen, P.E.; Skard, S. Brand experiences in service organizations: Exploring the individual effects of brand experience dimensions. J. Brand. Manag. 2013, 20, 404–423. [Google Scholar] [CrossRef]
- Kim, J.; Yu, E. The holistic brand experience of branded mobile applications affects brand loyalty. Soc. Behav. Pers. 2016, 44, 77–87. [Google Scholar] [CrossRef]
- Beig, F.A.; Khan, M.F. Impact of social media marketing on brand experience: A study of select apparel brands on Facebook. Vision 2018, 22, 264–275. [Google Scholar] [CrossRef]
- Gavilanes, J.M.; Flatten, T.C.; Brettel, M. Content strategies for digital consumer engagement in social networks: Why advertising is an antecedent of engagement. J. Adv. 2018, 47, 4–23. [Google Scholar] [CrossRef]
- Morrison, S.; Crane, F.G. Building the service brand by creating and managing an emotional brand experience. J. Brand. Manag. 2007, 14, 410–421. [Google Scholar] [CrossRef]
- Hwang, J.; Choe, J.Y.; Kim, H.M.; Kim, J.J. Human baristas and robot baristas: How does brand experience affect brand satisfaction, brand attitude, brand attachment, and brand loyalty? Int. J. Hosp. Manag. 2021, 99, 103050. [Google Scholar] [CrossRef]
- Jouzaryan, F.; Dehbini, N.; Shekari, A. The impact of brand personality, brand trust, brand love and brand experience on consumer brand loyalty. Int. J. Life Sci. Res. 2015, 5, 69–76. [Google Scholar]
- Schmitt, B.; Zarantonello, L. Consumer experience and experiential marketing: A critical review. Rev. Mark. Res. 2013, 10, 25–61. [Google Scholar]
- Yasin, M.; Liébana-Cabanillas, F.; Porcu, L.; Kayef, R.N. The role of customer online brand experience in customers’ intention to forward online company-generated content: The case of the Islamic online banking sector in Palestine. J. Retail. Consum. Serv. 2020, 52, 10–19. [Google Scholar] [CrossRef]
- Park, S.H.; Ham, S.; Lee, M.A. How to improve the promotion of Korean beef barbecue, bulgogi, for international customers: An application of quality function deployment. Appetite 2012, 59, 324–332. [Google Scholar] [CrossRef]
- Bossert, J.L. Quality Function Deployment: A Practitioner’s Approach; ASQC Quality Press: Milwaukee, WI, USA, 1991. [Google Scholar]
- Shaojing, C.; Hong-Bin, Y. A systematic fuzzy QFD model and its application to hotel service design 2016. In Proceedings of the 13th international Conference on Service Systems and Service Management (ICSSSM), Kunming, China, 24–26 June 2016; pp. 1–6. [Google Scholar]
- Hsu, T.H.; Tang, J.W. Development of hierarchical structure and analytical model of key factors for mobile app stickiness. J. Innov. Knowl. 2020, 5, 68–79. [Google Scholar] [CrossRef]
- Yuen, K.K.F. A hybrid fuzzy quality function deployment framework using cognitive network process and aggregative grading clustering: An application to cloud software product development. Neurocomputing 2014, 142, 95–106. [Google Scholar] [CrossRef]
- Haber, N.; Fargnoli, M.; Sakao, T. Integrating QFD for product-service systems with the Kano model and fuzzy AHP. Total. Qual. Manag. Bus. Excell. 2020, 31, 929–954. [Google Scholar] [CrossRef]
- Mehtap, D.; Karsak, E.E. A QFD-based fuzzy MCDM approach for supplier selection. Appl. Math. Model. 2013, 37, 5864–5875. [Google Scholar]
- Hsu, T.H.; Tang, J.W. An analytic model for developing strategies of customer relational management. Manag. Rev. 2014, 33, 1–17. [Google Scholar]
- Lam, J.S.L.; Lai, K. Developing environmental sustainability by ANP-QFD approach: The case of shipping operations. J. Clean. Prod. 2015, 105, 275–284. [Google Scholar] [CrossRef]
- Dat, L.Q.; Phuong, T.T.; Kao, H.P.; Chou, S.; Nghia, P.V. A new integrated fuzzy QFD approach for market segments evaluation and selection. Appl. Math. Model. 2015, 39, 3653–3665. [Google Scholar] [CrossRef]
- Lu, C.F.; Lin, L.Z.; Yeh, H.R. A multi-phased FQFD for the design of brand revitalization. Total. Qual. Manag. Bus. Excell. 2019, 30, 848–871. [Google Scholar] [CrossRef]
- Kayapınar, S.; Erginel, N. Designing the airport service with fuzzy QFD based on SERVQUAL integrated with a fuzzy multi-objective decision model. Total. Qual. Manag. Bus. Excell. 2019, 30, 1429–1448. [Google Scholar] [CrossRef]
- Xie, J.; Qin, Q.; Jiang, M. Multiobjective decision-making for technical characteristics selection in a house of quality. Math. Probl. Eng. 2020, 12, 1–12. [Google Scholar] [CrossRef]
- Zaitsev, N.; Dror, S. A corporate social responsibility (CSR) model—A QFD-based approach. Total. Qual. Manag. Bus. Excell. 2020, 31, 137–148. [Google Scholar] [CrossRef]
- Lizarelli, F.L.; Osiro, L.; Ganga, G.M.D.; Mendes, G.H.S.; Paz, G.R. Integration of SERVQUAL, Analytical Kano, and QFD using fuzzy approaches to support improvement decisions in an entrepreneurial education service. Appl. Soft. Comput. 2021, 112, 107786. [Google Scholar] [CrossRef]
- Chen, Y.; Ran, Y.; Huang, G.; Xiao, L.; Zhang, G. A new integrated MCDM approach for improving QFD based on DEMATEL and extended MULTIMOORA under uncertainty environment. Appl. Soft. Comput. 2021, 105, 107222. [Google Scholar] [CrossRef]
- Haiyun, C.; Zhixiong, H.; Yüksel, S.; Dinçer, H. Analysis of the innovation strategies for green supply chain management in the energy industry using the QFD-based hybrid interval valued intuitionistic fuzzy decision approach. Renew. Sust. Energ. Rev. 2021, 143, 110844. [Google Scholar] [CrossRef]
- Wang, T.C.; Chen, Y.H. Applying fuzzy linguistic preference relations to the improvement of consistency of fuzzy AHP. Inf. Sci. 2008, 178, 3755–3765. [Google Scholar] [CrossRef]
- Herrera-Viedma, E.; Herrera, F.; Chiclana, F.; Luque, M. Some issues on consistency of fuzzy preference relations. Eur. J. Oper. Res. 2004, 154, 98–109. [Google Scholar] [CrossRef]
- Opricovic, S.; Tzeng, G.H. Defuzzification within a multicriteria decision model. Int. J. Uncertain. Fuzz. 2003, 11, 635–652. [Google Scholar] [CrossRef]
- Shamim, A.; Butt, M.M. A critical model of brand experience consequences. Asia Pacific J. Mark. Logist. 2013, 25, 102–117. [Google Scholar] [CrossRef]
- Yu, X.; Yuan, C. How consumers’ brand experience in social media can improve brand perception and customer equity. Asia Pacific J. Mark. Logist. 2019, 31, 1233–1251. [Google Scholar] [CrossRef]
- Huang, R.; Lee, S.H.; Kim, H.; Evans, L. The impact of brand experiences on brand resonance in multi-channel fashion retailing. J. Res. Interact. Mark. 2015, 9, 129–147. [Google Scholar] [CrossRef]
- Ramirez, R.H.; Merunka, D. Brand experience effects on brand attachment: The role of brand trust, age, and income. Eur. Bus. Rev. 2019, 31, 610–645. [Google Scholar] [CrossRef]
- Borges, A.P.; Vieira, E.; Lopes, J.M. Emotional Intelligence Profile of Tourists and Its Impact on Tourism. J. Qual. Assur. Hosp. Tour. 2021. [Google Scholar] [CrossRef]
- Japutra, A.; Ekinci, Y.; Simkin, L. Exploring brand attachment, its determinants and outcomes. J. Strateg. Mark. 2014, 22, 616–630. [Google Scholar] [CrossRef]
- Dolbec, P.Y.; Chebat, J.C. The impact of a flagship vs. a brand store on brand attitude, brand attachment and brand equity. J. Retail. 2013, 89, 460–466. [Google Scholar]
- Nierobisch, T.; Toporowski, W.; Dannewald, T.; Jahn, S. Flagship stores for FMCG national brands: Do they improve brand cognitions and create favorable consumer reactions? J. Retail. Consum. Serv. 2017, 34, 117–137. [Google Scholar] [CrossRef]
- Eggers, F.; O’Dwyer, M.; Kraus, S.; Vallaster, C.; Güldenberg, S. The impact of brand authenticity on brand trustand SME growth: ACEO perspective. J. World. Bus. 2013, 48, 340–348. [Google Scholar] [CrossRef]
- Paulssen, M. Attachment orientations in business-to-business relationships. Psychol. Mark. 2009, 26, 507–533. [Google Scholar] [CrossRef]
- Burmann, C.; Zeplin, S. Building brand commitment: A behavioural approach to internal brand management. J. Brand. Manag. 2005, 12, 279–300. [Google Scholar] [CrossRef]
- Fastoso, F.; González-Jiménez, H. Materialism, cosmopolitanism, and emotional brand attachment: The roles of ideal self-congruity and perceived brand globalness. J. Bus. Res. 2020, 121, 429–437. [Google Scholar] [CrossRef]
- Trudeau, H.S.; Shobeiri, S. The relative impacts of experiential and transformational benefits on consumer-brand relationship. J. Prod. Brand. Manag. 2016, 25, 586–599. [Google Scholar] [CrossRef]
Figure 1.
The framework of HOQ.

Figure 2.
Experience strengthens the strategic importance evaluation process of brand attachment demands.
Figure 2.
Experience strengthens the strategic importance evaluation process of brand attachment demands.

Figure 3.
Brand attachment hierarchical structure graph of convenience stores.

Figure 4.
Performance difference analysis of brands of convenience stores.

Figure 5.
Relative weight value of convenience store brand experience strategy management plans.

Figure 6.
Performance evaluation of brand experience strategic management plans of the main brands of convenience stores.
Figure 6.
Performance evaluation of brand experience strategic management plans of the main brands of convenience stores.

Table 1.
The dimensions and attributes of brand attachment.
| Goal | Dimension | Attribute | Description | Reference |
|---|---|---|---|---|
| Brand Attachment | Affection | Brand affection | Tending to feel or show affection or tenderness. | Thomson et al. [21] |
| Brand love | Having deep emotions for a brand, just like love. Not having it will cause great disappointment. | |||
| Brand friendliness | Friendly relationship with the brand. | |||
| Passion | Brand passion | Having strong affection or emotion toward the brand. | Hung and Lu [20], Thomson et al. [21] | |
| Brand delight | Feeling delighted about the brand. | |||
| Brand captivation | Without any strong favor or even hope to consume a product at any time, but still having strong desire for a certain product/brand. | |||
| Brand-self connection | Brand guarantee | Based on the reliability maintained by the brand to identify with the commitment and guarantee of the brand’s product and fulfill personal expectations. | Rio et al. [22] | |
| Brand self-identity | Consistency between consumers’ self-image and brand image. | |||
| Brand social identity | Integrating the communication tools of the brand, and the consumers hope to become part of the group. | |||
| Brand prominence | Brand cognition | When a consumer comes into contact with related clues of a familiar brand, he/she thinks of it spontaneously. | Aaker [23], Xu et al. [24] | |
| Brand memory | The ease and possibility for a consumer to recall the brand in his/her memory. | |||
| Brand knowledge | How much a consumer knows about the brand. |
Table 2.
Strategic management plan of brand experience.
| Goal | Dimension | Attribute | Strategic Management Plan | Reference |
|---|---|---|---|---|
| Brand Experience | Feeling experience | Emotionality | Pictures that can stimulate sense and arouse consumers’ emotions | Beig and Khan [39], Brakus et al. [2], Gavilanes et al. [40], Kim and Yu [38], Morrison and Crane [41], Nysveen et al. [37] |
| Affectivity | Small games that are appealing and capable of stirring consumers’ emotions | |||
| Participation | Functions of commenting, liking, and sharing | |||
| Cognition experience | Knowledge | Informative articles and messages | Beig and Khan [39], Brakus et al. [2], Malär et al. [15] | |
| Utility | Consumers actively search for special offers | |||
| Curiosity | Special videos or commercials | |||
| Acting experience | Function experience | Functions supplied by apps (ex: mobile wallet) | Bleier et al. [28], Brakus et al. [2], Dwivedi et al. [30], Hwang et al. [42], McLean et al. [32], | |
| Passive involvement in activities | Messages of special offers | |||
| Active involvement in activities | Point gathering activities | |||
| Relating experience | Community belongingness | Consumers interact in the brand community and gain belongingness toward it | Jouzaryan et al. [43], Kang et al. [4], Kim and Yu [37], Mishra et al. [18], Nysveen et al. [36], Schmitt and Zarantonello [44], Yasin et al. [45] | |
| Friend sharing | Consumers actively share messages with friends | |||
| Brand identity | Makes consumers identify with the brand and think they are part of it |
Table 3.
Analysis of returned valid copies of questionnaires from consumer experts.
| Brand | Distributed Copies | Return Copies | Return Rate | Valid Copies | Invalid Copies | Valid Rate |
|---|---|---|---|---|---|---|
| 7-Eleven | 71 | 71 | 100% | 63 | 8 | 89% |
| Family Mart | 86 | 86 | 100% | 60 | 26 | 70% |
| Hi-Life | 108 | 108 | 100% | 60 | 48 | 56% |
Table 4.
Expert profile statistics.
| Categories | Numbers | |
|---|---|---|
| Gender | Male | 18 |
| Female | 20 | |
| Age | 29 years old and under | 3 |
| 30 to 49 years old | 27 | |
| 50 years old and above | 8 | |
| Education | High school or below | 0 |
| College/university | 23 | |
| Master’s degree | 11 | |
| Doctorate | 4 | |
| Expertise | Store Manager | 6 |
| Store Deputy Manager | 6 | |
| Store Consultant | 3 | |
| Project Specialist | 13 | |
| Store Management Specialist | 10 |
Table 5.
Weight value of brand attachment dimensions of 7-Eleven’s young/older consumers.
| Dimensions of Brand Attachment | Fuzzy Weight Values (Young/Older) | Defuzzification of Weight Values (Young/Older) | Rankings (Young/Older) |
|---|---|---|---|
| Affection | (0.245, 0.244, 0.249)/ (0.255, 0.259, 0.271) | 0.246/0.261 | 3/2 |
| Passion | (0.259, 0.253, 0.249)/ (0.234, 0.231, 0.235) | 0.254/0.233 | 2/4 |
| Brand–self connection | (0.244, 0.239, 0.237)/ (0.267, 0.265, 0.265) | 0.222/0.266 | 4/1 |
| Brand prominence | (0.253, 0.265, 0.265)/ (0.243, 0.245, 0.230) | 0.261/0.239 | 1/3 |
Table 6.
Weight value of consumer brand attachment attributes of 7-Eleven’s young/older consumers.
| Goal | Weight Values of Dimensions (a) (Young/Older) | Ranking of Dimensions (Young/Older) | Weight Values of Attributes (b) (Young/Older) | Final Weight Values (a × b) (Young/Older) | Importance Ranking (Young/Older) |
|---|---|---|---|---|---|
| Brand Attachment | Affection (0.246/0.261) | 3/2 | Brand affection (0.301/0.337) | 0.0740/0.0864 | 11/5 |
| Brand love (0.336/0.325) | 0.0827/0.0848 | 7/6 | |||
| Brand friendliness (0.364/0.338) | 0.0895/0.0882 | 2/3 | |||
| Passion (0.254/0.233) | 2/4 | Brand passion (0.323/0.317) | 0.0820/0.0739 | 8/12 | |
| Brand delight (0.356/0.352) | 0.0904/0.0820 | 1/7 | |||
| Brand captivation (0.322/0.331) | 0.0818/0.0771 | 9/11 | |||
| Brand–self connection (0.222/0.266) | 4/1 | Brand guarantee (0.308/0.342) | 0.0739/0.0910 | 12/1 | |
| Brand self-identity (0.332/0.333) | 0.0797/0.0886 | 10/2 | |||
| Brand social identity (0.360/0.327) | 0.0846/0.0870 | 6/4 | |||
| Brand prominence (0.261/0.239) | 1/3 | Brand cognition (0.340/0.328) | 0.0887/0.0784 | 3/10 | |
| Brand memory (0.329/0.339) | 0.0859/0.0810 | 5/8 | |||
| Brand knowledge (0.331/0.333) | 0.0864/0.0796 | 4/9 |
Table 7.
Brand attachment performance value and improvement rate of 7-Eleven’s young and older consumer groups.
Table 7.
Brand attachment performance value and improvement rate of 7-Eleven’s young and older consumer groups.
| Attributes | Weights (A) (Young/Older) | Current Performance (B) (Young/Older) | Expected Performance (C) (Young/Older) | Performance Value (A × B) (Young/Older) | Improvement Rate (C/B) (Young/Older) |
|---|---|---|---|---|---|
| Brand affection | 0.074/0.088 | 4.000/3.941 | 4.192/4.059 | 0.296/0.347 | 1.048/1.03 |
| Brand love | 0.0827/0.085 | 3.846/4.029 | 4.077/4.059 | 0.318/0.342 | 1.06/1.007 |
| Brand friendliness | 0.089/0.088 | 4.000/4.088 | 4.192/4.000 | 0.358/0.361 | 1.008/0.978 |
| Brand passion | 0.082/0.074 | 3.469/3.852 | 3.769/3.882 | 0.309/0.287 | 1.056/1.008 |
| Brand delight | 0.090/0.082 | 3.692/3.882 | 3.923/4.118 | 0.334/0.318 | 1.063/1.082 |
| Brand captivation | 0.082/0.077 | 3.462/3.824 | 3.808/3.853 | 0.283/0.295 | 1.038/1.008 |
| Brand guarantee | 0.074/0.091 | 3.923/3.824 | 4.077/4.059 | 0.29/.0348 | 1.039/1.071 |
| Brand self-identity | 0.080/0.088 | 3.885/3.971 | 4.192/4.088 | 0.31/0.349 | 1.059/1.029 |
| Brand social identity | 0.086/0.087 | 3.462/4.029 | 3.731/3.941 | 0.299/0.351 | 1.025/0.978 |
| Brand cognition | 0.089/0.078 | 4.269/4.059 | 4.308/4.206 | 0.379/0.318 | 1.009/1.086 |
| Brand memory | 0.086/0.081 | 4.308/3.941 | 4.192/4.088 | 0.370/0.333 | 0.973/1.037 |
| Brand knowledge | 0.0864/0.0796 | 3.846/3.853 | 4.115/4.118 | 0.332/0.307 | 1.07/1.079 |
Publisher’s Note: MDPI stays neutral with regard to jurisdictional claims in published maps and institutional affiliations. |
© 2021 by the authors. Licensee MDPI, Basel, Switzerland. This article is an open access article distributed under the terms and conditions of the Creative Commons Attribution (CC BY) license (https://creativecommons.org/licenses/by/4.0/).
Share and Cite
MDPI and ACS Style
Hsu, T.-H.; Lin, L.-Z. A Multidimensional Fuzzy Quality Function Deployment Design for Brand Experience Assessment of Convenience Stores. Mathematics 2021, 9, 2565. https://0-doi-org.brum.beds.ac.uk/10.3390/math9202565
AMA Style
Hsu T-H, Lin L-Z. A Multidimensional Fuzzy Quality Function Deployment Design for Brand Experience Assessment of Convenience Stores. Mathematics. 2021; 9(20):2565. https://0-doi-org.brum.beds.ac.uk/10.3390/math9202565
Chicago/Turabian StyleHsu, Tsuen-Ho, and Ling-Zhong Lin. 2021. "A Multidimensional Fuzzy Quality Function Deployment Design for Brand Experience Assessment of Convenience Stores" Mathematics 9, no. 20: 2565. https://0-doi-org.brum.beds.ac.uk/10.3390/math9202565
Note that from the first issue of 2016, this journal uses article numbers instead of page numbers. See further details here.