
Ubiquitous Computing: Driving in the Intelligent Environment
by
 , ,
, ,
Emanuela Bran
1,2,*, 
Elena Bautu
3 ,
,
Dragos Florin Sburlan
3 ,
,
Crenguta Madalina Puchianu
3 and
Dorin Mircea Popovici
1,3 1
Faculty of Electrical Engineering and Computer Science, “Transilvania” University, 500024 Brasov, Romania
2
Institute of Studies for Development and Security at the Black Sea, “Ovidius” University, 900527 Constanta, Romania
3
Department of Mathematics and Computer Science, “Ovidius” University, 900527 Constanta, Romania
*
Author to whom correspondence should be addressed.
Mathematics 2021, 9(21), 2649; https://0-doi-org.brum.beds.ac.uk/10.3390/math9212649
Submission received: 31 July 2021
/
Revised: 12 October 2021
/
Accepted: 15 October 2021
/
Published: 20 October 2021
(This article belongs to the Special Issue Computational Intelligence and Human–Computer Interaction: Modern Methods and Applications)
Abstract
:In the context of hyper-connected cars and a growing heterogeneous digital ecosystem, we wish to make the most of the data available from the various sensors, devices and services that compose the ecosystem, in order to propose a proof of concept in-vehicle system that enhances the driving experience. We focus on improving the driving experience along three main directions, namely: (1) driving and trip planning, (2) health and well-being and (3) social and online activities. We approached the in-vehicle space as a smart interface to the intelligent driving environment. The digital data-producers in the ecosystem of the connected car are sources of raw data of various categories, such as data from the outside world, gathered from sensors or online services, data from the car itself and data from the driver gathered with various mobile and wearable devices, by means of observing his state and by means of his social media and online activity. Data is later processed into three information categories—driving, wellness, and social—and used to provide multi-modal interaction, namely visual, audio and gesture. The system is implemented to act in response to the trafficked information on different levels of autonomy, either in a reactive manner, by simple monitoring, or in a proactive manner. The system is designed to provide an in-vehicle system that assists the driver with planning the travel (Drive panel), by providing a comfortable environment for the driver while monitoring him (Wellness panel), and by adaptively managing interactions with their phone and the digital environment (Social panel). Heuristic evaluation of the system is performed, with respect to guidelines formulated for automated vehicles, and a SWOT analysis of the system is also presented in the paper.
1. Introduction
Complex in-vehicle software systems are a hallmark of premium cars, augmenting the driver’s experience at many different levels. In today’s interconnected world, connected cars should offer safer trips and a more pleasant journey for the driver and the passengers altogether. Intelligent cars, wearable devices, mobile devices, smart cities and the digital environment will all be connected in order to improve the driving user experience.
The smart cars [1] sector is increasing tremendously as a part of the internet of things (IoT). Connected cars provide intelligent advanced driver assistance systems (ADAS), and 5G communication with smart road infrastructure [2]. Data-driven business models [3] are created for intelligent transportation systems and beyond. The in-vehicle space is populated with smart devices such as wearables and insideables, that are smart sensors worn by people or implanted inside the human body [4]. These devices serve as natural interfaces for communication with the in-vehicle systems (IVIS) [5].
Other smart devices and services are integrated and connected to smart cars in order to create systems of systems (SoS) that serve complex driving related tasks [6]. These networks of systems give rise to smart cities with intelligent mobility services [7] that have an important impact on sustainability [8]. The intelligent environment is interconnected from production, to transportation, to the human sector and beyond, in a planetary space where the physical and the digital intertwine creating global intelligence [9].
We may view the myriad of the actors and stakeholders of the digital environment as part of a greater ecosystem with interdependent links [10]. These IoT innovations are possible with the help of 5G technology over which speed dependent applications flourish, and homes, cities cars become smart entities creating ambient intelligence [11]. All these breakthrough technologies emerging inside smart vehicles create an intuitive and extraordinary driving experience of the digital transformation sage [12].
We aim to design a system that relies on design thinking principles as we consider a user-centered design, and we encompass the driver’s emotional, cognitive, and aesthetic needs while he is driving and handling an intelligent environment. The goal of the paper is to propose a proof-of-concept system that is built on top of various open source or free libraries/APIs/SDKs (described in Section 3.2 and Section 3.3) and incorporates multimodal interaction (voice, gesture, touch, pulse, facial emotion etc.) to enhance the driving experience. We consider the interior of the car as both a multi-modal interface able to process various user input, and a part of the intelligent environment. In this respect, having in mind the design of a useful, supportive, and comfortable environment for the driver and passengers (the “digital car-sphere”), we propose a paradigm-shift away from conventional/standard in-vehicle user interfaces. More precisely, in the proposed design, the entire in-vehicle digital space sphere represents an interface for the intelligent digital medium. Various onboard or outboard sensors, devices, and systems gather, integrate, and process data, providing in return relevant information and proactive interaction with the requesters (the driver, passengers or other systems). The human actions on various time scales (ranging from simple instant tactile interactions with the standard input devices to short/long time behavior or even voice) are transduced into data which can be interpreted by the intelligent environment in order to adaptively trigger a better in-vehicle experience for the requester. In a typical scenario, as the driver/passenger engages the in-vehicle activities, the intelligent in-vehicle medium will track its actions in order to support intelligent adaptation to its ongoing task(s). In our setup this is done by considering four main components: data, information, interaction, and autonomy. In our view the data refers to values collected together from the entire driving environment (in- or out-vehicle). These values are classified by the information component into several categories (driving, wellness, social). Based on this classification the multimodal interface incorporates different types of interactions tailored to the user’s perceptual senses. Finally, autonomy refers to the digital environment feed-back as a consequence to driver/passenger actions and other in- or -out vehicle data collection.
In this article we focused on the in-vehicle space as an interface [13] to the intelligent environment. Our vision is that the in-vehicle environment should offer assistance [14,15] for the user in three main areas, namely: (1) the driving and trip planning task, (2) their health and well-being and (3) managing social connections and online activities. By empowering the driver to have access to information ecosystem [16] regarding these three areas and providing multi-modal communication and implementing proactive interaction for the in-vehicle system, we aim to create an enhanced driving experience that also diminishes the overloading of the driver with information unrelated to the driving task.
The paper is structured in five sections. Section 2 covers related works in the field of in vehicle systems and ubiquitous computing. The brief review of the current state of the art in the field is organized in three subsections, each dealing with a different focus, as follows: the first subsection reviews targeted literature on connected cars and smart transport infrastructure, the second subsection reviews targeted literature on wearable devices and the intelligent world environment, and finally, the third subsection of the Literature review deals with papers on the topic of user experience and car multimodal interfaces. Section 3 presents the proposed system, detailing the three main directions in which it touches upon the driving experience. The multi-modal interaction components are described in this context. The results of heuristic evaluation of the systems according to human machine interface (HMI) guidelines for automated vehicles are discussed in Section 4. Finally, the paper ends with our conclusions and outlines some avenues for future research.
2. Literature Review
This paper presents a proof-of-concept in-vehicle system placed in the ubiquitous computing context. To this end, the literature review that follows covers aspects that relate to connected cars and smart infrastructure, wearables and the intelligent environment, user experience and car multimodal interfaces. We structured the literature review in 3 main categories of studies that offer a broad perspective on in-vehicle systems in the interconnected and complex digitalized world. We will start by going through communication innovations of connected cars. From there we will investigate other connection endpoints around the intelligent environment. Finally, we will get an insight into natural interfaces. Altogether, we wish to understand and present the interior of the car as both an interface and a part of the intelligent environment.
2.1. Connected Cars and Smart Transport Infrastructure
Whether we are considering autonomous vehicles [17], or cars with a certain degree of automation in general, there is always a necessity for the car to be connected to an information provider of its surroundings, in order to either inform the intelligent car system or the human driver. Cars may be connected [18] in a variety of ways, a simple navigation system [19] being one of the first examples of connectivity. Today, there are cars that connect to the internet using a SIM card, and applications [20] that require fast communication are being designed to use the benefits of the 5G [21,22] and IoT technology [23,24], creating an internet of vehicles digital space [25,26]. There are also other ways and protocols [27] that cars use to communicate between them, such as through blockchain secured ad-hoc vehicle networks [28,29] and LiFi communication [30,31].
Smart cars [32] connect to each other through what is called V2V communication [33] to synchronize traffic and safely [34] carry out driving actions. They may also connect to the road infrastructure in V2I communication [35,36] and generally connect to other entities in V2X communication [37,38] such as to interact with pedestrians [39]. Smart cities are already implementing such communications that take place between different smart entities, some of which are traffic related. There is research going on to enable connected cars to coordinate with each other in a decentralized proactive manner as opposed to just request information [40]. Connected car applications [41] already in use provide means for the car to connect to an edge-fog-cloud of information [42,43,44] for various purposes in a centralized manner.
Based on research on autonomous or non-autonomous cars, on different communication technologies, on decentralized and centralized connectivity [45,46], we have concluded that there is a rich cluster of information and interaction produced between vehicles and other road entities. In the Solution section, we are going to explore a dynamic visualization [47] of road information in terms of predictive weather conditions [48], visibility [49,50] and outdoor illumination [51,52] and potential sun glares [53,54] at the future moment of passing through that area, with markings on possible hazards [55,56], for a better trip planning. We chose this kind of information compared to the better-known real-time crowd sourced [57] traffic data, as an example of a novel cluster of visualized road information.
2.2. Wearables and the Intelligent World Environment
Smart sensors [58] are used everywhere, ranging from smart devices to the human body and the environment. There is even the term “EveryWare” referring to ubiquitous computing, coined by Greenfield, (Greenfield A (2006) Everyware: The dawning age of ubiquitous computing. New Riders, Berkeley) [59,60]. Wearables [61,62] are devices that can be worn by people and have smart sensors incorporated that collect information on the vital signs [63], the whereabouts, the motion [64], and other environmental conditions. They may come in a more traditional form such as a wristband, an innovative form such as a nail sticker [65], a tattoo [66], or even a smart textile [67,68,69,70], and they contribute to the health [71] and wellbeing [72,73] of people.
Smart sensors can be very small; they are able to communicate and may process data. Together with smart actuators [74,75] they may sense the environment, modify the environment, and synchronize with each other [76,77]. They make ubiquitous computing possible, which is a paradigm under which services follow the user seamlessly across different environments, comprising altogether the intelligent environment. Computers started as one big static device used by many users, then they became smaller and affordable in the form of personal computers, then one user could own many mobile computer devices. Now the idea is to extend the number of devices of the user by the thousands, embedding them across the environment [78], making them sharable as hardware, and personalized as software [79].
In the Proposed Solution section, we will explore the potential of a wearable pulse sensor [80] for monitoring the human body [81], and the OBDII interface to access data from the car’s sensors. For creating a pleasant ambience to suit the driver’s needs, we will also have playlists of songs [82] that have been analyzed in terms of beat rate, liveliness, and genre as an example of data request. In addition, the weather data that we use is also the product of a multitude of smart things (satellites, ground sensors), collecting big data, collaboratively processing it, and finally delivering it through an interface designed for people or machines in the form of an API.
2.3. User Experience and Car Multimodal Interfaces
Intelligent environments may use mixed reality for visualization [83,84] and natural interaction metaphors [85] that let the user intuitively use the system. They identify and monitor the user [86], read intentions [87], and personalize their services. By also monitoring the environment [88], they infer circumstances, and adapt [89] their services accordingly. They act as autonomous and affective agents [90,91,92], understanding the surroundings [93], initiating interaction, and completing tasks on their own. Intelligent environments are proactive in contrast with other reactive systems creating a state-of-the-art user experience [94,95,96,97] by emulating humans [98] and fulfilling desires [99].
The car, as part of the intelligent environment [100], should function as an empathic agent [101], having a multimodal interface [102] making use of artificial intelligence [103], mixed reality [104], and natural interaction [105,106]. Multimodality [107] uses different channels and modes of communication. Through the visual field we may understand text, symbols, images, animations, and the system may capture gestures, recognize objects, and detect the depth of the environment. Sound and touch represent other widely used channels of communication, and the list may continue, especially for the unlimited possibility of digital systems to augment their perception through a wide variety of sensors. As for humans, there is research going on into EMG, EOG, EEG interfaces [108]. Brain interfaces [109,110] may even infer the state of the mind by analyzing brain waves and augment expression of intensions.
We proposed and designed several types of multimodal natural interaction in the Solution section, between the intelligent in-vehicle system and the driver. The system recognizes facial expressions [111], speech, gestures, and touch. As it is believed to be a correlation [112,113] between music and the emotional state [114] or the physiological alertness [115], a specific playlist is suggested [116,117]. Notifications from the smart phone are also synchronized with the in-vehicle system to better manage driver-phone interactions [118]. By being aware of certain stressful [119] circumstances the system can decide whether to postpone notifications in an attempt to increase safety [120].
3. Proposed Solution
This section details a presentation of the system, with emphasis on some conceptual, technical and implementation details. Our aim is to help the driver concentrate on the driving task by planning the travel (Drive panel, see Section 3.2.1), by providing a comfortable environment for the driver while monitoring him (Wellness panel, see Section 3.2.2), and by managing interactions with their phone and the digital environment (Social panel, see Section 3.2.3).
Ubiquitous Computing is a paradigm under which services follow the user seamlessly across the intelligent environment [121,122]. We apply this paradigm by considering that the driver is moving through the intelligent environment and services are continuously adapting to the present circumstances. The intelligent driving environment (detailed in Section 3.1) is comprised by the in-vehicle space, the nearby surroundings, and faraway elements that are remotely connected, all of which have a direct or an indirect impact on the here and now.
The in-vehicle space acts as an interface for the intelligent environment. It harvests and hosts data, which is aggregated and processed into information, building an information ecosystem. This interface enables the user to naturally interact with data and information by providing several types of multimodal interaction such as touch, voice, and gesture. As an intelligent interface, the system was designed to be proactive. Thus, it decides the moment and means to notify the user and initiates interaction when necessary. It achieves this by analyzing the priority of the information to be communicated and by inferring the status of the user.
The smart driving interface components (see Figure 1) are data (further described in Section 3.1), information (further described in Section 3.2), interaction (further described in Section 3.3), and autonomy (further described in Section 3.4). We would like to emphasize the fact that the list of data presented in this article is not exhaustive, but it is merely a fraction of the types of data available, as discussed in the State-of-the-Art section. By choosing our data producers, we meant to exemplify data categories (world, car, driver), that are later processed into information categories (driving, wellness, social), how they help provide multimodal interaction (visual, audio, gesture), and how they help the system act on different levels of autonomy (reactive, monitoring, proactive).
3.1. Harvested Categories of Data
From our perspective, the driving environment is very abundant in data, either requested or locally produced, with a broad origin spectrum, which effectively processed by correlation and aggregation, create a vast information field that is rich in meaning. In this subchapter we are going to analyze the devices and services from where we harvest data that is relevant to the driving intelligent environment. We will organize the data sources by origin into layers of different categories and subcategories.
In Figure 2, the intelligent driving environment layers are presented through a user centered design. The data producers are grouped by their data source into four layers, easily distinguishable in the figure by their color (orange for the user signals, green for the interceding IVIS, purple for the smart devices, blue for the internet services). The person sits at the center of the diagram, surrounded by the awareness of the IVIS which intercedes between him and the environment, that is comprised of the nearby car interior populated by smart devices and the faraway services present in the internet cloud.
3.1.1. The Internet Cloud (the World)
We harvest data from the cloud to provide information on the weather and environmental conditions that have an impact on the difficulty of driving. Data about navigation routes also falls under this category. The music that plays in the car is also broadcasted from the internet, while notifications usually are also related to events happening in the real or digital world. We should also mention here the database records that are stored in the cloud. The location of the mobile phone is also dependent on mobile services.
3.1.2. The Smart Devices (the Car)
The smart devices inside the car are producers of data, and we can list here the OBDII (http://www.obdii.com/, accessed on 1 July 2021) interface for vehicle diagnosis and reporting, which reads the values indicated by the speed, rotations per minute, oil, and water sensors. Some smart devices are linked to the people inside the cars, and these are the Smart Watch (which reads the pulse, provides voice input interaction, and vibrational feedback) and the Smart Phone (which send notifications, and provides location information).
Other devices from inside the car that produce data are the Leap Motion device (which reads gestures), the camera (that sends video footage for face detection). These two, together with the OBDII device, are linked to an onboard computer laptop which hosts the NodeJS server [123,124] of the system (which handles communication between data producers and consumers, together with database connection services). It handles emotion and alertness state detection, gaze direction calculation, gesture interpretation, and car sensor data collection.
The visual interface is provided by a touch-enabled smart tablet display. It also handles the calculation of the Sun’s position and integrates this with navigation route data and weather data to obtain road conditions. It listens to data coming from sensors and queries data from the database in order to plot graphs. It is the place where multimodal input is centralized for interaction with the displayed elements, and where automatic control is carried out by centralizing user and environment monitoring data. We have also experimented with an AR hologram floating right past the windshield [125]. This was achieved by using a video projector and a screen which was reflected by the windshield.
3.1.3. The Ubiquitous Interface (the IVIS)
The intelligent interface is provided by the IVIS which processes raw data coming from the world, the car, and the user. This layer handles interaction between the user, the car’s interior environment and the outside real and digital world, by providing detection of the user and the environment, reaction of the system to the user’s intentions, and proactive automated action towards the inferred user’s needs and the environment’s circumstances. It is composed by the onboard computer which handles resource costly calculations, and the tablet which centralizes information. Interaction is further discussed in Section 3.3 and autonomy in Section 3.4.
3.1.4. The Monitored User (the Driver)
The user is a provider of data regarding physiological parameters and communication through multimodal interaction. The facial expressions indicate emotional status and alertness level, and the system watches for blinking patterns, yawns, emotions, and smile through the camera. We have also experimented with the gaze direction of the user as an indication of where their focus of attention is located [126]. The user’s gestures are captured by the Leap Motion and MYO devices, and their voice and pulse by the Smart Watch.
3.2. Processed Categories of Information
We have identified so far, a vast spectrum of data that is relevant to the in-vehicle intelligent environment. We will now proceed by explaining how data is aggregated into clusters linked by meaning and purpose. By further correlating and processing data, we obtain several categories of information. In this subchapter we are going to present these categories and how they are obtained.
3.2.1. Car, Road and Driving Task Related Information
In Figure 3 we present the Driving task panel for when we start a trip from the city of Constanta to Brasov city. On the left side there is a map augmented by weather and illumination information. On the right side, we output information coming from the OBDII interface, composed of either an icon, or a text extracted from a JSON with values for different parameters.
The route is obtained from the MapBox navigation and map graphics API service (https://docs.mapbox.com/api/overview/, accessed on 1 July 2021), which responds to a request having parameters such as route type and endpoints. The JSON response contains geolocation, time from departure and action indication of every turning point along the route. We processed this data into a set of segments calculating orientation for each of them. As input data consisted of geographical coordinates (latitude and longitude), we used special formulas (https://www.movable-type.co.uk/scripts/latlong.html, accessed on 1 July 2021) to determine the geodesic distance (shortest possible line between two points on a curved surface) and bearing (also called forward azimuth, here we used the formula for the initial heading angle).
The Haversine formula (1) is used for computing the length of a segment of the driving route, where φ is latitude, λ is longitude, R is Earth’s radius (mean radius = 6371 km):
The term a is denoted by the formula:
and c by:
a = sin2(Δφ/2) + cos φ1 × cos φ2 × sin2(Δλ/2)
Then the distance d is computed as:
d = R × c
The initial bearing, Equation (2), is used to compute the heading angle of a segment of the drivers’ route φ1, λ1 is the start point, φ2, λ2 the end point (Δλ is the difference in longitude):
θ = atan2(sinΔλ × cosφ2, cosφ1 × sinφ2 − sinφ1 × cosφ2 × cosΔλ)
We used the JavaScript SunCalc library (https://github.com/mourner/suncalc, accessed on 1 July 2021) for calculating the sun altitude (angle of ground elevation) and azimuth (horizontal angle from north direction) for each location and time. This is a complex calculation process (https://www.aa.quae.nl/en/reken/zonpositie.html#9, accessed on 1 July 2021) which takes into account the geographical location and observation date and time, with all the planetary motions described by astronomy. By combining the obtained data, we inferred the natural illumination along the route, as well as certain road segments where there is a sun glare visibility hazard. We colored the route with different shades of blue according to the sky color at that time and location, and with shades of orange for sunrise and sunset glares coming through the windshield or through the mirrors.
We determined whether there is a risk of sunglare by using data from navigation and sun position the following way. If the Sun’s altitude was below 30 degrees above the horizon, and if there was a smaller than 60 degrees difference of angles between the Sun’s azimuth and the car’s bearing, then there could be sunglare coming from the front. We computed in a similar way glares coming from the back of the car through the mirrors.
We also used the OpenWeather API service (https://openweathermap.org/api, accessed on 1 July 2021), which is based on machine learning for forecasting, to request weather conditions every 50 km along the route. The JSON response contains icons, and values for different parameters, for minutely, hourly, and daily forecast. We used this data to show the forecast along the route at the future time of passing through that location. These icons are spread across the route, and they alternate between time, temperature, weather conditions, and hazards (fog, high amount of precipitation, ice and snow, extreme temperatures, strong wind).
3.2.2. Personal Health and Wellbeing Related Information
The Wellness-related panel, shown in Figure 4, handles information connected to the wellbeing of the driver. The first icon represents the pulse, the second one the alertness inferred from facial recognition, and the last one the tempo of the music being played. Colors change in a fluid manner as to indicate the exact value of a parameter.
Warm colors (red for maximum) express a high pulse, a nervous expression, and an energic playlist, while cool colors (blue for minimum) express a lower pulse, a tired expression (yawning or blinking at a high rate or too slow as time interval measured between closing and reopening the eye), and a slow playlist. A green pulse and a green emoji represent the optimal state. The pulse is constantly updated, while the tempo is updated once a new soundtrack is played.
Music is played with the help of the YouTube Player API (https://developers.google.com/youtube/iframe_api_reference, accessed on 1 July 2021), by uploading the code of each music track. The tempo is determined for each song using data from GetSongBPM API (https://getsongbpm.com/api, accessed on 1 July 2021), and a mean tempo is calculated for each musical track, considering that the songs will likely belong to the same genre. Then, music tracks are ordered by tempo and the one in the middle is the one played by default. Soundtracks with a greater tempo are intended to stimulate a driver and keep him alert, while slower soundtracks are intended to calm down a stressed driver.
The emoji is green by default and changes to blue when either a yawn is detected, or the eye blink rate indicates tiredness. It also changes to red when emotions are heightened such as in the case of anger, fear, or surprise. After a change, it slowly goes back to green. Facial feature detection and tracking is performed using the Beyond Reality Face SDK version 5 (https://github.com/Tastenkunst/brfv5-browser, accessed on 1 July 2021), which helped us detect yawn and patterns of blinking for tired eyes. The JavaScript FaceApi (https://justadudewhohacks.github.io/face-api.js/docs/index.html, accessed on 1 July 2021), which is built on the tensorflow.js core API, can discriminate between seven different facial expressions: neutral, happy, sad, angry, fearful, disgusted, and surprised. Only in the absence of tiredness (because a yawn might be interpreted as an angry face by the emotion recognition component), the facial expressions indicating negative emotions were counted as heightened levels of stress. This way the system clearly discriminates between tiredness, which is also a threat of higher priority, and angriness, which compared to tiredness is of a lower priority.
We have also designed graph plotting for the pulse (see Figure 5). The plotting function has several parameters. The first sets over what time interval we wish to show values. The seconds sets the time subunit for which we want to calculate a mean value and a variance value. If this parameter is set to 0 then the pulse is plotted for each numerical value and there is no variance. We experimented with different visualizations and called the function on different intervals such as, the pulse during last 3 h with segments representing the mean value and variance over 9 min subunits, and the pulse during the last 15 min with segments representing the mean and variance over 45 s subunits. Each segment end represents the mean value in a subunit interval. Variance coming from positive values is plotted above the graph while that produced by negative values is plotted under the graph. The numerical value is the pulse rate at the present moment.
3.2.3. Social and Media Updates Related Information
For the Social information panel, we have designed a double spiral menu for navigating notifications received from the smart phone. We chose this design because it helps display many items, they are ordered chronologically, nearby items are also close along the timeline, and it offers a fluid aesthetic.
The selected icon is centered and different text fields from the notification on the Android phone, value of attributes of the NotificationCompat object, are being shown on the right side, such as title, text, subtext, and application. We have assigned several well-known applications to different predefined categories, distinguished by color codes. Red represents the communication category, blue the social category, and violet other activities category.
In Figure 6, these categories are exemplified by Gmail, Facebook, and the Wish shopping app, respectively. Every time a new notification is received, it will be added to the list, and it will be automatically centered. Thus, notifications are chronologically ordered. Only 19 notifications are visible at a time, the last five on each spiral end fading into transparency. Notifications may be deleted after they are checked.
We have already experimented with interaction initiated from the tablet to the phone through the Euphoria server that is hosted on the laptop computer. We built two SOS buttons for local emergency services, one for calling the 112 line (112—the Romanian emergency phone number), and one for sending a SMS to the 113 line (designed for people with speech accessibility problems). When we clicked the call option, an Android Intent was produced on the phone that resulted in the android calling app being started and the 112 telephone number already typed. The user just needed to press call on their phone. When we clicked the SMS option, an Android Intent generated an SMS to the 113 (113—the Romanian SMS emergency number) number with the text body containing personal information, a generic message asking for help, and the location information available from the mobile services. The user just needed to press send on their phone.
Future work will include implementing the ability to initiate actions from the Social panel to the smart phone through the Android Intent system, such as making a call and responding to a WhatsApp message. The iOS also provides a similar capability based on App Extensions system.
3.3. Natural Multimodal Interaction
Multimodal interaction is a key feature in ubiquitous computing, and we provide three distinct channels of interaction between the user and the system. We implemented for each of these channels (visual, audio, gesture/vibrational) both input and output communication. Another key feature of ubiquitous computing is actively monitoring users. Thus, some of these modes of interaction are active while some are passive from the user’s side, making the system reactive as well as proactive. Proactiveness will be further discussed in Section 3.4.
Each panel has an interactive element that may be changed through quick multimodal interaction (see Figure 7). For the Driving panel, this element is the departure time. When planning a trip, the user may want to consider how the conditions will be if he stops for a while along the route or leaves a later moment in time. By selecting the panel, the user may easily scroll the timeline of the map to make better decisions ahead. For the Wellness panel, the interactive element is the music, which can be paused and played. The user is also able to change the playlist and adjust the volume. For the Social panel, the user may scroll through the notifications and delete those that he already checked. Interaction was designed so that any action can be carried out through all three means (visual, audio, gesture).
3.3.1. Visual Interaction
The visual interface provides visual information to the user and the touchscreen can let the user input information and perform actions on the active elements. On the Drive panel, the user may scroll the timeline for planning the trip. On the Wellness panel he may scroll through the playlists, change the volume by a vertical scroll and stop and play a song by a simple tap. On the Social panel he may scroll through the notifications, select one, and drag it for deletion.
The face detection for emotion, tiredness, and gaze direction are forms of passive interaction from the user’s side. It means these are used for monitoring the user’s state and enabling proactive action. We have experimented with smile as an indicator of approval for a suggestion made by the system, while a neutral face meant rejection of the proposal. An example is, when the user has a nervous demeanor or the pulse is high, the system will recommend calming music, to which he can agree by smiling.
3.3.2. Audio Interaction
The system receives auditory information through the Voice Recognition service of the Smart Watch. Voice commands need to follow the pattern specified by a grammar described with the help of the CMUSphinx Open Source Speech Recognition API (https://cmusphinx.github.io/doc/python/, accessed on 1 July 2021) [125,126]. There is a start phrase, a command, an object of interest, and a finish phrase. An example would be <please> <play> <the music> <thank you>. We should note that this command is available even if the Wellness panel, where the music is handled, is not currently the one selected, unlike with gesture interaction, where gestures affect only the current selected panel.
The text-to-speech component uses a voice synthesizer to read alerts produced by the system. We have experimented with sound and voice alerts and silent vibration feedback alerts. When an audio alert is being transmitted, the music is paused momentarily, and automatically played once the alert has finished reading.
3.3.3. Gesture Interaction
The Leap Motion device (https://developer.leapmotion.com/, accessed on 1 July 2021) can interpret midair gestures performed by the user by using an active IR scanner and algorithms to process the 3D data obtained (different shades of illumination indicate depth). It can discriminate between swipe left and right gestures, circular left and right gestures, a tap gesture, and a key press gesture, the last two having also a location attribute. It also knows the hand orientation, magnitude of openness (open palm vs. closed fist), and finger positions, and new gestures may be described for added complexity [127,128,129].
We experimented with different approaches to handling actions with the help of gestures and implemented a similar sequence of gestures that would resemble a grammar. For a starting gesture we chose an open hand, performed for at least 1 s. Then the user may swipe to reach the desired screen. Once the screen is selected using a tap, the user may perform a circular motion to scroll through the timeline, playlists, or notifications. Another tap will bring the timeline to the present moment for the Driving panel. The same action will enable deleting a notification on the Social panel, which is performed by a swipe. A tap on the Wellness panel will enable pausing the music by closing the hand and playing it by opening the hand. The volume will also be active for change by a circular motion to the left or right.
Vibrational feedback is performed by the Smart Watch on the user’s hand and helps him notice that the Leap Motion device is waiting for a sequence of input gestures. It also serves as a confirmation of voice or gesture command approval by the system. We have also implemented vibration as a form of silent alert instead of pausing the music and reading the alert using the text-to-speech component.
We have also experimented with natural interaction through gestures using the MYO (https://developerblog.myo.com/, accessed on 1 July 2021) device, which reads muscular contractions through a Electromyography EMG interface and infers gestures. It knows the configuration of the hand because gestures such as a stop sign or a gun shooting gesture involve different muscular subgroups. It also knows the dynamics of the gestures using its inertial measurement unit composed of a three-axis gyroscope, accelerometer and magnetometer.
3.4. Autonomy and Proactive Interaction
By default, in the absence of interaction from the user’s side, the system will constantly switch between the three panels every 20 s. If there is an event occurring in one of the three areas, driving, wellness, or social, then the respective panel will be displayed, along with a short message or an alert about the event.
The Driving panel events are related to newly detected hazards or approaching already detected hazards. The Wellness panel events are related to the detected tiredness or stress. The Social panel events are related to new incoming notifications or notifications that were postponed are now being shown.
3.4.1. Active Monitoring
An intelligent system built under the ubiquitous computing paradigm is reactive to the active form of interaction from the user side, as well as proactive, by monitoring the user, and acting in consequence. The user is thus actively monitored in term of pulse, emotion, alertness, and gaze direction. The car and the environment are also monitored in terms of speed, and natural conditions, respectively.
We selected and categorized eight indicators of the driving task quality, graphically represented in Figure 8. They are grouped into external overload (from monitoring the environment) and internal stress (from monitoring the user) factors, and stimulation that heightens or lowers the state of alertness. Using these eight parameters we infer if the user is either deprived or overloaded by stimuli, and if his internal state (caused by the external factors or by other internal or external problems) is optimal or there is a risk of tiredness or stress respectively.
3.4.2. Proactive Action
Safe driving depends on the alertness of the driver. We wish to keep an optimal state of alertness for the driver by balancing the external stimuli that we can control, such as the notifications from the Social panel and the music on the Wellness panel.
If there is a risk of the driver to feel asleep, the system will alert him on the Wellness panel with a blue heart or blue emoji and suggest an energetic playlist with a fast tempo. If there is a risk that the user is overloaded by stimuli that impair his focus on the driving task, the incoming notification on the Social panel will be momentarily queued and the system will alert him on the Wellness panel with a red heart or red emoji, suggesting a calm playlist.
4. Heuristic Evaluation of the IVIS
Various components of the proposed in-vehicle system have been subjected to usability studies, with encouraging results obtained from the users that participated in the experimental evaluation and answered the subsequent usability questionnaires. The now complete system incorporates the previously developed components [125,126,130,131], but employs several important extensions, such as predicting the weather and lighting conditions along the road and analyzing the face of the driver in terms of emotion, blinking and yawning.
In previous work [130,131] we described a component of the current system that assists the driver by automatically filtering, in an adaptive manner, messages and notifications from third party applications, that may distract the driver’s attention while driving. We performed a usability study involving a sample of 75 users, selected from a pool of university personnel and students. The subsystem’s level of usability and acceptability was appreciated by the users that expressed a high level of experience with mobile apps (Figure 9, details in [131]).
A thorough study regarding the adaptive positioning of the information displayed by the in-vehicle system onto the windshield, based on the automatic detection of the drivers’ head orientation was previously performed in [126]. With the purpose of providing the driver with the information of interest, while focusing on the road at all times, we performed a usability testing experiment of the proposed visualization system, with a sample of 25 people, aged between 19 and 34 years, with almost 68% males. We found that users preferred a 20/25 cm sized display, positioned in the central area horizontally, combined with the middle/low area of the windshield vertically, and a black and white projector. Details on the entire usability study are presented in our work [125].
While user testing of components employed a scenario-based approach, the heuristic evaluation provides a distinct way of evaluation, which is complementary to user testing and focuses on identifying problems of the design, with respect to the formal guidelines [132]. At the core of a heuristic analysis lies the expertise of a human engineer [133]. In the current development phase, the in-vehicle system was subjected to heuristic evaluation holistically, in the sense that it was evaluated with respect to a set of usability heuristics by a set of three evaluators. They were introduced to the system and a typical usage scenario, by presenting them various steps that can be undertaken when using the system in order to perform some in-vehicle tasks, such as planning the departure time of a trip having knowledge of the future local weather and illumination conditions and possible hazards, getting a musical track recommendation based on their emotional/alertness status and the driving conditions, and checking their phone notifications that are updated only when it is considered safe to do so.
The ergonomic criteria that were taken into consideration for evaluation are presented in Table 1, along with the performance of the system. We have compared our system to the guidelines about HMI design for automated driving systems, specified in [132]. We have selected 15 out of 20 guidelines that fit our type of system which does not handle automated driving. We described in Table 1 how our system complies or does not comply to these rules. These guidelines are following the ISO 9241 (Ergonomics of human-system interaction—Part 11: Usability: Definitions and concepts. https://www.iso.org/obp/ui/#iso:std:iso:9241:-11:ed-2:v1:en, accessed on 1 July 2021) standard which specifies that the usability measures “the extent to which a product can be used by specified users to achieve specific goals with effectiveness (can you achieve the goal?), efficiency (how many resources do you consume to achieve the goal?) and satisfaction (that is the quality of your experience when using the system to achieve your goals?) in a specified context of use”.
The current heuristic testing of the in-vehicle system is not supposed to replace usability testing with heterogeneous participant samples, but merely to provide a basis for further thorough evaluation of the in-vehicle system. By means of the current evaluation of the system, we are able to devise further plans for empirical testing, in order to identify issues that may have been overlooked at this point. A critical evaluation of the system with respect to strengths, weaknesses, opportunities and threats is detailed in Table 2.
5. Conclusions
We tackled the problem of designing a useful, safe, supportive, and comfortable environment for the driver and passengers in the “digital car-sphere”, composed of the vehicle, various sensors, personal mobile and/or wearable devices. In this respect, we proposed a system that departs from the conventional in-vehicle interface, in the sense that the entire in-vehicle digital space is tackled as an interface for the intelligent digital environment. The system relies on various onboard or outboard sensors (speed, pulse, CMOS etc.), devices (smart phone, smart watch, tablet etc.), and systems (laptop with LeapMotion, MYO etc.), which gather, integrate, and process data, providing in return relevant information and proactive interaction with the driver, passengers or other systems.
Intending to identify the challenging issues faced by the driver, we aimed to properly define the problem of integrating smart driving interface components which process different categories of information, relying on Design Thinking [72] principles. Consequently, we proposed suitable solutions by focusing on designing an in-vehicle GUI that has to be useful, effective and which bring enjoyable user experience. Moreover, as only the relevant information is presented to the driver at a time we argue that this will have a positive effect on the safety of driving. From an implementation point-of-view we relied heavily on open source or free libraries/APIs/SDKs such as MapBox API, SunCalc library, OpenWeather API, YouTube Player API, Beyond Reality Face SDK, FaceApi, CMUSphinx Open-Source Speech Recognition, LeapMotion SDK, etc.
A typical use case scenario for the system develops as the driver engages the in-vehicle activities, while the intelligent in-vehicle system tracks its actions, supporting adaptation to the ongoing tasks and enhancing the driver experience. The system setup considers four main components: data, information, interaction, and autonomy. The data consists of raw values collected together from the entire driving environment (in- or out-vehicle), which are further classified into several categories, namely Driving, Wellness, Social. The multi-modal interface of the system incorporates different types of interactions tailored to the user’s perceptual senses and to the driving context. The Intelligent digital environment provides continuous feedback as a consequence of driver/passenger actions and other in- or -out vehicle information inferred from the collected data.
Previous efforts in the development of the system were directed towards incorporating audio and gestural interaction within an in-vehicle system meant to foster driver’s attentiveness, coupled with investigating the use of augmented reality in order to enhance the data visualization inside a smart vehicle [125,126,130,131]. The usability of the referred components was assessed by user-based studies, in a controlled laboratory environment meant to simulate the in-vehicle space. The system proposed in this paper incorporates and extends those components, offering a functional complex in-vehicle system, which uses multi-modal interaction that assists the user in the driving task. The driver, who is at the center of the system, is interacting with the system by means of various modalities. Some interactions are voluntary, such as touch input, voice, and gesture commands. On the other hand, the interaction may also be involuntary, in the form of the system reading the driver’s facial expressions, hand gestures, or inferring the emotional state (for example inferring stress from pulse data, and tiredness from yawning and abnormal blinking).
The system was evaluated according to guidelines especially defined for the evaluation of human-machine interfaces in the context of automated vehicles. A SWOT analysis is also presented, revealing strengths and weaknesses of the current in-vehicle system proposal. Thorough usability testing will be employed as future work, as soon as pandemic related conditions will allow for selecting a relevant sample of users to test the system in the laboratory setting. Further development of the system will be targeted to secure the system against unwanted access by third parties.
Author Contributions
Conceptualization, E.B. (Emanuela Bran), E.B. (Elena Bautu), C.M.P., D.F.S. and D.M.P.; methodology, E.B. (Emanuela Bran), E.B. (Elena Bautu) and C.M.P.; software, E.B. (Emanuela Bran), E.B. (Elena Bautu), C.M.P., D.F.S. and D.M.P.; validation, E.B. (Emanuela Bran), and D.M.P.; formal analysis, E.B. (Emanuela Bran), C.M.P. and E.B. (Elena Bautu); investigation, E.B. (Emanuela Bran) and E.B. (Elena Bautu); resources, D.M.P.; data curation, E.B. (Emanuela Bran); writing—original draft preparation, E.B. (Emanuela Bran), E.B. (Elena Bautu), C.M.P., D.F.S. and D.M.P.; writing—review and editing, E.B. (Emanuela Bran) and E.B. (Elena Bautu); visualization, E.B. (Emanuela Bran); supervision, D.M.P.; project administration, D.M.P.; funding acquisition, D.M.P. All authors have read and agreed to the published version of the manuscript.
Funding
This research was funded by the Romanian Ministry of Research and Innovation, CCCDI-UEFISCDI, project number PN-III-P1-1.2-PCCDI-2017-0917, contract no. 21PCCDI/2018, within PNCDI III, project P2, “Efficient communications based on smart devices for in-car augmented reality interactive applications”.
Acknowledgments
We thank the anonymous reviewers for their comments and insights that significantly improved our paper.
Conflicts of Interest
The authors declare no conflict of interest.
References
- Arena, F.; Pau, G.; Severino, A. An overview on the current status and future perspectives of smart cars. Infrastructures 2020, 5, 53. [Google Scholar] [CrossRef]
- Trubia, S.; Severino, A.; Curto, S.; Arena, F.; Pau, G. Smart Roads: An Overview of What Future Mobility Will Look Like. Infrastructures 2020, 5, 107. [Google Scholar] [CrossRef]
- Seiberth, G.; Gründinger, W. Data-driven business models in connected cars, mobility services & beyond. BVDW Res. 2018, 1, 18. [Google Scholar]
- Rijcken, C. Rainforests of wearables and insideables. In Pharmaceutical Care in Digital Revolution; Academic Press: Cambridge, MA, USA, 2019; pp. 107–117. [Google Scholar]
- Gheran, B.F.; Vatavu, R.D. From controls on the steering wheel to controls on the finger: Using smart rings for in-vehicle interactions. In Companion Publication of the 2020 ACM Designing Interactive Systems Conference; Massachusetts Institute of Technology: Cambridge, MA, USA, 2020; pp. 299–304. [Google Scholar]
- Pelliccione, P.; Knauss, E.; Ågren, S.M.; Heldal, R.; Bergenhem, C.; Vinel, A.; Brunnegård, O. Beyond connected cars: A systems of systems perspective. Sci. Comput. Program. 2020, 191, 102414. [Google Scholar] [CrossRef]
- Telang, S.; Chel, A.; Nemade, A.; Kaushik, G. Intelligent Transport System for a Smart City. In Security and Privacy Applications for Smart City Development; Springer: Cham, 2021; pp. 171–187. [Google Scholar]
- Eiza, M.H.; Cao, Y.; Xu, L. Toward Sustainable and Economic Smart Mobility: Shaping the Future of Smart Cities; WSPC: Casper, WY, USA, 2020. [Google Scholar]
- Ahram, T.; Karwowski, W.; Vergnano, A.; Leali, F.; Taiar, R. Intelligent Human Systems Integration. In Proceedings of the 3rd International Conference on Intelligent Human Systems Integration (IHSI 2020): Integrating People and Intelligent Systems, Modena, Italy, 19–21 February 2020; Springer Nature: Cham, Switzerland, 2020. [Google Scholar]
- Nischak, F.; Hanelt, A. Ecosystem Change in the Era of Digital Innovation–A Longitudinal Analysis and Visualization of the Automotive Ecosystem. In Proceedings of the ICIS 2019 Proceedings, Munich, Germany, 15–18 December 2019; ISBN 978-0-9966831-9-7. [Google Scholar]
- Uddin, H.; Gibson, M.; Safdar, G.A.; Kalsoom, T.; Ramzan, N.; Ur-Rehman, M.; Imran, M.A. IoT for 5G/B5G applications in smart homes, smart cities, wearables and connected cars. In Proceedings of the 2019 IEEE 24th International Workshop on Computer Aided Modeling and Design of Communication Links and Networks (CAMAD), Limassol, Cyprus, 23 June 2019; pp. 1–5. [Google Scholar]
- Kuoch, S.K.; Nowakowski, C.; Hottelart, K.; Reilhac, P.; Escrieut, P. Designing an Intuitive Driving Experience in a Digital World. Automot. Eng. 2018. preprint. [Google Scholar] [CrossRef]
- Budaker, B.; Geiger, M.; Fernandes, K. Development of smart interior systems for connected cars. In Internationales Stuttgarter Symposium; Springer Vieweg: Wiesbaden, Germany, 2018; pp. 1265–1276. [Google Scholar]
- Perelló, J.R.; García, A. A case study of cooperative design on integrated smart-car systems: Assessing drivers’ experience. In International Conference on Cooperative Design, Visualization and Engineering; Springer: Cham, Switzerland, 2017; pp. 202–206. [Google Scholar]
- Broström, R.; Engström, J.; Agnvall, A.; Markkula, G. Towards the next generation intelligent driver information system (IDIS): The Volvo car interaction manager concept. In Proceedings of the 2006 ITS World Congress, London, UK, 8–12 October 2006; Volume 32. [Google Scholar]
- Han, J.; Kim, H.; Heo, S.; Lee, N.; Kang, D.; Oh, B.; Kim, K.; Yoon, W.; Byun, J.; Kim, D. GS1 Connected Car: An Integrated Vehicle Information Platform and Its Ecosystem for Connected Car Services based on GS1 Standards. In Proceedings of the 2018 IEEE Intelligent Vehicles Symposium (IV), Changshu, China, 26–30 June 2018; pp. 367–374. [Google Scholar]
- Lipson, H.; Kurman, M. Driverless: Intelligent Cars and the Road ahead; Mit Press: Cambridge, MA, USA, 2016. [Google Scholar]
- Großwindhager, B.; Rupp, A.; Tappler, M.; Tranninger, M.; Weiser, S.; Aichernig, B.K.; Boano, C.A.; Horn, M.; Kubin, G.; Mangard, S.; et al. Dependable internet of things for networked cars. Int. J. Comput. 2017, 16, 226–237. [Google Scholar] [CrossRef]
- Vörös, F.; Tompos, Z.; Kovács, B. Examination of car navigation systems and UX designs–suggestion for a new interface. Proc. Int. Cartogr. Assoc 2019, 2, 139. [Google Scholar] [CrossRef]
- Kazmi, S.A.; Dang, T.N.; Yaqoob, I.; Ndikumana, A.; Ahmed, E.; Hussain, R.; Hong, C.S. Infotainment enabled smart cars: A joint communication, caching, and computation approach. IEEE Trans. Veh. Technol. 2019, 68, 8408–8420. [Google Scholar] [CrossRef]
- Pandit, S.; Fitzek, F.H.; Redana, S. Demonstration of 5G connected cars. In Proceedings of the 2017 14th IEEE Annual Consumer Communications & Networking Conference (CCNC), Las Vegas, NV, USA, 8–11 January 2017; pp. 605–606. [Google Scholar]
- Giust, F.; Sciancalepore, V.; Sabella, D.; Filippou, M.C.; Mangiante, S.; Featherstone, W.; Munaretto, D. Multi-access edge computing: The driver behind the wheel of 5G-connected cars. IEEE Commun. Stand. Mag. 2018, 2, 66–73. [Google Scholar] [CrossRef]
- Uhlir, D.; Sedlacek, P.; Hosek, J. Practial overview of commercial connected cars systems in Europe. In Proceedings of the 2017 9th International Congress on Ultra Modern Telecommunications and Control Systems and Workshops (ICUMT), Munich, Germany, 6–8 November 2017; pp. 436–444. [Google Scholar]
- Marosi, A.C.; Lovas, R.; Kisari, Á.; Simonyi, E. January. A novel IoT platform for the era of connected cars. In Proceedings of the 2018 IEEE International Conference on Future IoT Technologies (Future IoT), Eger, Hungary, 18–19 January 2018; pp. 1–11. [Google Scholar]
- Jiang, T.; Fang, H.; Wang, H. Blockchain-Based Internet of Vehicles: Distributed Network Architecture and Performance Analysis. IEEE Internet Things J. 2018, 6, 4640–4649. [Google Scholar] [CrossRef]
- Xu, W.; Zhou, H.; Cheng, N.; Lyu, F.; Shi, W.; Chen, J.; Shen, X. Internet of vehicles in big data era. IEEE J. Autom. Sin. 2017, 5, 19–35. [Google Scholar] [CrossRef]
- Zhdanenko, O.; Liu, J.; Torre, R.; Mudriievskiy, S.; Salah, H.; Nguyen, G.T.; Fitzek, H.F. Demonstration of mobile edge cloud for 5g connected cars. In Proceedings of the 2019 16th IEEE Annual Consumer Communications & Networking Con-ference (CCNC), Las Vegas, NV, USA, 11–14 January 2019; pp. 1–2. [Google Scholar]
- Ma, Z.; Zhang, J.; Guo, Y.; Liu, Y.; Liu, X.; He, W. An Efficient Decentralized Key Management Mechanism for VANET With Blockchain. IEEE Trans. Veh. Technol. 2020, 69, 5836–5849. [Google Scholar] [CrossRef]
- Ayaz, F.; Sheng, Z.; Tian, D.; Leung, V.C. Blockchain-enabled security and privacy for Internet-of-Vehicles. In Internet of Vehicles and its Applications in Autonomous Driving; Springer: Cham, Switzerland, 2021; pp. 123–148. [Google Scholar]
- Hernandez-Oregon, G.; Rivero-Angeles, M.E.; Chimal-Eguía, J.C.; Campos-Fentanes, A.; Jimenez-Gallardo, J.G.; Es-tevez-Alva, U.O.; Juarez-Gonzalez, O.; Rosas-Calderon, P.O.; Sandoval-Reyes, S.; Menchaca-Mendez, R. Performance analysis of V2V and V2I LiFi communication systems in traffic lights. Wirel. Commun. Mobile Comput. 2019, 2019, 4279683. [Google Scholar] [CrossRef] [Green Version]
- Spahiu, C.S.; Stanescu, L.; Brezovan, M.; Petcusin, F. LiFi Technology Feasibility Study for Car-2-Car Communication. In Proceedings of the 21th International Carpathian Control Conference (ICCC), High Tatras, Slovakia, 27–29 October 2020; pp. 1–5. [Google Scholar]
- Burkacky, O.; Deichmann, J.; Doll, G.; Knochenhauer, C. Rethinking Car Software and Electronics Architecture; McKinsey & Co.: New York, NY, USA, 2019. [Google Scholar]
- Yang, G.; Ahmed, M.; Gaweesh, S.; Adomah, E. Connected vehicle real-time traveler information messages for freeway speed harmonization under adverse weather conditions: Trajectory level analysis using driving simulator. Accid. Anal. Prev. 2020, 146, 105707. [Google Scholar] [CrossRef]
- Jagielski, M.; Jones, N.; Lin, C.W.; Nita-Rotaru, C.; Shiraishi, S. Threat detection for collaborative adaptive cruise control in connected cars. In Proceedings of the 11th ACM Conference on Security & Privacy in Wireless and Mobile Networks, Stockholm, Sweden, 18–20 June 2018; pp. 184–189. [Google Scholar]
- Lee, E.-K.; Gerla, M.; Pau, G.; Lee, U.; Lim, J.-H. Internet of Vehicles: From intelligent grid to autonomous cars and vehicular fogs. Int. J. Distrib. Sens. Netw. 2016, 12, 1550147716665500. [Google Scholar] [CrossRef]
- Gerla, M.; Lee, E.-K.; Pau, G.; Lee, U. Internet of vehicles: From intelligent grid to autonomous cars and vehicular clouds. In IEEE World Forum on Internet of Things (WF-IoT); IEEE: Piscataway, NJ, USA, 2014; pp. 241–246. [Google Scholar] [CrossRef]
- Bosler, M.; Jud, C.; Herzwurm, G. Platforms and Ecosystems for Connected Car Services. In Proceedings of the 9th International Workshop Software Ecosystem IWSECO, Espoo, Finland, 29 November 2017; pp. 16–27. [Google Scholar]
- Zhou, H.; Xu, W.; Chen, J.; Wang, W. Evolutionary V2X Technologies toward the Internet of Vehicles: Challenges and Opportunities. Proc. IEEE 2020, 108, 308–323. [Google Scholar] [CrossRef]
- Mirnig, N.; Perterer, N.; Stollnberger, G.; Tscheligi, M. Three strategies for autonomous car-to-pedestrian communication: A survival guide. In Proceedings of the Companion of the 2017 ACM/IEEE International Conference on Human-Robot Interaction, Vienna, Austria, 6–9 March 2017; pp. 209–210. [Google Scholar]
- Bai, H.; Shen, J.; Wei, L.; Feng, Z. Accelerated Lane-Changing Trajectory Planning of Automated Vehicles with Vehicle-to-Vehicle Collaboration. J. Adv. Transp. 2017, 2017, 8132769. [Google Scholar] [CrossRef] [Green Version]
- Hock, P.; Benedikter, S.; Gugenheimer, J.; Rukzio, E. Carvr: Enabling in-car virtual reality entertainment. In Proceedings of the 2017 CHI Conference on Human Factors in Computing Systems, Denver, CO, USA, 6–11 May 2017; pp. 4034–4044. [Google Scholar]
- Malinverno, M.; Mangues-Bafalluy, J.; Casetti, C.E.; Chiasserini, C.F.; Requena-Esteso, M.; Baranda, J. An Edge-Based Framework for Enhanced Road Safety of Connected Cars. IEEE Access 2020, 8, 58018–58031. [Google Scholar] [CrossRef]
- Bierzynski, K.; Escobar, A.; Eberl, M. Cloud, fog and edge: Cooperation for the future? In Proceedings of the 2017 Second International Conference on Fog and Mobile Edge Computing (FMEC), Valencia, Spain, 8–11 May 2017; pp. 62–67. [Google Scholar]
- Ghosh, S.; Mukherjee, A.; Ghosh, S.K.; Buyya, R. Mobi-iost: Mobility-aware cloud-fog-edge-iot collaborative framework for time-critical applications. IEEE Trans. Netw. Sci. Eng. 2019, 7, 2271–2285. [Google Scholar] [CrossRef] [Green Version]
- Vallati, M. Centralised Versus Decentralised Traffic Optimisation of Urban Road Networks: A Simulation Study. In Proceedings of the 2020 IEEE 5th International Conference on Intelligent Transportation Engineering (ICITE), Beijing, China, 11–13 September 2020; pp. 319–325. [Google Scholar] [CrossRef]
- Duan, L.; Wei, Y.; Zhang, J.; Xia, Y. Centralized and decentralized autonomous dispatching strategy for dynamic autonomous taxi operation in hybrid request mode. Transp. Res. Part C Emerg. Technol. 2020, 111, 397–420. [Google Scholar] [CrossRef]
- Olaverri-Monreal, C.; Lehsing, C.; Trubswetter, N.; Schepp, C.A.; Bengler, K. In-vehicle displays: Driving information prioritization and visualization. In Proceedings of the 2013 IEEE Intelligent Vehicles Symposium (IV), Gold Coast, Australia, 23–26 June 2013; pp. 660–665. [Google Scholar] [CrossRef]
- Siems-Anderson, A.R.; Walker, C.L.; Wiener, G.; Mahoney, W.P., III; Haupt, S.E. An adaptive big data weather system for surface transportation. Transp. Res. Interdiscip. Perspect. 2019, 3, 100071. [Google Scholar] [CrossRef]
- Kamoun, F.; Chaabani, H.; Outay, F.; Yasar, A.-U. A Survey of Approaches for Estimating Meteorological Visibility Distance under Foggy Weather Conditions. IGI Glob. 2020, 65–92. [Google Scholar] [CrossRef] [Green Version]
- Wang, K.; Zhang, W.; Feng, Z.; Yu, H.; Wang, C. Reasonable driving speed limits based on recognition time in a dynamic low-visibility environment related to fog—A driving simulator study. Accid. Anal. Prev. 2021, 154, 106060. [Google Scholar] [CrossRef]
- Hold-Geoffroy, Y.; Sunkavalli, K.; Hadap, S.; Gambaretto, E.; Lalonde, J.F. Deep outdoor illumination estimation. In Proceedings of the IEEE Conference on Computer Vision and Pattern Recognition, Honolulu, HI, USA, 21–26 July 2017; pp. 7312–7321. [Google Scholar]
- Wood, J.M. Nighttime driving: Visual, lighting and visibility challenges. Ophthalmic Physiol. Opt. 2020, 40, 187–201. [Google Scholar] [CrossRef] [Green Version]
- Pegin, P.; Sitnichuk, E. The Effect of Sun Glare: Concept, Characteristics, Classification. Transp. Res. Procedia 2017, 20, 474–479. [Google Scholar] [CrossRef]
- Li, X.; Cai, B.Y.; Qiu, W.; Zhao, J.; Ratti, C. A novel method for predicting and mapping the occurrence of sun glare using Google Street View. Transp. Res. Part C Emerg. Technol. 2019, 106, 132–144. [Google Scholar] [CrossRef]
- Glaser, S.; Mammar, S.; Dakhlallah, D. Lateral wind force and torque estimation for a driving assistance. IFAC Proc. Vol. 2008, 41, 5688–5693. [Google Scholar] [CrossRef] [Green Version]
- Li, Y.; Xing, L.; Wang, W.; Wang, H.; Dong, C.; Liu, S. Evaluating impacts of different longitudinal driver as-sistance systems on reducing multi-vehicle rear-end crashes during small-scale inclement weather. Accid. Anal. Prev. 2017, 107, 63–76. [Google Scholar] [CrossRef]
- Darwish, T.S.; Bakar, K.A. Fog based intelligent transportation big data analytics in the internet of vehicles environment: Motivations, architecture, challenges, and critical issues. IEEE Access 2018, 6, 15679–15701. [Google Scholar] [CrossRef]
- Hirz, M.; Walzel, B. Sensor and object recognition technologies for self-driving cars. Comput. Des. Appl. 2018, 15, 501–508. [Google Scholar] [CrossRef] [Green Version]
- Krumm, J. Ubiquitous Computing Fundamentals; CRC Press: Boca Raton, FL, USA, 2018. [Google Scholar]
- Brush, A.B. Ubiquitous Computing Field Studies. In Ubiquitous Computing Fundamentals; Chapman and Hall/CRC: London, UK, 2018; pp. 175–216. [Google Scholar]
- Saganowski, S.; Kazienko, P.; Dzieżyc, M.; Jakimów, P.; Komoszyńska, J.; Michalska, W.; Dutkowiak, A.; Polak, A.; Dziadek, A.; Ujma, M. Consumer wearables and affective computing for wellbeing support. arXiv 2020, preprint. arXiv:2005.00093. [Google Scholar]
- El-Gayar, O.F.; Ambati, L.S.; Nawar, N. Wearables, artificial intelligence, and the future of healthcare. In AI and Big Data’s Potential for Disruptive Innovation; IGI Global: Hershey, PA, USA, 2020; pp. 104–129. [Google Scholar]
- Hicks, J.L.; Althoff, T.; Sosic, R.; Kuhar, P.; Bostjancic, B.; King, A.C.; Leskovec, J.; Delp, S.L. Best practices for analyzing large-scale health data from wearables and smartphone apps. NPJ Digit. Med. 2019, 2, 45. [Google Scholar] [CrossRef] [PubMed]
- Lou, M.; Abdalla, I.; Zhu, M.; Wei, X.; Yu, J.; Li, Z.; Ding, B. Highly Wearable, Breathable, and Washable Sensing Textile for Human Motion and Pulse Monitoring. ACS Appl. Mater. Interfaces 2020, 12, 19965–19973. [Google Scholar] [CrossRef] [PubMed]
- Liang, R.H.; Yang, S.Y.; Chen, B.Y. Indexmo: Exploring finger-worn RFID motion tracking for activity recognition on tagged objects. In Proceedings of the 23rd International Symposium on Wearable Computers, London, UK, 19–13 September; pp. 129–134.
- Bandodkar, A.J.; Jia, W.; Yardımcı, C.; Wang, X.; Ramirez, J.; Wang, J. Tattoo-based noninvasive glucose mon-itoring: A proof-of-concept study. Anal. Chem. 2015, 87, 394–398. [Google Scholar] [CrossRef]
- Andrew, T.L. The Future of Smart Textiles: User Interfaces and Health Monitors. Matter 2020, 2, 794–795. [Google Scholar] [CrossRef]
- Kurasawa, S.; Ishizawa, H.; Fujimoto, K.; Chino, S.; Koyama, S. Development of Smart Textiles for Self-Monitoring Blood Glucose by Using Optical Fiber Sensor. J. Fiber Sci. Technol. 2020, 76, 104–112. [Google Scholar] [CrossRef]
- Zhou, Z.; Padgett, S.; Cai, Z.; Conta, G.; Wu, Y.; He, Q.; Zhang, S.; Sun, C.; Liu, J.; Fan, E.; et al. Single-layered ultra-soft washable smart textiles for all-around ballistocardiograph, respiration, and posture monitoring during sleep. Biosens. Bioelectron. 2020, 155, 112064. [Google Scholar] [CrossRef]
- Koyama, S.; Sakaguchi, A.; Ishizawa, H.; Yasue, K.; Oshiro, H.; Kimura, H. Vital Sign Measurement Using Covered FBG Sensor Embedded into Knitted Fabric for Smart Textile. J. Fiber Sci. Technol. 2017, 73, 300–308. [Google Scholar] [CrossRef] [Green Version]
- Sinnapolu, G.; Alawneh, S. Integrating wearables with cloud-based communication for health monitoring and emergency assistance. Internet Things 2018, 1–2, 40–54. [Google Scholar] [CrossRef]
- Betancourt Diaz, N.R. Wearables, Big Data and Design Thinking: Perspectives from the Wellbeing Industry. Available online: https://www.politesi.polimi.it/handle/10589/139431 (accessed on 1 July 2021).
- Lin, F.-R.; Windasari, N.A. Continued use of wearables for wellbeing with a cultural probe. Serv. Ind. J. 2018, 39, 1140–1166. [Google Scholar] [CrossRef]
- Persson, N.-K.; Martinez, J.G.; Zhong, Y.; Maziz, A.; Jager, E.W.H. Actuating Textiles: Next Generation of Smart Textiles. Adv. Mater. Technol. 2018, 3, 1700397. [Google Scholar] [CrossRef]
- Kongahage, D.; Foroughi, J. Actuator Materials: Review on Recent Advances and Future Outlook for Smart Textiles. Fibers 2019, 7, 21. [Google Scholar] [CrossRef] [Green Version]
- Rayes, A.; Salam, S. The things in iot: Sensors and actuators. In Internet of Things from Hype to Reality; Springer: Cham, Switzerland, 2017; pp. 57–77. [Google Scholar]
- Kazeem, O.O.; Akintade, O.O.; Kehinde, L.O. Comparative study of communication interfaces for sensors and actuators in the cloud of internet of things. Int. J. Internet Things 2020, 6, 9–13. [Google Scholar]
- Pawlowski, E.; Pawlowski, K.; Trzcielinska, J.; Trzcielinski, S. Designing and management of intelligent, autonomous environment (IAE): The research framework. In Proceedings of the International Conference on Human Systems Engineering and Design: Future Trends and Applications, Pula, Croatia, 22–24 September 2020; Springer: Cham, Switzerland, 2020; pp. 381–386. [Google Scholar]
- Takayama, L. The motivations of ubiquitous computing: Revisiting the ideas behind and beyond the prototypes. Pers. Ubiquitous Comput. 2017, 21, 557–569. [Google Scholar] [CrossRef]
- Ravenswaaij-Arts, C.M.; Kollee, L.A.; Hopman, J.C.; Stoelinga, G.B.; van Geijn, H.P. Heart rate variability. Ann. Intern. Med. 1993, 118, 436–447. [Google Scholar] [CrossRef]
- Ranjan, Y.; Rashid, Z.; Stewart, C.; Conde, P.; Begale, M.; Verbeeck, D.; Boettcher, S.; Dobson, R.; Folarin, A.; Hyve, T.; et al. RADAR-Base: Open Source Mobile Health Platform for Collecting, Monitoring, and Analyzing Data Using Sensors, Wearables, and Mobile Devices. JMIR mHealth uHealth 2019, 7, e11734. [Google Scholar] [CrossRef] [Green Version]
- Fakhrhosseini, S.M.; Jeon, M. How do angry drivers respond to emotional music? A comprehensive perspective on assessing emotion. J. Multimodal User Interfaces 2019, 13, 137–150. [Google Scholar] [CrossRef] [Green Version]
- Abdi, L.; Ben Abdallah, F.; Meddeb, A. In-Vehicle Augmented Reality Traffic Information System: A New Type of Communication Between Driver and Vehicle. Procedia Comput. Sci. 2015, 73, 242–249. [Google Scholar] [CrossRef] [Green Version]
- Abdi, L.; Meddeb, A. Driver information system: A combination of augmented reality, deep learning and vehicular Ad-hoc networks. Multimed. Tools Appl. 2017, 77, 14673–14703. [Google Scholar] [CrossRef]
- Schipor, O.A.; Vatavu, R.D. Towards Interactions with Augmented Reality Systems in Hyper-Connected Cars. EICS Workshops 2019, 2503, 76–82. [Google Scholar]
- Vögel, H.J.; Süß, C.; Hubregtsen, T.; André, E.; Schuller, B.; Härri, J.; Conradt, J.; Adi, A.; Zadorojniy, A.; Terken, J.; et al. Emotion-awareness for intelligent vehicle assistants: A research agenda. In Proceedings of the 2018 IEEE/ACM 1st International Workshop on Software Engineering for AI in Autonomous Systems (SEFAIAS), Gothenburg, Sweden, 28 May 2018; 2018; pp. 11–15. [Google Scholar]
- Birek, L.; Grzywaczewski, A.; Iqbal, R.; Doctor, F.; Chang, V. A novel Big Data analytics and intelligent technique to predict driver’s intent. Comput. Ind. 2018, 99, 226–240. [Google Scholar] [CrossRef]
- Michalke, T.; Gepperth, A.; Schneider, M.; Fritsch, J.; Goerick, C. Towards a Human-like Vision System for Resource-Constrained Intelligent Cars. In Proceedings of the International Conference on Computer Vision Systems, Berlin, Germany, 11–14 March 2007. [Google Scholar] [CrossRef]
- Davidsson, S.; Alm, H. Context adaptable driver information–Or, what do whom need and want when? Appl. Ergon. 2014, 45, 994–1002. [Google Scholar] [CrossRef]
- McStay, A. Emotional AI: The Rise of Empathic Media; Sage: Thousand Oaks, CA, USA, 2018. [Google Scholar] [CrossRef]
- McStay, A. Emotional AI, soft biometrics and the surveillance of emotional life: An unusual consensus on privacy. Big Data Soc. 2020, 7, 2053951720904386. [Google Scholar] [CrossRef] [Green Version]
- Braun, M.; Schubert, J.; Pfleging, B.; Alt, F. Improving Driver Emotions with Affective Strategies. Multimodal Technol. Interact. 2019, 3, 21. [Google Scholar] [CrossRef] [Green Version]
- Oehl, M.; Ihme, K.; Pape, A.-A.; Vukelić, M.; Braun, M. Affective Use Cases for Empathic Vehicles in Highly Automated Driving: Results of an Expert Workshop. In International Conference on Human-Computer Interaction; Springer: Cham, Switzerland, 2020; pp. 89–100. [Google Scholar] [CrossRef]
- Frison, A.K.; Wintersberger, P.; Riener, A.; Schartmüller, C. Driving Hotzenplotz: A hybrid interface for vehicle control aiming to maximize pleasure in highway driving. In Proceedings of the 9th International Conference on Automotive User Interfaces and Interactive Vehicular Applications, Oldenburg, Germany, 24–27 September 2017; pp. 236–244. [Google Scholar]
- Caon, M.; Demierre, M.; Abou Khaled, O.; Mugellini, E.; Delaigue, P. February. Enriching the user experience of a connected car with quantified self. In International Conference on Intelligent Human Systems Integration; Springer: Cham, Switzerland, 2020; pp. 66–72. [Google Scholar]
- Giraldi, L. The Future of User Experience Design in the Interior of Autonomous Car Driven by AI. In International Conference on Intelligent Human Systems Integration; Springer: Cham, Switzerland, 2020; pp. 46–51. [Google Scholar]
- Lindgren, T.; Fors, V.; Pink, S.; Bergquist, M.; Berg, M. On the way to anticipated car UX. In Proceedings of the 10th Nordic Conference on Human-Computer Interaction, Oslo, Norway, 29 September–3 October 2018; pp. 494–504. [Google Scholar]
- Basu, C.; Yang, Q.; Hungerman, D.; Sinahal, M.; Draqan, A.D. Do you want your autonomous car to drive like you? In Proceedings of the 2017 12th ACM/IEEE International Conference on Human-Robot Interaction, Vienna, Austria, 6–9 March 2017; pp. 417–425. [Google Scholar]
- Paredes, P.E.; Balters, S.; Qian, K.; Murnane, E.L.; Ordóñez, F.; Ju, W.; Landay, J.A. Driving with the fishes: Towards calming and mindful virtual reality experiences for the car. Proc. ACM Interact. Mob. Wearable Ubiquitous Technol. 2018, 2, 1–21. [Google Scholar] [CrossRef]
- Silva, F.; Analide, C. Ubiquitous driving and community knowledge. J. Ambient. Intell. Humaniz. Comput. 2017, 8, 157–166. [Google Scholar] [CrossRef]
- Oehl, M.; Ihme, K.; Bosch, E.; Pape, A.A.; Vukelić, M.; Braun, M. Emotions in the age of automated driving-developing use cases for empathic cars. In Mensch und Computer 2019-Workshopband; Gesellschaft für Informatik: Bonn, Germany, 2019. [Google Scholar]
- Fonsalas, F. Holistic HMI Architecture for Adaptive and Predictive Car Interiors. In Electronic Components and Systems for Automotive Applications; Springer: Cham, Switzerland, 2019; pp. 217–227. [Google Scholar]
- Neuhaus, R.; Laschke, M.; Theofanou-Fülbier, D.; Hassenzahl, M.; Sadeghian, S. Exploring the im-pact of transparency on the interaction with an in-car digital AI assistant. In Proceedings of the 11th International Conference on Automotive User Interfaces and Interactive Vehicular Applications: Adjunct Proceedings, Utrecht, The Netherlands, 21–25 September 2019; pp. 450–455. [Google Scholar]
- Korthauer, A.; Guenther, C.; Hinrichs, A.; Ren, W.; Yang, Y. Watch Your Vehicle Driving at the City: Interior HMI with Augmented Reality for Automated Driving. In Proceedings of the 22nd International Conference on Human-Computer Interaction with Mobile Devices and Services, Oldenburg, Germany, 5–8 October 2020; pp. 1–5. [Google Scholar]
- Liu, H.; Taniguchi, T.; Tanaka, Y.; Takenaka, K.; Bando, T. Visualization of Driving Behavior Based on Hidden Feature Extraction by Using Deep Learning. IEEE Trans. Intell. Transp. Syst. 2017, 18, 2477–2489. [Google Scholar] [CrossRef]
- Dahl, D.A. Multimodal Interaction with W3C Standards; Springer International Publishing: Cham, Switzerland, 2017. [Google Scholar]
- Pesek, M.; Strle, G.; Kavčič, A.; Marolt, M. The Moodo dataset: Integrating user context with emotional and color perception of music for affective music information retrieval. J. New Music. Res. 2017, 46, 246–260. [Google Scholar] [CrossRef]
- Zhang, J.; Wang, B.; Zhang, C.; Xiao, Y.; Wang, M.Y. An EEG/EMG/EOG-Based Multimodal Human-Machine Interface to Real-Time Control of a Soft Robot Hand. Front. Neurorobotics 2019, 13, 7. [Google Scholar] [CrossRef] [Green Version]
- Djamal, E.C.; Fadhilah, H.; Najmurrokhman, A.; Wulandari, A.; Renaldi, F. Emotion brain-computer interface using wavelet and recurrent neural networks. Int. J. Adv. Intell. Inform. 2020, 6, 1–12. [Google Scholar] [CrossRef]
- Nam, C.S.; Nijholt, A.; Lotte, F. Brain–Computer Interfaces Handbook: Technological and Theoretical Advances; CRC Press: Boca Raton, FL, USA, 2018. [Google Scholar]
- Ceccacci, S.; Mengoni, M.; Andrea, G.; Giraldi, L.; Carbonara, G.; Castellano, A.; Montanari, R. A Preliminary Investigation Towards the Application of Facial Expression Analysis to Enable an Emotion-Aware Car Interface. In International Conference on Human-Computer Interaction; Springer: Cham, Switzerland, 2020; pp. 504–517. [Google Scholar]
- Delbouys, R.; Hennequin, R.; Piccoli, F.; Royo-Letelier, J.; Moussallam, M. Music mood detection based on audio and lyrics with deep neural net. arXiv 2018, preprint. arXiv:1809.07276. [Google Scholar]
- Ünal, A.B.; de Waard, D.; Epstude, K.; Steg, L. Driving with music: Effects on arousal and performance. Transp. Res. Part F Traffic Psychol. Behav. 2013, 21, 52–65. [Google Scholar] [CrossRef]
- Amini, R.; Willemsen, M.C.; Graus, M.P. Affective Music Recommender System (MRS): Investigating the Effectiveness and User Satisfaction of different Mood Inducement Strategies. 2019. Available online: https://pure.tue.nl/ws/portalfiles/portal/131839906/Affective_MRS_R._Amini_v1.1.pdf (accessed on 31 June 2021).
- Park, M.; Thom, J.; Mennicken, S.; Cramer, H.; Macy, M. Global music streaming data reveal diurnal and seasonal patterns of affective preference. Nat. Hum. Behav. 2019, 3, 230–236. [Google Scholar] [CrossRef] [PubMed]
- Febriandirza, A.; Chaozhong, W.; Zhong, M.; Hu, Z.; Zhang, H. The Effect of Natural Sounds and Music on Driving Performance and Physiological. Eng. Lett. 2017, 25, 455–463. [Google Scholar]
- Navarro, J.; Osiurak, F.; Gaujoux, V.; Ouimet, M.C.; Reynaud, E. Driving under the influence: How music listening affects driving behaviors. J. Vis. Exp. 2019, 145, e58342. [Google Scholar] [CrossRef]
- Green, P. Crashes Induced by Driver Information Systems and What Can Be Done to Reduce Them (No. 2000-01-C008). Available online: https://citeseerx.ist.psu.edu/viewdoc/download?doi=10.1.1.589.3723&rep=rep1&type=pdf (accessed on 31 June 2021).
- Li, B.; Sano, A. Extraction and Interpretation of Deep Autoencoder-based Temporal Features from Wearables for Forecasting Personalized Mood, Health, and Stress. Proc. ACM Interact. Mob. Wearable Ubiquitous Technol. 2020, 4, 1–26. [Google Scholar] [CrossRef]
- Mikoski, P.; Zlupko, G.; Owens, D.A. Drivers’ assessments of the risks of distraction, poor visibility at night, and safety-related behaviors of themselves and other drivers. Transp. Res. Part F Traffic Psychol. Behav. 2019, 62, 416–434. [Google Scholar] [CrossRef]
- Bran, E.; Bautu, E.; Popovici, D.M. Open Affordable Mixed Reality: A Manifesto. In Proceedings of the 2020 International Conference on Development and Application Systems (DAS), Suceava, Romania, 21–23 May 2020; pp. 177–184. [Google Scholar]
- Augusto, J.C.; Callaghan, V.; Cook, D.; Kameas, A.; Satoh, I. Intelligent environments: A manifesto. Hum. Comput. Inf. Sci. 2013, 3, 1–18. [Google Scholar] [CrossRef] [Green Version]
- Schipor, O.-A.; Vatavu, R.-D.; Vanderdonckt, J. Euphoria: A Scalable, event-driven architecture for designing interactions across heterogeneous devices in smart environments. Inf. Softw. Technol. 2019, 109, 43–59. [Google Scholar] [CrossRef]
- Schipor, O.A.; Vatavu, R.-D. Empirical Results for High-definition Video and Augmented Reality Content De-livery in Hyper-connected Cars. Interact. Comput. 2021, 33, 3–16. [Google Scholar] [CrossRef]
- Bran, E.; Sburlan, D.F.; Popovici, D.M.; Puchianu, C.M.; Băutu, E. In-vehicle Visualization of Data by means of Augmented Reality. Procedia Comput. Sci. 2020, 176, 1487–1496. [Google Scholar] [CrossRef]
- Sburlan, D.F.; Bautu, E.; Puchianu, C.M.; Popovici, D.M. Adaptive Interactive Displaying System for In-Vehicle Use. Procedia Comput. Sci. 2020, 176, 195–204. [Google Scholar] [CrossRef]
- Bran, E.; Bautu, E.; Popovici, D.M.; Braga, V.; Cojuhari, I. Cultural Heritage Interactive Dissemination through Natural Interaction. In Proceedings of the International Conference on Human-Computer Interaction RoCHI, Bucharest, Romania, 17–18 October 2019; pp. 156–161. [Google Scholar]
- Zaiţi, I.-A.; Pentiuc, G.; Vatavu, R.-D. On free-hand TV control: Experimental results on user-elicited gestures with Leap Motion. Pers. Ubiquitous Comput. 2015, 19, 821–838. [Google Scholar] [CrossRef]
- Shao, L. Hand Movement and Gesture Recognition using Leap Motion Controller; Virtual Reality, Course Report. Available online: https://stanford.edu/class/ee267/Spring2016/report_lin.pdf (accessed on 31 June 2021).
- Bautu, E.; Tudose, C.I.; Puchianu, C.M. In-Vehicle System for Adaptive Filtering of Notifications. In Proceedings of the International Conference on Human-Computer Interaction RoCHI, Bucharest, Romania, 17–18 October 2019; pp. 145–151. [Google Scholar]
- Bautu, E.; Puchianu, C.M.; Bran, E.; Sburlan, D.F.; Popovici, D.M. In-Vehicle Software System for Fostering Driver’s Attentiveness. In Proceedings of the 2020 International Conference on Development and Application Systems (DAS), Suceava, Romania, 21–23 May 2020; pp. 151–156. [Google Scholar]
- Naujoks, F.; Wiedemann, K.; Schömig, N.; Hergeth, S.; Keinath, A. Towards guidelines and verification methods for au-tomated vehicle HMIs. Transp. Res. Part F Traffic Psychol. Behav. 2019, 60, 121–136. [Google Scholar] [CrossRef]
- Tan, W.-S.; Liu, D.; Bishu, R. Web evaluation: Heuristic evaluation vs. user testing. Int. J. Ind. Ergon. 2009, 39, 621–627. [Google Scholar] [CrossRef]
Figure 1.
The smart driving interface components.

Figure 2.
Intelligent driving environment layers.

Figure 3.
The Drive panel.

Figure 4.
The Wellness panel.

Figure 5.
Plotting the mean pulse of the driver, while the vertical segments represent the variance.
Figure 5.
Plotting the mean pulse of the driver, while the vertical segments represent the variance.

Figure 6.
The Social panel.

Figure 7.
Multimodal natural interaction of the Smart Driving Interface (I is for input; O is for output).
Figure 7.
Multimodal natural interaction of the Smart Driving Interface (I is for input; O is for output).

Figure 8.
Factors affecting the quality and safety of driving.

Figure 9.
Results on the evaluation of the satisfaction degree of the users regarding the adaptive notification filtering component of the system [131] (percentage of respondents selecting an answer on the Likert scale, 1 for total disagreement, and 5 for total agreement with the questionnaire item; Q5. Interaction with the application requires a high intellectual effort, Q7. The information displayed was difficult to read, Q8. I think that the display responded quite quickly to the information updates).


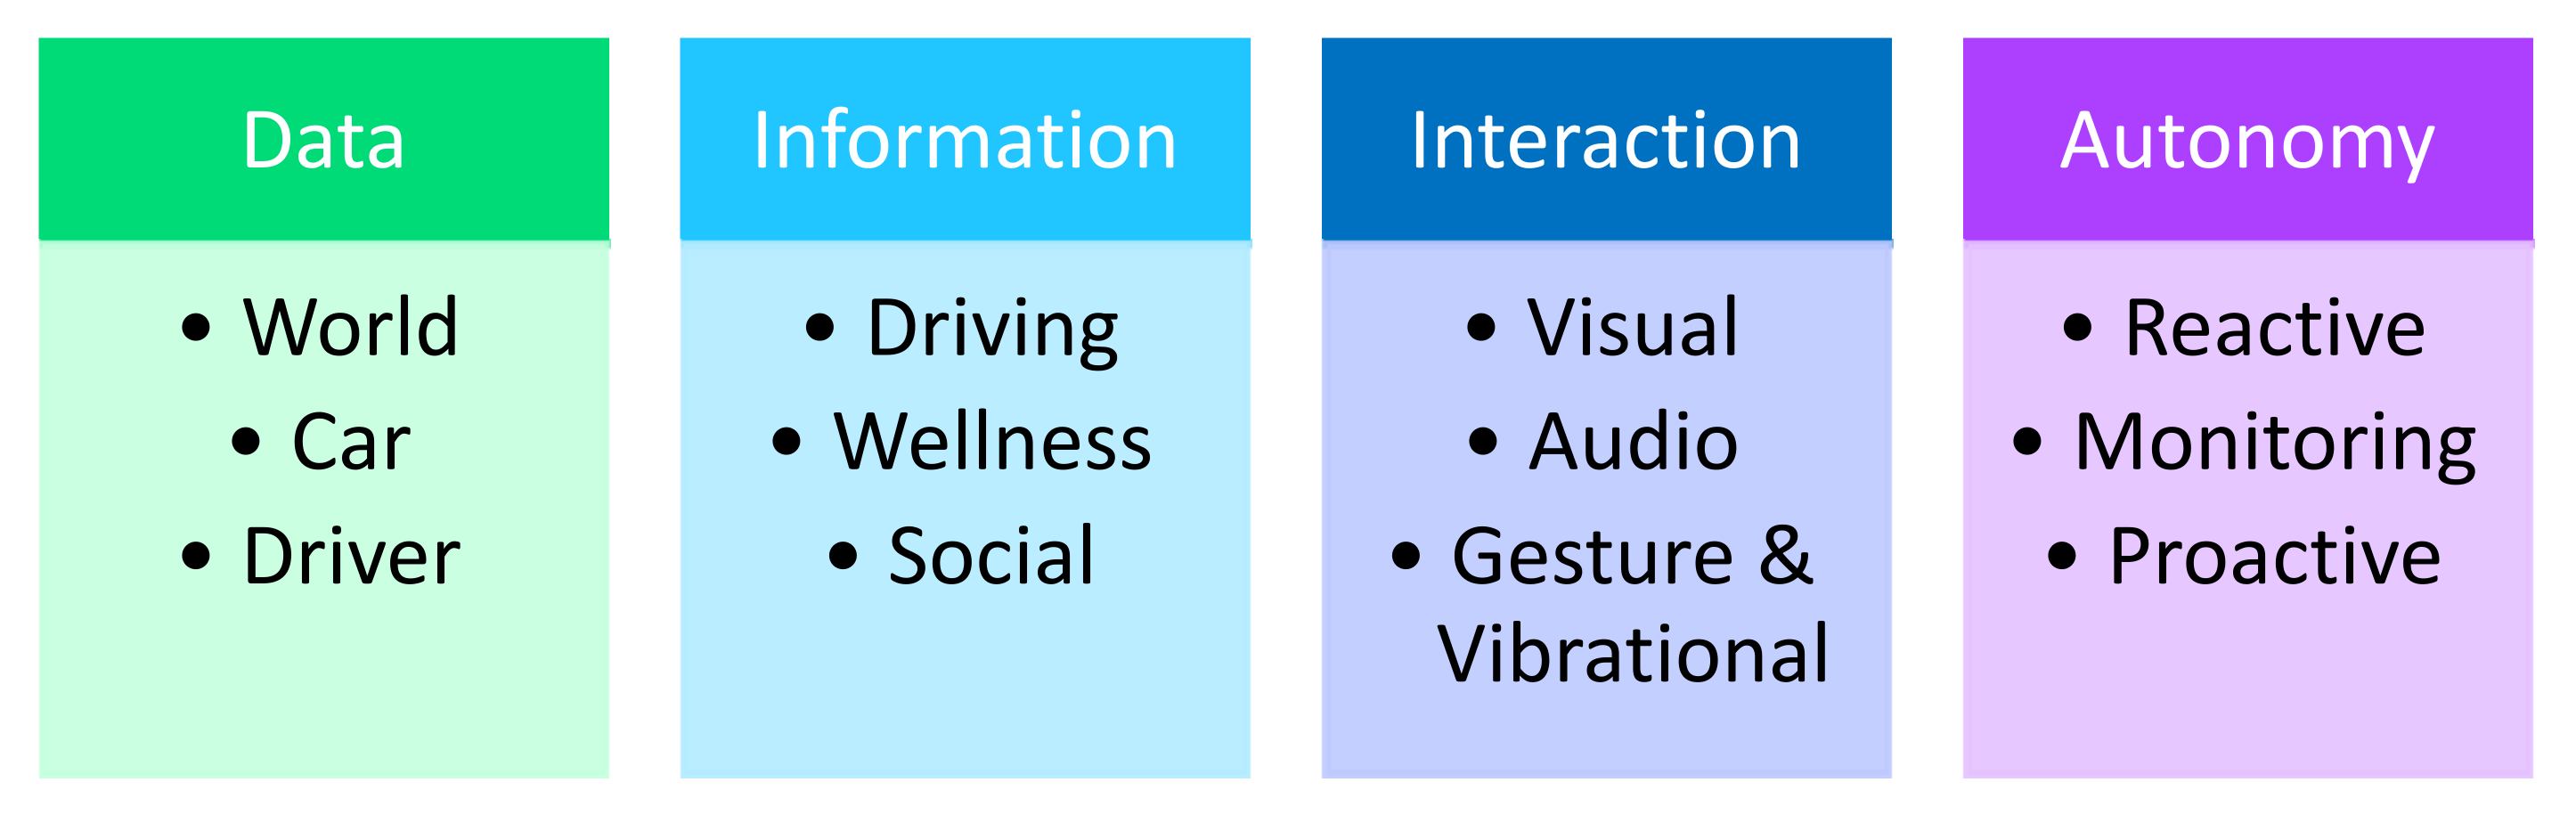
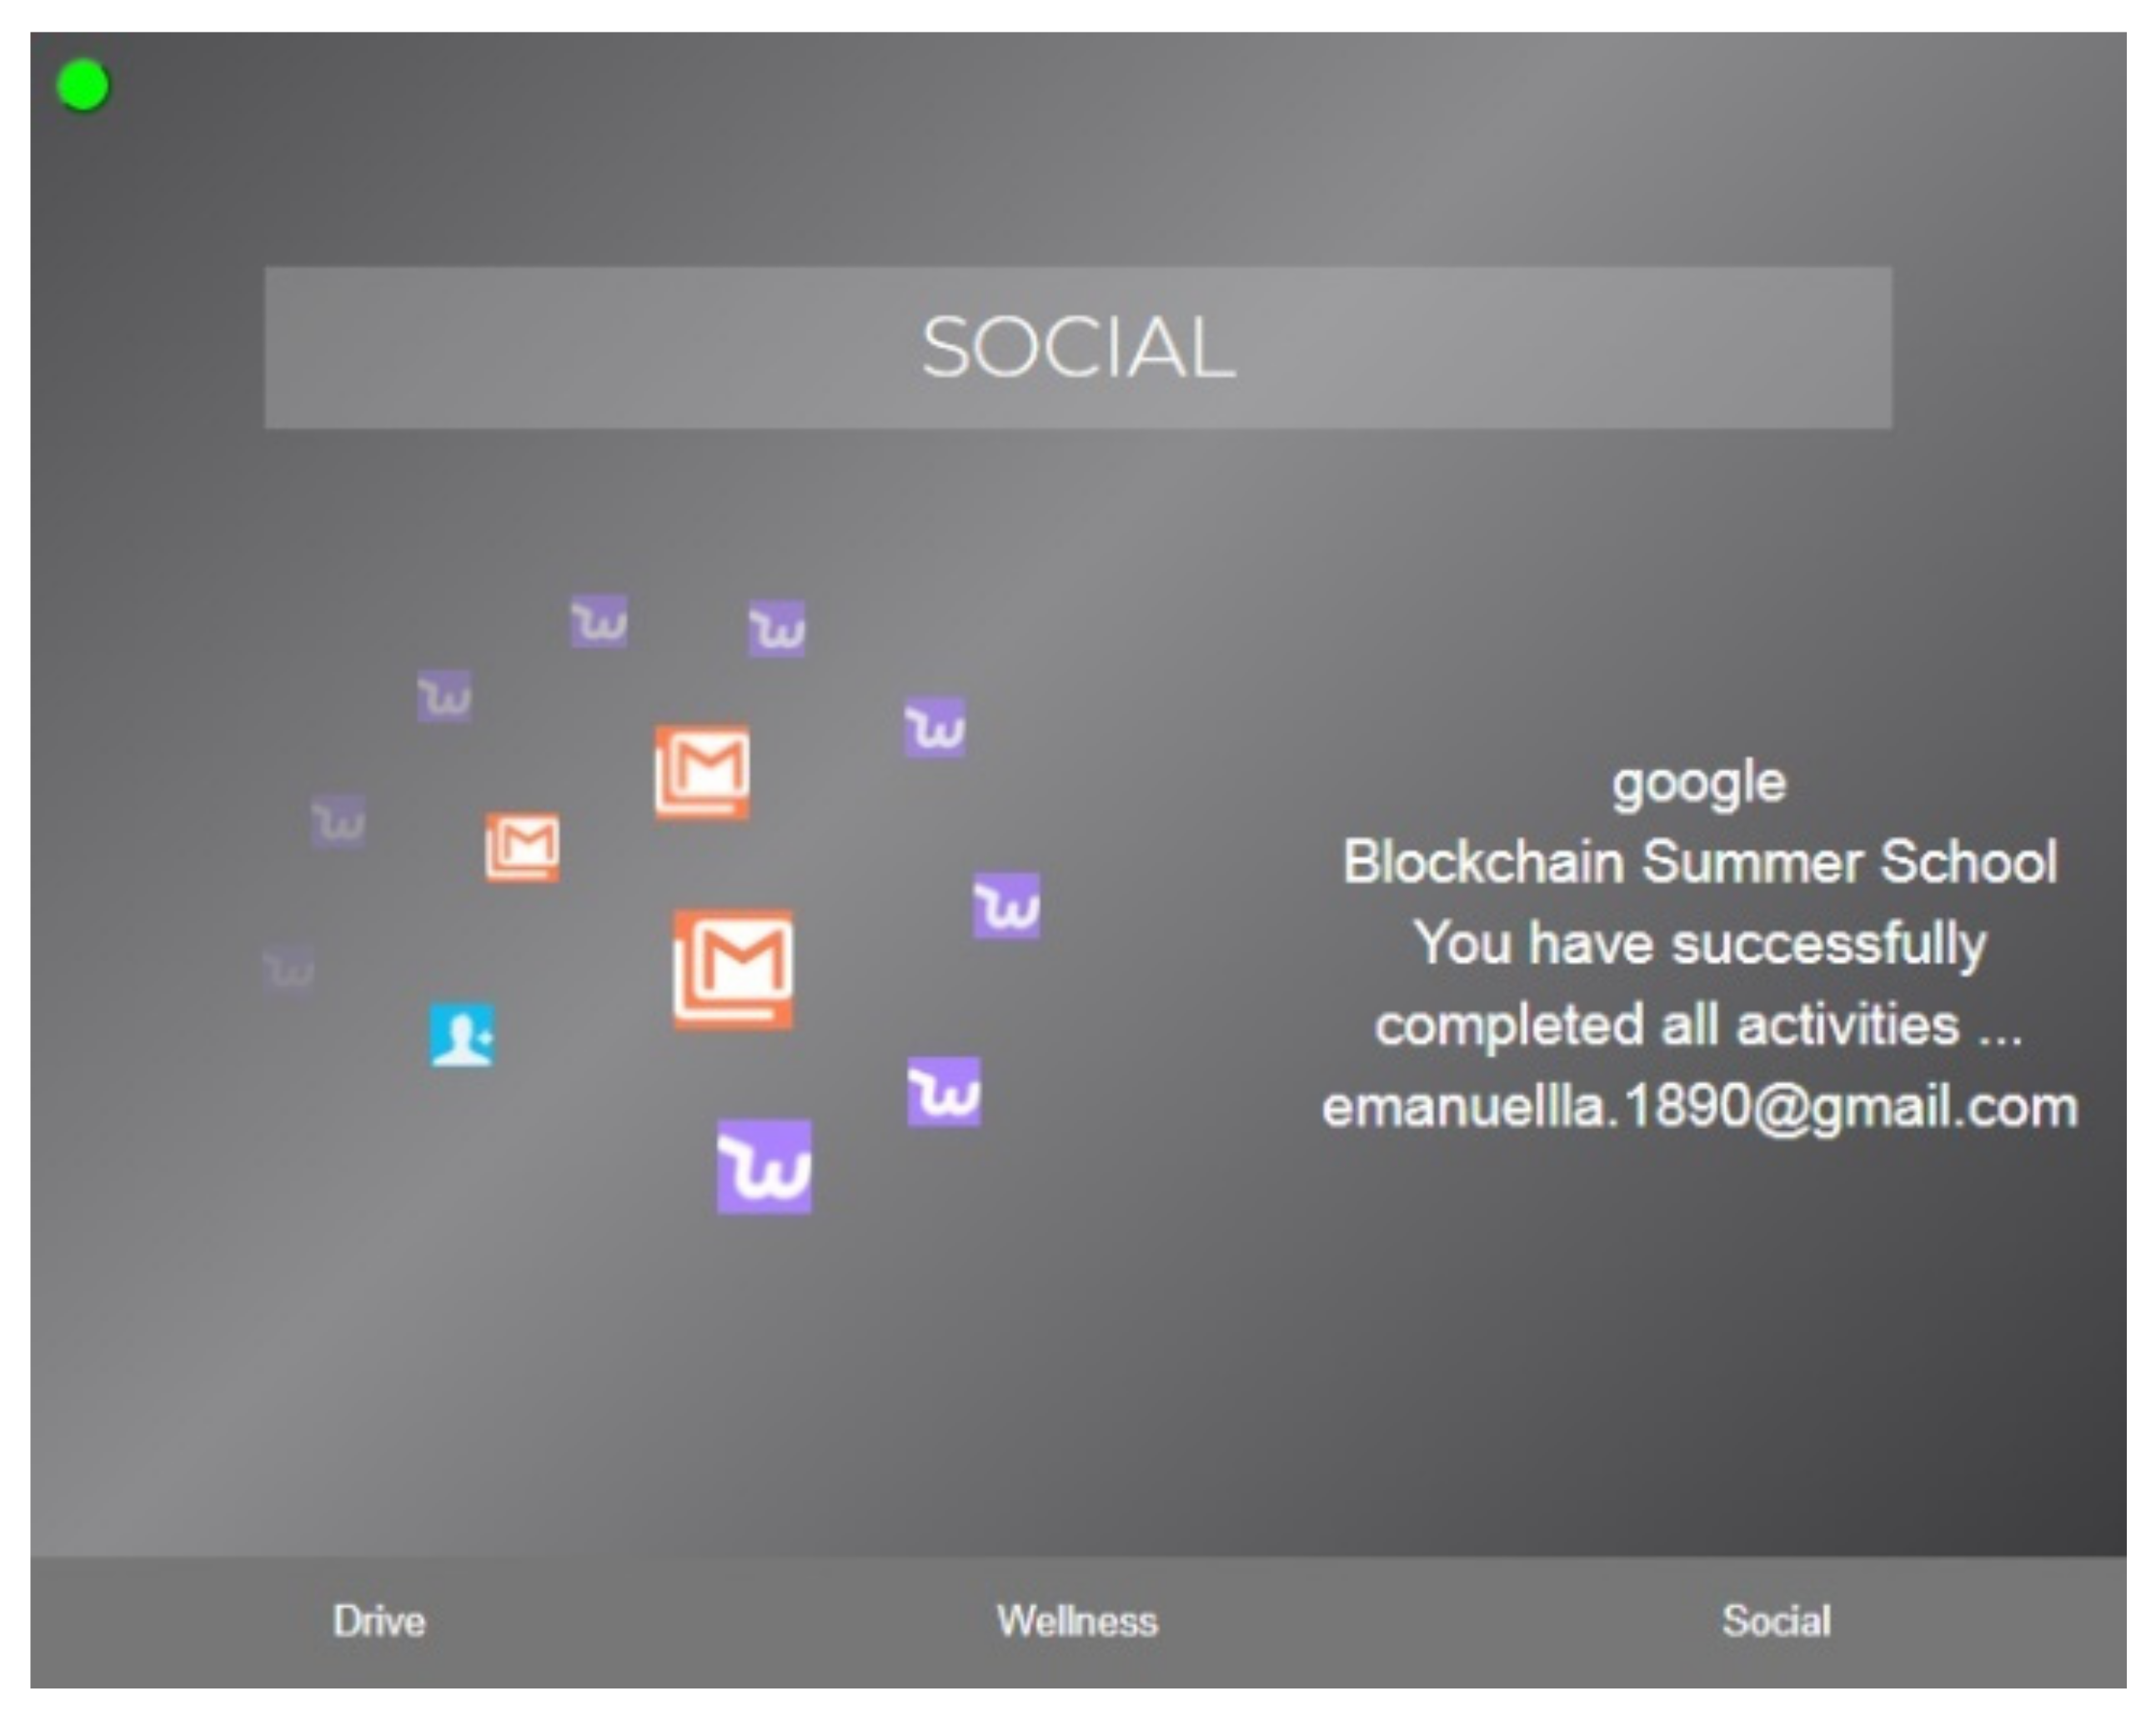
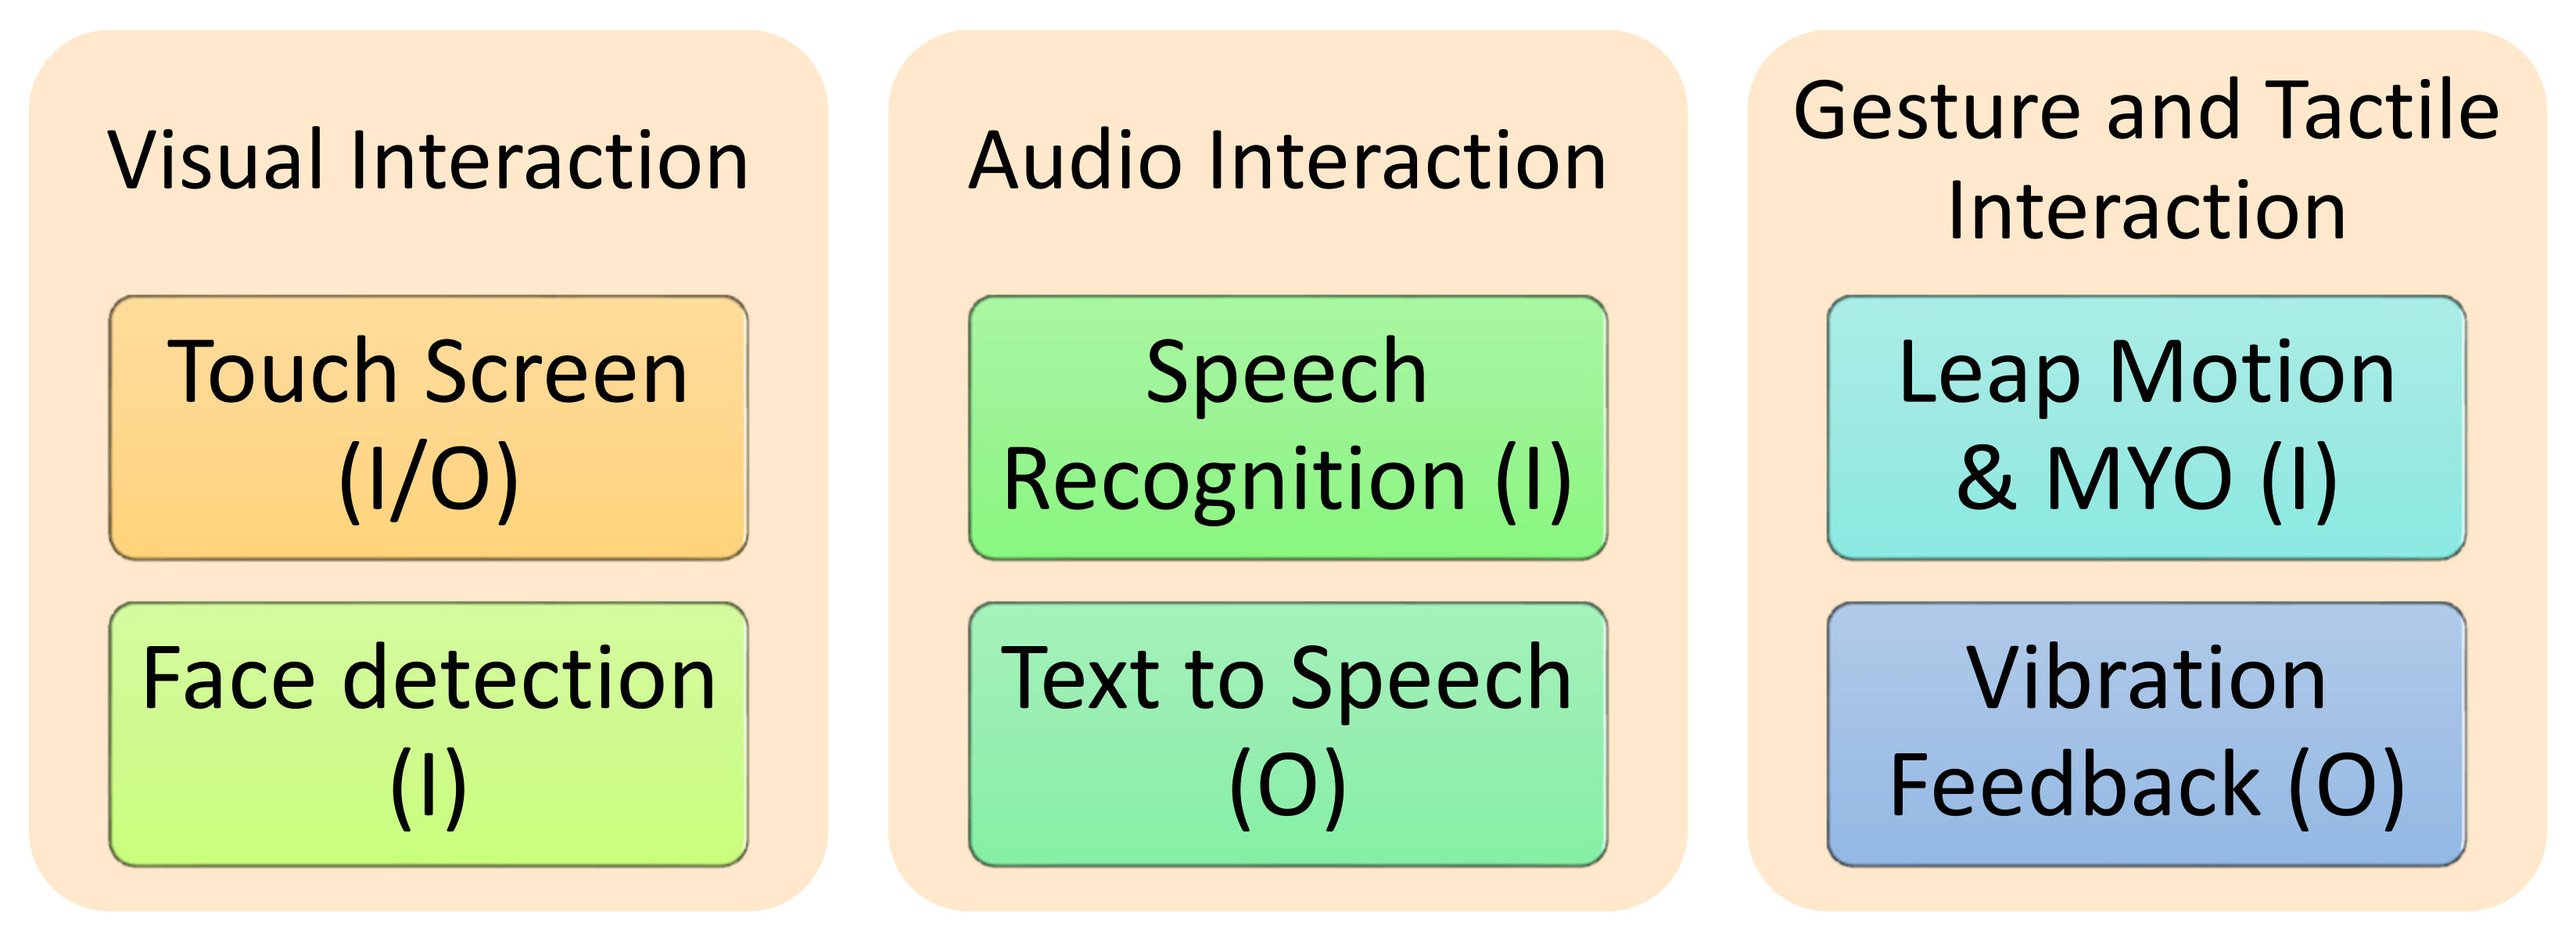
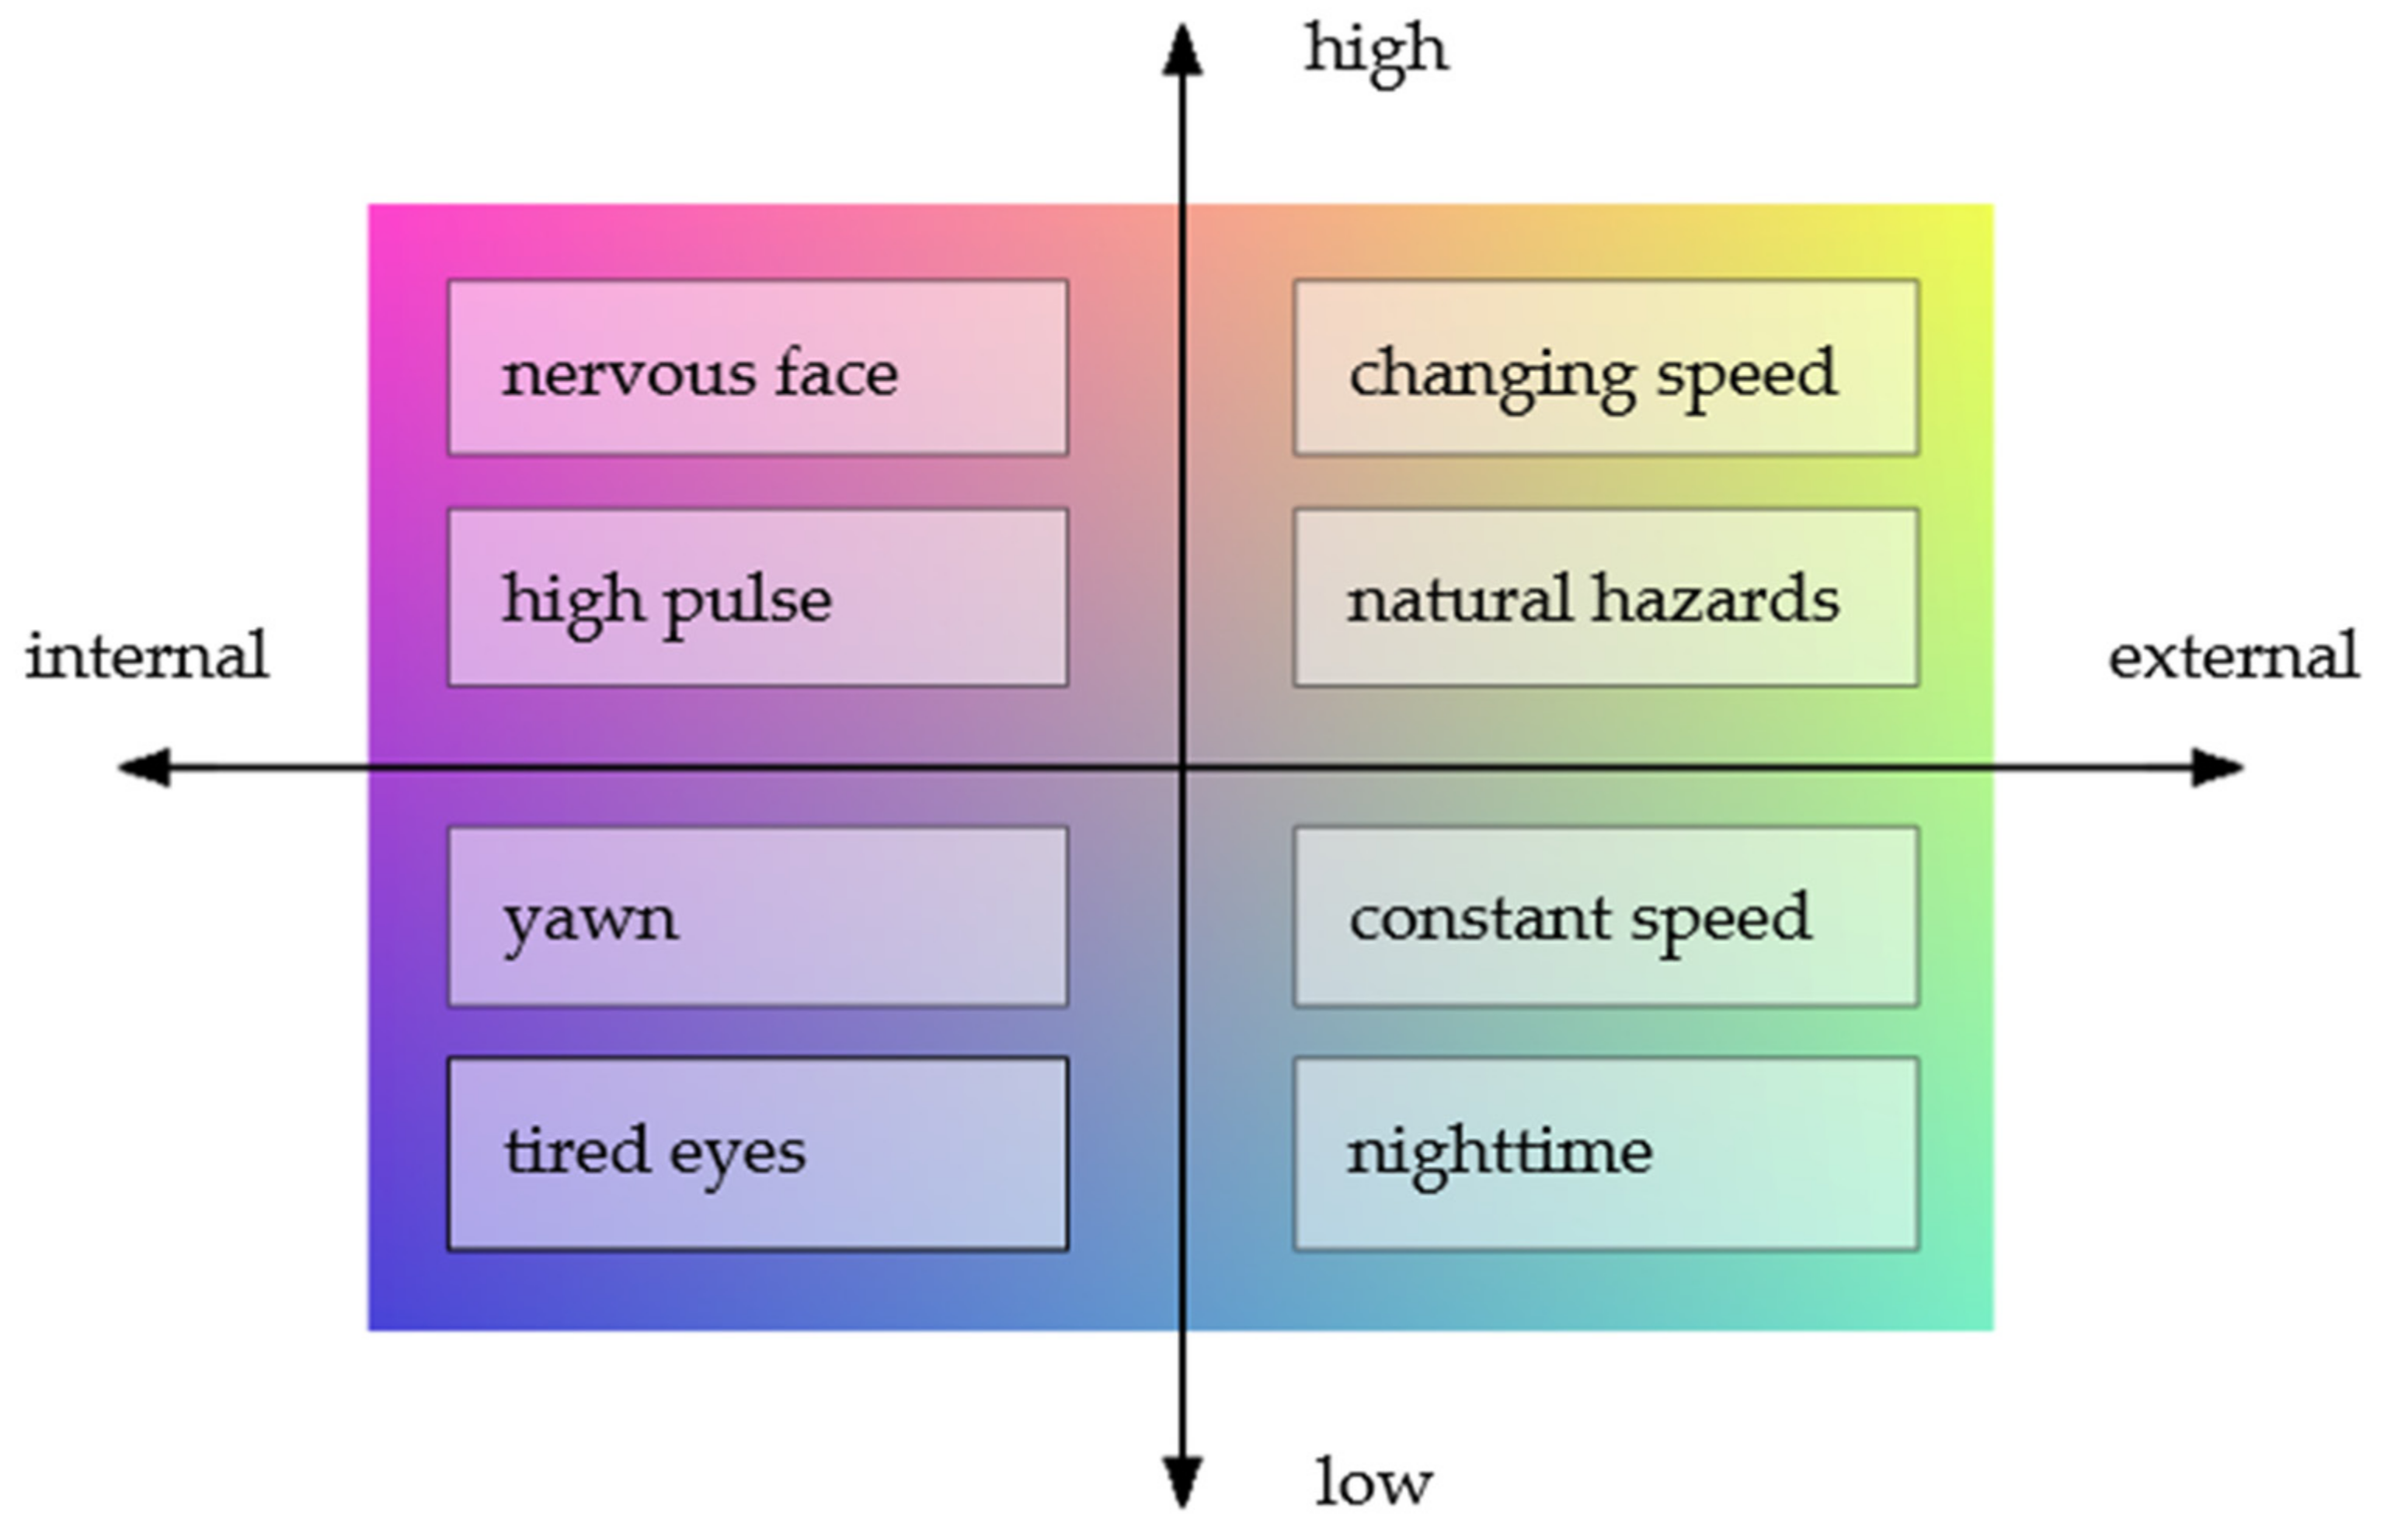
Table 1.
System evaluation for compliance with HMI guidelines for automated vehicles, as proposed in [132].
Table 1.
System evaluation for compliance with HMI guidelines for automated vehicles, as proposed in [132].
| Human Machine Interface Evaluation Guidelines [132] | Compliance | Commentary |
|---|---|---|
| (2) “The system mode should be displayed continuously” | The system displays the inferred state of the driver, instead of showing the state of the system. If notifications are postponed, a pause sign is shown. | In case the system changes state, the interface just switches to either the driving or Wellness panel, where the alert is coming from. |
| (3) “System state changes should be effectively communicated” | Connection state is always on display. Tiredness alerts are actively communicated. Car and road alerts are also actively communicated. | Stress alerts are silent.Most of the changes take place in silence in order not to distract the driver. |
| (5) “HMI elements should be grouped together according to their function to support the perception of mode indicators” | The system groups information into three groups:
| - |
| (7) “The visual interface should have a sufficient contrast in luminance and/or colour between foreground and background” | We chose white and full saturated colors with a 50% lightness, on a dark background | - |
| (8) “Texts (e.g., font types and size of characters) and symbols should be easily readable from the permitted seating position” | - | The text of the notifications on the Social panel is not very short, nor is the font large enough. The system displays notifications when it is considered relatively safe for the driver to check them. |
| (9) “Commonly accepted or standardized symbols should be used to communicate the automation mode. Use of non-standard symbols should be supplemented by additional text explanations or vocal phrase/s” | We chose colored icons to express the state of the driver, the car, and the road. With respect to the state of the driver red means stress, while blue means tiredness. With respect to the information gathered from the car by means of the OBDII interface, we communicate warnings. The weather is shown using conventional icons, while for illumination we use color codes: blue shades for the sky and orange for sunglare hazards. | - |
| (10) “The semantic of a message should be in accordance with its urgency” | Semantics is communicated through text and color. | - |
| (12) “Text messages should be as short as possible” | - | The text body of smart phone notifications is fully displayed. |
| (13) Not more than five colours should be consistently used to code system states (excluding white and black) | Connection state of the system from the server and other components is coded with green for connected and red for disconnected. | We chose to express states for the pulse, tiredness/stress, music through the spectrum of colors between red and blue included. |
| (14) “The colours used to communicate system states should be in accordance with common conventions and stereotypes” | Red is for stress, high pulse, and also for energetic music, hazards. Green for optimal physiological state. Blue is for tiredness, low pulse, calming music. | We do use all colors between red and blue because the spectrum is mapped to each possible value/meaning. Pulse according to continuous intervals, state of alertness fades to green after a red or blue alert. |
| (16) “Auditory output should raise the attention of the driver without startling her/him or causing pain” | We consider as high priority the pleasantness of multimodal outputs of the system. | - |
| (17) “Auditory and vibrotactile output should be adapted to the urgency of the message” | The system only raises alerts for vehicle-related problems, environmental hazards, detected driver tiredness and low environmental stimulation that may lead to sleep. These alerts are actively communicated. | Stress alerts would also be high on the priority list, but we chose not to distract the driver even more than he already is. We just show the Wellness panel with a red facial icon, and silently recommend calming music. He may smile for agreement. |
| (18) “High-priority messages should be multimodal” | The system uses both audio output and vibration output. | - |
| (19) “Warning messages should orient the user towards the source of danger” | Every time an alert is shown, the system switches to the specific information panel. | - |
Table 2.
SWOT analysis of the proposed in-vehicle system.
| Strengths | Weaknesses |
|---|---|
|
|
| Opportunities | Threats |
|
|
Publisher’s Note: MDPI stays neutral with regard to jurisdictional claims in published maps and institutional affiliations. |
© 2021 by the authors. Licensee MDPI, Basel, Switzerland. This article is an open access article distributed under the terms and conditions of the Creative Commons Attribution (CC BY) license (https://creativecommons.org/licenses/by/4.0/).
Share and Cite
MDPI and ACS Style
Bran, E.; Bautu, E.; Sburlan, D.F.; Puchianu, C.M.; Popovici, D.M. Ubiquitous Computing: Driving in the Intelligent Environment. Mathematics 2021, 9, 2649. https://0-doi-org.brum.beds.ac.uk/10.3390/math9212649
AMA Style
Bran E, Bautu E, Sburlan DF, Puchianu CM, Popovici DM. Ubiquitous Computing: Driving in the Intelligent Environment. Mathematics. 2021; 9(21):2649. https://0-doi-org.brum.beds.ac.uk/10.3390/math9212649
Chicago/Turabian StyleBran, Emanuela, Elena Bautu, Dragos Florin Sburlan, Crenguta Madalina Puchianu, and Dorin Mircea Popovici. 2021. "Ubiquitous Computing: Driving in the Intelligent Environment" Mathematics 9, no. 21: 2649. https://0-doi-org.brum.beds.ac.uk/10.3390/math9212649
Note that from the first issue of 2016, this journal uses article numbers instead of page numbers. See further details here.