Article

Pre-Service Primary School Teachers’ Knowledge and Their Interpretation of Students’ Answers to a Measurement Division Problem with Fractions

by
Maximina Márquez
1,
Ceneida Fernández
2,* and
Maria Luz Callejo
2,†
1
Departamento de Ciencias Exactas, Universidad de Los Lagos, Osorno 1046, Chile
2
Departamento de Innovación y Formación Didáctica, Universidad de Alicante, San Vicente del Raspeig, 03690 Alicante, Spain
*
Author to whom correspondence should be addressed.
Deceased in September 2021.
Submission received: 16 November 2021 / Revised: 5 December 2021 / Accepted: 6 December 2021 / Published: 8 December 2021
(This article belongs to the Special Issue Mathematics Teacher’s Specialised Knowledge)

Abstract

:
During the last decades, research in teacher noticing has increased since its development is considered important in teacher training programs. An issue that needs more research is the relationship between teachers’ mathematical knowledge for teaching in a specific mathematical domain and their ability to notice. This study focuses on how pre-service primary school teachers (PPTs) solve a measurement division problem with fractions and interpret (score and justify) students’ answers to this problem. The participants were 84 PPTs who answered two tasks. Task 1 consisted of solving a measurement division problem with fractions. Task 2 involved interpreting (scoring and justifying) the answers of four primary school students to the problem. Responses to Task 1 were classified based on their accuracy and the procedure used. For Task 2, the scores given along with their justifications were analyzed. The results show that PPTs’ knowledge of division with fractions is limited and that they had difficulties in identifying conceptual errors in students’ answers. This study provides information on the relationships between PPTs’ knowledge of these types of problems and how PPTs interpret students’ answers. This information could aid in adjusting mathematical teaching knowledge in training programs.

1. Introduction

During the last decades, research in teacher noticing has increased (for instance, see the recent survey paper in ZDM–Mathematics Education by Dindyal, Schack, Choy, and Sherin [1]) since its development is considered important in teacher training programs [2,3]. Following the conceptualization of Sherin [4], professional noticing implies two processes: selective attention (noticing) and knowledge-based reasoning (reasoning). Noticing involves teachers’ ability to attend to relevant classroom situations [5]. Reasoning implies making sense of what has been noticed, making connections between specifics of the classroom and broader principles of teaching and learning.
A particular focus is professional noticing of children’s mathematical thinking. This construct has been conceptualized through three skills: attending to, interpreting, and deciding [6], and provides “a structure for teachers to better understand and act on their students’ mathematical conceptions and practices” [7] (p. 296). Professional noticing of children’s mathematical thinking implies teachers’ ability to use their knowledge (subject content knowledge and pedagogical content knowledge) to attend to, interpret (reason about the situation), and decide [8]. Therefore, teachers’ mathematical knowledge for teaching [9] and professional noticing are connected [10].
Interpreting requires knowledge to attend and explain students’ procedures (common and uncommon); distinguishing their correctness and potential; explaining the origin of their errors; or distinguishing scopes and limitations of different types of representations for communicating mathematical ideas. Deciding implies knowledge regarding which aspects of the concept are the easiest or the most difficult ones for students, which are the most adequate strategies or representations for introducing the concept, which are the most common errors related to the concept, or which are the most suitable materials or resources for introducing the concept.
Previous research on teachers’ noticing of students’ mathematical thinking has shown which mathematical details of the students’ answers pre-service teachers identified and how they interpreted students mathematical thinking in specific mathematical domains such as algebraic thinking [11], proportional reasoning [12,13], the part-whole meaning of fraction [14], multi-digit addition and subtraction [15] early numeracy [16], or derivatives [17]. These studies have shown characteristics of pre-service teachers’ mathematical knowledge and pedagogical content knowledge related to the mathematical domain that play a significant role in noticing students’ mathematical thinking. Particularly, Dick [15] showed specialized content knowledge, a subset of the Mathematical Knowledge for Teaching (MKT, [9]) as an integral part of professional noticing in the specific domain of multi-digit addition and subtraction. Dreher and Kuntze [18] identified a weak but significant correlation between pre-service teachers’ mathematical content knowledge and their noticing. Similarly, Sánchez-Matamoros, Fernández and Llinares [17] and Ivars, Fernández, Llinares, and Choy [14] found that pre-service teachers’ abilities to interpret and decide are strongly connected with their mathematical content knowledge in the specific domains of derivatives and fractions, respectively. However, in eastern traditions, Yang, Kaiser, König, and Blömeke [19] showed that the relationship between Chinese teachers’ mathematical content knowledge and their noticing is weak and independent from the level of cognitive understanding of mathematics.
From these previous studies, and as it is highlighted by Dindyal et al. [1], similar studies focused on the relationship between teachers’ mathematical knowledge for teaching in other specific mathematical domains and their ability to notice are needed because these findings will have important implications for teacher education and professional development. Furthermore, it is important to determine how narrow or broad situation-specific noticing is [1,20]. In other words, to what extend is noticing children’s mathematical thinking different when children are learning fractions or when they are learning additions and subtractions. Therefore, studies focused on this relationship in other mathematical domains could allow us to continue exploring the generalizability of teacher noticing across different content areas or the specificities of each area.
In this study, we focus on the specific domain of multiplicative structures, and, particularly, on measurement division problems with fractions, for the following reasons: (1) the importance of multiplicative structure problems in the primary school curriculum; (2) the strategies and difficulties that arise from fractions for both learning and teaching them [21,22,23]; and, finally, (3) the specific difficulties posed by the conceptualization of division with fractions [24]. Our objective is to investigate how a group of pre-service primary school teachers (PPTs) solve a measurement division problem with fractions and interpret students’ answers to this problem.

2. Theoretical Background

Since our particular mathematical domain is measurement division problems with fractions, first, we present a literature review regarding primary school students’ procedures and errors in these problems. Then, we focus on the literature related to the teachers’ knowledge and noticing in this mathematical domain.

2.1. Measurement Division Problems

Vergnaud [25] analyzed the problems in the conceptual field of Multiplicative Structures distinguishing among three structures: ‘isomorphism of measures’, ‘product of measures’ and ‘multiple proportion other than product’. The structure ‘isomorphism of measures’ encompasses problems of simple, direct proportionality between two magnitudes, M1 and M2, that put four quantities into play, three of which are known, with the fourth being the unknown. In this category, we can identify three types of problems when one of the quantities is reduced to 1: multiplication, measurement division, and partitive division, depending on what the unknown is [24]. Particularly, in measurement division problems, the unknown is the number of groups. An example is: There are some packages of 4 kilos. If we have 12 kilos in total, how many packages are there?
For each of these problems, we need to consider whether the implied magnitude is discrete or continuous and whether the number set is whole or rational. In the division problems, one must consider both the quotient (for example, whole, not whole greater than 1, not whole less than 1), and the meaning of the remainder (which sometimes must be considered in giving the answer, and, at other times, it must be ignored).
These problems have been broadly studied with primary education students, identifying the most common procedures and errors. Bulgar [26] identified three procedures used by primary school students in division problems of a whole number by a fraction with continuous magnitudes: (i) graphically representing the dividend with as many congruent parts as indicated by the denominator of the divisor, and taking the numerator of the divisor as many times as possible (measurement); (ii) operating with fractions by adding the divisor repeatedly until approaching the dividend by default, either by subtracting the dividend from the divisor as many times as possible, or by directly dividing fractions (use of fractions); and (iii) taking the denominator of the divisor as a unit and operating with natural numbers, where, for instance, the operation 3:2/5 becomes the division of 15/5 by 2/5, and one considers the division of 15 by 2, the unit of measure being ‘fifths’ (use of natural numbers). Other authors have identified measurement procedures as direct modeling and the use of fraction addition and subtraction as repeated addition and subtraction [22].
The errors identified are of a conceptual and procedural nature. The conceptual errors include not dividing the whole into equal parts, not identifying the unit of measure (such as thinking that what is left over from dividing 2 by 3/5 is 1/3, and not 1/5), and inverting the division terms. The procedural errors worthy of note include not counting correctly when using a measurement procedure, and not carrying out the algorithm correctly when operating with fractions [27].
Therefore, in this mathematical domain, noticing students’ mathematical thinking implies the use of knowledge regarding the meanings of the division, the procedures for problem-solving measurement division with fractions (measurement, use of natural numbers, use of fractions), as well as the scope and the limitations of these procedures and the most common errors made by students.

2.2. Teachers’ Knowledge of Division with Fractions

Various studies have shown that PPTs have difficulties in solving problems that involve division with fractions [28,29,30,31,32,33,34]. Graeber, Tirosh, and Glover [28] showed that many PPTs tended to interpret division only as partitive division and found it difficult to deal with situations where the operation had the meaning of measurement division, such as the division of a whole number by a fraction. Ball [29] also indicated that some pre-service teachers were able to interpret division in terms of partition only. Out of a group of 19 pre-service primary and secondary school teachers in training, only five were able to describe or contrive an appropriate story to explain the meaning of the expression 1¾: a half and another five came up with stories that did not fit the situation; the most common error was formulating a problem that required dividing by 2, instead of ½. Nillas [30] showed that the ability to solve division problems with fractions did not imply having a conceptual understanding of the topic, and, consequently, teachers had little success in formulating division problems. Koichu, Harel, and Manaster [31] showed that the success or failure of mathematics teachers in formulating problems in the context of division with fractions was linked to the conceptualization of the fraction as an operator or as a relationship between part and whole, respectively.
Lo and Lou [32] studied mathematical content knowledge for division with fractions in a group of PPTs from Taiwan, who had a high degree of success in tasks related to basic fraction concepts, such as the fraction as part of a whole, the unit, the meaning of operations, and so on, that constitute part of teachers’ common content knowledge, but encountered difficulties in the tasks of formulating problems and resolving situations through diagrams or graphic representations, all of which pertain to specialized content knowledge.
Osana and Royea [33] designed a pre-service teacher intervention focused on fractions. The results revealed an improvement in conceptual knowledge, but not in the capacity for formulating problems. Furthermore, they identified certain cognitive obstacles when the pre-service teachers tried to build solutions and represent them symbolically. Tirosh [34] designed a course for improving PPTs’ knowledge of division with fractions. Prior to the intervention, most of the PPTs were capable of dividing fractions, but did not know how to explain why the algorithm worked, and attributed the cause of the wrong answers typical of their students’ to reading comprehension difficulties or to problems in applying the algorithm; however, by the end of the course, the prospective teachers were able to identify other causes for the most common mistakes made, such as interpreting the problem as a partitive division, or a limited conception of the notion of fractions or of the properties of the operations.
In summary, this previous research has shown PPTs difficulties in solving problems that require division with fractions or in the formulation of problems that must be solved using division with fractions.

2.3. Teachers Noticing in the Specific Mathematical Domain: Division with Fractions

To date, only a limited number of research papers on noticing this mathematical domain have been conducted. Jakobsen, Ribeiro, and Mellone [35] proposed a set of tasks on a problem related to partitioning fractions to 49 future Norwegian teachers, in order to identify their specialized knowledge (MKT) when interpreting and making sense of students’ answers. The results show that, although most of them tried to interpret the students’ solution, they remained at a descriptive and evaluative level, as these interpretations involve only aspects of the common content knowledge.
Montero and Callejo [36] carried out research with 21 pre-service primary school teachers. Pre-service teachers, in a teaching experiment, solve measurement division problems and anticipate and classify student’s procedures to these problems. The results showed that after the training, pre-service teachers were more able to identify the different procedures.
We extend this research, examining not only how pre-service teachers interpret student’s different procedures, but also procedural and conceptual errors. Furthermore, instead of classifying procedures, we will ask PPTs to score primary student’s answers and justify them. This could provide us with information about pre-service teachers’ knowledge regarding the scope and limitations of the procedures (validity and generalizability of procedures) and the most common errors made by students.
The research questions formulated are:
  • How do PPTs solve measurement division problems with fractions?
  • How do PPTs interpret (score and justify) the answers of primary school students in measurement division problems with fractions?

3. Materials and Methods

This study employs a qualitative research methodology, particularly, it focuses on how PPTs solve a measurement division problem with fractions and interpret the answers of primary school students to this problem. We focus on identifying the different procedures used by PPTs and the justifications provided to the scores given to primary school students’ answers.

3.1. Participants and Context

The participants were 84 PPTs enrolled in a primary education teacher training program at a university in Spain. These pre-service teachers had received training on the meaning of fractions and operations for compulsory education levels, prior to their enrolment in university studies. The study was conducted before their dealing with fractions and problems with a multiplication structure in the subject related to the teaching and learning of these contents.

3.2. Instruments

The PPTs answered two tasks. Task 1 consisted in solving a measurement division problem with fractions. The problem they had to solve was as follows:
I have four cakes. I want to give three-fifths of a cake to each child. To how many children can I give some cake? How much do I have left?
This measurement division problem presents a situation in which fractional portions (3/5 of a cake) of a whole amount (4 cakes) must be made and asks how many portions can be given (quotient), and how much is left (remainder). It can be solved by a division algorithm or by other methods, such as direct modeling or repeated addition.
Task 2 involved interpreting the answers of four primary school students to the problem (answers A, B, C and D; Figure 1). To interpret them, PPTs were asked to score each primary student’s answer and justify it. They were to give 1 point if they deemed the answer to be completely correct, 0 points if they considered the answer to be absolutely incorrect, and 0.5 points if they thought the answer was partially correct.
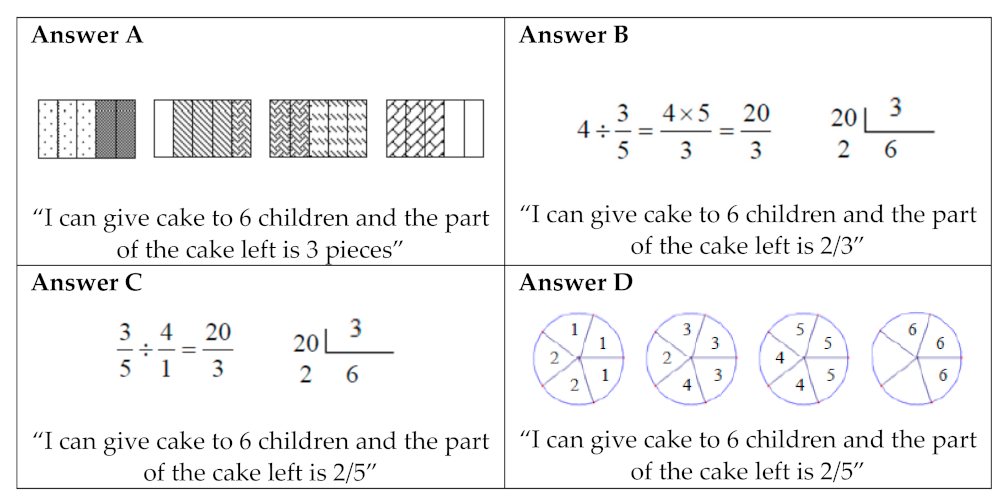
Students’ answers were selected considering problem-solving procedures and the erroneous concepts identified in prior research on division problems with fractions [34]. The four answers chosen show procedures for measuring and the use of fractions [22,26]; in some answers, there are conceptual or procedural errors [27], and two of them made use of graphic representations.
  • For Answer A, the student represents each cake by a rectangle, divides each cake into fifths, and uses a unit of measure equal to the piece of cake that must be given to each of the children (3/5). The student counts out how many times 3/5 is in the total. Because of the way the student colors the parts, he/she makes a procedural counting error, and in giving the answer regarding how much is left over, he/she answers that “three pieces” (conceptual error).
  • For Answer B, the student carries out a division (4:3/5), dividing four cakes by the fraction represented by the amount of cake to be given to each child (3/5). The student uses the algorithm for division correctly, multiplying crosswise the numerator by the denominator, and obtaining 20/3. In response to the questions asked, he/she divides 20:3 and gets a quotient of 6 and a remainder of 2, giving an answer of 6 children, with 2/3 left over. The answer that says that 2/3 is left indicates that the student is using thirds as a unit of measure for the remainder rather than the entire cake, as asked. The student “read” the remainder without considering that it is the part of 3/5 (the unit) that is left (conceptual error; which is to say that 2/5 of the entire cake is left over).
  • For Answer C, the student does a division but inverts the terms (dividing 3/5 by 4), as if the commutative property were true for this operation (conceptual error). The student applies the algorithm incorrectly (procedural error), but the two errors cancel each other out, leading to the right answer.
  • For Answer D, the student using direct modeling draws circles to represent the 4 cakes, dividing each into five parts and enumerating each group of 1/5 that can be given to each child (3/5 cake), giving a correct answer.
  • The PPTs completed Task 1, and fifteen days later, they did so with Task 2.

3.3. Analysis

The responses by the PPTs to the Cake problem in Task 1 were classified based on their accuracy and the procedure used. The responses were analyzed individually by three researchers. Disagreements were discussed until we reached agreement.
As regards accuracy, the responses were classified as correct if the procedure used and the answer were correct; as almost correct if the pre-service teacher used a correct procedure and indicated how many children could be given cake but said that “two pieces” or “2 thirds of the cake” were left or when they divided a graphic into non-equal parts, yet they reasoned correctly. Finally, the answers were classified as incorrect when they did not correctly interpret the statement of the problem, or the answer made no sense (Table 1).
The PPTs’ procedures were classified into three groups [26]:
  • Use of natural numbers. When the PPTs considered the 4 cakes to be 20 fifths and justified the answer by using natural numbers.
  • Measurement. When the PPTs created a unit of measure equal to the piece they were supposed to give to each child (3/5 of a rectangle or circle) and applied this measure to the 4 cakes.
  • Use of fractions. When the PPTs used operations with fractions (such as repeated additions, or subtractions, or multiplication, or division with fractions).
Table 2 shows examples of each procedure.
For Task 2 (interpreting the primary school students’ answers to the “Cake” problem), the scores given by the pre-service teachers, along with their justifications, were analyzed individually by three researchers. The justifications were then grouped into four categories:
  • Justifications based on the validity of the method. When the PPTs deemed that the procedure used by the primary school student was or was not valid for the problem.
  • Justifications based on the generalizability of the method. When the PPTs believed the procedures could or could not be applied to other problems with higher quantities.
  • Justifications based on the clarity of the method. When the PPTs felt that the procedure was explained with clarity.
  • Other justifications. When the PPTs considered only the correctness of the result or other aspects.
The justifications given by the PPTs could belong in one or more categories. Table 3 shows some examples of the analysis carried out.
Similarly, we considered whether the PPTs did or did not identify conceptual or procedural errors in the answers of primary school students. For example, one PPT identified a conceptual error in Answer B: “The procedure is correct, but the result is wrong. The number of pieces remaining should be a multiple of 1/5, and the student came up with 2/3. The student made a mistake”, for the teacher realized that the primary student had not correctly identified the unit of measure. Another PPT identified the procedural error in Answer A: “The procedure is right, but the result is wrong since the student left one piece uncolored” and the teacher realized that the student did not apply the unit of measure correctly to give each child the correct portion.

4. Results

We describe the findings in three sections: (1) problem solving by the PPTs (Task 1); (2) relationship between the problem-solving results (Task 1) and the scoring assigned to the answers by the primary school students (Task 2); and (3) interpretation of the answers and errors of the primary school students (Task 2).

4.1. How Do Pre-Service Teachers Solve the Measurement Division Problem?

The results of this study indicate that the PPTs found it difficult to solve the proposed division problem with fractions, and that they primarily used the measurement procedure with support from a graphic representation of the quantities. The relationship between the procedure used and the correctness of the problem is shown in Table 4.
Interestingly, 54.8% of the PPTs gave a correct answer to the problem, 16.7% an almost correct answer, and 28.5% solved the problem incorrectly (Table 4). The PPTs who solved the problem only as almost correct used an appropriate procedure, but could not express the remainder correctly.
Regarding the procedures used, 44.1% of the PPTs used the measurement procedure, using a graphic representation to solve it, and, of them, more than half did so correctly. On the other hand, of the 27.4% of the PPTs who used operations with fractions, more than half used the division algorithm and gave correct answers. Examining as a whole the incorrect and almost correct answers by the PPTs using fractions, one can see that nearly half of the pre-service teachers using operations with fractions were able to express correctly what the remainder of the cake was. In addition, 20.2% turned to natural numbers to carry out the division. Approximately two-fifths of them had problems expressing what was left over as a fraction of the cake, due to not recognizing that the unit (the cake) was divided into fifths. This procedure transfers the unit from the cake to one of the pieces (1/5), and, thus, the answer “two pieces are left over”, even though it is consistent with the procedure, does not reflect the relationship to the unit (the cake was divided into fifths).

4.2. Relationship between Problem Solving and the Scoring Assigned to the Primary Students’ Answers

Table 5 shows the number of PPTs that correctly, almost correctly, or incorrectly solved the problem and the scores given to the primary school students’ answers (Task 2).
Answers A and B, which show the correct interpretation of the quotient but not of the remainder, were given scores of 0.5 by roughly 2/3 of the PPTs:
  • Answer A, which uses a measurement procedure with a graphic representation for support, with one procedural and one conceptual error, was given a score of 0.5 by 69.5% of the PPTs. The majority argued that the result was incorrect: “Incorrect solution, since there is 2/5 of a piece left over”. This group of teachers considered in their scoring how the primary school student expressed the amount “left over”.
  • Answer B, which uses division with fractions with a conceptual error in the interpretation of the remainder, was given a score of 0.5 by 68.3% of the PPTs. These teachers maintained that the result was not correct: “The result of the operation or conclusion the student reaches is not correct”, but without indicating that the whole had been divided into five parts and therefore what was left over could not be thirds, but fifths.
Answers C and D were given scores of 1 point by the majority, although a larger majority for D. Of these, C had one conceptual and one procedural error, and D was correct:
  • Firstly, 68.5% of the PPTs that gave answer C a score of 1 said that both the procedure used and the result were correct: “The strategy and the solution are correct, and I am giving the student the highest score since he/she understood the problem and has also carried out the right operations to solve it”. These PPTs focused their attention on the fact that the result for answer C was correct, but did not notice the two errors in the procedure (inversion of terms and algorithm).
  • Secondly, 18.1% of the PPTs gave answer C a score of 0.5, arguing that the result was correct and noticing only one error, whether in the algorithm: “I gave him/her a score of 0.5 because even though the solution is correct, in the division there is a mistake since in division with fractions you can’t multiply like that”; or due to the inversion of terms of the operation: “The result is correct. The division by a fraction would be 4:3/5, but in the end the student gets the right result”.
  • Finally, 13.4% of the PPTs that gave answer C a score of 0 gave at times the same reasons as those who scored it with 0.5 points: “It’s incorrect because he/she divided what has to be given to each person by the number of people there are. Later the student realized that 3:20 could not be right and corrected it; he/she gives the right answer but the approach, which is the important thing, is all wrong”. Only two of them noticed both mistakes; in these cases, the teachers based their score on the incorrect procedure and not on the answer.
Thus, a high percentage of PPTs did not identify the errors in answer C (procedural and conceptual), noticing only the result and, as a consequence, giving the answer a score of 1.
Regarding answer D (correct graphic representation with circles), 87.9% of the PPTs awarded a grade of 1 and 12.1% of 0.5 or 0. The latter teachers did not score this answer with a 1 because they thought that, although the procedure and the result were correct, the students should have used fractions in their operations or, in other words, they pointed out that the procedure used was not generalizable since they used graphics: “With higher numbers or smaller portions this strategy would be unthinkable”, or it could not be pertinent, which suggests a question about the role played by the pre-service teachers’ beliefs about math teaching when it comes to evaluating students’ answers, or how the PPTs evaluate the pertinence of specific procedures at a given moment of the curriculum.
It is also worth noting that for answers B and C, involving operations with fractions, the PPTs gave lower scores for B, with just one error in the interpretation of the remainder, than for C, which had two errors but whose result was correct (68.3% gave a score of 0.5 points to answer B and 68.5% gave 1 point to answer C). Those giving answer B 0.5 points pointed out the error in interpretation of the parts into which the unit was divided and believed the procedure used was correct.
Finally, regarding the relationship between the accuracy of the PPTs in the problem and the scores given to the students’ answers, we would point out that of the PPTs that had not solved the problem correctly, most of them identified answer D as correct. In other words, there were PPTs who, though unable to solve the problem correctly or give an adequate interpretation of the remainder, did assign a grade of 1 to this answer by the primary students.

4.3. How the PPTs Interpreted the Procedures and Errors of the Primary School Students

Table 6 shows in percent the categories into which the types of justification the PPTs gave to the scores assigned to the primary school students’ answers. Most justifications were focused on the validity of the method (71.4%). However, some given in answers A and D (where the student used a graphic representation) focused on the validity-generalizability of the method (7.2% and 17.8%, respectively), and others given for answer D were focused on the validity/clarity of the method (16.7%).
There was little mention by the PPTs of the errors in the students’ answers (Table 7), and the errors identified were not uniform for the three answers where they were mentioned. For example, 37.2% of the PPTs identified some type of error in answer A, but only 23.8% in answer B and 13.2% in answer C. In addition, the PPTs did not identify conceptual errors in the same way as procedural errors for all of the answers. Thus, while for answer A 32.5% identified the procedural error, only 4.7% mentioned the conceptual one. For answer C, 7.2% of PPTs mentioned the procedural error, while only 4.8% mentioned the conceptual error, and 1.2% mentioned the procedural/conceptual aspects. It is worth noting how few teachers identified the errors in answer C since they observed that the result in this answer was correct (keep in mind that for this answer the errors canceled each other out).

5. Discussion and Conclusions

This study is framed within the research line on the relationship between teachers’ mathematical knowledge for teaching in a specific mathematical domain and their ability to notice. The specific focus was to examine how PPTs solve and interpret students’ answers (scoring and justifying) with regard to a problem of measurement division with fractions.
The findings of this study seem to suggest that: (1) PPTs’ knowledge of division with fractions is limited; (2) PPTs gave greater weight to the result than the procedure used in answers where the result was correct but the procedure was not; and (3) Task 2 proposed to the PPTs has the potential to develop mathematical knowledge for teaching, since some pre-service teachers who were unable to solve the problem were able to identify the correct answer and to identify an incorrect interpretation of the remainder in a division of fractions.
First, our findings indicate that PPTs’ knowledge of division with fractions is limited. This is clear from the percentage of success in solving the problem (54.8%) and the difficulty in identifying errors in the students’ answers (that ranges from 1.2% for recognition of two errors in the same answer to 32.5% for recognizing a procedural error in an answer). These results corroborate the findings of a great deal of previous work carried out with pre-service primary and secondary school teachers [28,29,30]. The procedure resorted to the most by pre-service teachers was measurement with a graphic representation, that is, the direct modeling confirming the results obtained by [36].
Second, roughly 2/3 of the PPTs were given scores of 0.5 to answer B (division with fractions with a conceptual error in the interpretation of the remainder). These PPTs noticed that these students had not realized that the whole had been divided into five parts and therefore what was left over could not be thirds, but fifths.
The majority of PPTs assigned to the incorrect answer C a score of 1, basing their justification on the correctness of the result, without noticing that the procedure the students followed was erroneous (68.3%); this was true for pre-service teachers that solved the problem correctly (29 out of 45, or 64.4%), almost correct or wrong (27 out of 37, or 72.9%). Third, it is worth noting that of the 45 PPTs that solved the problem correctly, 41 gave a score of 1 to answers that were incorrect (91.1%). These data can be interpreted by two ways: (1) That the PPTs’ knowledge of division with fractions does not allow them to notice the two errors made in answer C (only two PPTs pointed them out). In this regard, knowing how to correctly solve a measurement division problem is not enough to be able to interpret students’ answers adequately, since it involves both knowing various problem-solving procedures and identifying the mistakes made by students; (2) that PPTs might consider it sufficient to review the result due to the belief that “in problem solving the result is more important than the process” [37]. This second interpretation highlights the role that beliefs about problem solving can play in the process of interpreting and evaluating the answers given by primary school students. This is supported by the fact that a greater number of PPTs evaluated answer C (56 or 68.3%) as the correct answer than B (15, or 18.3%). These two answers use division with fractions, but while in C there are two errors and the result is correct, in B the division is correct but the result of what is left over is erroneous.
Regarding answer D (correct graphic representation), most of the PPTs awarded a grade of 1. PPTs who did not score this answer with a 1 gave as a justification that the procedure used was not generalizable. This result suggests a question about the role played by the PPTs’ beliefs about math teaching when it comes to evaluating students’ answers, or how the PPTs evaluate the pertinence of specific procedures at a given moment of the curriculum. However, the smaller percentage in the justification’s category generalizability diverges from findings from another study in which these same PPTs were asked to solve two measurement division problems with natural numbers and evaluate each of four answers by primary students [38]. In that study, a large number of PPTs believed that alternative procedures to division such as repeated addition or subtraction or construction were difficult to generalize. This can be explained by PPTs’ greater mathematical knowledge for teaching measurement division with natural numbers than with fractions, since while 76% of PPTs were able to correctly solve measurement division problems with natural numbers using division, for this problem only 27.4% operated with fractions and 15.5% operated correctly with fractions. Further, most used measurement procedures are backed by graphic representation (44.1%, rectangles or circles).
Third, regarding the relationship between the accuracy of the PPTs in the problem and the scores given to the students’ answers, pre-service teachers who were unable to solve the problem correctly or give an adequate interpretation of the remainder, did assign a grade of 1 to the correct measurement procedure (answer D) and were able to identify the incorrect interpretation of the remainder in answer B, scoring this answer with 0.5. Therefore, the task proposed to the PPTs has the potential to develop mathematical knowledge for teaching. The task is based on the use of representations of practice (also called vignettes; [39]). Representations of practice are understood as a depiction of a classroom situation (in this particular case, students’ written answers to the same problem that show different characteristics of understanding) to promote pre-service teachers’ reflection of real-life contexts. In fact, previous studies have provided further support for the hypothesis that vignettes provide teachers with real contexts to analyze aspects of the teaching and learning of mathematics and provide them with opportunities to relate theoretical ideas with examples from the practice [2].

Implications for Teacher Training

These findings underline the need to consider training perspectives that impact not only PPTs’ knowledge of mathematics but also pedagogical content knowledge that, in the context of the present study, involves the development of the competency to interpret students’ answers: taking into account the primary students’ degree of comprehension of the meaning of the division, ways of representing the fractions, the level of command of the division algorithm over primary education, the most common errors and difficulties and their causes [34,40,41].
As it has been shown in our results, the use of tasks similar to the one used in this study in teacher training programs can help pre-service teachers to enhance noticing. This task consists of representations of practice (for instance, student’s answers showing different features of the concept understanding, transcripts of teacher–student interactions solving an activity, etc.) and some questions that focus PPTs attention on interpreting students’ mathematical thinking. Furthermore, recent studies have proved that the use of documents as theoretical lenses [42] with mathematical content knowledge and pedagogical content knowledge informed by mathematics education research focuses PPTs reflection on the representations of practice, and therefore, can support pre-service teachers’ enhancement of noticing students’ mathematical thinking.
Our work was focused on both the analysis of measurement division problem-solving procedures used by PPTs, as carried out in other studies mentioned at the start of this article, and on how teachers interpret the answers of primary school students using different procedures. The findings offer teacher trainers some initial references to PPTs’ knowledge of measurement division and how they use this knowledge in the tasks they must carry out in their profession: the capacity to interpret their students’ answers.

Author Contributions

Conceptualization, M.M., C.F. and M.L.C.; methodology, M.M., C.F. and M.L.C.; validation, M.M., C.F. and M.L.C.; formal analysis, M.M., C.F. and M.L.C.; investigation, M.M., C.F. and M.L.C.; resources, M.M., C.F. and M.L.C.; writing—original draft preparation, M.M., C.F. and M.L.C.; writing—review and editing, M.M., C.F. and M.L.C.; visualization, M.M., C.F. and M.L.C.; supervision, M.M., C.F. and M.L.C.; project administration, M.M., C.F. and M.L.C.; funding acquisition, M.M., C.F. and M.L.C. All authors have read and agreed to the published version of the manuscript.

Funding

“This research was funded, in part (M.M.) by Universidad de Los Lagos (Chile) y su Dirección de investigación” and in part (C.F. and M.L.C.) by the project PID2020-116514GB-I00 del Ministerio de Ciencia e Innovación (Spain) and by the project coReflect@maths (2019-1-DE01-KA203-004947). coReflect@maths is co-funded by the Erasmus+ Programme of the European Union. The European Commission’s support for the production of this publication does not constitute an endorsement of the contents, which reflect the views only of the authors, and the Commission cannot be held responsible for any use which may be made of the information contained therein.

Institutional Review Board Statement

All subjects involved gave their informed consent for inclusion before they participated in the study.

Informed Consent Statement

Informed consent was obtained from all subjects involved in the study.

Data Availability Statement

The data presented in this study are available on request from the corresponding author.

Conflicts of Interest

The authors declare no conflict of interest.

References

  1. Dindyal, J.; Schack, E.O.; Choy, B.H.; Sherin, M.G. Exploring the terrains of mathematics teacher noticing. ZDM-Math. Educ. 2021, 53, 1–16. [Google Scholar] [CrossRef]
  2. Fernández, C.; Sánchez-Matamoros, G.; Valls, J.; Callejo, M.L. Noticing students’ mathematical thinking: Characterization, development and contexts. Av. Investig. Educ. Matemática 2018, 13, 39–61. [Google Scholar] [CrossRef] [Green Version]
  3. Jacobs, V.R.; Spangler, D.A. Research on core practices in K-12 mathematics teaching. In Compendium for Research in Mathematics Education; Cai, J., Ed.; National Council of Teachers of Mathematics: Reston, VA, USA, 2017; pp. 766–792. [Google Scholar]
  4. Sherin, M.G. The development of teachers’ professional vision in video clubs. In Video Research in the Learning Sciences, 1st ed.; Goldman, R., Pea, R., Barron, B., Denny, S.J., Eds.; Routlege: New York, NY, USA, 2007; pp. 397–410. [Google Scholar] [CrossRef]
  5. Van Es, E.A.; Sherin, M.G. Learning to notice: Scaffolding new teachers’ interpretations of classroom interactions. J. Technol. Teach. Educ. 2002, 10, 571–595. [Google Scholar]
  6. Jacobs, V.; Lamb, L.; Philipp, R. Professional noticing of children’s mathematical thinking. J. Res. Math. Educ. 2010, 41, 169–202. [Google Scholar] [CrossRef]
  7. Thomas, J.; Fisher, M.H.; Jong, C.; Schack, E.O.; Krause, L.R.; Kasten, S. Professional noticing: Learning to teach responsively. Math. Teach. Middle Sch. 2015, 21, 238–243. [Google Scholar] [CrossRef]
  8. Brown, L.; Fernández, C.; Helliwell, T.; Llinares, S. Prospective mathematics teachers as learners in university and school contexts: From university–based activities to classroom practice. In International Handbook of Mathematics Teacher Education: Volume 3. Participants in Mathematics Teacher Education, 2nd ed.; Lloyd, G.M., Chapman, O., Eds.; Brill Academic Publishers: Leiden, The Netherlands, 2020; pp. 343–366. [Google Scholar] [CrossRef]
  9. Ball, D.L.; Thames, M.H.; Phelps, G. Content Knowledge for Teaching: What makes it Special? J. Teach. Educ. 2008, 59, 389–407. [Google Scholar] [CrossRef] [Green Version]
  10. Thomas, J.; Jong, C.; Fisher, M.H.; Schack, E.O. Noticing and knowledge. Exploring theoretical connections between professional noticing and mathematical knowledge for teaching. Math. Educ. 2017, 26, 3–25. [Google Scholar]
  11. Magiera, M.; van den Kieboom, L.; Moyer, J. An exploratory study of preservice middle school teachers’ knowledge of algebraic thinking. Educ. Stud. Math. 2013, 84, 93–113. [Google Scholar] [CrossRef]
  12. Buforn, A.; Llinares, S.; Fernández, C.; Coles, A.; Brown, L. Pre-service teachers’ knowledge of the unitizing process in recognizing students’ reasoning to propose teaching decisions. Int. J. Math. Educ. Sci. Technol. 2020, 1–19. [Google Scholar] [CrossRef]
  13. Son, J. How preservice teachers interpret and respond to student errors: Ratio and proportion in similar rectangles. Educ. Stud. Math. 2013, 84, 49–70. [Google Scholar] [CrossRef]
  14. Ivars, P.; Fernández, C.; Llinares, S.; Choy, B.H. Enhancing noticing: Using a hypothetical learning trajectory to improve pre-service primary teachers’ professional discourse. Eurasia J. Math. Sci. Technol. Educ. 2018, 14, 3m1599. [Google Scholar] [CrossRef]
  15. Dick, L.K. Investigating the relationship between professional noticing and specialized content knowledge. In Teacher Noticing: Bridging and Broadening Perspectives, Contexts and Frameworks; Schack, E.O., Fisher, M.H., Wilhelm, J.A., Eds.; Springer International Publishing AG: Cham, Switzerland, 2017; pp. 445–466. [Google Scholar]
  16. Schack, E.; Fisher, M.; Thomas, J.; Eisenhardt, S.; Tassell, J.; Yoder, M. Prospective elementary school teachers’ professional noticing of children’s early numeracy. J. Math. Teach. Educ. 2013, 16, 379–397. [Google Scholar] [CrossRef]
  17. Sánchez-Matamoros, G.; Fernández, C.; Llinares, S. Relationships among prospective secondary mathematics teachers’ skills of attending, interpreting and responding to students’ understanding. Educ. Stud. Math. 2019, 100, 83–99. [Google Scholar] [CrossRef]
  18. Dreher, A.; Kuntze, S. Teachers’ professional knowledge and noticing: The case of multiple representations in the mathematics classroom. Educ. Stud. Math. 2015, 88, 89–114. [Google Scholar] [CrossRef]
  19. Yang, X.; Kaiser, G.; König, J.; Blömeke, S. Relationship between Chinese mathematics teachers’ knowledge and their professional noticing. Int. J. Sci. Math. Educ. 2021, 19, 815–837. [Google Scholar] [CrossRef]
  20. Friezen, M.; Kuntze, S. How context specific is teachers’ analysis of how representations are dealt with in classroom situations? Approaching context-aware measure for teacher noticing. ZDM-Math. Educ. 2021, 53, 181–193. [Google Scholar] [CrossRef]
  21. Behr, M.; Harel, G.; Post, T.; Lesh, R. Rational number, ratio, and proportion. In Handbook of Research on Mathematics Teaching and Learning; Grows, D., Ed.; Macmillan: New York, NY, USA, 1992; pp. 296–333. [Google Scholar]
  22. Empson, S.B.; Levi, L. Extending Children’s Mathematics: Fractions and Decimals; Heinemann: Portsmouth, NH, UK, 2011. [Google Scholar]
  23. Lamon, S. Rational number and proportional reasoning: Towards a theoretical framework for research. In Second Handbook of Research on Mathematics Teaching and Learning; Lester, F.K., Jr., Ed.; National Council of Teachers of Mathematics: Reston, VA, USA, 2007; pp. 629–667. [Google Scholar]
  24. Greer, B. Multiplication and division as models of situation. In Handbook of Research on Mathematics Teaching and Learning; Grows, D., Ed.; McMillan: New York, NY, USA, 1992; pp. 276–295. [Google Scholar]
  25. Vergnaud, G. Multiplicative conceptual field: What and why? In The Development of Multiplicative Reasoning in the Learning of the Mathematics; Harel, G., Confrey, J., Eds.; State University of New York Press: New York, NY, USA, 1994; pp. 41–59. [Google Scholar]
  26. Bulgar, S. Children’s sense-making of division of fractions. J. Math. Behav. 2003, 22, 319–334. [Google Scholar] [CrossRef]
  27. Cramer, K.; Monson, D.; Whitney, S.; Leavitt, S.; Wyberg, T. Dividing fractions and problem solving. Math. Teach. Middle Sch. 2010, 15, 338–346. [Google Scholar] [CrossRef]
  28. Graeber, A.O.; Tirosh, D.; Glover, R. Preservice teachers’ misconceptions in solving verbal problems in multiplication and division. J. Res. Math. Educ. 1986, 20, 95–102. [Google Scholar]
  29. Ball, D.L. Prospective elementary and secondary teachers’ understanding division. J. Res. Math. Educ. 1990, 21, 132–144. [Google Scholar] [CrossRef]
  30. Nillas, L. Division of fractions: Preservice teachers’ understanding and use of problem solving strategies. Math. Educ. 2003, 7, 96–113. [Google Scholar]
  31. Koichu, B.; Harel, G.; Manaster, A. Ways of thinking associated with mathematics teachers’ problem posing in the context of division of fractions. Instr. Sci. 2013, 41, 681–698. [Google Scholar] [CrossRef]
  32. Lo, J.-J.; Lou, F. Prospective elementary teachers’ knowledge of fractions division. J. Math. Teach Educ. 2012, 15, 481–500. [Google Scholar] [CrossRef]
  33. Osana, H.P.; Royea, D.A. Obstacles and challenges in preservice teachers’ explorations with fractions: A view from a small-scale intervention study. J. Math. Behav. 2011, 30, 333–352. [Google Scholar] [CrossRef]
  34. Tirosh, D. Enhancing prospective teachers’ knowledge of children’s conceptions: The case of division of fractions. J. Res. Math. Educ. 2000, 31, 5–25. [Google Scholar] [CrossRef]
  35. Jakobsen, A.; Ribeiro, C.M.; Mellone, M. Norwegian prospective teachers’ MKT when interpreting pupils’ productions on a fraction task. Nord. Stud. Math. Educ. 2014, 19, 135–150. [Google Scholar]
  36. Montero, E.; Callejo, M.L. How prospective teachers interpret primary students’ answers to fractions division-measure problems. In Investigación en Educación Matemática XXII; Rodríguez-Muñiz, L.J., Muñiz-Rodríguez, L., Aguilar-González, A., Alonso, P., García, F.J., Bruno, A., Eds.; SEIEM: Gijón, Spain, 2018; pp. 378–386. [Google Scholar]
  37. Callejo, M.L.; Vila, A. Approach to mathematical problem solving and students’ belief systems: Two case studies. Educ. Stud. Math. 2009, 72, 11–126. [Google Scholar] [CrossRef]
  38. Fernández, C.; Callejo, M.L.; Márquez, M. Conocimiento de los estudiantes para maestro cuando interpretan respuestas de estudiantes de primaria a problemas de división-medida. Ensen. Cienc. 2014, 32, 407–424. [Google Scholar] [CrossRef] [Green Version]
  39. Buchbinder, O.; Kuntze, S. Mathematics Teachers Engaging with Representations of Practice; A Dynamically Evolving Field; Springer: Cham, Switzerland, 2018. [Google Scholar]
  40. Downton, A. A study of comparative performance on partitive and measurement division in solving division word problems. In Proceedings of the 33rd Conference of the International Group for the Psychology of Mathematics Education; Tzekaki, M., Kaldrimidou, M., Sakonidis, H., Eds.; PME: Thessaloniki, Greece, 2009; Volume 2, pp. 465–472. [Google Scholar]
  41. Li, Y.; Silver, E.A. Can younger students succeed where older students fail? An examination of third graders’ solutions of a division-with-remainder (DWR) problem. J. Math. Behav. 2000, 19, 233–246. [Google Scholar] [CrossRef]
  42. Fernández, C.; Choy, B.H. Theoretical lenses to develop mathematics teacher noticing. In International Handbook of Mathematics Teacher Education: Volume 2. Tools and Processes in Mathematics Teacher Education, 2nd ed.; Llinares, S., Chapman, O., Eds.; Brill Academic Publishers: Leiden, The Netherlands, 2020; pp. 337–360. [Google Scholar]
Figure 1. Primary school students’ answers selected for the problem.
Mathematics 09 03163 g001
Table 1. Classification of the accuracy of PPTs’ answers to the “Cake” problem (Task 1).
AnswersExamples
Correct Mathematics 09 03163 i001The PPT represented graphically the cakes dividing each cake in five equal parts. He/she said that “I can give 3/5 of the cake to 6 children and the part of the cake left is 2/5”
Almost correct Mathematics 09 03163 i002The PPT made a division correctly and indicated that he/she could give 3/5 of the cake to 6 children. However, he/she indicated that the part of the cake left is 2 pieces
Incorrect Mathematics 09 03163 i003The PPT answer made no sense
Table 2. Classification of the procedures used by PPTs in solving the problem (Task 1).
MethodExample
“The use of natural numbers”
This answer was classified as almosst correct since the PPT did not interpret the remainder
“The first cake is divided in 5 pieces. The second cake in 5 pieces. The third and fourth cake also in 5 pieces. So, we have 20 pieces (5 · 4 = 20). If we give to each child 3 pieces, we divide the number of pieces between the number of pieces that we have to give to each child”
Mathematics 09 03163 i004
“We can give cake to 6 children and the part of the cake left is 2 pieces”
“Measurement”
This answer was classified as correct
Mathematics 09 03163 i005
“You can give 3/5 of the cake to 6 children. The part of the cake left is 2/5”
“The use of fractions”
This answer was classified as correct
Mathematics 09 03163 i006
If you want to give 3/5 of the cake (pastel) to each child
Mathematics 09 03163 i007
“You can give cake to 6 children and the part of the cake left is 2/5”
Table 3. Examples of analysis of PPTs’ justifications.
Pre-Service Teacher’s JustificationCategory
“The student applies and develops an appropriate strategy to this problem, and arrives at the right answer”Validity of the method
“This is a correct procedure, but it is not the best one. If the student had larger numbers the procedure would not work”Validity-generalizability of the method
“The procedure used to solve the problem (a drawing) clearly shows that the student understands the problem and knows how to solve it. With this procedure we can clearly see the 2/5 of the cake”Validity/clarity of the method
Table 4. Percentage of PPTs giving a correct, almost correct, or incorrect answer and procedures used.
ProcedureCorrectAlmost CorrectIncorrectTotal
Natural numbers11.98.30.020.2
Measurement27.42.414.344.1
Fractions15.54.87.127.4
Others0.01.27.18.3
Total54.816.728.5
Table 5. Answers to the Cake problem by PPTs and scores given to primary school students.
Pre-Service Teachers’ Answers Task 1Pre-Service Teachers’ Scores Questionnaire 2
Answer A (Incorrect-Measurement)Answer B (Incorrect-Use of Fractions without Interpretation of Remainder)Answer C (Incorrect-Use of Fractions with Two Errors)Answer D (Correct-Measurement)
00.5100.5100.5100.51
Correct (45; 54.9%) *14.636.63.78.635.410.98.610.935.42.54.847.6
Almost Correct (14; 17%)2.414.604.88.53.72.42.412.203.613.4
Incorrect (23; 28.1%)9.818.30024.43.72.44.820.901.226.9
Total (82 **, 100%)26.869.53.713.468.318.313.418.168.52.59.687.9
* The numbers appearing in parentheses for PPTs’ answers to Task 1 shows the number of teachers (and the percentage) giving a correct, almost correct, or incorrect answer. ** 2 PPTs did not respond to this section of Task 2; of the two, one had correctly solved this problem.
Table 6. Percentage of PPTs for each type of justification given to the primary students’ answers.
Answer AAnswer BAnswer CAnswer DTotal
Validity73.879.876.255.971.4
Validity/generalizability7.20.02.417.86.9
Validity/clarity1.22.43.616.76.0
Other17.817.817.89.615.7
Table 7. Percentage of PPTs identifying the type of error for each of the answers.
Type of ErrorAnswer AAnswer BAnswer C
Conceptual4.723.84.8
Procedural32.5-7.2
Conceptual/procedural0.0-1.2
Publisher’s Note: MDPI stays neutral with regard to jurisdictional claims in published maps and institutional affiliations.

