Interval-Valued Intuitionistic Fuzzy Synthetic Measure (I-VIFSM) Based on Hellwig’s Approach in the Analysis of Survey Data


1
Faculty of Economics and Finance, University of Bialystok, 15-062 Białystok, Poland
2
Department of Econometrics and Computer Science, Wroclaw University of Economics and Business, 53-345 Wrocław, Poland
*
Author to whom correspondence should be addressed.
Mathematics 2021, 9(3), 201; https://0-doi-org.brum.beds.ac.uk/10.3390/math9030201
Submission received: 21 December 2020
/
Revised: 7 January 2021
/
Accepted: 18 January 2021
/
Published: 20 January 2021
(This article belongs to the Special Issue Advanced Fuzzy Models in Economics)
Abstract
:Several complex phenomena are measured with the use of tools in the form of a questionnaire where the values of criteria are assessed by the respondents using ordinal scales. Therefore, a special method of construction of synthetic measure is needed which takes into account the fact that such measurement scale allows only to determine the relationship between the states of objects: diversity, equality, minority, and majority. The main goal of this study is to propose a synthetic measure based on Hellwig’s approach and the interval-valued intuitionistic fuzzy set theory which allows to measure complex social phenomena under uncertainty, including data from questionnaire surveys. First, the method of converting ordinal data from questionnaires to interval-valued intuitionistic fuzzy sets (I-VIFS) is proposed. Next, the method of constructing a synthetic measure for I-VIFS is presented. Finally, through this synthetic measure, the optimism coefficient is defined, which allows to set the limits of the intervals for I-VIFS parameters. The usefulness of the proposed approach is showed using the results of a questionnaire survey of the subjective quality of life of inhabitants of selected communes in Poland. Results indicate that the synthetic measure is suitable and effective to evaluate complex phenomena based on ordinal data from questionnaire surveys under the conditions of measurement uncertainty. Moreover, the use of the concept of the optimism coefficient increases the flexibility of its application.
1. Introduction
Synthetic measures (composite indicators [1,2,3], synthetic indicators [3,4], composite indices [5]) are widely used to measure complex phenomena that are difficult or insufficient to capture by the individual indicators. Saisana and Tarantola [1] noticed that synthetic measures are “based on sub-indicators that have no common meaningful unit of measurement and there is no obvious way of weighting these sub-indicators”. Nardo et al. [2] pointed out that a composite indicator “[…] is formed when individual indicators are compiled into a single index, based on an underlying model of the multi-dimensional concept that is being measured”. According to Arechavala and Trapero [3], a synthetic measure or synthetic indicator “refers to a numerical measure reflecting the situation of an objective state of affairs made up by many components meant to be integrated into a single comprehensive value”. Synthetic measures are used in such areas as economy, management, tourism, environment, and finance for evaluation of social phenomena such as innovation, competitiveness, sustainable development, air quality, quality of life, and inequality, among others. Synthetic measures are useful tools for experts, stakeholders, and decision-makers, because they allow monitoring, both in time and space, the achievements of individuals (e.g., countries, regions) in terms of the analyzed phenomenon, comparing these achievements with other units, indicating areas requiring implementation of improvement activities as well as communicating the results of individuals to the general public in a simple and accessible way. The methodological and practical considerations of composite indices are presented in [1,2,3,4,5,6], among others.
An important group of methods that can be used in the construction of synthetic measures are the Multicriteria Decision Making (MCDM) methods. A review of the applications of MCDM methods in the construction of synthetic measures was presented in [7,8,9,10,11]. El Gibari et al. [7] demonstrated the growing popularity of the use of MCDM methods in scientific studies published in journals indexed in the JCR database since 2014. Among MCDM methods used in this area the most popular is TOPSIS (The Technique for Order of Preference by Similarity to Ideal Solution) [12] based on the distance functions from two reference objects, i.e., positive and negative ideal solutions. The other procedure based on reference object (named as pattern development) is Hellwig’s method [13], which we adopted in an intuitionistic fuzzy environment. What is interesting, Hellwig’s method was originally proposed in 1968 by Polish statistician, long before TOPSIS, as a taxonomic method for international comparison of economic development of countries [13].
In real life, we often deal with unclear and uncertain concepts rather than exact ones. One of the well know theories that effectively model uncertainty is fuzzy set theory presented by Zadeh in a series of publications [14,15,16,17], or their generalization such as intuitionistic fuzzy set theory proposed by Atanassov [18,19], interval fuzzy set theory, Zadeh [15,16,17], or interval-valued intuitionistic set theory [19,20,21]. Therefore, the multicriteria methods extended to a fuzzy environment are often applied in multicriteria decision-making problems [22].
In the vast majority of synthetic measures (including those based on MCDM methods), the criteria are measured by quotient interval and/or ratio measurement scales (often based on existing data collected by public statistics). In addition, for the assessed criteria, we have one value at the level of the analyzed objects (e.g., gross domestic product value, the level of unemployment, the number of patents, etc.). However, there are complex phenomena that must be measured with the use of tools in the form of, for example, a questionnaire. Examples of such phenomena are subjective quality of life, job satisfaction, service quality, etc. Then, the values of criteria for the considered objects (countries, regions, organizations) are assessed by the respondents using ordinal scales, often referred to as Likert scales. In this situation, three fundamental problems arise in the construction of synthetic measures for the evaluation of this type of phenomena. The first concerns the admissible arithmetic operations for ordinal scales, which, from a formal point of view, do not allow aggregation of partial information in a manner appropriate for multicriteria methods. The second problem consists of averaging the results of measuring the respondents’ opinions at the level of the assessed objects. It is because the ordinal measurement scale allows only to determine the relationship between the states of objects: diversity, equality, minority, and majority. The third problem is the inability to include in the construction of synthetic measures the degree of uncertainty, the source of which are respondents’ answers given in the form of “hard to say”.
To overcome these drawbacks, the main goal of this article is presentation of a novel Interval-Valued Intuitionistic Fuzzy Synthetic Measure (I-VIFSM) based on Hellwig’s approach. This method can take into account ordinal data. The proposed framework has three main advantages. First, it allows us to compare objects in terms of complex phenomena while the partial criteria describing them are measured on an ordinal scale. Second, the interval-valued fuzzy sets (IVFSs) approach allows to take into account the uncertainty of ordinal criteria caused by the lack of knowledge or experience of people assessing the objects. Third, the uncertainty in the construction of the synthetic measure is described through the optimism coefficient, the values of which can be determined objectively or subjectively.
The remaining part of this manuscript is organized as follows. In the next section, brief descriptions of the fuzzy set, intuitionistic fuzzy set, and interval intuitionistic fuzzy set are given. Section 3 gives a detailed proposition of fuzzy extension Hellwig’s method, Interval-Valued Intuitionistic Fuzzy Synthetic Measure (I-VIFSM). Furthermore, we discuss how fuzzy opinion measures can be aggregated in terms of several criteria using Hellwig’s approach. The procedure for the analysis of survey data using I-VIFSM is presented in Section 4. A practical application is given to illustrate the usefulness of the proposed framework in Section 5. The results obtained using the novel I-VIFSM method were compared with those obtained by means of the classical Hellwig’s synthetic measure (HSM) and Intuitionistic Fuzzy Synthetic Measure (IFSM) using statistical parameters and Kendall’s Tau correlation coefficient, which investigates the direction and strength of associations between two variables measured on an ordinal scale. Finally, the conclusions of the paper are presented.
2. Interval-Valued Intuitionistic Fuzzy Sets—Theoretical Background
Fuzzy set (FS) theory was introduced by Zadeh [14] as a useful tool to describe fuzzy and uncertain information. Zadeh [15,16,17] also developed an interval-valued fuzzy set (IVFS) theory as a generalization of the membership degree from exact number to interval number. Based on FS theory, Atanassov [18,19] proposed the intuitionistic fuzzy set (IFS). The advantage of IFS is the possibility to use consequences of both positive (the membership satisfaction degree) and negative (nonmembership degree) information, together with hesitancy.
We have two behavioral constructs of subjective judgments: optimism and pessimism. An optimistic decision viewpoint means that more weight is applied to good outcomes, while in a pessimistic one more weight is applied to bad outcomes. The IFS approach allows investigating the influences of optimism and pessimism on multiple criteria decision analysis [23].
First, the notion of an intuitionistic fuzzy set [18,19], an interval-valued intuitionistic fuzzy set [14,15,16] related to our study are briefly introduced.
Definition 1.
The numbers denote the degree of membership and nonmembership of to , respectively. For each intuitionistic fuzzy set in :
the intuitionistic index of x in . It is hesitancy degree of to .
An intuitionistic fuzzy set is characterized by three parameters: membership function, nonmembership function, and hesitation margin, which deal with uncertainty.
It is easy to see that the fuzzy set is a special case of an intuitionistic fuzzy set which is characterized only by a membership function. The membership degree modeled imprecision, while the nonmembership degree is simply the complementation to 1 of the membership degree. This is consistent with the psychological fact that a human expressing the degree of membership of an element in a fuzzy set very often cannot express a degree of nonmembership simply as the complementation to 1. As was noted by Szmidt [24,25], generalization of fuzzy sets allows to represent imprecise knowledge in many real situations when we face human testimonies, opinions, etc., involving answers of three types: yes, no, abstaining, i.e., which cannot be classified (e.g., “I do not know”, “I am not sure”, “I do not want to answer”, etc.). When using IFSs, an expert concentrates on both: advantages (pros) and disadvantages (cons).
By integrating IFS and IVFS, Atanassov [19,20,21] proposed the interval-valued intuitionistic fuzzy set (I-VIFS), where membership degree and nonmembership degree are described by interval numbers. Interval-valued intuitionistic fuzzy sets and their extensions are widely used in multicriteria decision-making [23,24,25,26,27,28,29] or group decision-making problems [30,31,32,33].
Definition 2.
The interval , and denote the degree of membership, the degree of nonmembership, and the degree of hesitancy of to , respectively. For each interval-valued intuitionistic fuzzy set in , we call , lower bound and upper bound of hesitancy of to , respectively, where , for each .
3. The Interval-Valued Intuitionistic Fuzzy Synthetic Measure (I-VIFSM)
In this part of the paper, the Interval-Valued Intuitionistic Fuzzy Synthetic Measure (I-VIFSM) based on Hellwig’s framework is presented. At the beginning it is worth to pay attention that this method can be applied for different kinds of data, including ordinal data, which are under special consideration in this work.
In this paper, the studied multidimensional comparative analysis problem in interval intuitionistic-valued fuzzy setting is introduced as follows: Let be a discrete set of objects, be a set of assessment criteria. The assessment of the object in terms of the adopted assessment criterion is expressed in the form of an interval-valued intuitionistic fuzzy set , which represents the desired level of performance of j-th criterion. Let , where is a subset of benefit criteria and is a subset of cost criteria. We assume that in the case of the benefit criterion the higher degree of membership is desired, while in the case of cost criterion, the lower degree of membership is desired.
Let be the degree of membership of the i-th object to the interval-valued intuitionistic fuzzy set in the form of an interval, where and are the lower and upper bound of the interval, respectively.
Let represent the degree of nonmembership of the i-th object to the interval-intuitionistic fuzzy set in the form of an interval, where and are the lower and upper bound of the interval, respectively.
Let be the degree of hesitancy of the i-th object to the interval-intuitionistic fuzzy set in the form of an interval, where and are the lower and upper bound of the interval, respectively. We have the following:
The characteristics of the object with respect to the j-th criterion can be represented as:
The interval-valued intuitionistic fuzzy data matrix is defined as the following:
The proposed I-VIFSM is now presented as follows:
Step 1. Determine the reference object with the “most favorable” values for each criterion.
The method of determining the coordinates of the reference object is as follows:
where:
In both cases, the degree of hesitancy is determined using the formula:
Step 2. Determine the distance of the individual object from the reference object using the normalized Euclidean distance measure for interval-valued intuitionistic fuzzy sets [33]:
Step 3. Calculate the I-VIFSM according to the formula:
where , , .
The measure takes values usually from the interval . The higher values of the measure, the closer the object is to the reference solution.
Formula (9) is based on the classical Hellwig’s approach [13], similar to the TOPSIS [12] idea reference-point based procedure. Yet the TOPSIS procedure uses the concept of distances to the positive and negative ideal solutions. Contrary to the TOPSIS, Hellwig’s method uses only the concept of a positive ideal solution named as pattern of development (for detailed comparison of TOPSIS and Hellwig’s method, see [34,35]). Some modifications as well as the application of Hellwig’s method can be found in [35,36,37,38,39,40].
4. Procedure for the Analysis of Survey Data Using I-VIFSM
In this part of the paper, the general procedure for the analysis of survey data is proposed, where I-VIFSM is included in the evaluation and aggregation of objects.
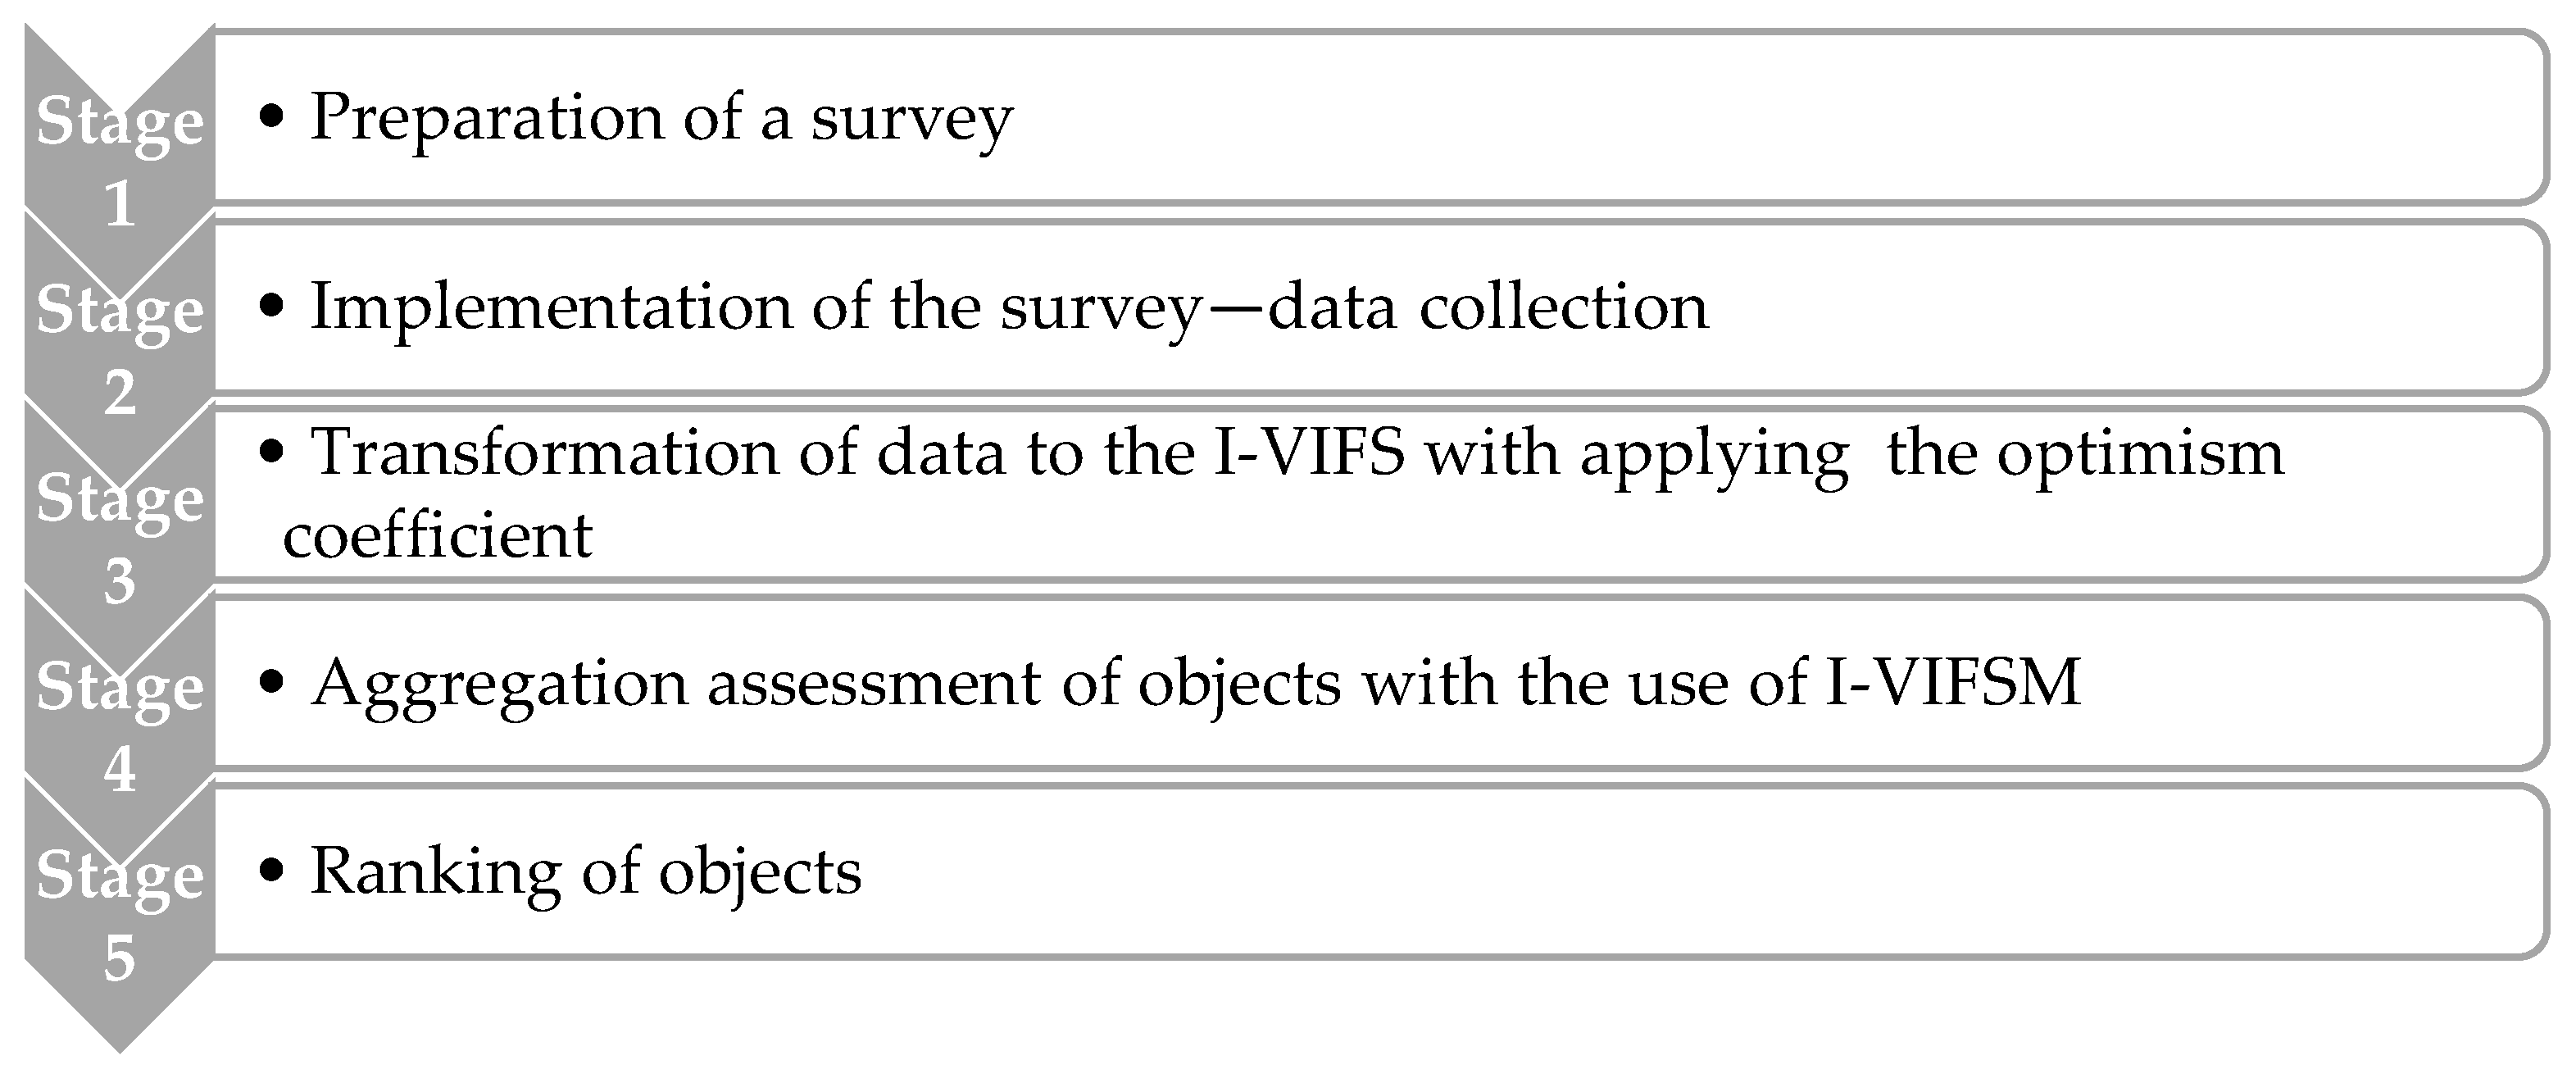
Let us assume that a set of objects (enterprises, foundations, countries) is assessed in terms of a complex phenomenon. The complex phenomenon has been characterized by a set of partial criteria. The criteria are assessed by the respondents using an ordinal measurement scale. The respondents’ answers are collected in a questionnaire survey. The procedure of analyzing the survey data and building the I-VIFSM consists of five main stages (Figure 1).
The stages of the procedure are characterized below.
- Stage 1. Preparation of a survey
Let be a set of objects evaluated in terms of a complex phenomenon. Let be a set of partial criteria describing this phenomenon. Objects are assessed based on partial criteria using the ordinal measurement scale. The measurement scale has categories , where 0 means the answer “it’s hard to say” or “I have no opinion” (undecided), first k categories with negative assessment of the object, last categories with positive assessment of the object. In the case of an ordinal scale with reversed categories, the categories should be recoded to the form described above.
We assume that all criteria are benefit criteria. The assumption was made because in the measurement of complex phenomena, with the use of questionnaire surveys, usually the criteria are selected in such a way that they are positively correlated with this phenomenon (the higher the assessment of the criterion, the higher the level of the complex phenomenon).
- Stage 2. Implementation of the survey—data collection
At this stage, individual respondent opinions are collected using a survey questionnaire. Let be the set of respondents where is the set of respondents who evaluated the object , the number of respondents who evaluated the object . Let us denote by the number of all respondents. Thus, we have .
- Stage 3. Transformation of data to the I-VIFS using the optimism coefficient
Let us assume that is the fraction of respondents who positively assessed the i-th object with regard to the j-th criterion expressed by the equation:
where
if the th respondent chose the th category for the th object and the th criterion; otherwise, .
Let us assume that is the fraction of respondents who negatively assessed the i-th object with regard to the j-th criterion expressed by the equation:
The fraction of undecided respondents marked as is calculated according to the equation:
The Optimism Coefficient
For each object the optimism coefficient is determined that allows to determine the range of intervals for the three parameters of interval-valued intuitionistic fuzzy sets. The coefficient is calculated according to the equation:
The optimism coefficient is normalized in the range . It is the part of all positive assessments of the i-th object (jointly for all criteria) in the sum of all positive and negative assessments of the i-th object (jointly for all criteria). If , then there are no positive assessments, and the value of the optimism coefficient is . If , there are no negative assessments, and the value of the optimism coefficient is .
Having the values of the optimism coefficients for each of the analyzed objects as well as the fractions calculated by Formulas (10) and (11), we can determine the parameters of the interval-valued intuitionistic fuzzy sets . Next, we calculate the lower and upper end of the interval of the degree of membership of the i-th object to the j-th interval-valued intuitionistic fuzzy set:
The lower and upper end of the interval of the degree of nonmembership of the i-th object to the j-th interval-valued intuitionistic fuzzy set we will calculate using the following formula:
According to definition (2), the lower and upper end of the interval of the degree of hesitancy of the i-th object to the j-th interval-valued intuitionistic fuzzy set are to be calculated as follows:
Summing up, the assessment of the in terms of the j-th criterion in the form of I-VIFS can be written as:
where:
It is easy to check that .
- Stage 4. Aggregation assessment of objects with the use of I-VIFSM
Calculation of the I-VIFSM for each of the objects following the methodology presented in Section 3.
- Stage 5. Ranking of objects
The values of the I-VIFSM are used in the ranking of objects. It should be assumed that the higher the value of the measure, the higher the position of the object in the ranking.
5. Empirical Example
The proposed procedure is applied to solve the problem of ranking of eleven communes in terms of the subjective quality of life of their inhabitants. As subjective quality of life is a complex phenomenon, it has been characterized by eight partial criteria. Characteristics of the research sample, measuring tool, and partial calculations are presented in the 5 stages following the proposed procedure (Figure 1).
- Stage 1.
The survey was conducted among the inhabitants of the communes of Kraina Łęgów Odrzańskich in Poland in the form of direct interviews in 2015. The survey used a measuring tool in the form of a questionnaire. The objects subject to assessment using the I-VIFSM were 11 communes located in the Kraina Łęgów Odrzańskich (marked with symbols from A to K). Each of the communes was characterized by eight partial criteria: C1—satisfaction with health care, C2—satisfaction with public safety, C3—satisfaction with access to services, products, and transport accessibility, C4—satisfaction with the cultural and sports offer, C5—satisfaction with the educational offer, C6—satisfaction with the professional and material situation, C7—satisfaction with the condition of the environment, and C8—satisfaction with social relations. The choice of criteria was proposed by the experts participating in the research based on their knowledge and experience. In the assessment of individual criteria, a 4-grade ordinal measurement scale with the following scale points was used: 1—“very unsatisfied”, 2—“unsatisfied”, 3—“satisfied”, 4—“very satisfied”. In addition, each of the respondents had the opportunity to give a neutral answer in the form of “hard to say” (marked as 0). Each of the communes was assessed in terms of evaluated criteria only by the residents who lived there. The research sample included 646 respondents which constituted 0.56% of all inhabitants. A nonprobability sampling method (convenience sampling) was used. The research sample was not representative. The number of respondents in each of the communes is specified in Table 1.
The respondents aged 25–35 and 36–45 had the largest part in the research sample (25% and 24.3%, respectively). Altogether, the respondents from these two ranges constituted almost half of the research sample. The smallest part in the sample was held by seniors over 65 years of age. Most of the respondents had secondary education (41.2%). Slightly fewer respondents had higher education (37.8%). The remaining respondents had primary or vocational education (21%).
- Stage 2.
This stage involves measuring the opinion of residents. The measurement results in the form of the frequency of selection of points of the measurement scale broken down into assessed objects are presented on the example of the criterion C1 (Table 2).
- Stage 3.
The transformation of the measurement results into the interval-valued intuitionistic fuzzy sets form requires, in the first place, the calculation of the respective fractions of respondents for individual communes following the Equations (10)–(12). The results of these calculations are summarized in Table 3.
Based on Table 3, the optimism coefficient of their inhabitants was calculated for each of the evaluated communes following Equation (13) (Table 4).
With the values of the optimism coefficients, the measurement results were transformed into I-VIFS following Equations (14)–(20). As a result, for each commune, the assessment of eight criteria of subjective quality of life in the form of I-VIFS was obtained. The I-VIFS parameters are presented in Table 5, Table 6, Table 7, Table 8, Table 9 and Table 10.
- Stage 4.
An assessment of objects in terms of eight criteria expressed in the form of I-VIFS should be summarized in the data matrix as presented below:
Calculation of the I-VIFSM for each of the objects requires the determination of a reference object whose coordinates contain the most desired values of each criterion. The coordinates of the reference object are also I-VIFS. In this example, each criterion has a stimulating effect on a complex phenomenon, therefore, for each of the criteria, maximum values should be taken for both the lower and upper limits of the interval representing the degree of membership. In the case of the degree of nonmembership and hesitancy, the minimum values should be adopted for both the lower and upper of the interval (according to Formula (7)). The coordinates of the reference object are presented in Table 11 and Table 12.
Then, for each object, we calculated its normalized Euclidean distance from the reference object according to Formula (8) (Table 13).
The calculated distances are the basis for the calculation of the I-VIFSM for each object (Table 14).
- Stage 5.
The higher the value of the measure calculated in the previous step, the higher the level of the analyzed complex phenomenon. The I-VIFSM values also make it possible to rank objects following the principle that the higher the I-VIFSM values, the higher the object’s position in the ranking. The final ranking of the communes is presented in Table 14 (in column 3).
Based on Table 14, we found that commune E with the value 0.650 of I-VIFSM was characterized by the highest level of subjective quality of life, while commune J with the value of I-VIFSM −0.002, the lowest level of subjective quality of life.
6. Discussion
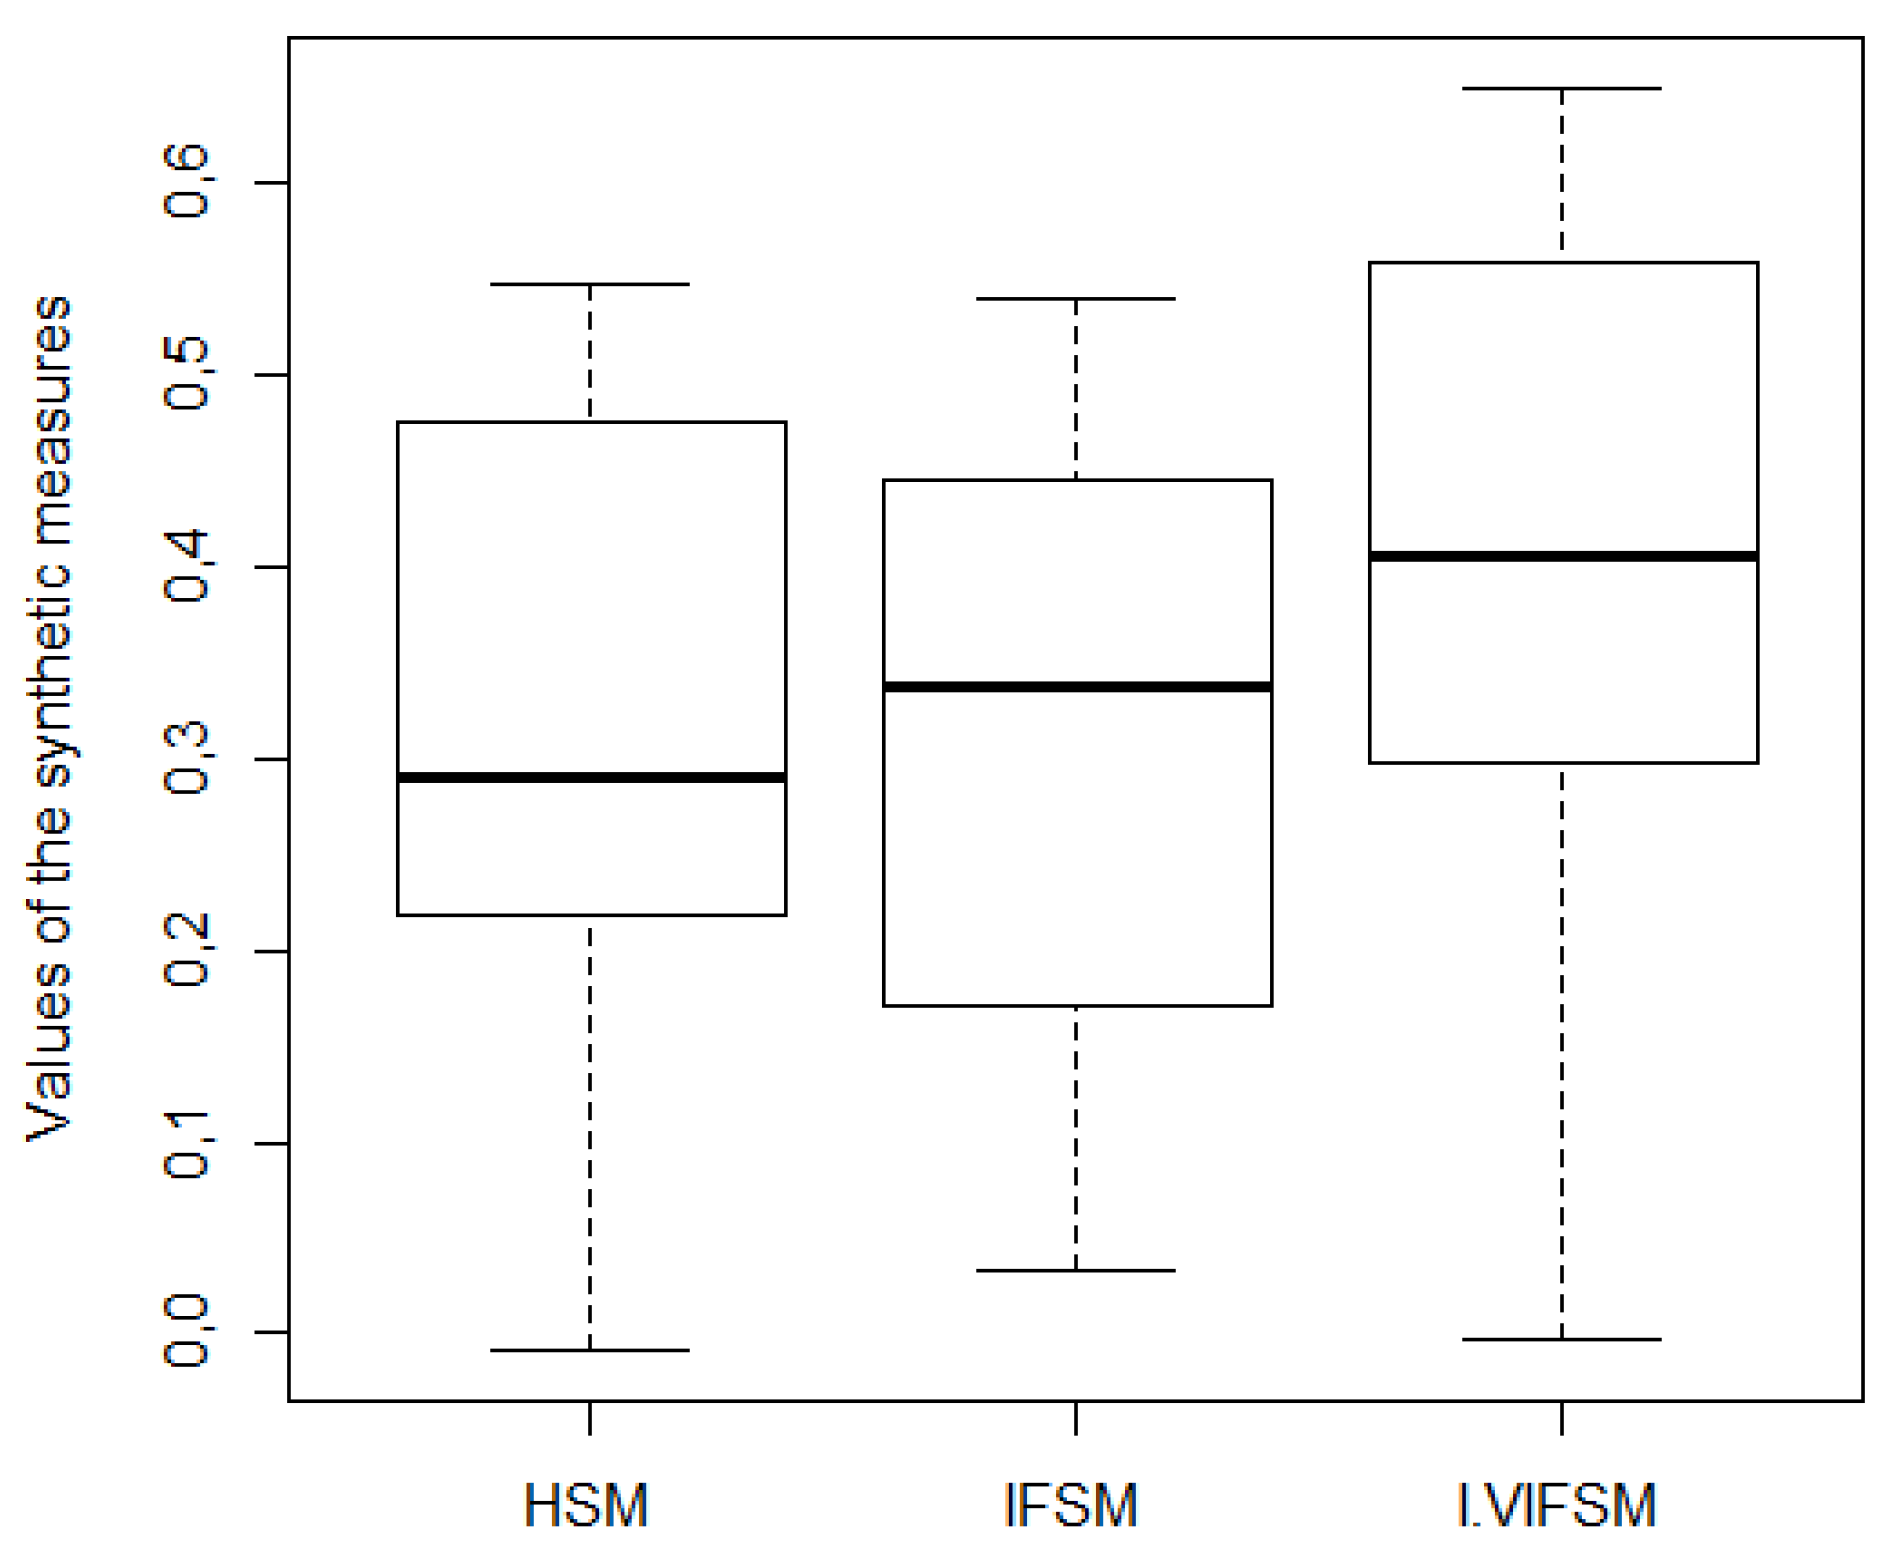
According to the authors’ knowledge, the literature on the subject, excluding paper [40], does not propose methods of constructing synthetic measures for ordinal data that take into account the degree of uncertainty contained in answers such as “I have no opinion”, “hard to say”, as well as optimism coefficient. Therefore, the method I-VIFSM was compared only with two other alternative approaches. The first is treating the measurement results as metric data and using Hellwig’s original method (referred to in the article as Hellwig’s synthetic measure (HSM)). In this approach, the answers “hard to say” are not taken into account because they are not a point on the measurement scale. The second approach is based on the use of Intuitionistic Fuzzy Synthetic Measure (IFSM) for ordinal data, which allows to take into account the measurement uncertainty, the source of which are respondents’ answers in the form of “I have no opinion”, “hard to say”. The method was characterized in detail in the study by Jefmański [40]. In both alternative approaches, it was assumed that all criteria stimulate the subjective quality of life of the inhabitants. In addition, the coordinates of the reference objects were also established based on the maximum values observed in the research sample. The values of synthetic measures HSM, IFSM, and I-VIFSM along with the rankings of objects determined on their basis are presented in Table 15 and Figure 2.
The results of the study and the conducted comparative analysis show that the values of the I-VIFSM measure reached higher values for the communes than in the other two cases. The mean values of synthetic measures obtained for the communes using the compared approaches were, respectively, 0.330, 0.319, and 0.393. The median value of the I-VIFSM measure was 0.406 and was much higher than the median values observed for HSM and IFSM measures (0.291 and 0.337, respectively). In the presented empirical example, the values of the proposed measure had a much greater range of variability, which may result in better differentiation of objects in terms of the analyzed complex phenomenon. The distribution of the values of all three synthetic measures was asymmetric with negative skew. This means that the analyzed communes were dominated by those for which the values of the measures were higher than the average value. The greatest negative skewness was observed for the I-VIFSM (skewness measure −0.642). The IFSM measure had the lowest negative skewness (−0.226). The skewness measure value for HSM was −0.456.
Large differences in the compared approaches were noticed in the rankings of communes established on the basis of the values of synthetic measures. Some communities improved their positions, while others worsened their positions in the ranking. Kendall’s Tau correlation coefficient was used to assess the relationship. The smallest positive correlation was obtained for the ranks determined on the basis of the HSM and IFSM methods (Tau = 0.418; p-value = 0.087). A slightly stronger relationship between the ranks was observed for the HSM and I-VIFSM (Tau = 0.527; p-value = 0.029). The strongest, positive correlation between the positions of communes in the rankings was obtained for the I-VIFSM and IFSM methods (Tau = 0.818; p-value < 0.0001). The advantage of the proposed novel I-VIFSM method is manifold: it takes into account positive, negative, as well uncertain opinions in evaluation questionnaire surveys while ordinal data are used; it allows aggregation of survey data using the concept of distance; it includes the optimism coefficient in the analysis. The analysis survey data is more complex, so maybe more precise comparing with HSM or IFSM measure.
7. Conclusions
The vast majority of synthetic measures constructed with the use of MCDM methods are based on criteria measured on metric scales (interval and/or ratio). When criteria are measured on ordinal scales, then the measurement results are treated as metric data. This approach has at least two major drawbacks. The first is based on the erroneous assumption that the distances between the points on the ordinal scales are the same. In such a situation, the use of most of the arithmetic operations required by MCDM methods is unacceptable. The second disadvantage concerns the inability to take into account the uncertainty in the measurement using ordinal scales. The solution to the above-described problems in the construction of synthetic measures is the proposed I-VIFSM method. The proposed framework uses the intuitionistic fuzzy sets theory achievements, which allowed to overcome the problem of aggregation of ordinal data at the level of assessed objects.
The contribution of this paper is as follows. Firstly, we highlighted the necessity for the construction of synthetic measures that could be properly applied in a comparative analysis of survey data. Secondly, an Interval-Valued Intuitionistic Fuzzy Synthetic Measure (I-VIFSM) based on Hellwig’s approach for object assessments in complex phenomena was proposed. Thirdly, the proposed measure can take into account ordinal survey data, uncertainty, as well as the optimism coefficient. Fourthly, the general procedure, including I-VIFSM method, for the analysis of survey data was described. Finally, an implementation of this procedure mode with the implemented I-VIFSM method was tested empirically to determine the problem of ranking eleven communes in terms of subjective quality of life of their inhabitants.
The advantage of the presented method is its flexibility manifested in the introduction of the so-called optimism coefficient. Based on its value, the lower and upper ends of the intervals representing the degrees of membership, nonmembership, and hesitancy are determined. The flexibility of this solution lies in the fact that the coefficient values can be determined subjectively (e.g., based on the knowledge, experience of researchers, experts) or objectively (e.g., based on the respondents’ opinions). In the presented empirical example, the optimism coefficient was determined objectively based on the opinions of the surveyed residents. One of the ways to objectively determine the value of the optimism factor may be to include an additional question in the questionnaire about the general assessment of a complex phenomenon, which is a common practice in researching the quality of life, services, products, etc.
A certain disadvantage of the proposed method is the accumulation of categories that differentiate between positive and negative opinions. This is not very important when extreme categories are chosen relatively rarely, as it is in the case of the presented study. Otherwise, some information may be lost. Therefore, further conceptual work on the method should focus, among others, on the analysis of the impact of the distribution of responses on I-VIFSM values, and then working out a way to take into account the differentiation of categories on the side of positive and negative responses.
Author Contributions
Conceptualization, E.R. and B.J.; methodology, E.R. and B.J.; validation, E.R. and B.J., formal analysis, E.R. and B.J.; investigation, E.R. and B.J.; resources, E.R. and B.J.; data curation, E.R. and B.J.; writing—original draft preparation, E.R. and B.J.; writing—review and editing, E.R. and B.J.; visualization, B.J.; supervision, E.R.; administration, E.R. All authors have read and agreed to the published version of the manuscript.
Funding
This research received no external funding.
Conflicts of Interest
The authors declare no conflict of interest.
References
- Saisana, M.; Tarantola, S. State-of-the-Art Report on Current Methodologies and Practices for Composite Indicator Development; European Commission, Joint Research Centre, Institute for the Protection and the Security of the Citizen, Technological and Economic Risk Management Unit: Ispra, Italy, 2002. [Google Scholar]
- Nardo, M.; Saisana, M.; Saltelli, A.; Tarantola, S.; Hoffman, A.; Giovannini, E. Handbook on Constructing Composite Indicators; OECD Publishing: Paris, France, 2005. [Google Scholar]
- Arechavala, N.S.; Trapero, B.P. Synthetic Indicators of the Quality of Life in Europe. In Encyclopedia of Quality of Life and Well-Being Research; Michalos, A.C., Ed.; Springer: Dordrecht, Germany, 2014. [Google Scholar]
- Mazziotta, M.; Pareto, A. Synthesis of Indicators: The Composite Indicators Approach. In Complexity in Society: From Indicators Construction to their Synthesis; Maggino, F., Ed.; Springer: New York, NY, USA, 2017; pp. 159–191. [Google Scholar]
- Greco, S.; Ishizaka, A.; Tasiou, M.; Torrisi, G. On the methodological framework of composite indices: A review of the issues of weighting, aggregation, and robustness. Soc. Indic. Res. 2019, 141, 61–94. [Google Scholar] [CrossRef] [Green Version]
- Ruiz, F.; El Gibari, S.; Cabello, J.M.; Gómez, T. MRP-WSCI: Multiple reference point based weak and strong composite indicators. Omega 2020, 95. [Google Scholar] [CrossRef]
- El Gibari, S.; Gómez, T.; Ruiz, F. Building composite indicators using multicriteria methods: A review. J. Bus. Econ. 2019, 89, 1–24. [Google Scholar] [CrossRef]
- Wang, J.J.; Jing, Y.Y.; Zhang, C.F.; Zhao, J.H. Review on multi-criteria decision analysis aid in sustainable energy decision-making. Renew. Sustain. Energy Rev. 2009, 13, 2263–3227. [Google Scholar] [CrossRef]
- Huang, I.B.; Keisler, J.; Linkov, I. Multi-criteria decision analysis in environmental sciences: Ten years of applications and trends. Sci. Total Environ. 2011, 409, 3578–3594. [Google Scholar] [CrossRef] [PubMed]
- Cinelli, M.; Coles, S.R.; Kirwan, K. Analysis of the potentials of multi criteria decision analysis methods to conduct sustainability assessment. Ecol. Indic. 2014, 46, 138–148. [Google Scholar] [CrossRef] [Green Version]
- Diaz-Balteiro, L.; González-Pachón, J.; Romero, C. Measuring systems sustainability with multi-criteria methods: A critical review. Eur. J. Oper. Res. 2017, 258, 607–616. [Google Scholar] [CrossRef]
- Hwang, C.L.; Yoon, K. Multiple Attribute Decision Making: Methods and Applications; Springer: Berlin, Germany, 1981. [Google Scholar]
- Hellwig, Z. Application of the taxonomic method to the typological division of countries due to the level of their development and the structure of qualified personnel. Stat. Rev. 1968, 4, 307–327. (In Polish) [Google Scholar]
- Zadeh, L.A. Fuzzy sets. Inf. Control 1965, 8, 338–353. [Google Scholar] [CrossRef] [Green Version]
- Zadeh, L.A. The concept of a linguistic variable and its application to approximate reasoning. Part 1. Inf. Sci. 1975, 8, 199–249. [Google Scholar] [CrossRef]
- Zadeh, L.A. The concept of a linguistic variable and its application to approximate reasoning. Part 2. Inf. Sci. 1975, 8, 301–357. [Google Scholar] [CrossRef]
- Zadeh, L.A. The concept of a linguistic variable and its application to approximate reasoning. Part 3. Inf. Sci. 1975, 9, 43–80. [Google Scholar] [CrossRef]
- Atanassov, K. Intuitionistic fuzzy sets. Fuzzy Sets Syst. 1986, 20, 87–96. [Google Scholar] [CrossRef]
- Atanassov, K.T. Intuitionistic Fuzzy Sets: Theory and Applications; Physica-Verlag: Heidelberg, Germany, 1999. [Google Scholar]
- Atanassov, K.; Gargov, G. Interval-valued intuitionistic fuzzy sets. Fuzzy Sets Syst. 1989, 31, 43–349. [Google Scholar] [CrossRef]
- Atanassov, K. Operators over interval-valued intuitionistic fuzzy sets. Fuzzy Sets Syst. 1994, 64, 159–174. [Google Scholar] [CrossRef]
- Pedrycz, W.; Ekel, P.; Parreiras, R. Fuzzy Multicriteria Decision-Making: Models, Methods and Applications; John Wiley & Sons: Hoboken, NJ, USA, 2011. [Google Scholar]
- Chen, S.M.; Yang, M.W.; Yang, S.W.; Sheu, T.W.; Liau, C.J. Multicriteria fuzzy decision making based on interval-valued intuitionistic fuzzy sets. Expert Syst. Appl. 2012, 39, 12085–12091. [Google Scholar] [CrossRef]
- Szmidt, E.; Kacprzyk, J. Remarks on some applications of intuitionistic fuzzy sets in decision making. Notes Intuit. Fuzzy Sets 1996, 2, 22–31. [Google Scholar]
- Szmidt, E.; Kacprzyk, J. An Application of Intuitionistic Fuzzy Set Similarity Measures to a Multi-criteria Decision Making Problem. In Artificial Intelligence and Soft Computing-ICAISC 2006; Rutkowski, L., Tadeusiewicz, R., Zadeh, L.A., Żurada, J.M., Eds.; Springer: Berlin/Heidelberg, Germany, 2006; Volume 4029, pp. 314–323. [Google Scholar]
- Bai, Z. An interval-valued intuitionistic fuzzy TOPSIS method based on an improved score function. Sci. World J. 2013, 2013, 1–6. [Google Scholar] [CrossRef] [Green Version]
- Lakshmana Gomathi Nayagam, V.; Muralikrishnan, S.; Sivaraman, G. Multi-criteria decision-making method based on interval-valued intuitionistic fuzzy sets. Expert Syst. Appl. 2011, 38, 1464–1467. [Google Scholar] [CrossRef]
- Priyadharsini, J.; Balasubramaniam, P. Multi-criteria decision making method based on interval-valued intuitionistic fuzzy sets. J. Anal. 2019, 27, 259–276. [Google Scholar] [CrossRef]
- Wang, J.; Li, K.; Zhang, H. Interval-valued intuitionistic fuzzy multi-criteria decision-making approach based on prospect score function. Knowl. Based Syst. 2012, 27, 119–125. [Google Scholar] [CrossRef]
- Chen, T.Y.; Hsiao, P.W.; Yen, Y.L. A multicriteria group decision-making approach based on interval-valued intuitionistic fuzzy sets: A comparative perspective. Expert Syst. Appl. 2011, 38, 7647–7650. [Google Scholar] [CrossRef]
- Meng, F.; Chen, X. Interval-valued intuitionistic fuzzy multi-criteria group decision making based on cross entropy and 2-additive measures. Soft Comput. 2015, 19, 2071–2082. [Google Scholar] [CrossRef]
- Wibowo, S. Interval-valued intuitionistic fuzzy multicriteria group decision making approach for hotel selection. Int. J. Mach. Learn. Comput. 2013, 3, 65–69. [Google Scholar] [CrossRef] [Green Version]
- Xu, Z. A method based on distance measure for interval-valued intuitionistic fuzzy group decision making. Inf. Sci. 2010, 180, 181–190. [Google Scholar] [CrossRef]
- Roszkowska, E.; Filipowicz-Chomko, M. Measuring sustainable development in the education area using multi-criteria methods: A case study. Cent. Eur. J. Oper. Res. 2020, 28, 1219–1241. [Google Scholar] [CrossRef] [Green Version]
- Roszkowska, E.; Filipowicz-Chomko, M. Measuring Sustainable Development Using an Extended Hellwig Method: A Case Study of Education. Soc. Indic. Res. 2021, 153, 299–322. [Google Scholar] [CrossRef]
- Hellwig, Z. On the Optimal Choice of Predictors. In Towards a System of Human Resources Indicators for Less Developed Countries: Papers Prepared for a UNESCO Research Project; Gostowski, Z., Ed.; Zakład Narodowy im. Ossolinskich: Wrocław, Poland, 1972; pp. 69–90. [Google Scholar]
- Hellwig, Z. Procedure of Evaluating High-Level Manpower Data and Typology of Countries by Means of the Taxonomic Method. In Towards a System of Human Resources Indicators for Less Developed Countries: Papers Prepared for a UNESCO Research Project; Gostowski, Z., Ed.; Zakład Narodowy im. Ossolinskich: Wrocław, Poland, 1972; pp. 115–134. [Google Scholar]
- Di Domizio, M. The competitive balance in the Italian football league: A taxonomic approach. Dep. Commun. Work Pap. Ser. 2008, 48, 1–17. [Google Scholar]
- Pawlas, I. Economic Picture of the Enlarged European Union in the Light of Taxonomic Research. In Proceedings of MAC-EMM 2016; Vopava, J., Douda, V., Kratochvil, R., Konecki, M., Eds.; MAC Prague Consulting Ltd.: Prague, Czech Republic, 2016; pp. 75–82. [Google Scholar]
- Jefmański, B. Intuitionistic Fuzzy Synthetic Measure for Ordinal Data. In Classification and Data Analysis. Theory and Applications; Jajuga, K., Batóg, J., Walesiak, M., Eds.; Springer: Berlin/Heidelberg, Germany, 2020; pp. 53–72. [Google Scholar]
Figure 1.
Procedure for the analysis of survey data.

Figure 2.
Box-plots for values of the synthetic measures.


Table 1.
The number of respondents in the communes.
| Communes | Communes | Communes | Communes | ||||
|---|---|---|---|---|---|---|---|
| A | 31 | D | 54 | G | 68 | J | 48 |
| B | 46 | E | 62 | H | 85 | K | 89 |
| C | 41 | F | 64 | I | 58 | - | - |
Table 2.
Frequency of selecting individual points on the measurement scale on the example of the criterion C1.
Table 2.
Frequency of selecting individual points on the measurement scale on the example of the criterion C1.
| Communes | Measurement Scale Points | “Hard to Say” | ||||
|---|---|---|---|---|---|---|
| “Very Unsatisfied” | “Unsatisfied” | “Satisfied” | “Very Satisfied” | |||
| A | 1 | 1 | 18 | 2 | 9 | 31 |
| B | 0 | 3 | 20 | 7 | 16 | 46 |
| C | 1 | 5 | 21 | 3 | 11 | 41 |
| D | 2 | 9 | 27 | 4 | 12 | 54 |
| E | 2 | 8 | 36 | 2 | 14 | 62 |
| F | 0 | 8 | 40 | 5 | 11 | 64 |
| G | 3 | 6 | 33 | 6 | 20 | 68 |
| H | 3 | 8 | 55 | 6 | 13 | 85 |
| I | 3 | 3 | 28 | 12 | 12 | 58 |
| J | 4 | 11 | 19 | 5 | 9 | 48 |
| K | 1 | 10 | 41 | 21 | 16 | 89 |
Table 3.
Fractions of respondents who assessed the communes negatively (NA), positively (PA), and had no opinion (NR) in terms of the partial criteria.
Table 3.
Fractions of respondents who assessed the communes negatively (NA), positively (PA), and had no opinion (NR) in terms of the partial criteria.
| Communes | Fractions | C1 | C2 | C3 | C4 | C5 | C6 | C7 | C8 |
|---|---|---|---|---|---|---|---|---|---|
| A | 0.065 | 0.065 | 0.129 | 0.258 | 0.065 | 0.129 | 0.032 | 0.000 | |
| 0.645 | 0.742 | 0.645 | 0.355 | 0.710 | 0.484 | 0.484 | 0.742 | ||
| 0.290 | 0.193 | 0.226 | 0.387 | 0.225 | 0.387 | 0.484 | 0.258 | ||
| B | 0.063 | 0.188 | 0.188 | 0.208 | 0.042 | 0.167 | 0.146 | 0.000 | |
| 0.563 | 0.458 | 0.625 | 0.334 | 0.729 | 0.354 | 0.479 | 0.833 | ||
| 0.374 | 0.354 | 0.187 | 0.458 | 0.229 | 0.479 | 0.375 | 0.167 | ||
| C | 0.143 | 0.143 | 0.167 | 0.262 | 0.048 | 0.214 | 0.071 | 0.024 | |
| 0.571 | 0.333 | 0.405 | 0.333 | 0.714 | 0.381 | 0.667 | 0.786 | ||
| 0.286 | 0.524 | 0.428 | 0.405 | 0.238 | 0.405 | 0.262 | 0.190 | ||
| D | 0.204 | 0.315 | 0.13 | 0.463 | 0.074 | 0.315 | 0.241 | 0.037 | |
| 0.574 | 0.426 | 0.556 | 0.296 | 0.722 | 0.500 | 0.537 | 0.778 | ||
| 0.222 | 0.259 | 0.314 | 0.241 | 0.204 | 0.185 | 0.222 | 0.185 | ||
| E | 0.159 | 0.095 | 0.063 | 0.111 | 0.048 | 0.111 | 0.095 | 0.000 | |
| 0.603 | 0.492 | 0.747 | 0.572 | 0.603 | 0.476 | 0.619 | 0.778 | ||
| 0.238 | 0.413 | 0.19 | 0.317 | 0.349 | 0.413 | 0.286 | 0.222 | ||
| F | 0.125 | 0.141 | 0.047 | 0.172 | 0.016 | 0.094 | 0.063 | 0.000 | |
| 0.703 | 0.453 | 0.719 | 0.266 | 0.625 | 0.563 | 0.594 | 0.797 | ||
| 0.172 | 0.406 | 0.234 | 0.562 | 0.359 | 0.343 | 0.343 | 0.203 | ||
| G | 0.132 | 0.088 | 0.103 | 0.250 | 0.118 | 0.118 | 0.265 | 0.015 | |
| 0.574 | 0.544 | 0.603 | 0.338 | 0.603 | 0.397 | 0.279 | 0.721 | ||
| 0.294 | 0.368 | 0.294 | 0.412 | 0.279 | 0.485 | 0.456 | 0.264 | ||
| H | 0.126 | 0.264 | 0.207 | 0.322 | 0.069 | 0.195 | 0.241 | 0.023 | |
| 0.702 | 0.449 | 0.609 | 0.414 | 0.713 | 0.483 | 0.472 | 0.839 | ||
| 0.172 | 0.287 | 0.184 | 0.264 | 0.218 | 0.322 | 0.287 | 0.138 | ||
| I | 0.102 | 0.169 | 0.136 | 0.288 | 0.102 | 0.119 | 0.034 | 0.017 | |
| 0.678 | 0.526 | 0.559 | 0.424 | 0.559 | 0.356 | 0.746 | 0.78 | ||
| 0.220 | 0.305 | 0.305 | 0.288 | 0.339 | 0.525 | 0.220 | 0.203 | ||
| J | 0.294 | 0.235 | 0.333 | 0.255 | 0.176 | 0.333 | 0.196 | 0.039 | |
| 0.471 | 0.549 | 0.392 | 0.333 | 0.529 | 0.333 | 0.412 | 0.667 | ||
| 0.235 | 0.216 | 0.275 | 0.412 | 0.295 | 0.334 | 0.392 | 0.294 | ||
| K | 0.122 | 0.156 | 0.044 | 0.233 | 0.111 | 0.156 | 0.089 | 0.033 | |
| 0.689 | 0.633 | 0.600 | 0.356 | 0.656 | 0.444 | 0.644 | 0.778 | ||
| 0.189 | 0.211 | 0.356 | 0.411 | 0.233 | 0.400 | 0.267 | 0.189 |
Table 4.
Values of the optimism coefficient for communes.
| Communes | Optimism Coefficient |
|---|---|
| A | 0.866 |
| B | 0.814 |
| C | 0.796 |
| D | 0.712 |
| E | 0.877 |
| F | 0.878 |
| G | 0.789 |
| H | 0.764 |
| I | 0.827 |
| J | 0.664 |
| K | 0.836 |
Table 5.
Degrees of membership in the form of intervals for criteria C1–C4.
| Communes | C1 | C2 | C3 | C4 | ||||
|---|---|---|---|---|---|---|---|---|
| L | U | L | U | L | U | L | U | |
| A | 0.645 | 0.902 | 0.742 | 0.913 | 0.645 | 0.845 | 0.355 | 0.698 |
| B | 0.563 | 0.867 | 0.458 | 0.746 | 0.625 | 0.777 | 0.334 | 0.707 |
| C | 0.571 | 0.799 | 0.333 | 0.750 | 0.405 | 0.746 | 0.333 | 0.655 |
| D | 0.574 | 0.732 | 0.426 | 0.610 | 0.556 | 0.780 | 0.296 | 0.468 |
| E | 0.603 | 0.812 | 0.492 | 0.854 | 0.747 | 0.914 | 0.572 | 0.850 |
| F | 0.703 | 0.854 | 0.453 | 0.809 | 0.719 | 0.924 | 0.266 | 0.759 |
| G | 0.574 | 0.806 | 0.544 | 0.834 | 0.603 | 0.835 | 0.338 | 0.663 |
| H | 0.702 | 0.833 | 0.449 | 0.668 | 0.609 | 0.750 | 0.414 | 0.616 |
| I | 0.678 | 0.860 | 0.526 | 0.778 | 0.559 | 0.811 | 0.424 | 0.662 |
| J | 0.471 | 0.627 | 0.549 | 0.692 | 0.392 | 0.575 | 0.333 | 0.607 |
| K | 0.689 | 0.847 | 0.633 | 0.809 | 0.600 | 0.898 | 0.356 | 0.700 |
Table 6.
Degrees of membership in the form of intervals for criteria C5–C8.
| Communes | C5 | C6 | C7 | C8 | ||||
|---|---|---|---|---|---|---|---|---|
| L | U | L | U | L | U | L | U | |
| A | 0.710 | 0.909 | 0.484 | 0.827 | 0.484 | 0.913 | 0.742 | 0.971 |
| B | 0.729 | 0.915 | 0.354 | 0.744 | 0.479 | 0.784 | 0.833 | 0.969 |
| C | 0.714 | 0.903 | 0.381 | 0.703 | 0.667 | 0.876 | 0.786 | 0.937 |
| D | 0.722 | 0.867 | 0.500 | 0.632 | 0.537 | 0.695 | 0.778 | 0.910 |
| E | 0.603 | 0.909 | 0.476 | 0.838 | 0.619 | 0.870 | 0.778 | 0.973 |
| F | 0.625 | 0.940 | 0.563 | 0.864 | 0.594 | 0.895 | 0.797 | 0.975 |
| G | 0.603 | 0.823 | 0.397 | 0.780 | 0.279 | 0.639 | 0.721 | 0.929 |
| H | 0.713 | 0.880 | 0.483 | 0.729 | 0.472 | 0.691 | 0.839 | 0.944 |
| I | 0.559 | 0.839 | 0.356 | 0.790 | 0.746 | 0.928 | 0.780 | 0.948 |
| J | 0.529 | 0.725 | 0.333 | 0.555 | 0.412 | 0.672 | 0.667 | 0.862 |
| K | 0.656 | 0.851 | 0.444 | 0.778 | 0.644 | 0.867 | 0.778 | 0.936 |
Table 7.
Degrees of non-membership in the form of intervals for criteria C1–C4.
| Communes | C1 | C2 | C3 | C4 | ||||
|---|---|---|---|---|---|---|---|---|
| L | U | L | U | L | U | L | U | |
| A | 0.065 | 0.104 | 0.065 | 0.091 | 0.129 | 0.159 | 0.258 | 0.310 |
| B | 0.063 | 0.133 | 0.188 | 0.254 | 0.188 | 0.223 | 0.208 | 0.293 |
| C | 0.143 | 0.201 | 0.143 | 0.250 | 0.167 | 0.254 | 0.262 | 0.345 |
| D | 0.204 | 0.268 | 0.315 | 0.390 | 0.130 | 0.220 | 0.463 | 0.532 |
| E | 0.159 | 0.188 | 0.095 | 0.146 | 0.063 | 0.086 | 0.111 | 0.150 |
| F | 0.125 | 0.146 | 0.141 | 0.191 | 0.047 | 0.076 | 0.172 | 0.241 |
| G | 0.132 | 0.194 | 0.088 | 0.166 | 0.103 | 0.165 | 0.250 | 0.337 |
| H | 0.126 | 0.167 | 0.264 | 0.332 | 0.207 | 0.250 | 0.322 | 0.384 |
| I | 0.102 | 0.140 | 0.169 | 0.222 | 0.136 | 0.189 | 0.288 | 0.338 |
| J | 0.294 | 0.373 | 0.235 | 0.308 | 0.333 | 0.425 | 0.255 | 0.393 |
| K | 0.122 | 0.153 | 0.156 | 0.191 | 0.044 | 0.102 | 0.233 | 0.300 |
Table 8.
Degrees of nonmembership in the form of intervals for criteria C5–C8.
| Communes | C5 | C6 | C7 | C8 | ||||
|---|---|---|---|---|---|---|---|---|
| L | U | L | U | L | U | L | U | |
| A | 0.065 | 0.095 | 0.129 | 0.181 | 0.032 | 0.097 | 0.000 | 0.035 |
| B | 0.042 | 0.085 | 0.167 | 0.256 | 0.146 | 0.216 | 0.000 | 0.031 |
| C | 0.048 | 0.097 | 0.214 | 0.297 | 0.071 | 0.124 | 0.024 | 0.063 |
| D | 0.074 | 0.133 | 0.315 | 0.368 | 0.241 | 0.305 | 0.037 | 0.090 |
| E | 0.048 | 0.091 | 0.111 | 0.162 | 0.095 | 0.130 | 0.000 | 0.027 |
| F | 0.016 | 0.060 | 0.094 | 0.136 | 0.063 | 0.105 | 0.000 | 0.025 |
| G | 0.118 | 0.177 | 0.118 | 0.220 | 0.265 | 0.361 | 0.015 | 0.071 |
| H | 0.069 | 0.120 | 0.195 | 0.271 | 0.241 | 0.309 | 0.023 | 0.056 |
| I | 0.102 | 0.161 | 0.119 | 0.210 | 0.034 | 0.072 | 0.017 | 0.052 |
| J | 0.176 | 0.275 | 0.333 | 0.445 | 0.196 | 0.328 | 0.039 | 0.138 |
| K | 0.111 | 0.149 | 0.156 | 0.222 | 0.089 | 0.133 | 0.033 | 0.064 |
Table 9.
Degrees of hesitancy in the form of intervals for criteria C1–C4.
| Communes | C1 | C2 | C3 | C4 | ||||
|---|---|---|---|---|---|---|---|---|
| L | U | L | U | L | U | L | U | |
| A | 0.000 | 0.290 | 0.000 | 0.193 | 0.000 | 0.226 | 0.000 | 0.387 |
| B | 0.000 | 0.374 | 0.000 | 0.354 | 0.000 | 0.187 | 0.000 | 0.458 |
| C | 0.000 | 0.286 | 0.000 | 0.524 | 0.000 | 0.428 | 0.000 | 0.405 |
| D | 0.000 | 0.222 | 0.000 | 0.259 | 0.000 | 0.314 | 0.000 | 0.241 |
| E | 0.000 | 0.238 | 0.000 | 0.413 | 0.000 | 0.190 | 0.000 | 0.317 |
| F | 0.000 | 0.172 | 0.000 | 0.406 | 0.000 | 0.234 | 0.000 | 0.562 |
| G | 0.000 | 0.294 | 0.000 | 0.368 | 0.000 | 0.294 | 0.000 | 0.412 |
| H | 0.000 | 0.172 | 0.000 | 0.287 | 0.000 | 0.184 | 0.000 | 0.264 |
| I | 0.000 | 0.220 | 0.000 | 0.305 | 0.000 | 0.305 | 0.000 | 0.288 |
| J | 0.000 | 0.235 | 0.000 | 0.216 | 0.000 | 0.275 | 0.000 | 0.412 |
| K | 0.000 | 0.189 | 0.000 | 0.211 | 0.000 | 0.356 | 0.000 | 0.411 |
Table 10.
Degrees of hesitancy in the form of intervals for criteria C5–C8.
| Communes | C5 | C6 | C7 | C8 | ||||
|---|---|---|---|---|---|---|---|---|
| L | U | L | U | L | U | L | U | |
| A | 0.000 | 0.225 | 0.000 | 0.387 | 0.000 | 0.484 | 0.000 | 0.258 |
| B | 0.000 | 0.229 | 0.000 | 0.479 | 0.000 | 0.375 | 0.000 | 0.167 |
| C | 0.000 | 0.238 | 0.000 | 0.405 | 0.000 | 0.262 | 0.000 | 0.190 |
| D | 0.000 | 0.204 | 0.000 | 0.185 | 0.000 | 0.222 | 0.000 | 0.185 |
| E | 0.000 | 0.349 | 0.000 | 0.413 | 0.000 | 0.286 | 0.000 | 0.222 |
| F | 0.000 | 0.359 | 0.000 | 0.343 | 0.000 | 0.343 | 0.000 | 0.203 |
| G | 0.000 | 0.279 | 0.000 | 0.485 | 0.000 | 0.456 | 0.000 | 0.264 |
| H | 0.000 | 0.218 | 0.000 | 0.322 | 0.000 | 0.287 | 0.000 | 0.138 |
| I | 0.000 | 0.339 | 0.000 | 0.525 | 0.000 | 0.220 | 0.000 | 0.203 |
| J | 0.000 | 0.295 | 0.000 | 0.334 | 0.000 | 0.392 | 0.000 | 0.294 |
| K | 0.000 | 0.233 | 0.000 | 0.400 | 0.000 | 0.267 | 0.000 | 0.189 |
Table 11.
Coordinates of the reference object for criteria C1–C4.
| Pattern | C1 | C2 | C3 | C4 | ||||
|---|---|---|---|---|---|---|---|---|
| L | U | L | U | L | U | L | U | |
| 0.703 | 0.902 | 0.742 | 0.913 | 0.747 | 0.924 | 0.572 | 0.850 | |
| 0.063 | 0.104 | 0.065 | 0.091 | 0.044 | 0.076 | 0.111 | 0.150 | |
| 0.000 | 0.234 | 0.000 | 0.193 | 0.000 | 0.209 | 0.000 | 0.317 | |
Table 12.
Coordinates of the reference object for criteria C5–C8.
| Pattern | C5 | C6 | C7 | C8 | ||||
|---|---|---|---|---|---|---|---|---|
| L | U | L | U | L | U | L | U | |
| 0.729 | 0.940 | 0.563 | 0.864 | 0.746 | 0.928 | 0.839 | 0.975 | |
| 0.016 | 0.060 | 0.094 | 0.136 | 0.032 | 0.072 | 0.000 | 0.025 | |
| 0.000 | 0.255 | 0.000 | 0.343 | 0.000 | 0.222 | 0.000 | 0.161 | |
Table 13.
Object distances from the reference object.
| Communes | Distance | Communes | Distance | Communes | Distance | Communes | Distance |
|---|---|---|---|---|---|---|---|
| A | 0.102 | D | 0.213 | G | 0.174 | J | 0.245 |
| B | 0.145 | E | 0.085 | H | 0.164 | K | 0.099 |
| C | 0.169 | F | 0.113 | I | 0.121 | - | - |
Table 14.
I-VIFSM values for communes.
| Communes | I-VIFSM | Ranking Position |
|---|---|---|
| A | 0.580 | 3 |
| B | 0.406 | 6 |
| C | 0.306 | 8 |
| D | 0.129 | 10 |
| E | 0.650 | 1 |
| F | 0.537 | 4 |
| G | 0.288 | 9 |
| H | 0.328 | 7 |
| I | 0.502 | 5 |
| J | -0.002 | 11 |
| K | 0.596 | 2 |
Table 15.
The results of the comparative analysis of the synthetic measures Hellwig’s synthetic measure (HSM), Intuitionistic Fuzzy Synthetic Measure (IFSM), and Interval-Valued Intuitionistic Fuzzy Synthetic Measure (I-VIFSM).
Table 15.
The results of the comparative analysis of the synthetic measures Hellwig’s synthetic measure (HSM), Intuitionistic Fuzzy Synthetic Measure (IFSM), and Interval-Valued Intuitionistic Fuzzy Synthetic Measure (I-VIFSM).
| Communes | HSM | Ranking Position | IFSM | Ranking Position | I-VIFSM | Ranking Position |
|---|---|---|---|---|---|---|
| A | 0.478 | 4 | 0.464 | 3 | 0.580 | 3 |
| B | 0.211 | 8 | 0.297 | 7 | 0.406 | 6 |
| C | 0.291 | 6 | 0.168 | 10 | 0.306 | 8 |
| D | 0.219 | 9 | 0.169 | 9 | 0.129 | 10 |
| E | 0.438 | 3 | 0.534 | 2 | 0.650 | 1 |
| F | 0.518 | 2 | 0.372 | 5 | 0.537 | 4 |
| G | 0.219 | 7 | 0.172 | 8 | 0.288 | 9 |
| H | 0.241 | 10 | 0.337 | 6 | 0.328 | 7 |
| I | 0.547 | 1 | 0.427 | 4 | 0.502 | 5 |
| J | −0.008 | 11 | 0.032 | 11 | −0.002 | 11 |
| K | 0.473 | 5 | 0.540 | 1 | 0.596 | 2 |
Publisher’s Note: MDPI stays neutral with regard to jurisdictional claims in published maps and institutional affiliations. |
© 2021 by the authors. Licensee MDPI, Basel, Switzerland. This article is an open access article distributed under the terms and conditions of the Creative Commons Attribution (CC BY) license (http://creativecommons.org/licenses/by/4.0/).
Share and Cite
MDPI and ACS Style
Roszkowska, E.; Jefmański, B. Interval-Valued Intuitionistic Fuzzy Synthetic Measure (I-VIFSM) Based on Hellwig’s Approach in the Analysis of Survey Data. Mathematics 2021, 9, 201. https://0-doi-org.brum.beds.ac.uk/10.3390/math9030201
AMA Style
Roszkowska E, Jefmański B. Interval-Valued Intuitionistic Fuzzy Synthetic Measure (I-VIFSM) Based on Hellwig’s Approach in the Analysis of Survey Data. Mathematics. 2021; 9(3):201. https://0-doi-org.brum.beds.ac.uk/10.3390/math9030201
Chicago/Turabian StyleRoszkowska, Ewa, and Bartłomiej Jefmański. 2021. "Interval-Valued Intuitionistic Fuzzy Synthetic Measure (I-VIFSM) Based on Hellwig’s Approach in the Analysis of Survey Data" Mathematics 9, no. 3: 201. https://0-doi-org.brum.beds.ac.uk/10.3390/math9030201
Note that from the first issue of 2016, this journal uses article numbers instead of page numbers. See further details here.