Article

A Proposal of Quantum-Inspired Machine Learning for Medical Purposes: An Application Case

1
Struttura Semplice Dipartimentale di Fisica Sanitaria, I.R.C.C.S. Istituto Tumori “Giovanni Paolo II”, Viale Orazio Flacco 65, 70124 Bari, Italy
2
Dipartimento di Farmacia-Scienze del Farmaco, Università degli Studi di Bari, 70126 Bari, Italy
3
Istituto Nazionale di Fisica Nucleare, Sezione di Bari, 70126 Bari, Italy
4
Dipartimento di Fisica, Università degli Studi di Bari, 70126 Bari, Italy
5
Dipartimento di Economia e Finanza, Università degli Studi di Bari, 70124 Bari, Italy
6
Dipartimento di Matematica, Università degli Studi di Bari, 70126 Bari, Italy
7
Struttura Semplice Dipartimentale di Radiologia Senologica, I.R.C.C.S. Istituto Tumori “Giovanni Paolo II”, Viale Orazio Flacco 65, 70124 Bari, Italy
8
Unità Operativa Complessa di Anatomia Patologica, I.R.C.C.S. Istituto Tumori “Giovanni Paolo II”, Viale Orazio Flacco 65, 70124 Bari, Italy
9
Unità Operativa Complessa di Oncologia Medica, I.R.C.C.S. Istituto Tumori “Giovanni Paolo II”, Viale Orazio Flacco 65, 70124 Bari, Italy
*
Authors to whom correspondence should be addressed.
Submission received: 20 December 2020 / Revised: 28 January 2021 / Accepted: 16 February 2021 / Published: 19 February 2021
(This article belongs to the Special Issue Computational Approaches for Data Inspection in Biomedicine)

Abstract

:
Learning tasks are implemented via mappings of the sampled data set, including both the classical and the quantum framework. Biomedical data characterizing complex diseases such as cancer typically require an algorithmic support for clinical decisions, especially for early stage tumors that typify breast cancer patients, which are still controllable in a therapeutic and surgical way. Our case study consists of the prediction during the pre-operative stage of lymph node metastasis in breast cancer patients resulting in a negative diagnosis after clinical and radiological exams. The classifier adopted to establish a baseline is characterized by the result invariance for the order permutation of the input features, and it exploits stratifications in the training procedure. The quantum one mimics support vector machine mapping in a high-dimensional feature space, yielded by encoding into qubits, while being characterized by complexity. Feature selection is exploited to study the performances associated with a low number of features, thus implemented in a feasible time. Wide variations in sensitivity and specificity are observed in the selected optimal classifiers during cross-validations for both classification system types, with an easier detection of negative or positive cases depending on the choice between the two training schemes. Clinical practice is still far from being reached, even if the flexible structure of quantum-inspired classifier circuits guarantees further developments to rule interactions among features: this preliminary study is solely intended to provide an overview of the particular tree tensor network scheme in a simplified version adopting just product states, as well as to introduce typical machine learning procedures consisting of feature selection and classifier performance evaluation.

1. Introduction

Machine learning procedures consist of a map composition aiming at the approximation of a certain concept, representing a truth mapping of each sampled object to a label [1,2]. Labels are known for each element in the supervised framework, while in the unsupervised one, this information is lost; fortunately, we configure our application in the first case. The previously mentioned procedures are defined as classification systems [1] or hypotheses [2], whose numerical implementation takes as inputs the experimental outcomes. These data can be already prepared in a format and quantity useful for further elaboration; otherwise, they require an intermediate step to extract the most important information, commonly known as features. Such preparation of input features of the classifier strongly depends on the scheme exploited for the discrimination among available information.
Machine learning applications have been thoroughly explored in the last few decades for many clinical purposes. The reason can be found in the exponential growth of large publicly available databases, which have fostered the design and development of novel strategies for data management and analysis. In particular, machine learning strategies have proven their effectiveness in computer-aided detection systems in several applications, such as modeling aging processes [3,4,5], predicting the onset of several pathological conditions [6,7,8,9,10,11], or exploring genetic patterns [12,13,14]. However, the cross-talk between data yielded by different sources is still a developing research field (e.g., radiomics, dosiomics) based on the existence of a wide variety of algorithmic schemes able to implement the interplay of features.
Quantum machine learning spans a wide variety of algorithms covering both supervised and unsupervised approaches. The basis offered by some examples such as k-means, k-medians, support vector machine, principal component analysis, and neural networks is exploited for the associated quantum version primarily aiming at the achievement of a speed-up in computation [15,16,17,18,19,20]. The improvement in the predictive capabilities is examined in our case study by means of classical hardware, even if our introductory analysis deals with the small subspace consisting of product states. The inclusion of the full Hilbert space is targeted by truly quantum machine learning, whose computational complexity is managed by the tensor networks representation of states, based on tensor rank decompositions [21,22,23]. Recent developments are focused on the implementation of graphical models, applied even in radiological therapy optimization [24,25], and also, medical imaging techniques are extensively studied for tomography and magnetic resonance applications [26,27].
The use of such quantum algorithmic schemes further extends the applicable engineered interactions among variables, as we apply in our preliminary study of a quantum-inspired classifier circuit involving bioinformatics data, where the interaction is ruled by Hamiltonian terms imposing an energy cost between feature pairs in a multi-layer hierarchical structure. This approach driven by data science represents a resource concerning the management of the computational complexity characterizing systems endowed with an intractable number of degrees of freedom [28].
Cancer is a complex disease involving multiple data types, which may represent an obstacle for clinical and radiological diagnosis, especially in early stage cases. Algorithms supporting such kinds of decisions represent a valuable capability to face the complexity implied by the interplay among variables. The identification of patients characterized by metastatic diffusion of cancer cells has to deal with the following transition: a tumor mass requires a high quantity of resources, thus inducing modifications of vessels with respect to a healthy organ [29]. A local resource imbalance of the affected organ may dynamically involve the whole organ network through a cancer cell migration event. A predictive model needs to characterize this abrupt change of the scale concerned with the disease effects, thus imposing a careful choice of features, e.g., biomarkers for the specific topic to which we are referring.
In the biomedical framework, features are generally called prognostic factors, typical for the studied pathology, which establishes causal relations among them that may involve multiple variables for a single effect. The data quantity and quality of retrospective cases strongly influence the performances of the applied machine learning procedures. Both attributes are limited in medicine to achieve low measurement invasiveness. On the other hand, the time and costs required by intra-operative analysis of excised lymph nodes in breast cancer, together with threatening pathologies possibly caused by such a biopsy [30,31,32], have boosted the research into efficient algorithmic methods, as well as measurement setup engineering.
In breast cancer cases, the detection of lymph node metastasis in pre-operative stages can sensibly optimize care quality and efficiency, as well as patient safety [33]. Those not affected by clinical or radiological exams are said to be clinically negative, but among these cases, false negative patients are included, especially when they are characterized as early stage tumors. The decision making process for a complex disease like cancer is made harder also by the choice of features, thus defining a crucial step towards personalized medicine, especially in the early stage characterized by a low informative content of singularly considered prognostic factors. Within this framework, clinical decision support systems can act in a complementary way with clinical and radiological exams, such that patient’s status is described more efficiently by relevant features.
The computational complexity characterizing the quantum-inspired classifier limits the presented performance analysis to up to three features, and we keep the same number of included prognostic factors in the classical one to provide a baseline. The algorithmic scheme adopted for the latter is based on the predictive model of CancerMath (CM) [34,35,36], a web-calculator estimating the probability of cancer cell migration towards lymph nodes. The last adopts a stratified format for some input data, as usually made for some medical information, thus suggesting to test two versions of the quantum-inspired classifier with an emerging interplay between the selection of true positive or true negative cases. In summary, we use different classification systems, so their comparison is purely qualitative.

2. Materials and Methods

Our data set is composed of histological outcomes of 634 patients registered in the period 2015–2018 and referred to Istituto Tumori “Giovanni Paolo II” in Bari, Italy, which were clinically negative in instrumental examination. The features used by the classifiers consist of the age at diagnosis, tumor size (diameter, measured in mm), histological subtype (ductal, lobular, special type), estrogen receptor expression (ER, %), progesterone receptor expression (PgR, %), cellular marker for proliferation (Ki67, %), histological grade (grading, Elston–Ellis scale: G1, G2, G3), human epidermal growth factor receptor-2 (Her2/neu: 0, 1 + , 2 + , 3 + ), multiple tumors (Pos/Neg), the in situ component (Pos/Neg), and the lymph nodes status (Pos/Neg) required in our supervised learning approach, as described in Table 1.
Immunohistochemical analysis carried out by the sub-specialty department of breast disease in our institute yielded measurements of histological grade and expression of ER, PgR, Ki67 antigen associated with cell proliferation, and Her2/neu. The in situ component consisted of the presence of cancer in breast ducts, which usually remains in the tube without dangerous development in the external environment, while multiple tumors expressed the observation of more than one nodule.
Originally, ER, PgR, and Ki67 were percentage values, which were converted into binary variables for the CM and one of the two quantum-inspired classifiers by imposing a threshold equal to 1 % for ER and PgR, while 21 % for Ki67. The tumor size was expressed according to a categorical variable associated with intervals, which was converted selecting the midpoint: T1a ( 1 , 5 ] , T1b ( 5 , 10 ] , T1c ( 10 , 20 ] , and T2 ( 20 , 50 ] . The retrospective observational study was approved by our Institute’s Scientific Board.

2.1. Classification Systems: The CancerMath Example

Automated classification serves as a support in clinical decisions, getting as inputs bioinformatics data recorded for each patient. Our data set D = { x 1 , , x N } is a sample of the outcomes population set Ω yielded by multiple types of sensors s : Ω D . Another map takes any sampled data into the label set L = { 1 , , n } , T : Ω L , named the truth or concept mapping, whose approximation through a hypothesis lies at the heart of classification systems theory. The concept mapping T defines a partition of the population set Ω = Ω 1 Ω n , where Ω k = { ω Ω : T ( ω ) = k } , with Ω i Ω j = for every i j [1,2].
The hypothesis mapping corresponds to the classification system A : Ω L , given by the composition of sensors s with a feature map Ψ and a subsequent classifier c . Depending on the data set format, the feature map has to support the identification of attributes for classification: in practice, it has to extract characterizing features from the raw data subject to the map Ψ : D F , where F is the feature space. To conclude the aforementioned composition, we introduce a classifier c : F L , such that the classification system reads A = c Ψ s [1]. It is important to stress that a dependence on the parameters for both the feature map and the classifier can be introduced; we consider just the latter, with a specific choice of the parameter set for the CM and the two versions of quantum-inspired classifiers. Moreover, the feature map consists of the identity for most of the variables in the CM classifier with the exception of ER, PgR, and Ki67, each one mapped into two strata by imposing a threshold (1%, 1%, and 21%, respectively) and age with 6 strata as shown in Table 1. Instead the quantum case adopts a high-dimensional feature space, thus mimicking support vector machines. Finally, the histological type is used as a categorical variable in the CM classifier, while the 3 cases shown in Table 1 are converted into two binary features for both quantum-inspired classifiers. The latter is distinguished just by the adoption of a continuous or binary version of ER, PgR, and Ki67. Input feature formats for each case are summarized in Table 2.
We denote the data as x i j , i = 1 , , N , where the index j runs over patients in the dataset, j = 1 , , M , such that we have a data set per patient D j = { x 1 j , , x N j } yielded by some sensors. We choose as a reference classifier the scheme adopted by CM, an open-source cancer web-calculator [34,35,36]. The online code is not endowed with any training procedure, and it imposes pre-set parameters, while we implement it following literature instructions [34,35]. The algorithm implements a probabilistic model for the diffusion of cancer cells belonging to the primary lesion. The fundamental building block consists of a probabilistic estimation of the migration event to lymph nodes expressed by an exponential model:
c g ( x j ) = 1 e Q n x 1 j i g i j ,
where x j = ( x 1 j , , x N j ) and x 1 j is fixed as the diameter datum of the primary cancer mass, g i j are the parameters associated with the remaining data, in our case with N = 10 regarding age, grading, histological type, ER (Pos/Neg with cut-off 1%), PgR (Pos/Neg with cut-off 1%), Ki67 (Pos/Neg with cut-off 21%), Her2/neu (0, 1 + , 2 + , 3 + ), multiple tumors (Pos/Neg), the in situ component (Pos/Neg), while Q n is a parameter referring to the whole population. We choose the notation g = ( g 2 , , g N ) because the index 1 refers to the diameter x 1 j , which is not endowed with a training parameter, with each g i containing components g i h with h labeling a specific stratum for each feature [37], listed in Table 1: depending on the ones a patient belongs to, a set of g i j is chosen among these components.
The values of both Q n and the parameters g i are determined using a training procedure in the training set, yielding a measure of the prognostic factor impact as a statistically independent cause [34,35]. During this stage, the mean diffusion probability with a uniform weight has to be evaluated in each stratum of the training set composed by M i , h patients,
c g i h ¯ ( M i , h ) = 1 M i , h j = 1 M i , h c g i h ( x j ) = 1 1 M i , h j = 1 M i , h e Q n x 1 j g i h .
In the first part of the training procedure, the g i parameters are initially assumed equal to one, and the parameter Q n is evaluated by equating the observed statistical frequency of positive lymph nodes in the whole data set with the expected mean diffusion probability, a function expressed by Equation (2) with known patient’s diameters and unknown parameter Q n , which is determined numerically. Then, the value of Q n is set in each stratum, and the same procedure is carried out for each range of values of the prognostic factors. The value of parameter g i h is determined again by solving the equation between the observed statistical frequency of positive lymph nodes, corresponding to each patient’s stratum deduced in Table 1 and the mean diffusion probability in Equation (2). Corresponding to missing data, the parameter g i j is imposed equal to 1 to avoid any influence on the product of Equation (1).
We have to underline that the presented procedure imposes unit parameters for all remaining variables during the calculation corresponding to a certain stratum. This translates into a commutative classifier with respect to data ordering: given a permutation π S N , the property c g ( x j ) = c g ( π ( x j ) ) is verified, while this does not hold true in the following. We define this scheme as classical because of this property.

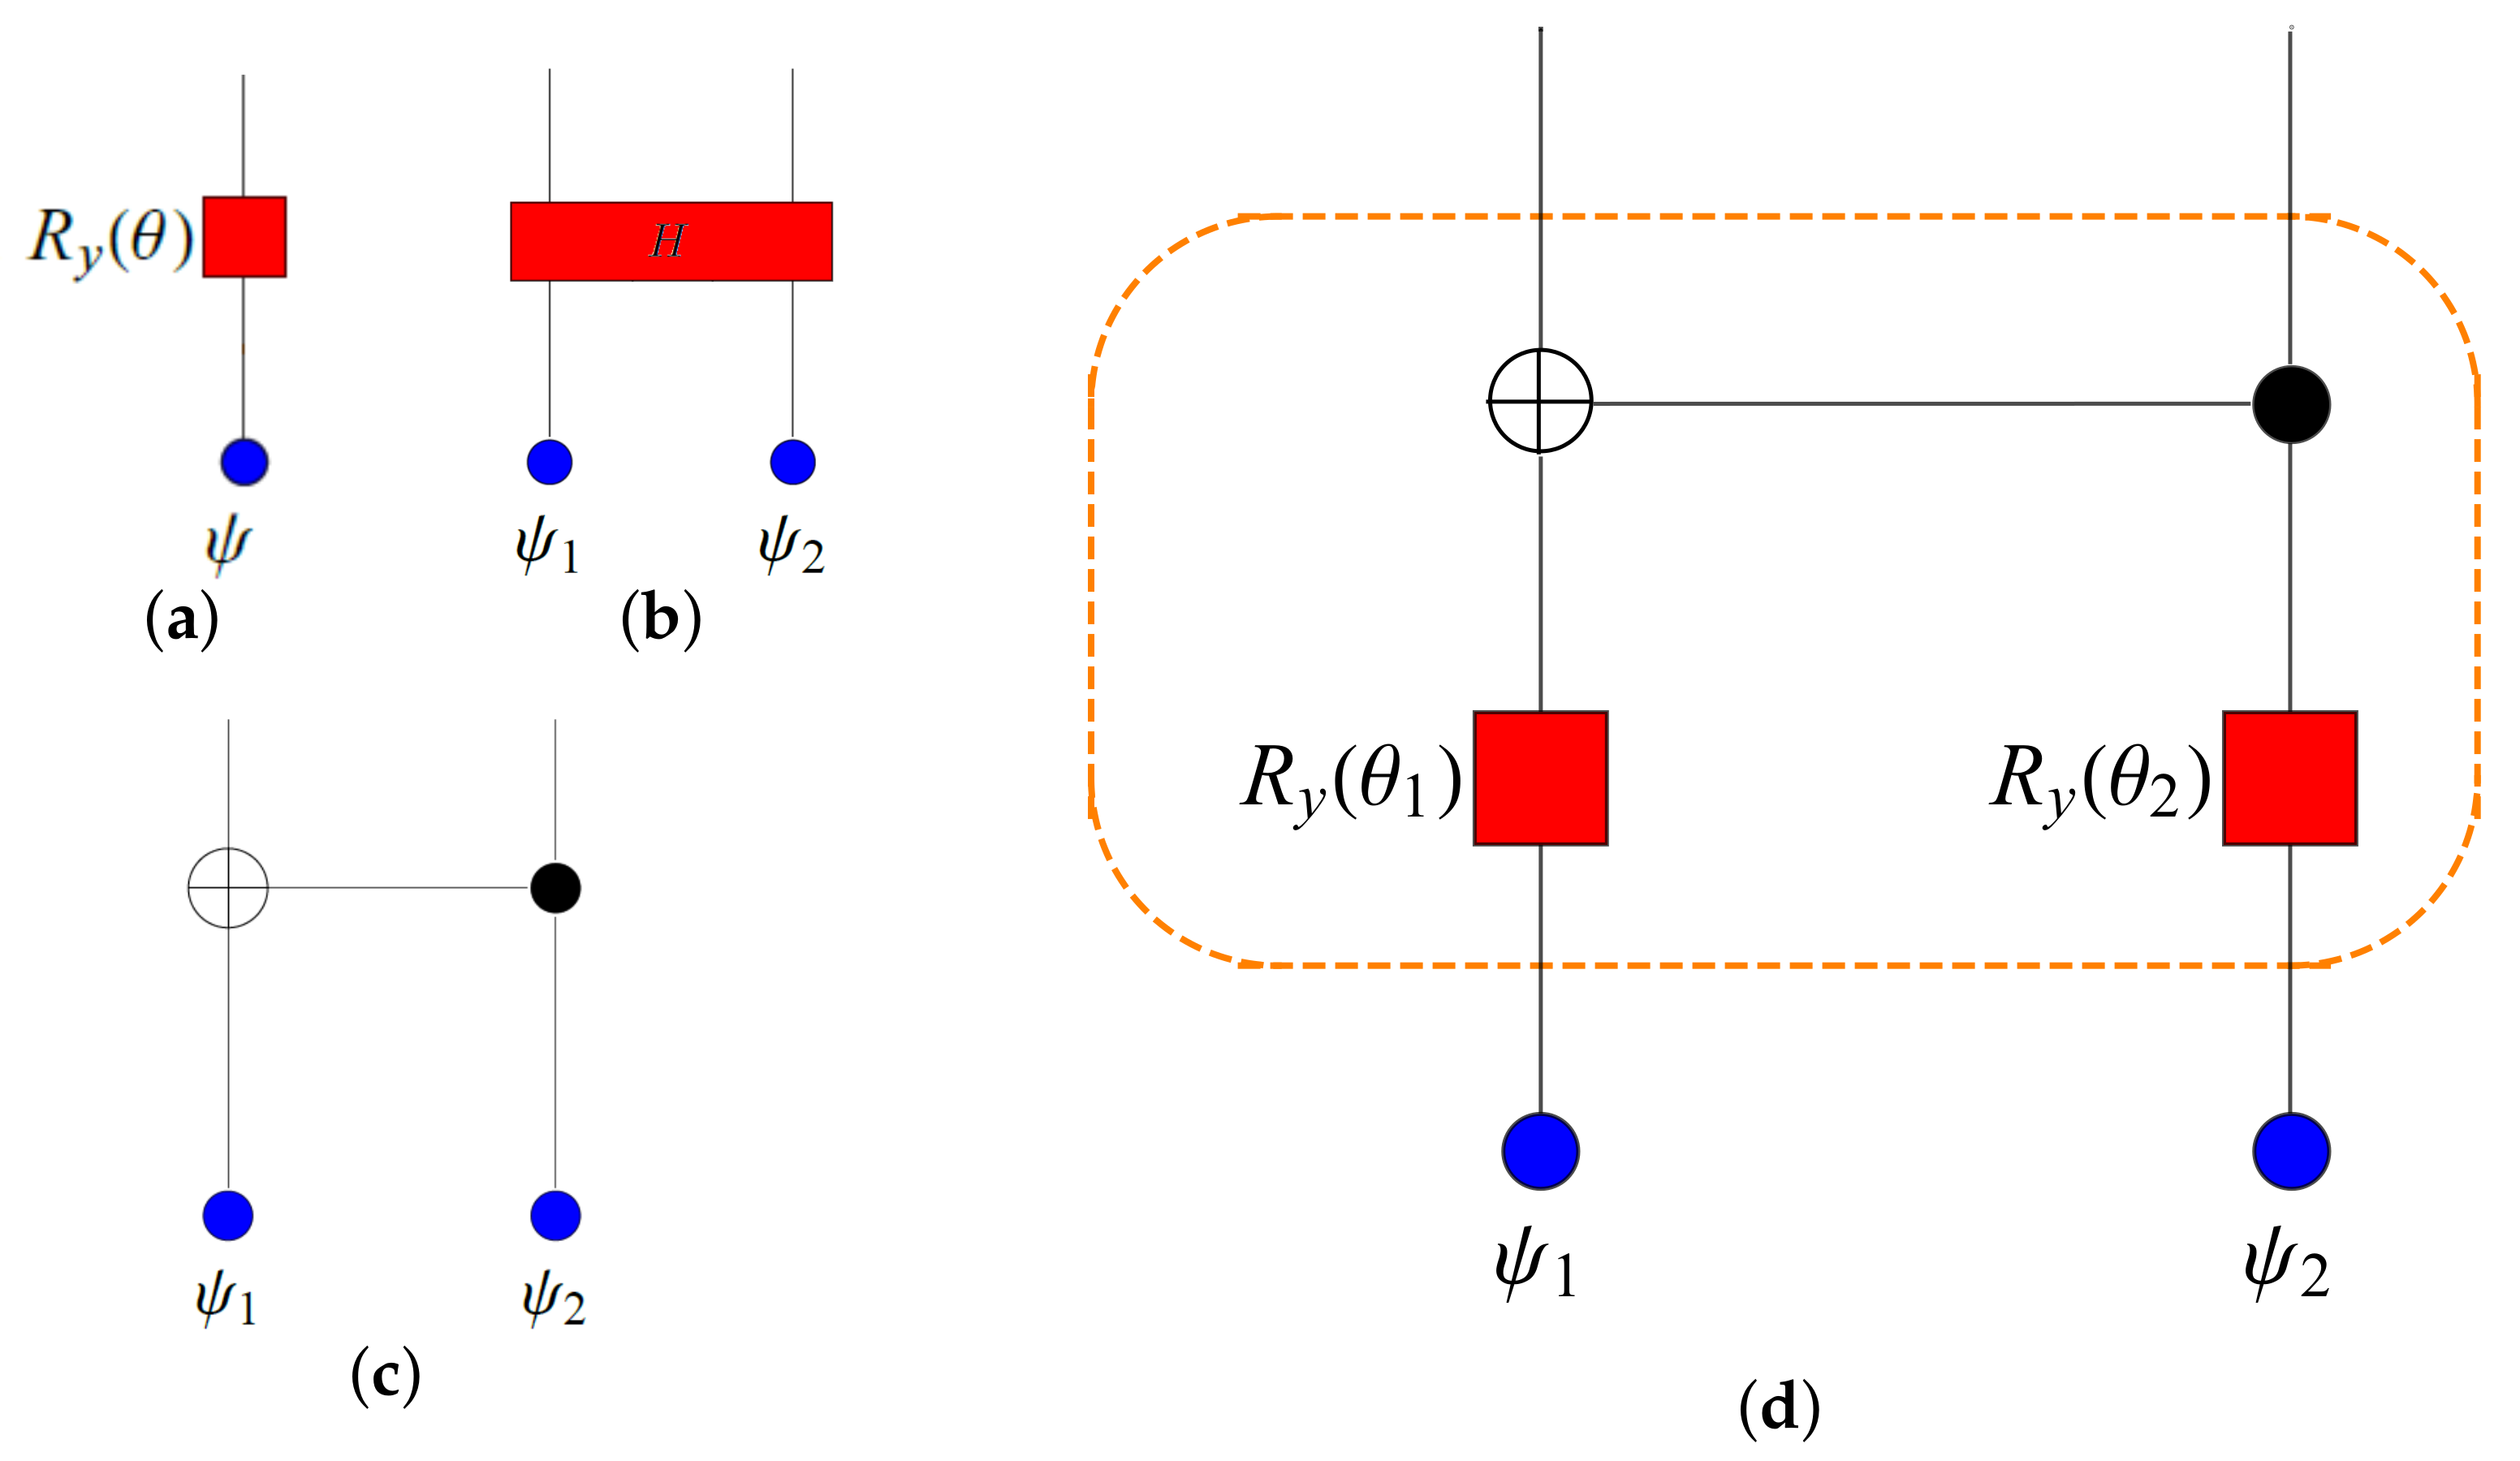
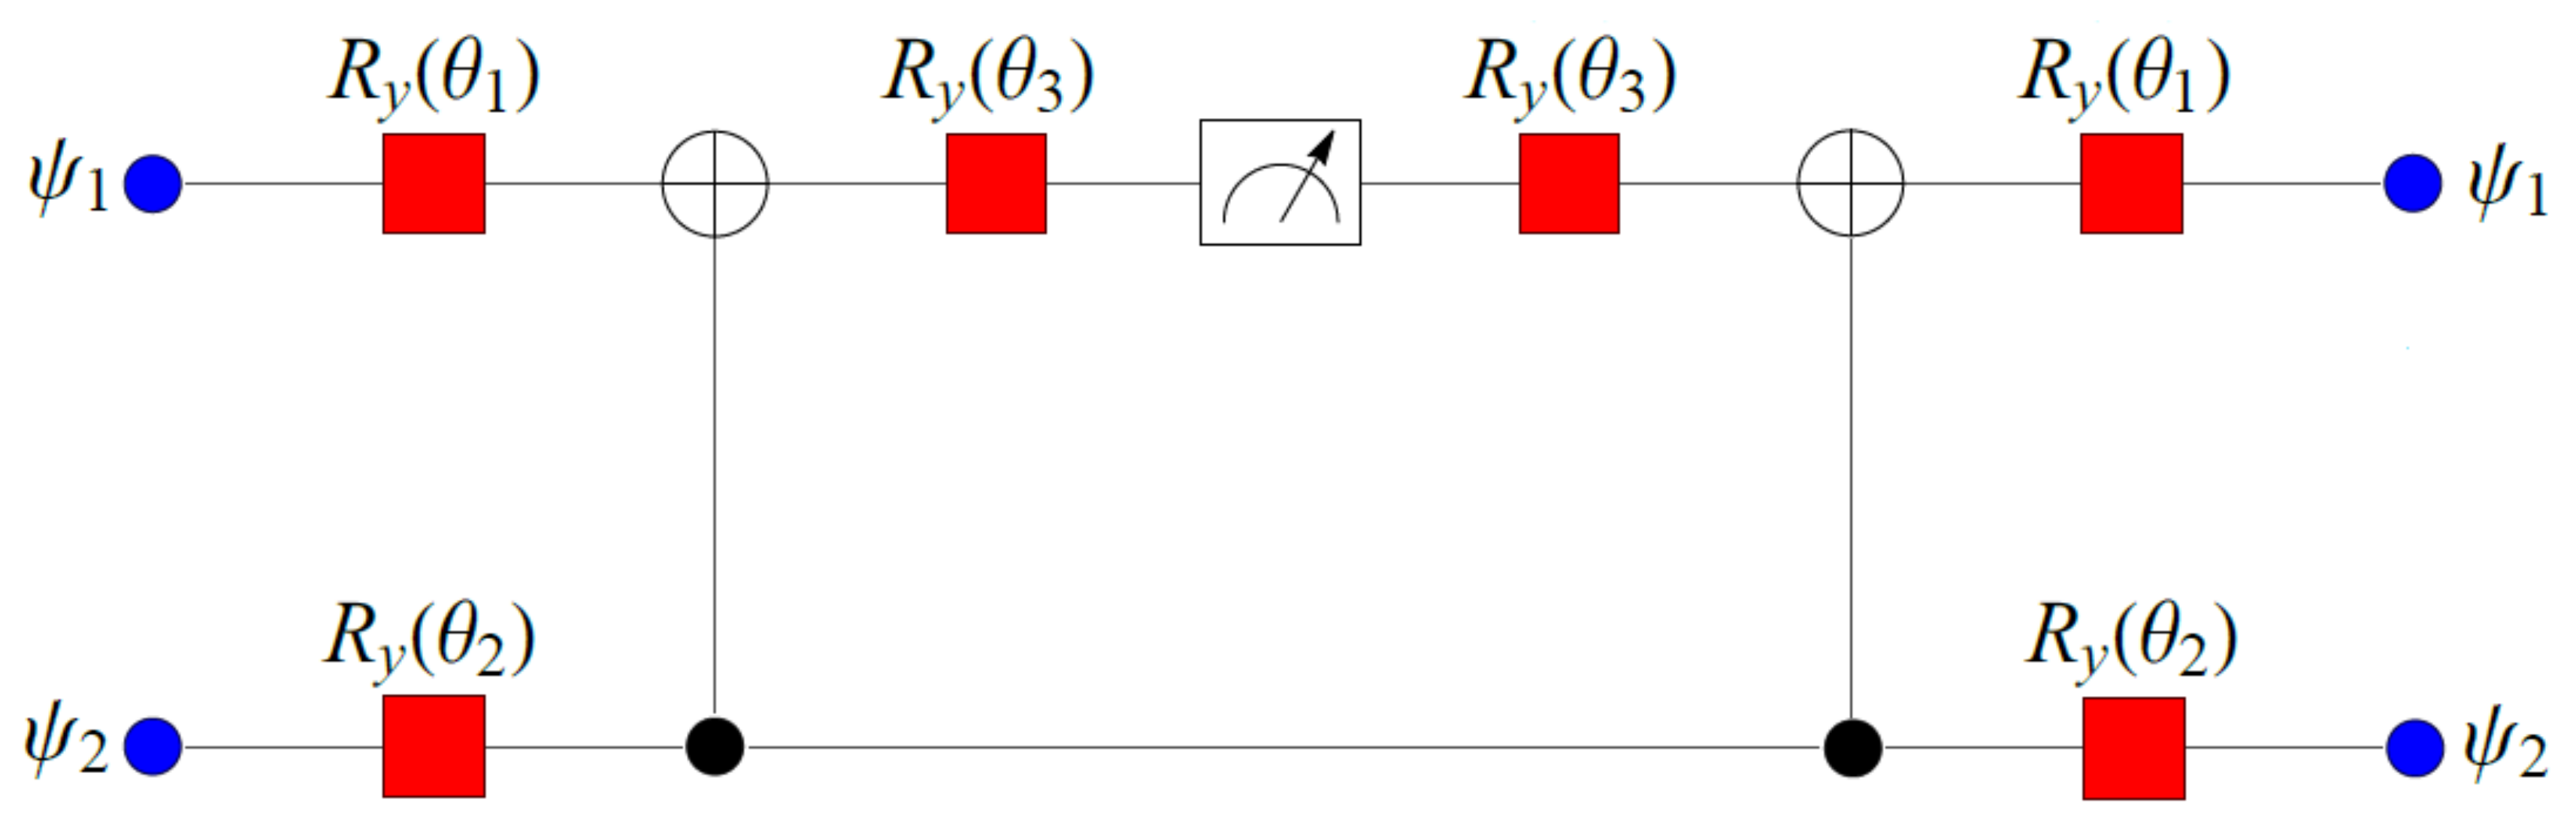
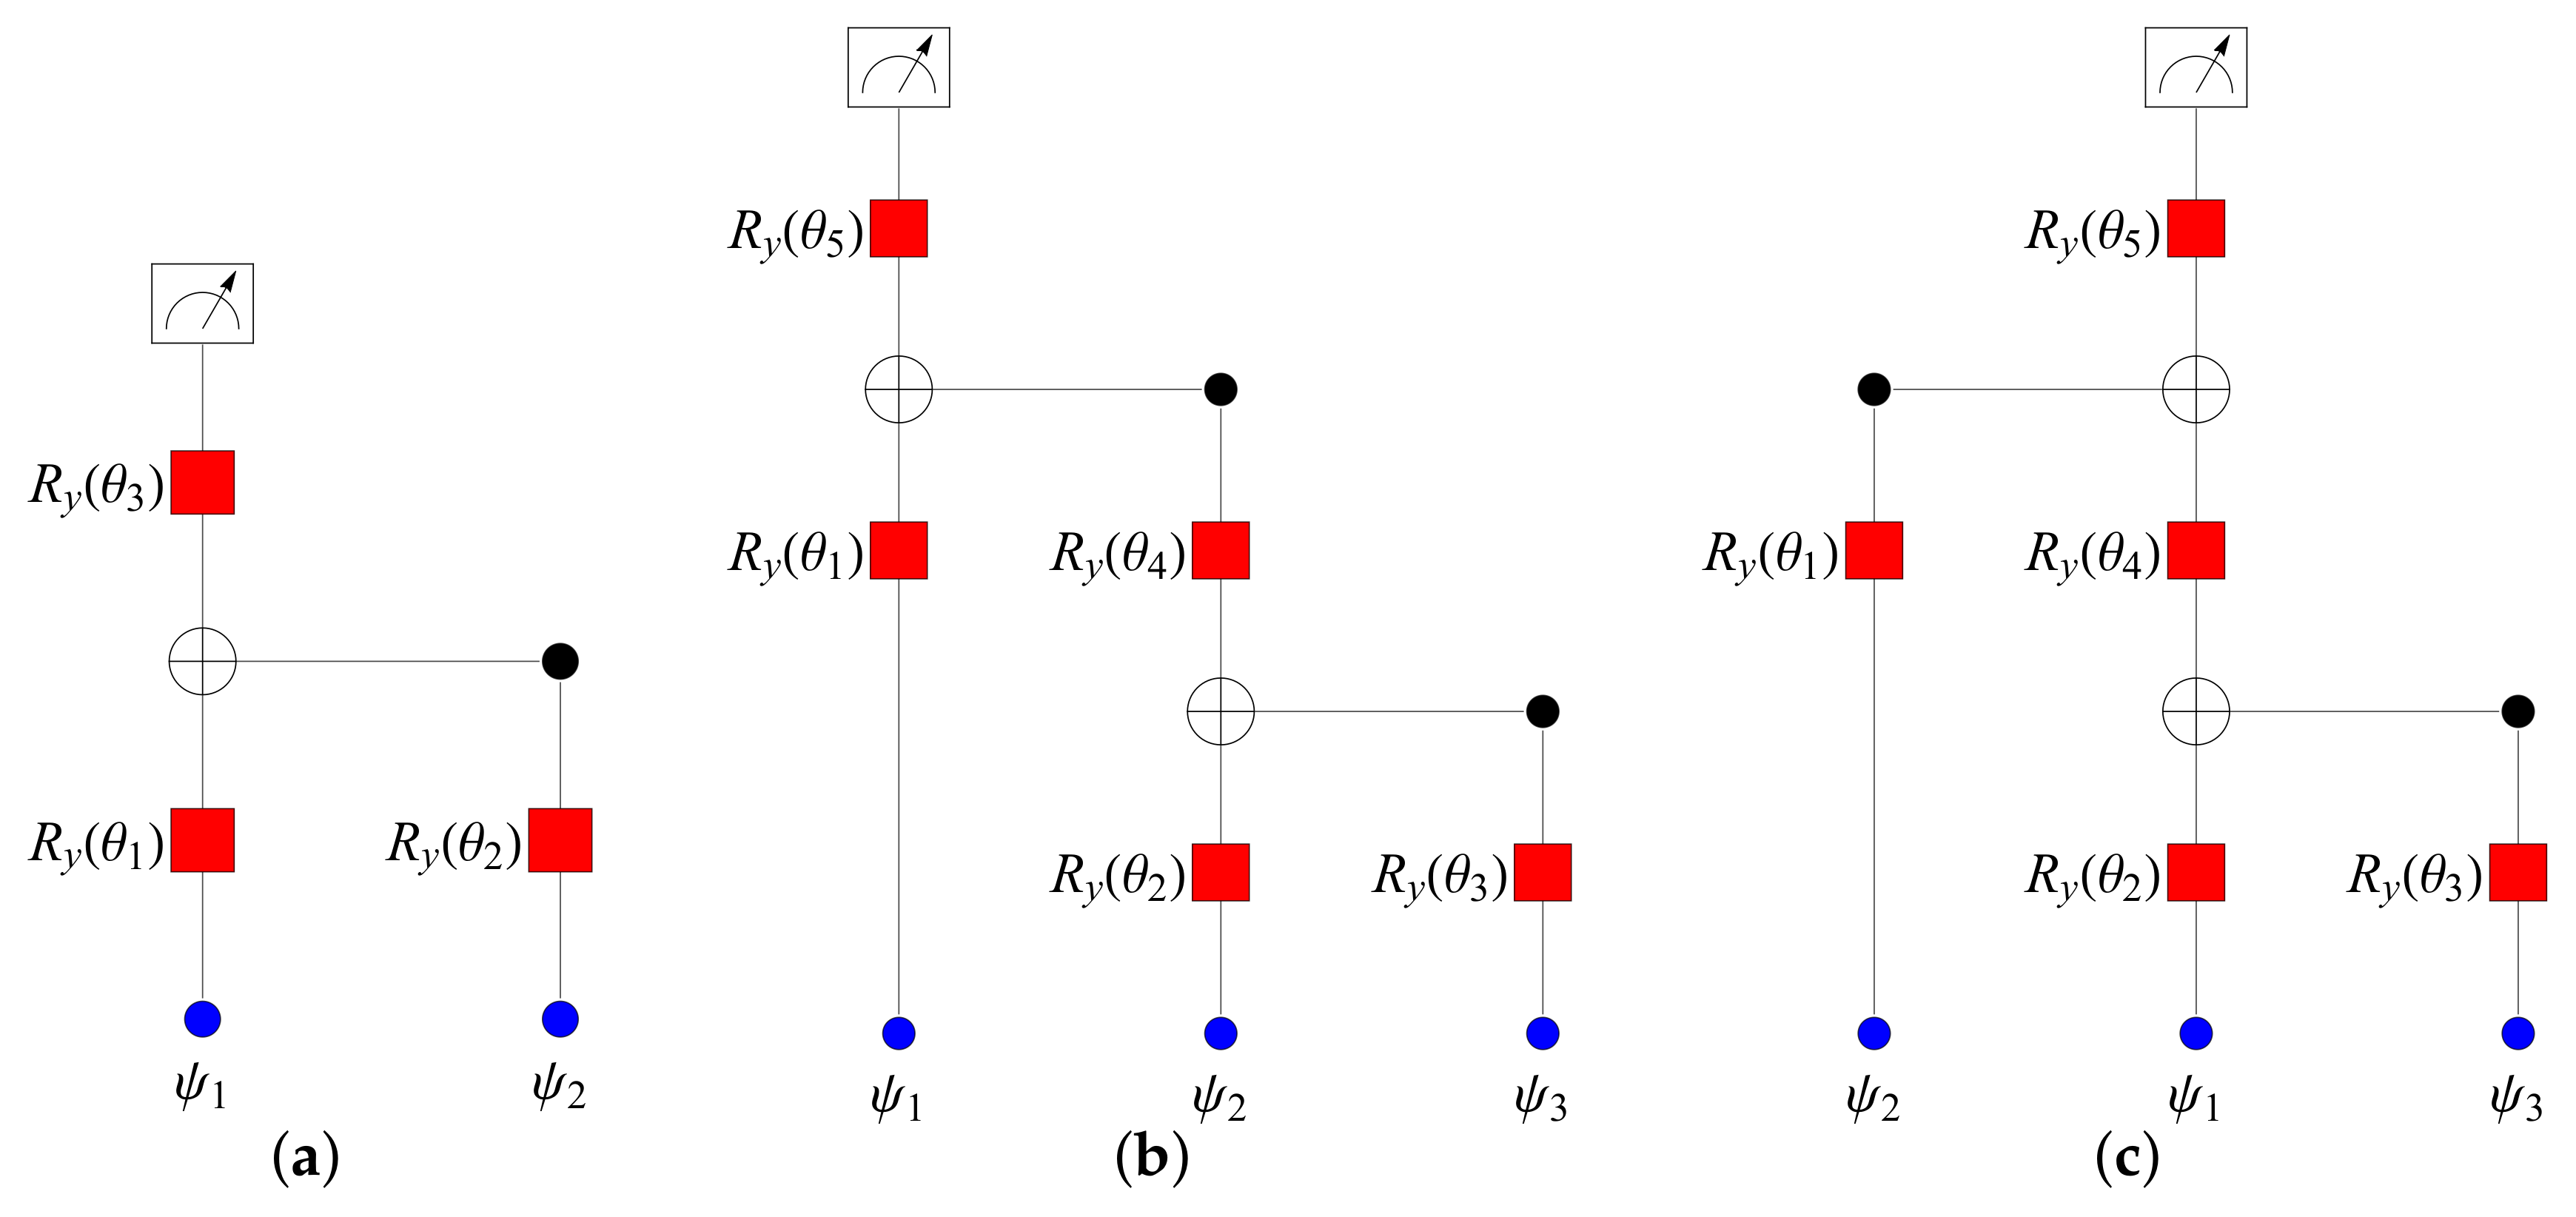
2.2. Least-Squares Problem via Quantum Measurements

Data are considered with a scaled range in the interval [ 0 , 1 ] , once we divide each value by max j D i , where D i = { x i 1 , , x i M } are the considered datum values varying in the whole set of patients.
For quantum-inspired classifiers, we define a reproducing kernel Hilbert space through another feature map ψ : D F , applied subsequently to the one presented in Table 2, whose elements are named qubits [19,21,22]:
ψ i j = sin π 2 x i j cos π 2 x i j R 2 ,
such that the feature vector of the considered set of N features is Ψ j = i = 1 N ψ i j R 2 N .
The encoded quantum data are classified using a quantum circuit U θ , in our case consisting of a tree tensor network circuit endowed with D parameters θ = ( θ 1 , , θ D ) , which is composed by a sequence of two-qubit nearest-neighbor unitaries, halving the output lines of the qubits after each gate of the circuit. Each qubit line is a representation of the degrees of freedom introduced in Equation (3), as shown in Figure 1a, where they are contracted with a rotation endowed with two graphical legs associated with row and column indices:
R y ( θ ) = e i σ y θ = 𝟙 cos ( θ ) i σ y sin ( θ ) = cos ( θ ) sin ( θ ) sin ( θ ) cos ( θ ) SO ( 2 ) ,
implemented according to the 2 × 2 identity matrix 𝟙 and the generator σ y , belonging to the set of generators of the group SU ( 2 ) , known as Pauli matrices:
σ x = 0 1 1 0 , σ y = 0 i i 0 , σ z = 1 0 0 1 ,
where the labels x , y , z are commonly used in physics.
These matrices implement any elaboration of qubits, representing a description of quantum magnetic spins, once we refer to components with respect to a chosen frame aligned with the z-axis:
ψ = 1 0 , ψ = 0 1 ,
with associated projectors P = 𝟙 + σ z 2 , P = 𝟙 σ z 2 that are used in the following, together with the spin flip σ x ψ ( ) = ψ ( ) , representing the quantum version of the classical bits NOT gate.
The spin description allows us to model any gate involving a qubit pair as an interaction implemented in the tensor product of their feature spaces, graphically represented in Figure 1b: the two qubits are in a superposition ψ 1 = a ψ 1 , + b ψ 1 , and ψ 2 = a ψ 2 , + b ψ 2 , , with a , a , b , b scalars, interacting according to a Hamiltonian, which implements a two spin interaction H ψ 1 ψ 2 . A simple example consists of the Ising-type Hamiltonian H = J σ z σ z where J is a coupling constant that is tuned such that an antiparallel ( ψ ( ) ψ ( ) ) or parallel ( ψ ( ) ψ ( ) ) configuration is energetically favored [38]. Systems composed by more than two qubits require the adoption of successive interactions implemented between spin pairs: this circuit structure characterizes our case study with emerging non-equivalent three qubits circuits. The mathematical motivation underlying this evidence is twofold, because we can refer to the particular interaction we wish to engineer, even if the non-commutativity characterizing the sequential application of matrices is more fundamental.
We chose a quantum circuit implementing a CNOT gate interaction in Figure 1c, representing the quantum version of classical bits exclusive OR (XOR):
CNOT = σ x P + 𝟙 P ,
whose structure suggests the name target qubit for the one in the first feature space in the tensor product, while the second is named the control qubit. Indeed, if the last is a spin up state, the target qubit is subject to a spin flip (e.g., CNOT ψ ψ = ψ ψ ), otherwise no elaboration is implemented (e.g., CNOT ψ ψ = ψ ψ ).
Our application takes into account a particular structure given by two arbitrary single-qubit rotations followed by a CNOT [21,39], as shown in Figure 1d, thus implementing the interaction between data:
H = CNOT R y ( θ 1 ) R y ( θ 2 ) ,
where parameters θ 1 and θ 2 are tuned. The qubit line associated with the target qubit is further elaborated by another rotation, as shown in Figure 2. In a general circuit involving more than two qubits, the achievement of a single-qubit line by the halving iterative procedure is followed by the aforementioned rotation and its measurement through a projection onto the spin up component. We compute the associated expectation value to define a score:
M = P 𝟙 , M θ Ψ j = U θ Ψ j , M U θ Ψ j ,
where we are explicitly referring to the qubit pair circuit represented in Figure 2.
Each patient belonging to our data set is endowed with a class label y j = { 0 , 1 } , respectively negative or positive regarding the metastatic diffusion to lymph nodes. The knowledge of the patient’s label establishes the supervised learning framework, which allows us to exploit the definition of a cost functional in a training set composed by M patients:
J ( θ ) = 1 M j = 1 M M θ Ψ j y j 2 ,
whose minimization corresponds to the achievement of the minimal mean squared error in the output of the classifier. The key idea consists of the least-squares reformulation of support vector machines [17].
The trick underlying kernel methods, as support vector machines, pursues the mapping of not linearly separable initial data, in a high-dimensional space where a hyperplane separating classes can be used. The involved computational complexity is measured by the number of line contractions linked with the dimension of feature vectors, as well as by the number D of parameters, which grows linearly with N in the adopted scheme.
The last part of the training procedure concerns the variation in the order of each patient’s data, because the tensor product is not commutative. Moreover, the circuit structure can be different, as depicted in Figure 3 for the three-qubit case.

2.3. Performance Evaluation
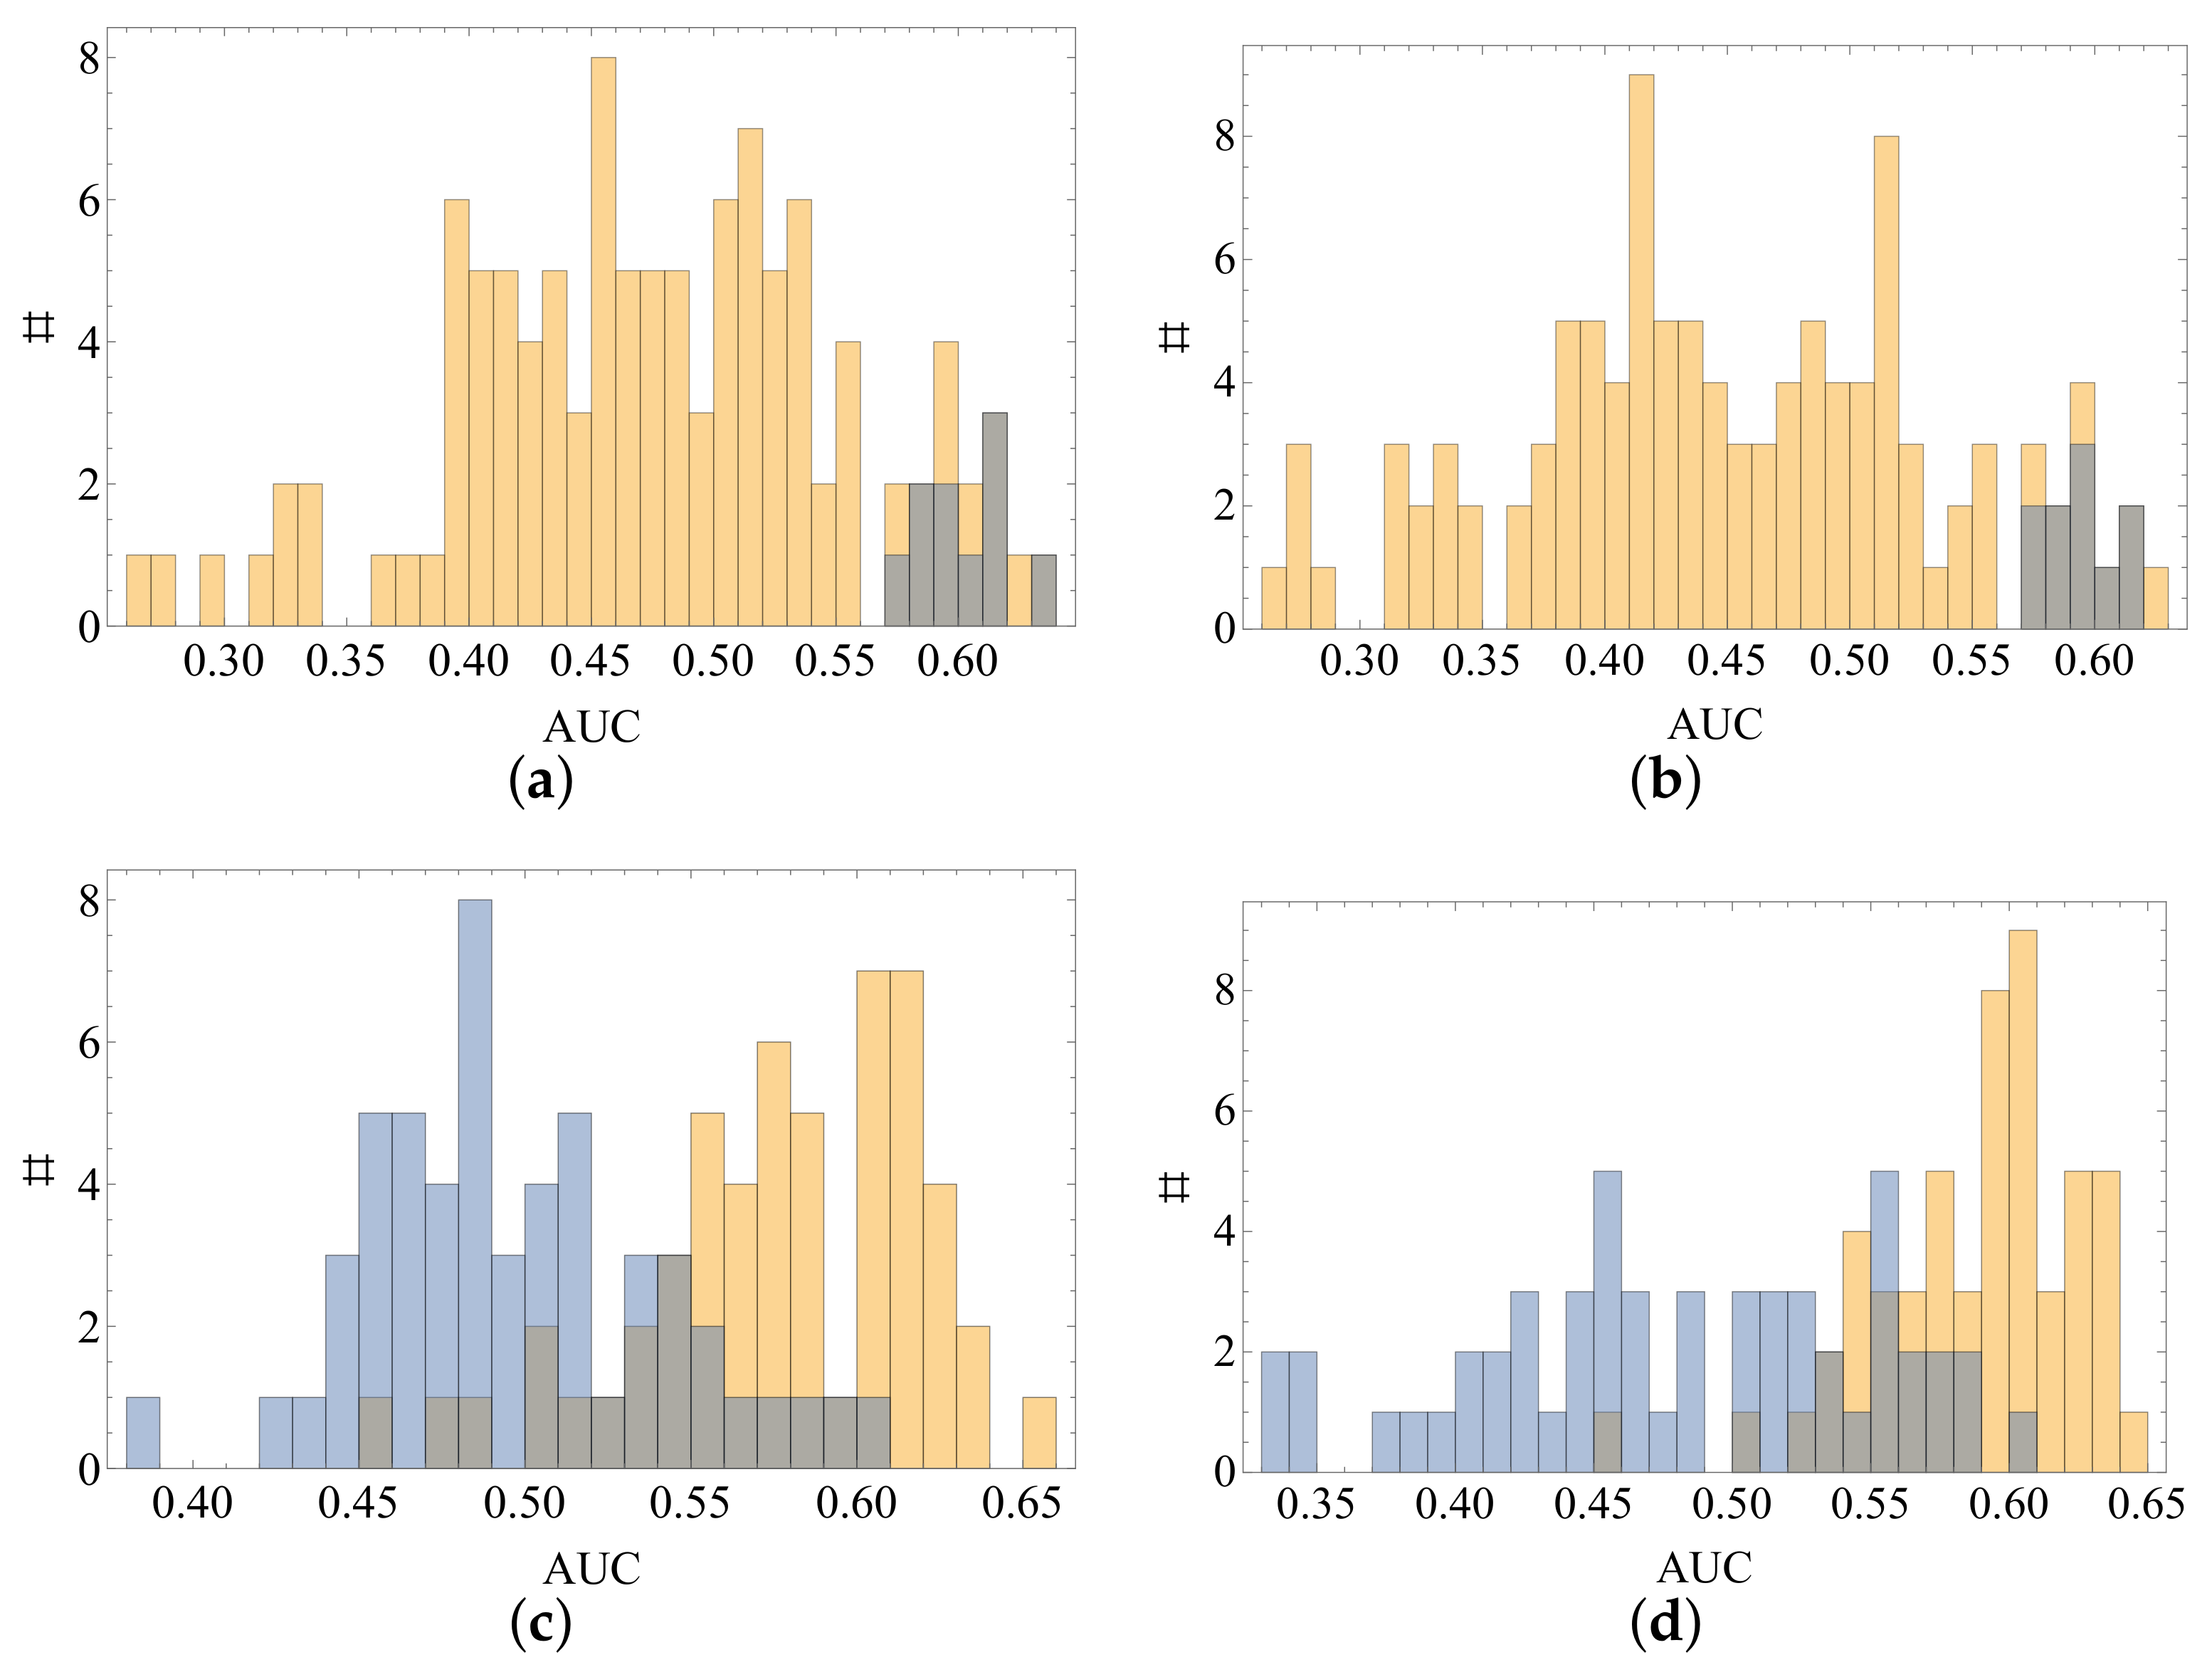
The data set is characterized by a given number of negative n and positive p patients as shown in Table 1. The classifier predictions involve true positives t p and true negatives t n , so we introduce:
accuracy = t n + t p n + p , specificity = t n n , sensitivity = t p p ,
whose choice is recommended in biomedicine to highlight the missing detection by a clinical test or a predictive model of a particular status of patients. The imbalanced data set considered in our case study requires a careful evaluation of each metric, because the abundance of negative cases can yield a sufficiently high accuracy even if positive patients are prevalently misclassified.
The score threshold characterizes a single classifier, and its variation in the interval [ 0 , 1 ] defines a family of classifiers [1], whose performances are summarized by receiver operating characteristic (ROC) curves, given by points in the plane (1-specificity, sensitivity), using the area under the ROC curve (AUC). The optimal threshold is identified by Youden’s index on ROC curves [40]:
J = sensitivity specificity + 1 ,
where its maximization takes place with the selected imbalanced data set, thus implying that a stable performance in the validation set has to concern the same ratio of positive and negative cases [41].
Optimal classifiers are selected during the training procedure, whose test is able to characterize their resilience with respect to sample variation if a test set not belonging to the training one is chosen. A k-fold cross-validation deals with this issue by partitioning the data set into k parts, k 1 of which are selected to represent the training set, while the remaining one is the test set. The overall method takes into account k rounds to switch the test role, thus collecting scores of the whole data set. To avoid any influence on the partition given by the patients ordering, we implement multiple cross-validations characterized by a randomly chosen order in the patients’ list: the statistics of previously mentioned learning metrics is collected in terms of the median, first, and third quartile as shown in Table 3.

3. Results

The first stage of the forward stepwise feature selection takes into account any variable pair and associated permutation, according to the circuit depicted in Figure 3a. The histogram of AUC indices yielded by a ten-fold cross-validation of the quantum-inspired classifier adopting a percentage value for ER, PgR, and Ki67 implemented per variable pair is shown in Figure 4a, while in Figure 4b, a binary format of such features is introduced for the quantum circuit, where shaded bars refer to cases endowed with the diameter as the first feature in the input. The highest value in Figure 4a equals 0.633, corresponding to the pair (diameter, PgR), whose classifier is denoted as Q 2 , while in Figure 4b, it is yielded by (age, diameter) equal to 0.620, so defining the classifier Q 2 .
In the next feature selection stage, we keep these pairs and add as a third feature any one of the remaining variables, then including any permutation of the triplet. These inputs for the two non-equivalent circuit schemes in Figure 3b,c are ranked as previously explained according to associated AUC indices. The resulting histograms are represented in Figure 4c, with the best performing triplets yielding 0.654 and 0.600 for respectively (diameter, PgR, grading) and (Ki67, PgR, diameter), with classifiers Q 3 ( a ) and Q 3 ( b ) . The same features are included in two CM classifiers denoted as CM 3 ( a ) and CM 3 ( b ) . The performances given by the quantum version employing binary ER, PgR, and Ki67 are collected in Figure 4d, where (diameter, age, ductal-lobular) yields 0.648 and (diameter, ER, age) is the triplet for 0.604, indicated as Q 3 ( a ) and Q 3 ( b ) respectively. It is important to stress that the histological subtype pair ductal-lobular is caused by the conversion of the categorical variable into two binary features, so for the corresponding CM classifiers CM 3 ( a ) and CM 3 ( b ) we consider (diameter, age, histological subtype) in the first one.
Once most important features are selected, we test the performance statistics in 10 ten-fold cross-validation rounds, listed in Table 3. The distributions of the AUC index show a similar trend between corresponding selected classifiers. CM cases are always related to higher values of sensitivity, with the exception of CM 3 ( b ) , while vice versa, quantum cases yield higher specificity ranges with a widely separated sensitivity, with the exception of Q 3 ( a ) and partially Q 2 . The data set imbalance provides a low informative accuracy, assuming its maximum values for Q 3 ( a ) and Q 3 ( b ) , characterized by a high number of false negative patients.

4. Discussion

The translation of an automated decision procedure based on machine learning techniques into an optimization problem leads to the research for optimal therapeutic plans conceived for each patient and weighted by certain features included in the predictive model, as personalized medicine predicts [42,43,44]. A priority role is played by the identification of most relevant prognostic factors in the detection of patient status, especially when we are dealing with complex diseases like cancer.
A prognostic subset of factors may behave as noise or a signal for a specific patient class, thus inducing our research for an optimal trade-off between specificity and sensitivity, as shown in Table 3. A limited separation between them is observed just for Q 3 ( a ) , CM 3 ( b ) , and Q 2 , while remaining cases report the association of quantum-inspired classifiers with specificity and CM ones with sensitivity. The highest value of sensitivity among quantum circuits is obtained through Q 3 ( a ) : the use of a binary version for biomarkers in the data set eases the recognition of positive patients, thus confirming the commonly used medicine data format for some prognostic factors to exalt this class.
The circuit structure in Figure 3b,c influences the AUC index histograms shown in Figure 4c,d. The most important qubit along the central line of Figure 3c works as the target one for both gates, a role causing an increasing width of the distribution of AUC indices with respect to the circuit in Figure 3b, where the central qubit is no longer the most important one, representing still the target one in the first gate, but it becomes a control qubit in the next layer. Nevertheless, the interquartile ranges in Table 3 represent evidence of the output stability for Q 3 ( b ) and Q 3 ( b ) , contrary to the wide range of Q 3 ( a ) , signaling a required extension of the presented preliminary study to include a higher number of features.
The currently adopted intra-operative procedure yields a sensitivity in the range 87.5–100%, while regarding the specificity, the range is equal to 90.5–100% [45,46,47]; therefore, algorithmic methods with this purpose have to exceed these thresholds. Nevertheless, the application of the CM classifier for a different patients data set, but targeting the same clinical issue, reports comparable performances even if exploiting a wider set of features [48]. The most balanced classifier in terms of sensitivity and specificity of this preliminary study corresponds to the the quantum-inspired Q 3 ( a ) , which seems to highlight the role played by the included histological subtype, emerging through the quantum circuit.
Some predictive models for lymph node status in the literature make use of genetic data for the classification of a specific kind of patient, selected through ER and Her2 values, obtaining an AUC index of 0.883 [49]. The lymphovascular invasion datum is included in another study, yielding an AUC equal to 0.750 [50]; its absence in our data set is due to the associated exam occurring in post-operative stages.
Tools provided by radiomic analysis represent a crucial step forward in performance improvements. Imaging techniques, like diffusion wavelet and dynamic contrast-enhanced magnetic resonance imaging, are able to include new information, as well as multiple data elaboration methods [51,52,53,54]. Nevertheless, clinically negative patients are not generally subjected to magnetic resonance imaging, but only to first level instrumental investigations such as mammography and ultrasound, whose recordings are jointly used with histopathological data to predict the probability of lymph node metastasis, thus obtaining high performance results [55,56]. Radiomic studies about these imaging categories aimed at the prediction of the lymph node involvement are sparse, unlike those focused on the detection and characterization of breast lesions [57,58,59,60,61,62,63,64].
The feature map adopted in our case study with real components severely limits the number of included prognostic factors, thus yielding a quantum-inspired classifier still not characterized by clearly distinguished performances with respect to the chosen classical one. The presented preliminary study serves as an exploratory survey in this emerging applied biomedical framework for quantum computing.

5. Conclusions and Future Developments

At this stage in the feature selection, the reported performances completely hinder any clinical practice of the presented quantum classifiers as a clinical decision support system. The training procedure of the CM classifier leads to an opposite result concerning sensitivity with respect to the exalted specificity in quantum-inspired cases. The performances observed for the CM classification are comparable to those recently obtained in a larger data set by the same classifier endowed with a higher number of features, while this kind of bioinformatics data was not previously targeted in the quantum framework.
To overcome the presented results, we will implement truly quantum machine learning in a twofold way: feature vectors are generally defined through complex scalars, while real coefficients are adopted in this preliminary study, and the exploration of the full Hilbert space not limited to just product states has to be included. Recent developments of quantum supervised learning via tensor networks show that the combination of classical elaboration schemes, as convolutional neural networks, with matrix product state encodings yield high level performances, whose application in biomedical data categorization will surely represent a resource. In addition, the exploitation of quantum Bayesian networks will enhance the investigation of causal relations well beyond the capabilities offered by naive Bayes classifiers.

Author Contributions

Conceptualization, D.P. and A.F.; data curation, D.P., A.F., M.I.P., A.Z., and R.M.; formal analysis, D.P.; methodology, D.P., A.F., and R.M.; resources, M.I.P., A.Z., and V.L.; software, D.P.; supervision, R.M.; writing—original draft, D.P., A.F., N.A., S.B., and R.M.; writing—review and editing, D.P., A.F., N.A., R.B., A.B., S.B., V.D., D.L.F., M.I.P., P.T., A.Z., V.L., and R.M. All authors read and agreed to the published version of the manuscript.

Funding

This research received no external funding.

Institutional Review Board Statement

The study was conducted according to the guidelines of the Declaration of Helsinki and approved by the Scientific Board of Istituto Tumori ‘Giovanni Paolo II’—Bari, Italy.

Informed Consent Statement

Informed consent was obtained from all subjects involved in the study.

Data Availability Statement

The data presented in this study are available on request from the corresponding author. The data are not publicly available because are propriety of Istituto Tumori ‘Giovanni Paolo II’—Bari, Italy.

Acknowledgments

This work was supported by funding from the Italian Ministry of Health “Ricerca Corrente 2018–2020”. D.P. is grateful to Francesco V. Pepe for useful discussions and comments.

Conflicts of Interest

The authors declare no conflict of interest.

References

  1. Schubert, C.M.; Thorsen, S.N.; Oxley, M.E. The ROC manifold for classification systems. Pattern Recognit. 2011, 44, 350–362. [Google Scholar] [CrossRef]
  2. Freund, Y. Boosting a Weak Learning Algorithm by Majority. Inf. Comput. 1995, 121, 256–285. [Google Scholar] [CrossRef]
  3. Cole, J.H.; Poudel, R.P.K.; Tsagkrasoulis, D.; Caan, M.W.A.; Steves, C.; Spector, T.D.; Montana, G. Predicting brain age with deep learning from raw imaging data results in a reliable and heritable biomarker. NeuroImage 2017, 163, 115–124. [Google Scholar] [CrossRef] [Green Version]
  4. Amoroso, N.; La Rocca, M.; Bellantuono, L.; Diacono, D.; Fanizzi, A.; Lella, E.; Lombardi, A.; Maggipinto, T.; Monaco, A.; Tangaro, S.; et al. Deep learning and multiplex networks for accurate modeling of brain age. Front. Aging Neurosci. 2019, 11, 115. [Google Scholar] [CrossRef] [PubMed] [Green Version]
  5. Bellantuono, L.; Marzano, L.; La Rocca, M.; Duncan, D.; Lombardi, A.; Maggipinto, T.; Monaco, A.; Tangaro, S.; Amoroso, N.; Bellotti, R. Predicting brain age with complex networks: From adolescence to adulthood. NeuroImage 2020, 225, 117458. [Google Scholar] [CrossRef]
  6. Moradi, E.; Pepe, A.; Gaser, C.; Huttunen, H.; Tohka, J.; for the Alzheimer’s Disease Neuroimaging Initiative. Machine learning framework for early MRI-based Alzheimer’s conversion prediction in MCI subjects. Neuroimage 2015, 104, 398–412. [Google Scholar] [CrossRef] [Green Version]
  7. Tangaro, S.; Fanizzi, A.; Amoroso, N.; Bellotti, R.; for the Alzheimer’s Disease Neuroimaging Initiative. A fuzzy-based system reveals Alzheimer’s Disease onset in subjects with Mild Cognitive Impairment. Phys. Medica 2017, 38, 36–44. [Google Scholar] [CrossRef] [PubMed]
  8. Mehmood, A.; Maqsood, M.; Bashir, M.; Shuyuan, Y. A Deep Siamese Convolution Neural Network for Multi-Class Classification of Alzheimer Disease. Brain Sci. 2020, 10, 84. [Google Scholar] [CrossRef] [PubMed] [Green Version]
  9. Zhan, A.; Mohan, S.; Tarolli, C.; Schneider, R.B.; Adams, J.L.; Sharma, S.; Elson, M.J.; Spear, K.L.; Glidden, A.M.; Little, M.A.; et al. Using smartphones and machine learning to quantify Parkinson disease severity: The mobile Parkinson disease score. JAMA Neurol. 2018, 75, 876–880. [Google Scholar] [CrossRef]
  10. Yang, H.; Liu, J.; Sui, J.; Pearlson, G.; Calhoun, V.D. A hybrid machine learning method for fusing fMRI and genetic data: Combining both improves classification of schizophrenia. Front. Hum. Neurosci. 2010, 4, 192. [Google Scholar] [CrossRef] [PubMed] [Green Version]
  11. Ahmad, L.G.; Eshlaghy, A.T.; Poorebrahimi, A.; Ebrahimi, M.; Razavi, A.R. Using three machine learning techniques for predicting breast cancer recurrence. J. Health Med. Inform. 2013, 4, 3. [Google Scholar]
  12. Libbrecht, M.W.; Noble, W.S. Machine learning applications in genetics and genomics. Nat. Rev. Genet. 2015, 16, 321–332. [Google Scholar] [CrossRef] [Green Version]
  13. Monaco, A.; Monda, A.; Amoroso, N.; Bertolino, A.; Blasi, G.; Di Carlo, P.; Papalino, M.; Pergola, G.; Tangaro, S.; Bellotti, R. A complex network approach reveals a pivotal substructure of genes linked to schizophrenia. PLoS ONE 2018, 13, e0190110. [Google Scholar] [CrossRef] [Green Version]
  14. Caravagna, G.; Heide, T.; Williams, M.J.; Zapata, L.; Nichol, D.; Chkhaidze, K.; Cross, W.; Cresswell, G.D.; Werner, B.; Acar, A.; et al. Subclonal reconstruction of tumors by using machine learning and population genetics. Nat. Genet. 2020, 52, 898–907. [Google Scholar] [CrossRef]
  15. Kopczyk, D. Quantum machine learning for data scientists. arXiv 2018, arXiv:1804.10068. [Google Scholar]
  16. Aïmeur, E.; Brassard, G.; Gambs, S. Quantum clustering algorithms. In Proceedings of the 24th International Conference on Machine Learning, Corvallis, OR, USA, 20–24 June 2007; pp. 1–8. [Google Scholar]
  17. Rebentrost, P.; Mohseni, M.; Lloyd, S. Quantum Support Vector Machine for Big Data Classification. Phys. Rev. Lett. 2014, 113, 130503. [Google Scholar] [CrossRef]
  18. Lloyd, S.; Mohseni, M.; Rebentrost, P. Quantum principal component analysis. Nat. Phys. 2014, 10, 631–633. [Google Scholar] [CrossRef] [Green Version]
  19. Schuld, M.; Killoran, N. Quantum Machine Learning in Feature Hilbert Spaces. Phys. Rev. Lett. 2019, 122, 040504. [Google Scholar] [CrossRef] [PubMed] [Green Version]
  20. Tacchino, F.; Barkoutsos, P.; Macchiavello, C.; Tavernelli, I.; Gerace, D.; Bajoni, D. Quantum implementation of an artificial feed-forward neural network. Quantum Sci. Technol. 2020, 5, 044010. [Google Scholar] [CrossRef]
  21. Grant, E.; Benedetti, M.; Cao, S.; Hallam, A.; Lockhart, J.; Stojevic, V.; Green, A.G.; Severini, S. Hierarchical quantum classifiers. npj Quantum Inf. 2018, 65. [Google Scholar] [CrossRef] [Green Version]
  22. Stoudenmire, E.M. Learning relevant features of data with multi-scale tensor networks. Quantum Sci. Technol. 2018, 3, 034003. [Google Scholar] [CrossRef] [Green Version]
  23. Liu, D.; Ran, S.-J.; Wittek, P.; Peng, C.; Blázquez García, R.; Su, G.; Lewenstein, M. Machine learning by unitary tensor network of hierarchical tree structure. New J. Phys. 2019, 21, 073059. [Google Scholar] [CrossRef]
  24. Borujeni, S.E.; Nguyen, N.H.; Nannapaneni, S.; Behrman, E.C.; Steck, J.E. Experimental evaluation of quantum Bayesian networks on IBM QX hardware. In Proceedings of the IEEE International Conference on Quantum Computing and Engineering, Los Alamitos, CA, USA, 12–16 October 2020. [Google Scholar]
  25. Glasser, I.; Pancotti, N.; Cirac, J.I. From Probabilistic Graphical Models to Generalized Tensor Networks for Supervised Learning. IEEE Access 2020, 8, 68169–68182. [Google Scholar] [CrossRef]
  26. Facchi, P.; Ligabò, M. Classical and quantum aspects of tomography. AIP Conf. Proc. 2010, 3, 1260. [Google Scholar]
  27. Kiani, B.T.; Villanyi, A.; Lloyd, S. Quantum Medical Imaging Algorithms. arXiv 2020, arXiv:2004.02036. [Google Scholar]
  28. Outeiral, C.; Strahm, M.; Shi, J.; Morris, G.M.; Benjamin, S.C.; Deane, C.M. The prospects of quantum computing in computational molecular biology. WIREs Comput. Mol. Sci. 2020, 11. [Google Scholar] [CrossRef]
  29. Farnsworth, R.H.; Achen, M.G.; Stacker, S.A. The evolving role of lymphatics in cancer metastasis. Curr. Opin. Immunol. 2018, 53, 64–73. [Google Scholar] [CrossRef]
  30. Land, S.R.; Kopec, J.A.; Julian, T.B.; Brown, A.M.; Anderson, S.J.; Krag, D.N.; Christian, N.J.; Costantino, J.P.; Wolmark, N.; Ganz, P.A. Patient-reported outcomes in sentinel node-negative adjuvant breast cancer patients receiving sentinel-node biopsy or axillary dissection: National Surgical Adjuvant Breast and Bowel Project phase III protocol B-32. J. Clin. Oncol. 2010, 28, 3929–3936. [Google Scholar] [CrossRef] [PubMed]
  31. DiSipio, T.; Rye, S.; Newman, B.; Hayes, S. Incidence of unilateral lymphedema after breast cancer: A systematic review and meta-analysis. Lancet Oncol. 2013, 14, 500–515. [Google Scholar] [CrossRef]
  32. Giuliano, A.E.; Hunt, K.K.; Ballman, K.V.; Beitsch, P.D.; Whitworth, P.W.; Blumencranz, P.W.; Leitch, A.M.; Saha, S.; McCall, L.M.; Morrow, M. Axillary dissection vs no axillary dissection in women with invasive breast cancer and sentinel node metastasis: A randomized clinical trial. JAMA 2011, 305, 569–575. [Google Scholar] [CrossRef] [Green Version]
  33. Mazo, C.; Kearns, C.; Mooney, C.; Gallagher, W.M. Clinical Decision Support Systems in Breast Cancer: A Systematic Review. Cancers 2020, 12, 369. [Google Scholar] [CrossRef] [Green Version]
  34. Chen, L.L.; Nolan, M.E.; Silverstein, M.J.; Mihm, M.C.; Sober, A.J.; Tanabe, K.K.; Smith, B.L.; Younger, J.; Michaelson, J.S. The impact of primary tumor size, lymph node status, and other prognostic factors on the risk of cancer death. Cancer 2009, 115, 5071–5083. [Google Scholar] [CrossRef] [PubMed]
  35. Michaelson, J.S.; Chen, L.L.; Silverstein, M.J.; Mihm, M.C.; Sober, A.J.; Tanabe, K.K.; Smith, B.L.; Younger, J. How cancer at the primary site and in the lymph nodes contributes to the risk of cancer death. Cancer 2009, 115, 5095–5107. [Google Scholar] [CrossRef] [PubMed]
  36. Cancer Web-Calculators for Medical Professionals. Available online: http://www.lifemath.net/cancer/ (accessed on 20 December 2020).
  37. Chatterjee, S. Multivariate stratified surveys. J. Am. Stat. Assoc. 1968, 63, 530–534. [Google Scholar]
  38. Dyson, F. General Theory of Spin-Wave Interactions. Phys. Rev. 1956, 102, 1217–1230. [Google Scholar] [CrossRef]
  39. Tüysüz, C.; Carminati, F.; Demirköz, B.; Dobos, D.; Fracas, F.; Novotny, K.; Potamianos, K.; Vallecorsa, S.; Vlimant, J.-R. A Quantum Graph Neural Network Approach to Particle Track Reconstruction. In Proceedings of the Connecting the Dots, Princeton, NJ, USA, 10–18 September 2020; Volume 34. [Google Scholar]
  40. Youden, W.J. Index for rating diagnostic tests. Cancer 1950, 3, 32–35. [Google Scholar] [CrossRef]
  41. Flach, P.A. The Geometry of ROC Space: Understanding Machine Learning Metrics through ROC Isometrics. In Proceedings of the Twentieth International Conference on Machine Learning, Washington, DC, USA, 21–24 August 2003. [Google Scholar]
  42. Kim, Y.Y.; Oh, S.J.; Chun, Y.S.; Lee, W.K.; Park, H.K. Gene expression assay and Watson for Oncology for optimization of treatment in ER-positive, HER2-negative breast cancer. PLoS ONE 2018, 13, e0200100. [Google Scholar] [CrossRef]
  43. Park, C.; Ahn, J.; Kim, H.; Park, S. Integrative Gene Network Construction to Analyze Cancer Recurrence Using Semi-Supervised Learning. PLoS ONE 2014, 9, e86309. [Google Scholar] [CrossRef] [Green Version]
  44. Madekivi, V.; Boström, P.; Karlsson, A.; Aaltonen, R.; Salminen, E. Can a machine-learning model improve the prediction of nodal stage after a positive sentinel lymph node biopsy in breast cancer? Acta Oncol. 2020, 59, 689–695. [Google Scholar] [CrossRef]
  45. Banerjee, S.M.; Michalopoulos, N.V.; Williams, N.R.; Davidson, T.; El Sheikh, S.; McDermott, N.; Tran-Dang, M.-A.; Davison, S.; Keshtgar, M.R. Detailed evaluation of one step nucleic acid (OSNA) molecular assay for intra-operative diagnosis of sentinel lymph node metastasis and prediction of non-sentinel nodal involvement: Experience from a London Teaching Hospital. Breast 2014, 23, 378–384. [Google Scholar] [CrossRef] [PubMed]
  46. Szychta, P.; Westfal, B.; Maciejczyk, R.; Smolarz, B.; Romanowicz, H.; Krawczyk, T.; Zadrozny, M. Intraoperative diagnosis of sentinel lymph node metastases in breast cancer treatment with onestep nucleic acid amplification assay (OSNA). Arch. Med. Sci. 2016, 12, 1239–1246. [Google Scholar] [CrossRef] [PubMed] [Green Version]
  47. Fanfani, F.; Monterossi, G.; Ghizzoni, V.; Rossi, E.D.; Dinoi, G.; Inzani, F.; Fagotti, A.; Gueli Alletti, S.; Scarpellini, F.; Nero, C.; et al. One-Step Nucleic Acid Amplification (OSNA): A fast molecular test based on CK19 mRNA concentration for assessment of lymph-nodes metastases in early stage endometrial cancer. PLoS ONE 2018, 13, e0195877. [Google Scholar] [CrossRef] [PubMed] [Green Version]
  48. Fanizzi, A.; Pomarico, D.; Paradiso, A.; Bove, S.; Diotaiuti, S.; Didonna, V.; Giotta, F.; La Forgia, D.; Latorre, A.; Pastena, M.I.; et al. Predicting of Sentinel Lymph Node Status in Breast Cancer Patients with Clinically Negative Nodes: A Validation Study. Cancers 2021, 13, 352. [Google Scholar] [CrossRef] [PubMed]
  49. Okuno, J.; Miyake, T.; Sota, Y.; Tanei, T.; Kagara, N.; Naoi, Y.; Shimoda, M.; Shimazu, K.; Kim, S.J.; Noguchi, S. Development of prediction model including microRNA expression for sentinel lymph node metastasis in ER-positive and HER2-negative breast cancer. Ann. Surg. Oncol. 2021, 28, 310–319. [Google Scholar] [CrossRef]
  50. Bevilacqua, J.L.B.; Kattan, M.W.; Fey, J.V.; Cody, H.S., III; Borgen, P.I.; Van Zee, K.J. Doctor, what are my chances of having a positive sentinel node? A validated nomogram for risk estimation. J. Clin. Oncol. 2007, 25, 3670–3679. [Google Scholar] [CrossRef]
  51. Dong, Y.; Feng, Q.; Yang, W.; Lu, Z.; Deng, C.; Zhang, L.; Lian, Z.; Liu, J.; Luo, X.; Pei, S.; et al. Preoperative prediction of sentinel lymph node metastasis in breast cancer based on radiomics of T2-weighted fat-suppression and diffusion-weighted MRI. Eur. Radiol. 2018, 28, 582–591. [Google Scholar] [CrossRef]
  52. Luo, J.; Ning, Z.; Zhang, S.; Feng, Q.; Zhang, Y. Bag of deep features for preoperative prediction of sentinel lymph node metastasis in breast cancer. Phys. Med. Biol. 2018, 63, 245014. [Google Scholar] [CrossRef] [PubMed]
  53. Liu, M.; Mao, N.; Ma, H.; Dong, J.; Zhang, K.; Che, K.; Duan, S.; Zhang, X.; Shi, Y.; Xie, H. Pharmacokinetic parameters and radiomics model based on dynamic contrast enhanced MRI for the preoperative prediction of sentinel lymph node metastasis in breast cancer. Cancer Imaging 2020, 20, 1–8. [Google Scholar] [CrossRef] [PubMed]
  54. Liu, J.; Sun, D.; Chen, L.; Fang, Z.; Song, W.; Guo, D.; Ni, T.; Liu, C.; Feng, L.; Xia, Y.; et al. Radiomics analysis of dynamic contrast-enhanced magnetic resonance imaging for the prediction of sentinel lymph node metastasis in breast cancer. Front. Oncol. 2019, 9, 980. [Google Scholar] [CrossRef]
  55. Qiu, S.-Q.; Zeng, H.-C.; Zhang, F.; Chen, C.; Huang, W.-H.; Pleijhuis, R.G.; Wu, J.-D.; van Dam, G.M.; Zhang, G.-J. A nomogram to predict the probability of axillary lymph node metastasis in early breast cancer patients with positive axillary ultrasound. Sci. Rep. 2016, 6, 21196. [Google Scholar] [CrossRef] [PubMed] [Green Version]
  56. Yang, J.; Wang, T.; Yang, L.; Wang, Y.; Li, H.; Zhou, X.; Zhao, W.; Ren, J.; Li, X.; Tian, J.; et al. Preoperative prediction of axillary lymph node metastasis in breast cancer using mammography-based radiomics method. Sci. Rep. 2019, 9, 1–11. [Google Scholar] [CrossRef] [PubMed] [Green Version]
  57. Fanizzi, A.; Basile, T.M.A.; Losurdo, L.; Bellotti, R.; Bottigli, U.; Dentamaro, R.; Didonna, V.; Fausto, A.; Massafra, R.; Moschetta, M.; et al. A Machine Learning Approach on Multiscale Texture Analysis for Breast Microcalcification Diagnosis. BMC Bioinform. 2020, 21 Suppl. (S2), 91. [Google Scholar] [CrossRef] [PubMed] [Green Version]
  58. Fanizzi, A.; Basile, T.M.A.; Losurdo, L.; Bellotti, R.; Bottigli, U.; Campobasso, F.; Didonna, V.; Fausto, A.; Massafra, R.; Tagliafico, A.; et al. Ensemble Discrete Wavelet Transform and Gray-Level Co-Occurrence Matrix for Microcalcification Cluster Classification in Digital Mammography. Appl. Sci. 2019, 9, 5388. [Google Scholar] [CrossRef]
  59. Losurdo, L.; Fanizzi, A.; Basile, T.M.A.; Bellotti, R.; Bottigli, U.; Dentamaro, R.; Didonna, V.; Lorusso, V.; Massafra, R.; Tamborra, P.; et al. Radiomics Analysis on Contrast-Enhanced Spectral Mammography Images for Breast Cancer Diagnosis: A Pilot Study. Entropy 2019, 21, 1110. [Google Scholar] [CrossRef] [Green Version]
  60. Fanizzi, A.; Losurdo, L.; Basile, T.M.A.; Bellotti, R.; Bottigli, U.; Delogu, P.; Diacono, D.; Didonna, V.; Fausto, A.; Lombardi, A.; et al. Fully Automated Support System for Diagnosis of Breast Cancer in Contrast-Enhanced Spectral Mammography Images. J. Clin. Med. 2019, 8, 891. [Google Scholar] [CrossRef] [PubMed] [Green Version]
  61. Basile, T.M.A.; Fanizzi, A.; Losurdo, L.; Bellotti, R.; Bottigli, U.; Dentamaro, R.; Didonna, V.; Fausto, A.; Massafra, R.; Moschetta, M.; et al. Microcalcification Detection in Full-Field Digital Mammograms: A Fully Automated Computer-Aided System. Phys. Medica 2019, 64, 1–9. [Google Scholar] [CrossRef] [PubMed]
  62. Fanizzi, A.; Basile, T.M.A.; Losurdo, L.; Amoroso, N.; Bellotti, R.; Bottigli, U.; Dentamaro, R.; Didonna, V.; Fausto, A.; Massafra, R.; et al. Hough transform for microcalcification detection in digital mammograms. Appl. Digit. Image Process. XL 2017, 10396, 41. [Google Scholar]
  63. Losurdo, L.; Fanizzi, A.; Basile, T.M.A.; Bellotti, R.; Bottigli, U.; Dentamaro, R.; Didonna, V.; Fausto, A.; Massafra, R.; Monaco, A.; et al. A combined approach of multiscale texture analysis and interest point/corner detectors for microcalcifications diagnosis. Appl. Evol. Comput. 2018, 1, 302–313. [Google Scholar]
  64. La Forgia, D.; Fanizzi, A.; Campobasso, F.; Bellotti, R.; Didonna, V.; Lorusso, V.; Moschetta, M.; Massafra, R.; Tamborra, P.; Tangaro, S.; et al. Radiomic Analysis in Contrast-Enhanced Spectral Mammography for Predicting Breast Cancer Histologicalal Outcome. Diagnostics 2020, 10, 708. [Google Scholar] [CrossRef] [PubMed]
Figure 1. An index contraction is represented in (a), which rules a generic nearest-neighbors interaction in (b) for a Hilbert space tensor product. In (c), the graphical representation of a CNOT gate, which is included in the simple gate of (d), encircled by the orange dashed line [21].
Mathematics 09 00410 g001
Figure 2. Representation of the score given by the expectation value in Equation (9).
Mathematics 09 00410 g002
Figure 3. Feature selection circuits scheme, where lines not further elaborated are omitted. The two-qubit case is represented in panel (a), while two non-equivalent three-qubit circuits are shown in panels (b,c).
Mathematics 09 00410 g003
Figure 4. Histograms for the feature selection of the best performing feature pair in (a,b) and triplets in (c,d); orange bars refer to Figure 3b, while for the blue ones, see Figure 3c.
Mathematics 09 00410 g004
Table 1. Observed number of patients with positive lymph nodes according to the considered prognostic factors.
No. of PatientsNo. of Positive No. of PatientsNo. of Positive
Overall ER
634214negative6421
Age positive570193
<403314PgR
41–5012846negative14649
51–6015150positive488165
61–7016354Ki67
71–8011433negative397116
>804517positive23798
Diameter (mm) Her2/neu
T1a (>1, ≤5)3130471161
T1b (>5, ≤10)12518 1 + 7823
T1c (>10, ≤20)28188 2 + 4621
T2 (>20, ≤50)197105 3 + 399
Histological type Grading
ductal511185G117535
lobular6720G2286111
special type569G317368
Multiple tumors In situ component
negative492153negative265100
positive14261positive369114
Table 2. Sampled data set stratifications for CancerMath CM and quantum-inspired classifiers Q, Q’.
AgeER-PgR-Ki67Histological Subtype
CM6 stratabinary3 strata
Q’continuousbinary2 binary features
Qcontinuouscontinuous2 binary features
Table 3. Performances of classifiers trained over the whole dataset evaluated on 10 ten-fold cross-validation rounds and summarized in terms of the median, first, and third quartile. At the top, the quantum-inspired classifier gets percentage values for ER, PgR, and Ki67; at the bottom, their binary version is given.
AUC ( % ) Accuracy ( % ) Specificity ( % ) Sensitivity ( % )
Q 2 63.1 (62.7–63.3)65.5 (65.1–65.8)68.7 (67.6–70.0)59.3 (57.0–60.3)
Q 3 ( a ) 64.7 (64.1–65.1)69.5 (61.8–70.2)84.9 (59.3–87.9)39.5 (36.0–66.8)
CM 3 ( a ) 67.4 (67.4–67.5)61.7 (60.6–62.8)55.6 (51.9–59.5)73.6 (69.6–77.1)
Q 3 ( b ) 59.5 (59.1–59.8)65.3 (64.7–65.9)76.0 (75.5–78.3)43.2 (41.1–44.4)
CM 3 ( b ) 65.6 (65.4–65.8)65.8 (65.1–65.8)69.1 (67.6–69.1)59.3 (59.3–59.8)
AUC ( % ) Accuracy ( % ) Specificity ( % ) Sensitivity ( % )
Q 2 62.2 (62.0–62.2)68.3 (65.5–69.1)83.2 (75.0–84.8)39.5 (38.8–46.7)
Q 3 ( a ) 65.5 (65.3–65.7)64.3 (63.7–65.0)65.7 (62.9–68.6)61.7 (58.4–65.0)
CM 3 ( a ) 68.1 (67.8–68.5)62.0 (61.8–62.5)54.1 (53.6–55.7)77.8 (76.6–78.5)
Q 3 ( b ) 61.8 (60.3–62.8)69.2 (67.7–70.2)85.6 (84.8–86.7)37.6 (36.0–37.9)
CM 3 ( b ) 66.1 (65.7–66.2)57.4 (57.1–58.0)44.3 (42.9–46.2)83.2 (81.8–85.6)
Publisher’s Note: MDPI stays neutral with regard to jurisdictional claims in published maps and institutional affiliations.

