Article

Predicting Stock Market Investment Intention and Behavior among Malaysian Working Adults Using Partial Least Squares Structural Equation Modeling

by
Marvello Yang
1,
Abdullah Al Mamun
2,*,
Muhammad Mohiuddin
3,
Sayed Samer Ali Al-Shami
4 and
Noor Raihani Zainol
5
1
Department of Management, Faculty Economic and Business, Widya Dharma University Pontianak, Kota Pontianak, Kalimantan Barat 78243, Indonesia
2
Faculty of Business and Management, UCSI University, Cheras, Kuala Lumpur 56000, Malaysia
3
Faculty of Business Administration, Laval University, Quebec City, QC 2325, Canada
4
Institute of Technology Management and Entrepreneurship, Universiti Teknikal Malaysia Melaka, Durian Tunggal, Melaka 76100, Malaysia
5
Faculty of Entrepreneurship and Business, Universiti Malaysia Kelantan, Pengkalan Chepa, Kota Bharu 16100, Malaysia
*
Author to whom correspondence should be addressed.
Submission received: 12 March 2021 / Revised: 9 April 2021 / Accepted: 13 April 2021 / Published: 15 April 2021

Abstract

:
The purpose of this study was to investigate the effects of risk tolerance, financial well-being, financial literacy, overconfidence bias, herding behavior, and social interaction on stock market investment intention and stock market participation among working adults in Malaysia. Adopting the cross-sectional design, this study collected quantitative data from a total of 349 respondents in an online survey via Google form link across various social media platforms. This study used the partial least squares structural equation modeling (PLS-SEM) approach to test the hypotheses. This study revealed the significant positive effects of risk tolerance, herding behavior, and social interaction on stock market investment intention. Stock market investment intention also had a significant effect on stock market participation. Stock market investment intention was also found to successfully mediate the relationships of risk tolerance and overconfidence bias with stock market participation. When it comes to stock market investment, the government and related authorities should focus on developing programs and policies that provide a financial safety net for investors and promote investment-related social platforms. This study linked risk tolerance, financial well-being, financial literacy, overconfidence bias, herding behavior, social interaction, stock market investment intention, and stock market participation. This is one of the few early attempts to address issues in light of the stock market investment participation among the working adults in a developing country.

1. Introduction

The stock market becomes a crucial key for the development of the financial system in developing countries. The stock market provides opportunities for both new or experienced investors to increase their wealth [1]. However, the stock market is risky given the unpredictable price of the market, and this makes stock trading attractive to aggressive or high-risk appetite investors, as they pursue the old advice of buying low and selling high. In Malaysia, the Chinese have the highest average wealth of RM 128,325, 76% and 47% higher than Malays and Indians, respectively [2]. This evidence indicates the high correlation between ethnicity and investment behavior in relation to future financial decision-making [3]. During the Covid-19 outbreak, many countries suffered an economic recession. Back on the 27 March 2020, the Malaysian government announced a national economic stimulus package, specifically known as the Prihatin Rakyat Economic Stimulus Package 2020 (PRIHATIN Package), allocating RM 250 billion to ease the financial burden of Malaysian citizens and another RM 10 billion to ease the financial burden of small and medium-sized enterprises (SMEs). Due to the uncertainties caused by the Covid-19 outbreak, major shareholders of some listed companies even disposed their shares during the first few trading days when the movement control order (MCO) was enforced [4].
Over the years, the Malaysian government has tried to promote stock market investment among Malaysians who otherwise would generally deposit their money into various savings schemes that provide very little returns. Therefore, it is crucial to understand human behavior and decision-making from a financial perspective and examine factors that influence stock market investment intention among Malaysian working adults. In addition, investors need to develop a positive vision, foresight, patience, and drive [5]. Many factors influence investment stock market participation, such as cognitive and emotional weaknesses, risk tolerance, financial well-being, financial literacy, overconfidence bias, demographic characteristics, herding behavior, social interaction, income level, and investment intention [6]. There is a need to determine how these factors can influence stock market participation among the working adults in Malaysia.
According to the theory of planned behavior (TPB), behavioral achievement can be obtained through behavioral intention. Hence, when a behavior or situation affords a person complete control over behavioral performance, behavioral intention alone should be sufficient to predict the behavior [
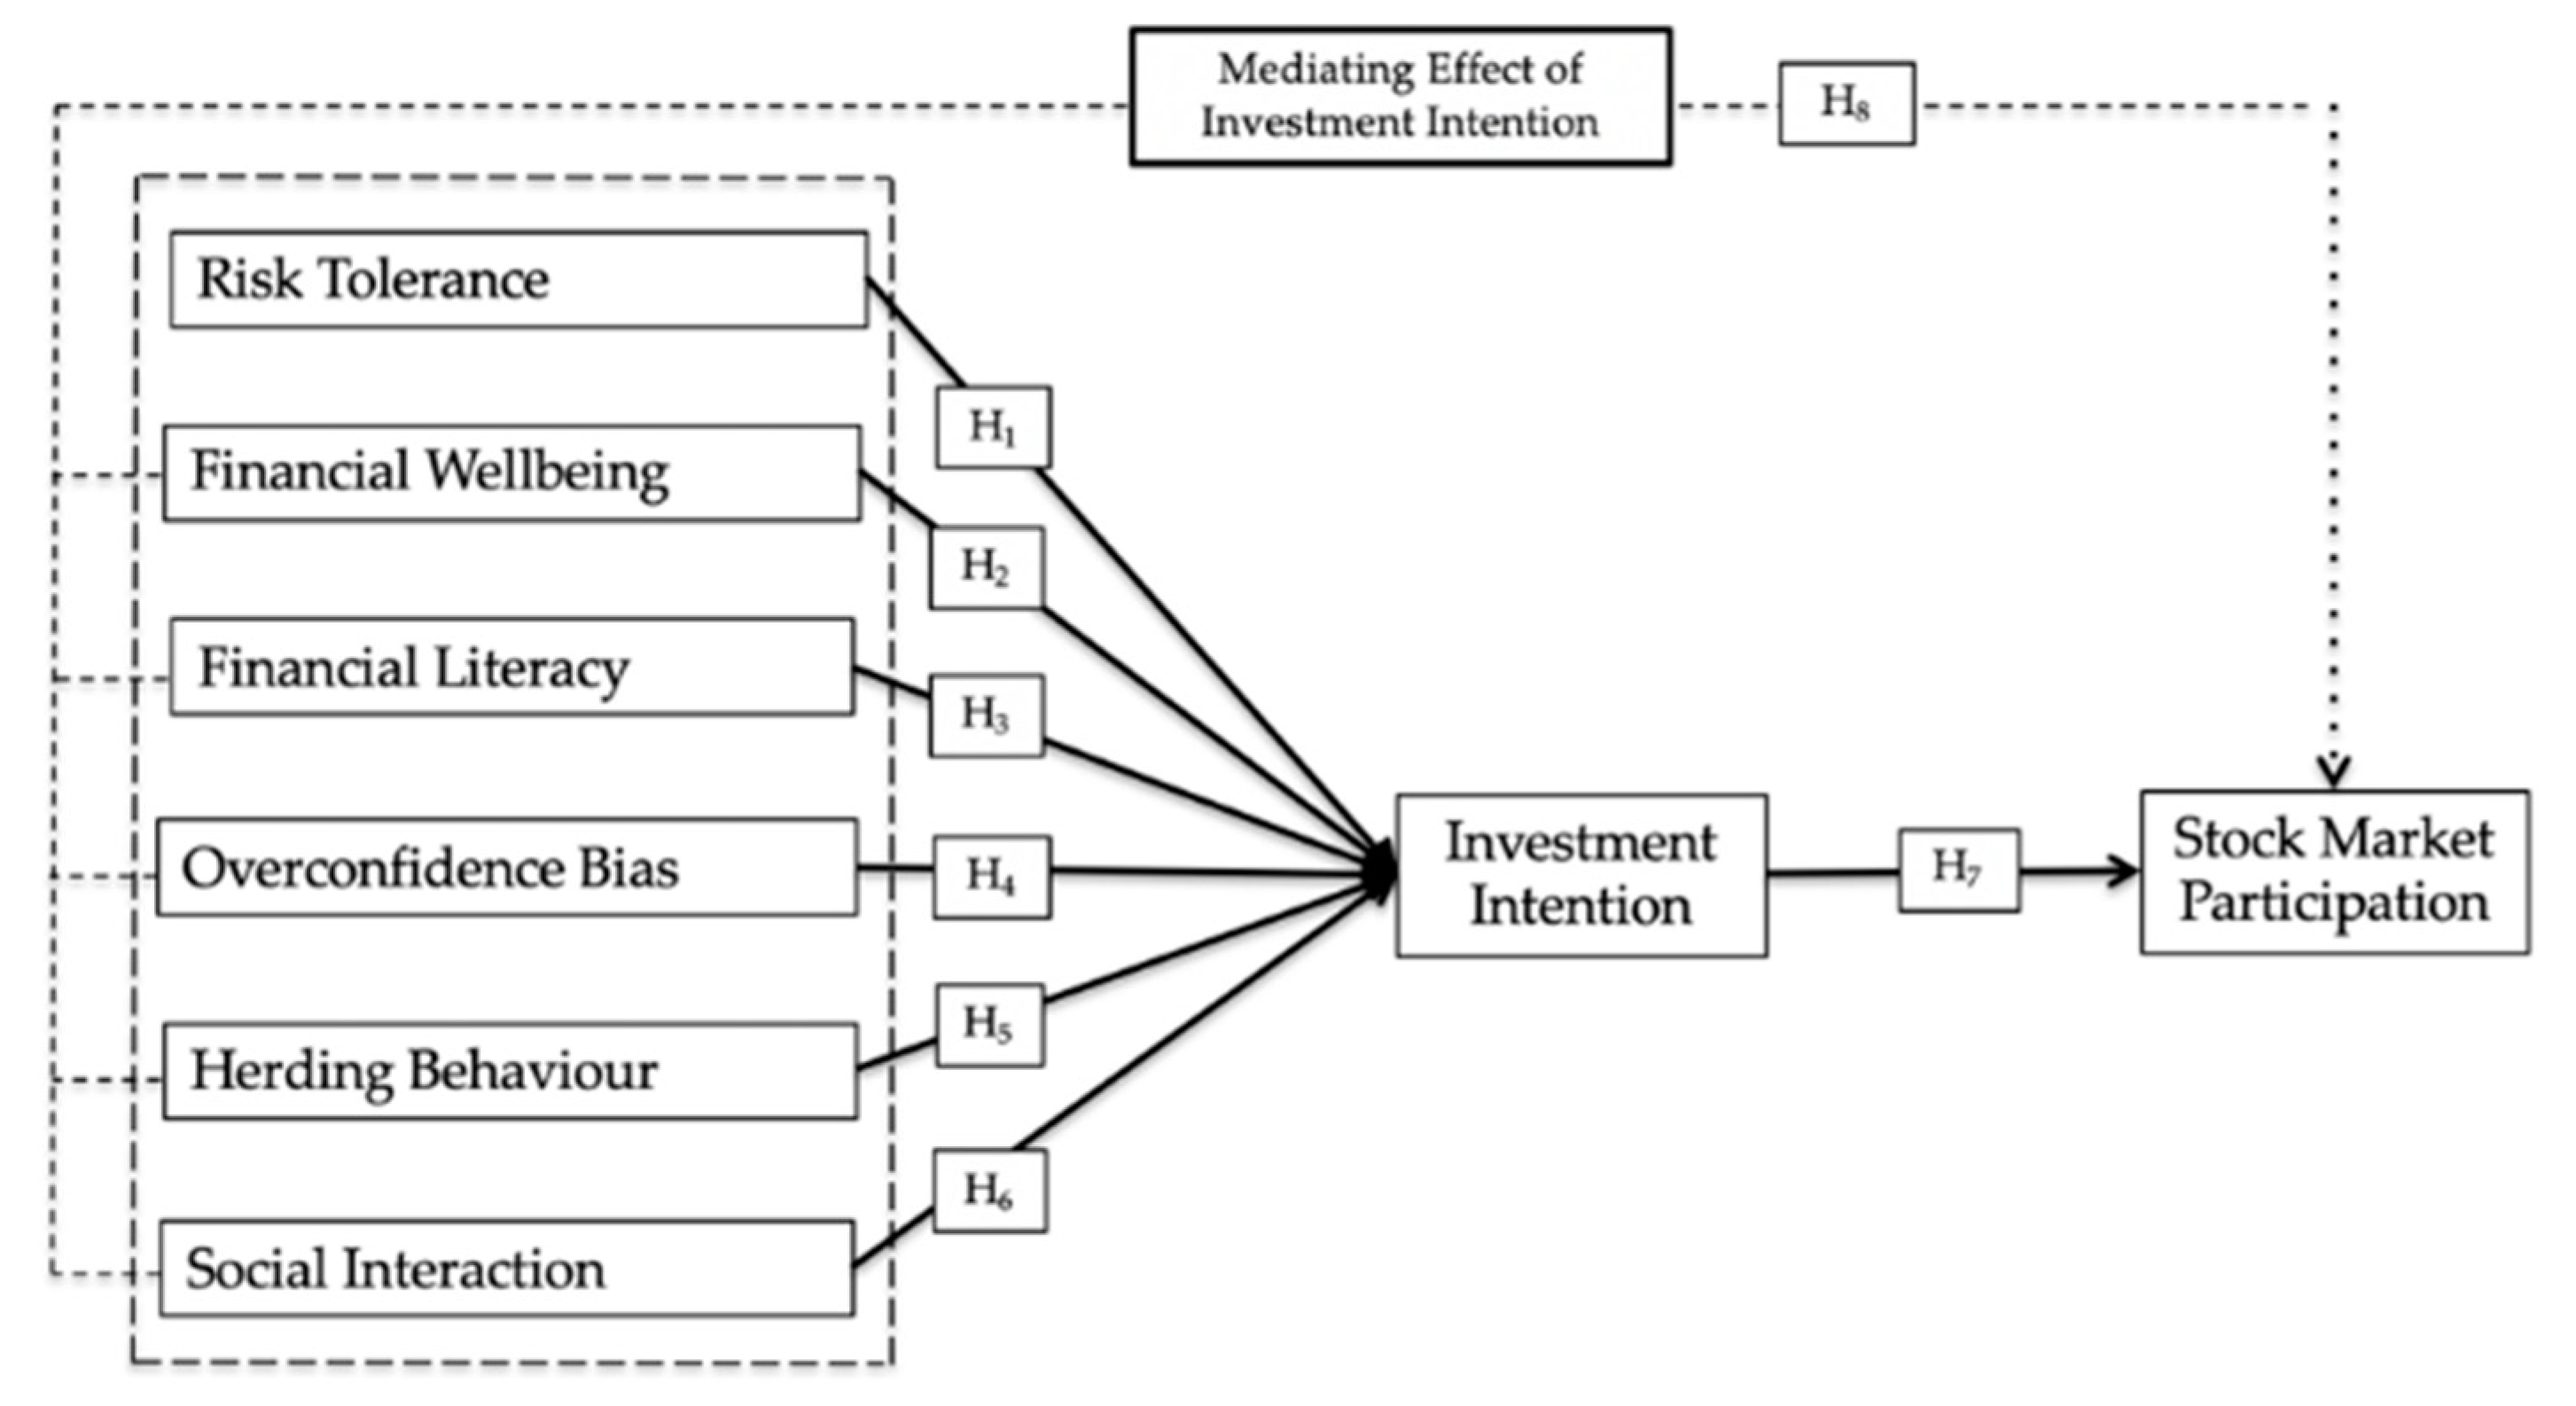
7]. Therefore, this study attempted to examine the relationships of risk tolerance, financial well-being, financial literacy, overconfidence bias, herding behavior, social interaction, stock market investment intention, and stock market participation within the Malaysian context.

2. Literature Review

2.1. Theoretical Foundation

TPB concerns one’s intention to perform a given behavior. It is assumed that behavioral intention captures motivational factors that influence a particular behavior [7]. Ahmad and Shah [6] investigated the effect of behavioral biases on individual investors’ decision-making and their performance in different cultures or environments. Behavioral finance, however, assumes that investment decisions are often irrational due to imperfect information. Investment decisions can be actively driven by the current and expected macroeconomic environments. Information related to macroeconomic variables may predict the variation in trading decisions. The significance of macroeconomic expectations in decision-making has been echoed in financial literature [8]. According to the consumption-based capital asset pricing model and other models, it was admitted that stock market participation could be much lower than predicted [9]. When individuals have a better attitude towards a particular action, they are more likely to perform the action. Therefore, it is reasonable that, in an investment context, an investor is more favorable towards investment [10]. Moreover, attempts of conducting analysis related to investment performance and start investing their resources, including evaluating their financial position, also show one’s level of stock market investment intention. With the application of TPB, this study investigated the mediating effect of stock market investment intention on stock market participation (SMP) in Malaysia. Investor’s attitudes can be classified as traditional mode investor, causal investor, long-term investor, and well-informed investor [11]. Traditional investors are relatively young investors who invest a very small percentage in the stock market. Causal investors invest 10 to 20 percent of their disposable income, and a third of investor’s attitudes are long-term investors, who consider capital gain and give high importance to the past movement of stock. This kind of investor being highly focused on capital gain, their less active role in the recovery phase is understandable and self-explanatory. The last is the biggest in number and constitutes almost 65 per cent of the total respondents with very alert and informed investors who study the market very carefully, read expert opinion, risk factors of stock, tracks past movement very often, and invests for the medium term. Moreover, Garg and Singh [12] pointed out that understanding the factors that contribute to the acquisition of financial literacy among working adults can help in making policy interventions targeted at working adults to enhance their financial wellbeing. In addition, working adult’s intention to invest in peer to peer lending is strongly influenced by their knowledge regarding mechanism, risk, and return [13]. Therefore, there are various factors that can affect a working adult’s intention to invest on stock market in developing countries such as Indonesia, Malaysia, and India.

2.2. Hypothesis Development

2.2.1. Risk Tolerance

Financial risk tolerance happens when one is committed to accept the uncertainties of the investment decision. Risk tolerance is said to have a substantial effect on one’s investment behavior [14]. Low-risk tolerance investors have the tendency to take up investment without understanding the financial risk involved [15]. The level of risk tolerance affects investor’s investment behavior. High-risk tolerance investors trade in stocks of higher value. Lim, Soutar, and Lee [16] examined the differences in investment decisions and behaviors between investors of high uncertainty avoidance and low uncertainty avoidance. Investors with low uncertainty avoidance in the study displayed the following characteristics: (1) They were more flexible; (2) they accepted uncertainties without a great deal of discomfort; (3) they took risks easily; (4) they showed a greater tolerance for others’ opinions and behaviors. Therefore, they showed high risk tolerance and uncertainty or vagueness attitudes towards their investment on whether it will give them a profit or loss. An investor invests in volatile investments in order to get higher profits than average. Based on the above discussion, the following hypothesis was proposed for testing:
Hypothesis 1 (H1).
Risk tolerance has a significant positive effect on stock market investment intention among Malaysian working adults.

2.2.2. Financial Well-Being

Financially-informed individuals make wiser decisions for their family members, and they are in a better position to in terms of financial sustainability [17]. Khalil and Akhtar [18] stated that investors with positive investment behaviors can experience positive impact on their financial well-being. Financial well-being associated individuals move from distinctive perspective with psychological adjustment, physical health and life satisfaction of the investor life cycle [19]. Kamakia, Mwangi, and Mwangi [20] identified financial well-being may impact the individual’s evaluation and intention related to retirement investment. Based on the above discussion, the following hypothesis was suggested for testing:
Hypothesis 2 (H2).
Financial well-being has a significant positive effect on stock market investment intention among Malaysian working adults.

2.2.3. Financial Literacy

Financial literacy has become a phenomenon of interest for financial decisions [21]. Financial literacy is considered as means to expedite financial well-being. Financial literacy enables informed judgments and effective decision-making on the usage of investment. Financial literacy not only helps investors to build a settled way of thinking for their investment decisions but also makes them confident to perform rational and well-calculated judgements [22]. Moreover, financial literacy can help individuals with day-to-day financial tasks and to deal with financial emergency [12]. Considering the various financial behaviors, Kamakia, Mwangi, and Mwangi [20] acknowledged the need for motivation and confidence to apply financial knowledge in one’s decision-making. Financial literacy affects one’s financial decisions in many aspects, such as wealth management, stock holding, and insurance demand [23]. Based on the findings of previous studies, this study proposed the following hypothesis:
Hypothesis 3 (H3).
Financial literacy has a significant positive effect on stock market investment intention among Malaysian working adults.

2.2.4. Overconfidence Bias

Overconfidence is basically heuristic bias, in which investors rely on ostensibly, to reduce the risk of losses in unpredictable situations. Overconfidence leads stock market investors towards understating investment-related risks and overstating their stock market knowledge and trading excessively, which ultimately affect their behaviors [24]. When investors are overconfident, they are more likely to take higher risk [25]. When individual investors use heuristics, their technical knowledge and reasoning faculties are impaired, leading to errors in judgement [6]. Bakar, Ng, and Yi [26] noted the significant positive effect of overconfidence bias on investors’ decision-making. Investors with overconfidence bias tend to focus more on profitability, usage of debt financing, and preference for short-term external investment in the cost of a long-term project [27]. Based on the above discussion, this study proposed the following hypothesis:
Hypothesis 4 (H4).
Overconfidence bias has a significant positive effect on stock market investment intention among Malaysian working adults.

2.2.5. Herding Behavior

Individuals with herding behavior base their investment decisions on the crowd actions of buying and selling, which create speculative bubbles and subsequently, make the stock market inefficient [26]. Herding behavior affects investors for two reasons: (1) To protect themselves from losses; (2) to reward themselves with maximum profit [25]. Herding behavior happens when investors pick stocks for investment and do not avoid stocks. With that, herding behavior may drive the industry market values away from the fundamentals [28]. Based on the above discussion, the following hypothesis was suggested:
Hypothesis 5 (H5).
Herding behavior has a significant positive effect on stock market investment intention among Malaysian working adults.

2.2.6. Social Interaction

Social influence refers to one’s perception towards other individuals on the target behavior and whether they expect others to perform that behavior. Social influence considers users’ perceptions of how other users perceive about a certain product or services. A feedback mechanism is used—for instance, by receiving recognition in the forms of “likes” and comments and conforming to the perceived expectations of other users [29]. The spreading of investment success stories within the social networks may partly explain the fluctuations of stock market. Internet and social interaction increase stock market participation, and the usage of modern communication devices may crowd out the informational effect of social interaction [9]. Studies have revealed the positive effect of social interaction and media on trading decisions. Furthermore, among the social factors, social interaction yields major impact on trading decisions [30]. Moreover, Wu, Huang, Chen, Davison, and Hua [31] demonstrated the positive impact of social interaction on customers’ investment intention. Therefore, based on the above discussion, the following hypothesis was proposed for testing:
Hypothesis 6 (H6).
Social interaction has a significant positive effect on stock market investment intention among Malaysian working adults.

2.2.7. Stock Market Investment Intention

When it comes to decision-making, investors have to choose a certain course of action among various alternatives in the world of uncertainties [32]. Identifying the relative importance of the determinants of behavioral intention is one essential step in studying the behavioral intention of individual investors [33]. Moreover, intention is assumed to capture motivational factors that influence a particular behavior and indicate one’s willingness to try or how much effort one exerts to perform the behavior [7]. Investment intention was found to significantly predict behavior in relation to stock market [34]. Therefore, based on the above discussion, the following hypothesis was suggested:
Hypothesis 7 (H7).
Stock market investment intention has a significant positive effect on stock market participation among Malaysian working adults.

2.2.8. Mediating Effect of Stock Market Investment Intention

Investment intention can be predicted by several predictors, such as risk tolerance, herding behavior, and financial literacy, towards obtaining stock market participation [33]. One’s financial behavior is termed as investment intention—short- and long-term investment intentions are intended to reflect behavioral intentions [35]. Hence, the behavior of an investor, investment experience, and social interaction significantly influence stock market investment intention and subsequently, stock market participation [36]. According to [7], one’s intention can predict future behavior because intention is a preliminary step to the subsequent pattern of behavior. Intention is an attitudinal construct based on intrinsic values and plays an important role in predicting one’s future behavior. Consequently, intention indicates the direction of one’s possible behavior in the future [37]. Based on the above discussion, the following hypothesis was proposed for testing:
Hypothesis 8 (H8).
Stock market investment intention mediates the relationships of risk tolerance, financial well-being, financial literacy, overconfidence bias, herding behavior, and social interaction with stock market participation among Malaysian working adults.
All association hypothesized and tested, presented in Figure 1 below.

3. Research Methodology

3.1. Population and Sample

Adopting the cross-sectional design, this study collected quantitative data in an online survey via a Google form link across various social media platforms, including Facebook, WhatsApp, and Instagram. An online survey was one of the convenient sampling methods, which has been widely adopted by researchers to collect data during the lockdown due to the Covid-19 outbreak. In order to obtain the minimum sample size, this study used G*Power 3.1 (Heinrich Heine University, Düsseldorf, Germany) (source: https://webpower.psychstat.org/models/kurtosis/ accessed on 23 November 2020). With the power of 0.95, effect size of 0.15, and 4 predictors, the calculated minimum sample size for this study was 74. In order to avoid any complications due to the small sample size, this study aimed to collect data from more than 300 respondents. The online survey was conducted from September 2020 to October 2020, resulting in a total of 349 respondents. The collected data were analyzed to test the effects of selected constructs on stock market investment intention and stock market participation. This study used partial least squares used structural equation modelling (PLS-SEM) to analyze the data.

3.2. Measures of Constructs

Risk tolerance in this study was generally defined as the willingness to accept the maximum amount of uncertainties when one makes a financial decision [38]. Five items were used to measure risk tolerance, which were adopted from Pak and Mahmood [39] and Sarwar and Afaf [15]. Meanwhile, this study viewed financial well-being as a composite concept contributing to one’s assessment of financial status [17]. Five items were also used to measure financial well-being, which were adopted from Lee, Lee, and Kim [17]. Financial literacy in this study was viewed as the required knowledge that enables individuals to make financial decisions in their best interest. Five items were used to measure financial literacy, which were adopted from Sarwar and Afaf [15] and Raut [22]. Overconfidence bias happens when one overstates knowledge, skills, and capabilities, understates the risk, and even ignore the actual facts [40]. Five items were also used to measure overconfidence bias in this study, which were adopted from Sarwar and Afaf [15]. Herding behavior in this study was defined as the tendency of investors to imitate activities of other investors, disregarding their own personal information and expectations. In order to measure herding behavior, this study adopted five items from Sarwar and Afaf [15]. Social interaction played an important role in transmitting relevant information to potential investors, which may be affected by other information channels [9]. In order to measure social interaction, this study adopted 5 items from Wu et al. [31]. Stock market investment intention in this study referred to the indication of one’s willingness to perform a specific behavior. This study adopted 5 items from Akhtar and Das [29]. For the measurement of stock market participation, this study adopted 5 items from Khan, Tan, and Chong [8] and Akhtar and Das [29]. All items adapted in this study presented in Appendix A. Finally, in this study, a 5-point Likert scale with the endpoints of “strongly disagree” (1) and “strongly agree” (5) was used, and its purpose was to determine how significant the relationships of the selected constructs were with stock market investment intention and stock market participation.

3.3. Multivariate Normality

The study obtained the multivariate normality using Web Power [41]. The calculated Mardia’s multivariate skewness and kurtosis coefficient and p-values revealed that the data had non-normality issue as the p-values were less than 0.05 [42].

3.4. Data Analysis Method

The partial least square structural equation modeling (PLS-SEM) was employed to estimate complex cause–effect relationship models with latent variables [43]. Contrasting covariance-based approaches to structural equation modeling were suitable to assess higher-order constructs and complex conceptual model with mediation effects [41]. Since the study sample had exceeded 100 (n = 349), the PLS-SEM technique via SmartPLS was suitable for this study to test the causal–effect relationships proposed in this study model.

4. Data Analysis

4.1. Demographic Characteristics of Respondents

Table 1 shows the demographic characteristics of the respondents in this study. As for the gender aspect, the survey was dominated by female respondents (51.0%), and the remaining 49.0% were male respondents. In addition, most of respondents in this study were 18 to 30 years old (84.8%), followed by those between 31 to 40 years old (10.0%). The remaining respondents were between 41 to 50 years old (2.6%) and above 50 years old (2.6%). Furthermore, Chinese (92.8%) represented the majority of respondents in this study, followed by Indians (4.0%) and Malays (3.2%). As for their education level, the survey was dominated by bachelor degree holders (51.9%), followed by diploma holders (21.2%), secondary school certificates (19.8%), and lastly, Master’s degree or doctoral degree holders (7.2%). About 47.0% of the respondents in this study were students, while 41.8% of the respondents were employed. About 8.9% of the respondents were self-employed, and the remaining respondents (2.3%) were unemployed. Based on the data on annual income, 58.2% of the respondents reported an annual income of below RM 24,000; 28.9% of the respondents reported an annual income ranging from RM 24,000 to RM 48,000; 8.6% of the respondents reported an annual income ranging from RM 48,001 to RM 72,000; 2.3% of the respondents reported an annual income ranging from RM 72,001 to RM 96,000. The remaining respondents reported an annual income of above RM 96,000 (2.0%).

4.2. Reliability and Validity

The measurement model was the first assessment in SEM that included the evaluation of construct reliability, indicator reliability, convergent validity, and discriminant validity of the outlined constructs. Construct reliability can be assessed in terms of composite reliability (CR) and Cronbach’s alpha (CA). A CR of greater than 0.07 indicates adequate construct reliability [44]. Table 2 presents the results of the measurement model, which showed CR values of greater than 0.07; thus, confirming adequate construct reliability. Indicator reliability in this study was assessed in terms of CA, in which CA must be higher than 0.06. The results indicated CA of constructs were all acceptable. Convergent validity was assessed using average variance extracted (AVE). The criterion was that the values of AVE must be higher than 0.50 [45]. The results revealed that all constructs recorded substantial AVE values and achieved convergent validity. The values of CR, CA, and AVE are tabulated in Table 2.
The assessment of discriminant validity involves 2 types of methods, which were used in this study: Fornell–Larcker criterion and cross-loadings. Initial discriminant validity of the construct was tested with another method for measuring discriminant validity to assess the cross-loadings of indicators [44]. Fornell–Larcker criterion was used to assess the discriminant validity of constructs, which involved comparing the square root values of AVE of each construct with the correlation between constructs. On the other hand, the method of cross-loadings suggests that the outer loadings of constructs should be greater than the loadings of corresponding constructs. With that, adequate discriminant validity of all constructs can be validated. The results of the Fornell–Larcker criterion are presented in Table 3, while the results of cross-loadings were tabulated in Table 4. This study confirmed adequate discriminant validity for all constructs, as all constructs loading were higher than other constructs. Finally, the variance inflation factor (VIF) values were less than 5, which indicates the absence of multicollinearity. Following the recommendation by Kock [46], this study tested full collinearity diagnostics of all independent variables. All the study constructs regressed on the common variable and the VIF value less than 5 indicates the absence of bias from the single-source data. Full collinearity analysis shows no issue of single-source bias.

4.3. Path Analysis

The results on the structural model in Table 5 revealed factors that affect stock market investment intention. This study demonstrated the significant effects of risk tolerance, herding behavior, and social interaction on stock market investment intention. This study also revealed the significant effect of stock market investment intention on stock market participation. On the contrary, financial well-being, financial literacy, and overconfidence bias were found to contribute significant effects on stock market investment intention.
Based on the effect size (f2), all constructs in this study exhibited a small effect size on stock market investment intention, which ranged from 0.000 to 0.124. According to Hair et al. [44], the blindfolding procedure showed how the values of constructs were well-observed by reconstructing the estimates of the parameters. In addition, the blindfolding procedure can be applied only on endogenous constructs with reflective indicators. The predictive relevance of the model in this study was calculated collectively with Q2 for all factors at the individual level (single factor). The results of predictive relevance Q2 were also presented in Table 5. The results of the blindfolding procedure revealed substantial predictive relevance of the model at 0.603%, which confirmed the integration of the predictors in relation to stock market investment intention.

4.4. Mediating Effects

In this study, stock market investment intention exhibited a partial mediating effect on the relationship between the predictors and stock market participation. The coefficient of risk tolerance in relation to stock market participation recorded 0.260 (p-value = 0.001). This indicates the mediating effect of stock market investment intention on the relationship between risk tolerance and stock market participation. Besides that, stock market investment intention was also found to significantly mediate the relationship between overconfidence bias and stock market participation (coefficient of 0.129, p-value = 0.031). On the contrary, stock market investment intention did not exhibit any mediating effect on the individual relationships of financial well-being (p-value = 0.098), financial literacy (p-value = 0.226), herding behavior (p-value = 0.122), and social interaction (p-value = 0.122) with stock market participation (p-value > 0.05). Table 6 presents the results on the mediating effect of stock market investment intention on the proposed relationships.

4.5. Multiple Group Analysis

Multiple group analyses were applied to determine the differences between the model based on gender and education. Table 7 demonstrates the path values for the 2 groups and the differences within the groups in terms of p-values.
The results of the 2 groups based on the gender of the sample demonstrated a significant difference in the relationship between herding behaviors and social interaction on investment intention and the effect of investment intention on stock market participation. The effect of herding behaviors on investment intention was high among the female working adults, whereas the effect of social interaction and investment intention on stock market participation was significantly higher among the male working adults than that of others.
The results of the 2 groups based on education show that the effect of social interaction on investment intention among the working adults with high school and/or diploma was significantly higher than the working adults with a bachelor’s degree and above. The findings highlight that social interaction plays a much bigger role in investment decisions among the less educated working adults in Malaysia.

5. Discussion

This study aimed to investigate the mediating effect of stock market investment intention on the relationships of selected constructs with stock market participation within the Malaysian context. This study verified the significant positive effect of risk tolerance on stock market investment intention, which is compatible with the findings of a study by Fauzi, Husniyah, and Amim [14]. The study specifically stated that risk-takers tend to be involved in stock market investment. The perception towards one’s capability to control stock investment decisions is also important due to the influence of the individual’s confidence in the stock investment market. Besides that, the relationship between herding behavior and stock market investment intention was also found statistically significant. This particular finding is consistent with the finding of a prior study [47]. Kumari et al. [47] identified herding behavior as a specific investment-related behavior that an investor assumes in combating the volatility of the stock market. With the lack of knowledge and restricted information, many investors concurrently replicate the actions of other investors. Meanwhile, social interaction in this study was found to exhibit a significant effect on stock market investment intention. This particular finding supports the finding of a study by Wu et al. [31], which stated that there is a major impact of social interaction on stock market investment intention. Inexperienced investors can acquire both higher utilitarian and hedonic values from social values, and stock market investment intention relies more on hedonic values. Meanwhile, experienced investors place greater emphasis on utilitarian values. In addition, Shanmugham and Ramya [30] revealed that social interaction (e.g., social media and information from close friends) promotes stock market investment intention and subsequently increases stock market participation.
Furthermore, this study demonstrated the significant effect of stock market investment intention on stock market participation. Sarwar and Afaf [15] stated that stock market investment intention plays a crucial role in the relationship between risk tolerance and herding behavior. However, this study demonstrated insignificant effects of financial well-being, financial literacy, and overconfidence bias on stock market investment intention. The findings of this study are not in line with the findings of previous studies [12,26]. These studies highlighted that understanding the factors that contribute to or detract from the acquisition of financial literacy among working adults can help in making policy interventions targeted at working adults for a higher level of financial well-being.
In addition, this study evidenced that the contradictory findings may be caused by the differences in demographic characteristics. The current study argued that female working adults generally possess higher financial literacy than male working adults. In most cases, a higher educational level was also found to be a significant indicator of higher financial knowledge, financial attitude, financial behavior, and financial literacy. Moreover, employment status, annual income, and financial socialization were also found to influence financial knowledge, financial well-being, overconfidence bias, and financial literacy at the individual level. In addition, this study argued the propensity of the Chinese to have a better understanding of investment for asset prospects in the future compared to other ethnic groups in Malaysia.
Adding to that, this study investigated the mediating effect of stock market investment intention. This study proved that stock market investment intention mediates the effects of risk tolerance and overconfidence bias on stock market participation within the context of developing countries. On the other hand, this study proved that the intention to invest among the majority of Malaysian working adults does not mediate the effects of certain factors on stock market participation, such as financial well-being, financial literacy, herding behavior, and social interaction.
Nonetheless, this study argued the different rates of stock market participation across countries, specifically between developing and developed countries, which generally increases with wealth. Moreover, at a higher wealth level, working adults in developing countries, such as Malaysia, do not hold stock, as they make a rational choice of not holding part of their assets in the stock market given their lack of financial literacy and inability to imitate the activities of other investors (of disregarding their own personal information and expectations). Meanwhile, working adults in developed countries have a better understanding of investing part of their assets in the stock market for higher income.
Majority of respondents in this study are employees with an annual income below RM 24,000, and the respondents in this study are dominated by young women with higher education graduates. These findings indicated that respondents in this study need a better understanding of stock market investment to gain their income and self-confidence. In addition, lack of investment knowledge and intentions become barriers for them to participate in the stock market. Perkins and Jones [48] stress the importance of demographics and hypothesized that different demographics generally have a different outlook on finance and spending. These factors translate into market dynamics that can be leveraged while selecting a portfolio. They emphasize creating a consistent and habitual savings and investing plan. Therefore, based on the statistical correlation in this study, financial wellbeing, financial literacy, and overconfidence bias had no significant relationship on stock market investment among Malaysian working adults.
The majority of Malaysian working adults in this study is dominated by female worker around 18 to 30 years old, with 84.8%. These findings showed that the participation of women is more sensitive towards stock market investment in Malaysia. The participants of Chinese (92.8%) who hold a bachelor’s degree tend to have a better understanding of the stock market. Consequently, these results pointed out that Chinese employees had a greater intention to gain their knowledge, investment, and income. Moreover, based on received data from respondents, 58.2% of respondents in this study have an annual income below Rm.24.000. This indicated that Malaysia’s stock market investment has big potential to motivate Malaysian working adults with annual income under RM. 24.000 to invest their money or disposable income in the stock market to gain their income in SMI. Working adults in developing countries tend to score low on financial knowledge, financial attitude, financial behavior, and financial literacy. Therefore, an individual’s perception and financial opportunity recognition are important to obtain Malaysian working adults’ intentions in stock market investment. This finding is also supported in the study by Garg and Singh [12], which stated that educational status, employment status, and family background play important factors to determine if high financial knowledge, financial attitude, financial behavior, and financial literacy of Participants.

6. Theory and Practical Implications

One of the major contributions of this study came from the development of stock market investment intention among working adults in relation to their investment decision-making processes from different behavioral perspectives. This study argued the importance of risk tolerance and overconfidence bias as predictors of working adult’s participation in the stock market through stock market investment intention. Practitioners need to develop a better understanding of the significant factors that affect stock market investment intention among working adults. Based on the findings of this study, it is suggested that increasing such investing capabilities can increase the willingness to invest in the stock market. Besides that, financial advisors may consider conducting financial training to equip working adults with knowledge before making any investment, and this may also encourage them to be more involved in their investment decisions. The nature of such training is important, as it provides information and a sense of connection to build involvement. Moreover, the findings of this study on stock market participation and the mediating effect of stock market investment intention within the context of working adults in developing countries have also extended the current literature on behavioral finance and behavioral theories, such as TPB. The practical contribution of this study is that the capital market and security authority have to put more events and workshops in place for Malaysian working adults. Moreover, the capital market and security authority (CMSA) need to motivate and provide adequate training, seminars, and awareness among working adults on the potential benefits of investing in the stock market in Malaysia. Thus that the individual has a better understanding of the stock market in the future. Other factors that might influence financial wellbeing, financial wellbeing, and overconfidence bias on stock market participation, such as income, mindset, culture, and gender, should be investigated. As a consequence, this will give more comprehensive results and influence more individuals to participate in the stock market.

7. Conclusions and Future Research

Stock market investment intention among working adults is crucial for their future assets. Creating a campaign or investment program to socialize stock investment is likely to provide a better understanding of the perspectives of Malaysian working adults towards stock market investment and subsequently contribute to the growing number of investors. The findings of this study can help firms that intend to maximize their funding sources from the stock market. Although the current study has successfully provided significant insights on the factors that influence stock market investment intention among working adults and the applicability of TPB within the context of developing countries, this study encountered several limitations. Firstly, this study exclusively focused on Malaysian working adults. Therefore, the generalization of the findings needs to be carefully considered. Secondly, for a better understanding, longitudinal data should be considered in future research. It is recommended for future research to incorporate individual characteristics, such as annual income, ethnicity, education level, as potential moderating variables in relation to stock market investment intention. This study adopted a convenient sampling method because it was easy to obtain a big sample and be time-efficient. However, this sampling method has weaknesses, such as the contribution of the findings can only be applicable to the group of the target respondents.

Author Contributions

M.Y., M.M., S.S.A.A.-S., and N.R.Z. focused on conceptualization, methodology, resources, and writing—original draft preparation; A.A.M. focused on conceptualization, methodology, supervision, and writing—review and editing. All authors have read and agreed to the published version of the manuscript.

Funding

This research received no external funding.

Institutional Review Board Statement

Local ethics committees (UCSI University) ruled that no formal ethics approval was required for such research. This study has been performed in accordance with the Declaration of Helsinki.

Informed Consent Statement

Written informed consent for participation was obtained from respondents who participated in the survey. For the respondents who participated the survey online (using google form), they were asked to read the ethical statement posted on the top of the form (There is no compensation for responding nor is there any known risk. In order to ensure that all information will remain confidential, please do not include your name. Participation is strictly voluntary and you may refuse to participate at any time) and proceed only if they agree.

Data Availability Statement

The data presented in this study are available on request from the corresponding author.

Conflicts of Interest

The authors declare no conflict of interest.

Appendix A

Table A1. Survey Instrument.
CodeQuestion
RT—Item 1I consider myself as a high-risk taker
RT—Item 2If I unexpectedly received some easy money, I would surely invest a certain amount of money in stocks
RT—Item 3I would prefer to invest in stocks rather than to keep money in a bank account
RT—Item 4I consider risk in investments as an opportunity
RT—Item 5In the investment process, if it happens, I would not mind losing some money
FW—Item 1I am securing my financial future
FW—Item 2I am behind with my finances
FW—Item 3My finances control my life
FW—Item 4I am just getting by financially
FW—Item 5I am concerned that the money I have or will save won’t last
FL—Item 1I have complete knowledge of stock exchange
FL—Item 2I check financial statements of company of past 5 years before investing
FL—Item 3I consider the financial position of a company before investing
FL—Item 4Considering a long-term period (e.g., 10–20 years) stocks normally give the highest return
OB—Item 1I feel confident to evaluate securities prices in my investment portfolio myself
OB—Item 2My past profitable investments were mainly due to my specific investment skills
OB—Item 3My ability to predict future prices is better
OB—Item 4My investments decisions can mostly earn higher than average return in the market
OB—Item 5I believe that my skills and knowledge of the market help me to outperform the market
HB—Item 1My volume of investment also depends on others opinion (broker, financial consultant)
HB—Item 2I am confident about accuracy of my investment decisions
HB—Item 3I believe that information from friends has high reliability
HB—Item 4I believe that information from colleagues has high reliability
HB—Item 5I believe that information from relatives has high reliability.
SI—Item 1I maintain close social relationships with my friends (investors).
SI—Item 2I spend a lot of time interacting with my friends (investors).
SI—Item 3I have frequent communication with my friends (investors).
SI—Item 4I am a very active person in investment related conversation.
SI—Item 5I really enjoy talking to people (investors).
INT—Item 1I will invest in stock market frequently
INT—Item 2I will encourage my friend and family to invest in stock market
INT—Item 3I will invest in stock market in near future
INT—Item 4I believe that the Stock Exchange is an attractive investment channel
SMP—Item 1I have a portfolio that focuses on multiple asset classes (i.e., stocks, bonds, cash, real estate, etc.).
SMP—Item 2I invest in stocks about which I think will definitely grow in future.
SMP—Item 3I invest in stocks in which I can get the profit as soon as possible.
SMP—Item 4I often buy and sell stock/shares.
SMP—Item 5I manage my portfolio for maximum gross return rather than tax and cost efficiency.

References

  1. Kalam, K. The Effects of Macroeconomic Variables on Stock Market Returns: Evidence the Effects of Macroeconomic Variables on Stock Market Returns: Malaysia’s Stock Market Return Performance Evidence from. J. World Bus. 2020, 55. Available online: https://www.researchgate.net/publication/344158504_The_Effects_of_Macroeconomic_Variables_on_Stock_Market_Returns_Evidence_from_Malaysia’s_Stock_Market_Return_Performance (accessed on 27 November 2020).
  2. Khalid, M.A. NEP to NEM: Who Cares? Wealth Distribution in Malaysia. Pros. Perkem 2011, 4, 400–409. [Google Scholar]
  3. Rahman, M.; Albaity, M.; Isa, C.R. Behavioural propensities and financial risk tolerance: The moderating effect of ethnicity. Int. J. Emerg. Mark. 2019, 15, 728–745. [Google Scholar] [CrossRef]
  4. Lee, K.Y.-M.; Jais, M.; Chan, C.-W. Impact of Covid-19: Evidence from Malaysian Stock Market. Int. J. Bus. Society 2020, 21, 607–628. [Google Scholar]
  5. Ansari, M.L.; Moid, M.S. Factors Affecting Investment Behaviour among Young Professionals. Int. J. Tech. Res. Appl. 2013, 1, 27–32. [Google Scholar]
  6. Ahmad, M.; Shah, S.Z.A. Overconfidence heuristic-driven bias in investment decision-making and performance: Mediating effects of risk perception and moderating effects of financial literacy. J. Econ. Adm. Sci. 2020. [Google Scholar] [CrossRef]
  7. Ajzen, I. The Theory of Planned Behavior. Organ. Behav. Hum. Decis. Process. 1991, 50, 179–211. [Google Scholar] [CrossRef]
  8. Khan, M.T.I.; Tan, S.H.; Chong, L.L. Active trading and retail investors in Malaysia. Int. J. Emerg. Mark. 2017, 12, 708–726. [Google Scholar] [CrossRef]
  9. Liang, P.; Guo, S. Social interaction, Internet access and stock market participation-An empirical study in China. J. Comp. Econ. 2015, 43, 883–901. [Google Scholar] [CrossRef]
  10. Nugraha, B.A.; Rahadi, R.A. Analysis of young generations toward stock investment intention: A preliminary study in an emerging market. J. Account. Investig. 2021, 22, 80–103. [Google Scholar] [CrossRef]
  11. Shah, M.; Verma, A. Analysis of Investment Behaviour during Recovery Phase among Youth Investors of Indian Stock Market. Vis. J. Bus. Perspect. 2011, 15, 1–9. [Google Scholar] [CrossRef]
  12. Garg, N.; Singh, S. Financial literacy among youth. Int. J. Soc. Econ. 2018, 45, 173–186. [Google Scholar] [CrossRef]
  13. Ichwan, I.; Rahmatina, A.K. Why are youth intent on investing through peer to peer lending? Evidence from Indonesia. J. Islamic Monet. Econ. Financ. 2019, 5, 741–762. [Google Scholar] [CrossRef]
  14. Fauzi, A.A.W.; Husniyah, S.M.F.; Amim, O.M. Financial Risk Tolerance as a Predictor for Malaysian Employees’ Gold Investment Behavior; Springer International Publishing: Berlin/Heidelberg, Germany, 2017. [Google Scholar] [CrossRef] [Green Version]
  15. Sarwar, A.; Afaf, G. A comparison between psychological and economic factors affecting individual investor’s decision-making behavior. Cogent Bus. Manag. 2016, 3. [Google Scholar] [CrossRef]
  16. Lim, K.L.; Soutar, G.N.; Lee, J.A. Factors affecting investment intentions: A consumer behaviour perspective. J. Financ. Serv. Mark. 2013, 18, 301–315. [Google Scholar] [CrossRef]
  17. Lee, J.M.; Lee, J.; Kim, K.T. Consumer Financial Well-Being: Knowledge Is Not Enough. J. Fam. Econ. Issues 2019, 41, 218–228. [Google Scholar] [CrossRef]
  18. Khalil, U.R.W.; Akhtar, H.; Shah, Y.Z.A. Framing effect and financial wellbeing: Role of Investment Behaviors as Mediator. Rev. Econ. Dev. Stud. 2019, 5, 343–352. [Google Scholar]
  19. Koekemoer, D.Z.; Ferreira, S. A conceptual model of financial well-being for South African investors a conceptual model of financial well-being for South African investors. Cogent Bus. Manag. 2019, 6. [Google Scholar] [CrossRef]
  20. Kamakia, M.G.; Mwangi, C.I.; Mwangi, M. Financial Literacy and Financial Wellbeing of Public Sector Employees: A Critical Literature Review. Eur. Sci. J. ESJ 2017, 13, 233–245. [Google Scholar] [CrossRef]
  21. Sadiq, M.N.; Ased, R.; Khan, A. Impact of Personality Traits on Investment Intention: The Mediating Role of Risk Behaviour and the Moderating Role of Financial Literacy Literature Review Personality Traits. J. Financ. Econ. Res. 2019, 4, 1–18. [Google Scholar] [CrossRef]
  22. Raut, R.K. Past behaviour, financial literacy and investment decision-making process of individual investors. Int. J. Emerg. Mark. 2020, 15, 1243–1263. [Google Scholar] [CrossRef]
  23. Niu, G.; Zhou, Y.; Gan, H. Financial literacy and retirement preparation in China. Pac. Basin Financ. J. 2020, 59. [Google Scholar] [CrossRef]
  24. Sabir, S.A.; Mohammad, H.B.; Shahar, H.B.K. The role of overconfidence and past investment experience in herding behaviour with a moderating effect of financial literacy: Evidence from Pakistan stock exchange. Asian Econ. Financ. Rev. 2019, 9, 480–490. [Google Scholar] [CrossRef]
  25. Qasim, M.; Hussain, R.Y.; Mehboob, I.; Arshad, M. Impact of herding behavior and overconfidence bias on investors’ decision-making in Pakistan. Accounting 2019, 5, 81–90. [Google Scholar] [CrossRef]
  26. Bakar, S.; Ng, A.; Yi, C. The Impact of Psychological Factors on Investors’ Decision Making in Malaysian Stock Market: A Case of Klang Valley and Pahang. Procedia Econ. Financ. 2016, 35, 319–328. [Google Scholar] [CrossRef] [Green Version]
  27. Sadaqat, S.H.S.; Xinping, X.; Khan, M.A.; Harjan, S.A. Investor and Manager Overconfidence Bias and Firm Value: Micro-level Evidence from the Pakistan Equity Market. Int. J. Econ. Financ. Issues 2018, 8, 190–199. [Google Scholar]
  28. Spyrou, S. Herding in financial markets: A review of the literature. Rev. Behav. Financ. 2013, 5, 175–194. [Google Scholar] [CrossRef]
  29. Akhtar, F.; Das, N. Predictors of investment intention in Indian stock markets: Extending the theory of planned behaviour. Int. J. Bank Mark. 2019, 37, 97–119. [Google Scholar] [CrossRef]
  30. Shanmugham, R.; Ramya, K. Impact of Social Factors on Individual Investors’ Trading Behaviour. Procedia Econ. Financ. 2012, 2, 237–246. [Google Scholar] [CrossRef] [Green Version]
  31. Wu, W.; Huang, V.; Chen, X.; Davison, R.M.; Hua, Z. Social value and online social shopping intention: The moderating role of experience. Inf. Technol. People 2018, 31, 688–711. [Google Scholar] [CrossRef]
  32. Kumar, S.; Goyal, N. Behavioural biases in investment decision making—A systematic literature review. Qual. Res. Financ. Mark. 2014, 7, 88–108. [Google Scholar] [CrossRef]
  33. Phan, K.C.; Zhou, J. Factors Influencing Individual Investor Behavior: An Empirical Study of the Vietnamese Stock Market. Am. J. Bus. Manag. 2014, 3, 77–94. [Google Scholar]
  34. Sivaramakrishnan, S.; Srivastava, M.A.R. Attitudinal factors, financial literacy, and stock market participation. Int. J. Bank Mark. 2017, 35. [Google Scholar] [CrossRef]
  35. Sashikala, V.; Chitramani, P. The Impact of Behavioural Factors on Investment Intention of Equity Investors. Asian J. Manag. 2018, 9, 183–189. [Google Scholar] [CrossRef]
  36. Sondari, M.C. Using Theory of Planned Behavior in Predicting Intention to Invest: Case of Indonesia. Int. Acad. Res. J. Bus. Technol. 2015, 1, 137–141. [Google Scholar]
  37. Vuk, K.; Pifar, A.; Aleksić, D. Should I, Would I, Could I: Trust and Risk Influences on Intention to Invest. Dyn. Relatsh. Manag. J. 2017, 6, 61–67. [Google Scholar] [CrossRef]
  38. Grable, J.E.; Joo, S.H. Environmental and biopsychosocial factors associated with financial risk tolerance. J. Financ. Couns. Plan. 2004, 15, 73–82. [Google Scholar]
  39. Pak, O.; Mahmood, M. Impact of personality on risk tolerance and investment decisions: A study on potential investors of Kazakhstan. Int. J. Commer. Manag. 2015, 25, 370–384. [Google Scholar] [CrossRef]
  40. Kukacka, J.; Barunik, J. Behavioural breaks in the heterogeneous agent model: The impact of herding, overconfidence, and market sentiment. Phys. A Stat. Mech. Appl. 2013, 392, 5920–5938. [Google Scholar] [CrossRef] [Green Version]
  41. Peng, D.X.; Lai, F. Using partial least squares in operations management research: A practical guideline and summary of past research. J. Oper. Manag. 2012, 30, 467–480. [Google Scholar] [CrossRef]
  42. Cain, M.K.; Zhang, Z.; Yuan, K.-H. Univariate and multivariate skewness and kurtosis for measuring nonnormality: Prevalence, influence, and estimation. Behav. Res. Methods 2017, 49, 1716–1735. [Google Scholar] [CrossRef] [PubMed]
  43. Carrion, C.G.; Cegarra-Navarro, J.G.; Cillo, V. Tips to use partial least squares structural equation modelling (PLS-SEM) in knowledge management. J. Knowl. Manag. 2019, 23, 67–89. [Google Scholar] [CrossRef]
  44. Hair, J.F., Jr.; Black, W.C.; Black Babin, B.J.; Andreson, R.E. Multivariate Data Analysis, 7th ed.; Pearson: Bloomington, MN, USA, 2014. [Google Scholar]
  45. Fornell, C.; Larcker, D.F. Evaluating Structural Equation Models with Unobservable Variables and Measurement Error. J. Mark. Res. This 1981, 18, 39–50. [Google Scholar] [CrossRef]
  46. Kock, N. Common method bias in PLS-SEM: A full collinearity assessment approach. Int. J. e-Collab. 2015, 11, 1–10. [Google Scholar] [CrossRef] [Green Version]
  47. Kumari, S.; Chandra, B.; Pattanayak, J.K.; Kumari, S.; Chandra, B.; Pattanayak, J.K. Personality traits and motivation of individual investors towards herding behaviour in Indian stock market. Kybernetes 2019. [Google Scholar] [CrossRef]
  48. Perkins, J.; Jones, K. Wanted: The Next Generation of Investors; Young Money Media, LLC: Orlando, FL, USA, 2007. [Google Scholar]
Figure 1. Research Framework.
Mathematics 09 00873 g001
Table 1. Demographic Characteristics.
n% n%
Gender Education
Female17851.0Secondary school certificate6919.8
Male17149.0Diploma/technical school certificate7421.2
Total349100.0Bachelor degree or equivalent18151.9
Master and/or Doctoral degree257.2
Age Group Total349100.0
18 to 3029684.8
31 to 403510.0Occupation
41 to 5092.6Employed14641.8
Above 5092.6Self-employed318.9
Total349100.0Student16447.0
Un-employed82.3
Ethnicity Total349100.0
Chinese32492.8
Indian144.0Annual Income (RM)
Malay113.2Below RM24,00020358.2
Total349100.0RM24,000 to RM48,00010128.9
RM48,001 to RM72,000308.6
RM72,001 to RM96,00082.3
Above RM96,00072.0
Total349100.0
Table 2. Reliability and Validity.
VariablesNo. ItemsMeanSDCADG rhoCRAVEVIF
RT53.3281.1210.8940.9050.9220.7033.717
FW53.5231.0140.8900.8910.9190.6944.750
FL43.2701.0680.8610.8630.9060.7064.778
OB53.1501.1000.9200.9210.9400.7583.817
HB53.4271.0800.9180.9190.9380.7533.572
SI53.4061.0960.9280.9280.9460.7774.038
INT44.4741.5880.9300.9300.9500.8251.000
SMP53.3441.1340.9160.9180.9370.748-
Note: RT: Risk Tolerance, FW: Financial Wellbeing; FL: Financial Literacy; OB: Overconfidence Bias; HB: Herding Behavior; SI: Social Interaction; INT: Investment Intention; SMP: Stock Market Participation; SD: Standard Deviation; CA: Cronbach’s Alpha; DG rho: Dillon-Goldstein’s rho; CR: Composite Reliability; AVE: Average Variance Extracted; VIF: Variance Inflation Factors. Source: Author’s data analysis.
Table 3. Discriminant Validity.
RTFWFLOBHBSIINTSMP
RT0.838
FW0.8060.833
FL0.7770.7840.841
OB0.7480.7160.8400.871
HB0.7480.8080.7630.7070.868
SI0.7720.8240.7690.7400.7820.881
INT0.7920.7750.7230.7250.7390.8110.909
SMP0.8250.8010.8000.8100.7550.8440.8790.865
Note: RT: Risk Tolerance, FW: Financial Wellbeing; FL: Financial Literacy; OB: Overconfidence Bias; HB: Herding Behavior; SI: Social Interaction; INT: Investment Intention; SMP: Stock Market Participation. Source: Author’s data analysis.
Table 4. Loadings and Cross-Loading.
CodeRTFWFLOBHBSIINTSMP
RT—Item 10.8310.6580.6050.6100.6040.6630.6690.683
RT—Item 20.8810.7360.6790.6700.6810.7280.7490.767
RT—Item 30.8690.6770.6210.5960.5900.6290.6990.689
RT—Item 40.8550.6970.6990.6210.6650.6500.6670.696
RT—Item 50.7500.6060.6750.6610.6010.5490.4990.611
FW—Item 10.6610.8070.6660.6060.6700.6950.6430.645
FW—Item 20.6640.8100.7110.6540.6760.6480.6180.687
FW—Item 30.6500.8450.5990.5440.6630.7130.6570.664
FW—Item 40.7170.8680.6650.6380.7000.7210.6960.702
FW—Item 50.6640.8330.6290.5380.6540.6520.6080.638
FL—Item 10.6420.5690.7980.7580.6000.6120.5850.655
FL—Item 20.6330.7090.8370.6590.6220.6830.6300.679
FL—Item 30.6740.6950.8780.7010.6550.6570.6330.703
FL—Item 40.6650.6580.8480.7100.6890.6310.5820.648
OB—Item 10.7180.7670.7150.6220.8750.7210.6790.701
OB—Item 20.6760.7450.6760.5840.8480.6910.6500.677
OB—Item 30.6250.6610.6350.6270.8700.6450.6120.629
OB—Item 40.6140.6610.6450.6350.8770.6750.6250.644
OB—Item 50.6040.6600.6330.5970.8670.6570.6360.621
HB—Item 10.6670.6360.7570.8830.6620.6610.6480.709
HB—Item 20.7030.6280.7420.8820.6400.6530.6400.714
HB—Item 30.6290.6440.7200.8560.5910.6630.6410.724
HB—Item 40.6270.6050.7560.8830.6080.6240.6290.685
HB—Item 50.6290.6030.6800.8500.5720.6210.5980.693
SI—Item 10.7220.7510.7360.6860.7210.8860.7060.761
SI—Item 20.6940.7460.6980.6630.7310.8930.7060.744
SI—Item 30.6680.7200.6680.6240.6780.8870.7110.749
SI—Item 40.6350.6680.6290.6570.6300.8600.7150.722
SI—Item 50.6820.7480.6590.6330.6890.8810.7340.741
INT—Item 10.7280.6960.6570.6980.6470.7540.9100.821
INT—Item 20.7140.6880.6890.6920.6860.7320.9060.813
INT—Item 30.7180.7200.6290.5820.6690.7370.9200.796
INT—Item 40.7180.7120.6530.6610.6860.7240.8980.763
SMP—Item 10.7090.6850.7440.7590.6560.7320.7520.883
SMP—Item 20.7940.7750.7090.6610.7230.7840.8260.898
SMP—Item 30.7030.7490.6520.6130.6620.7440.7750.865
SMP—Item 40.6460.6090.6530.7490.5820.6830.7270.829
SMP—Item 50.7070.6370.7030.7340.6380.7010.7160.849
Note: RT: Risk Tolerance, FW: Financial Wellbeing; FL: Financial Literacy; OB: Overconfidence Bias; HB: Herding Behavior; SI: Social Interaction; INT: Investment Intention; SMP: Stock Market Participation. The Italic values in the matrix above are the item loadings and others are cross-loadings. Source: Author’s data analysis.
Table 5. Path Coefficients.
Hypo BetaCI-MinCI-Maxtpr2f2Q2Decision
Factors Effecting Intention to Invest in Stock Market
H1RT → INT0.2960.1540.4663.1670.001 0.091 Accept
H2FW → INT0.110−0.0340.2571.2780.1010.010 Reject
H3FL → INT−0.062−0.1960.0740.7510.2270.7350.0030.603Reject
H4OB → INT0.092−0.0280.2201.1730.121 0.022 Reject
H5HB → INT0.1470.0160.2701.8820.030 0.009 Accept
H6SI → INT0.3600.1850.5113.7310.000 0.124 Accept
Factor Effecting the Stock Market Participation
H7INT → SMP0.8790.8480.90648.3900.0000.7223.4030.573Accept
Note: RT: Risk Tolerance, FW: Financial Wellbeing; FL: Financial Literacy; OB: Overconfidence Bias; HB: Herding Behavior; SI: Social Interaction; INT: Investment Intention; SMP: Stock Market Participation. Source: Author’s data analysis.
Table 6. Mediating Effects.
AssociationsBetaCI-MinCI-MaxtpDecision
RT → INT → SMP0.2600.1360.4073.1650.001Accept
FW → INT → SMP0.096−0.0310.2181.2960.098Reject
FL → INT → SMP−0.055−0.1710.0660.7510.226Reject
OB → INT → SMP0.1290.0140.2381.8730.031Accept
HB → INT → SMP0.081−0.0250.1921.1680.122Reject
SI → INT → SMP0.081−0.0250.1921.1680.122Reject
Note: RT: Risk Tolerance, FW: Financial Wellbeing; FL: Financial Literacy; OB: Overconfidence Bias; HB: Herding Behaviors; SI: Social Interaction; INT: Investment Intention; SMP: Stock Market Participation. Source: Author’s data analysis.
Table 7. Multi-group Analysis.
FemaleMaleDifference
Betap-ValueBetap-ValueBetap-ValueDecision
RT → INT0.1980.0940.3820.0000.1840.167No Difference
FW → INT0.1160.2290.0500.277−0.0660.364No Difference
FL → INT−0.0890.265−0.0820.2090.0060.491No Difference
OB → INT0.2300.0110.0740.248−0.1560.144No Difference
HB → INT0.2520.022−0.0050.474−0.2570.041Sig. Difference
SI → INT0.2230.0510.5330.0000.3100.032Sig. Difference
INT → SMP0.8450.0000.9120.0000.0660.023Sig. Difference
High School/DiplomaBachelor Degree and AboveDifference
Betap-ValueBetap-valueBetap-ValueDecision
RT → INT0.3940.0010.2390.0260.1540.194No Difference
FW → INT−0.0290.3940.1490.109−0.1780.134No Difference
FL → INT−0.1190.173−0.0310.388−0.0880.296No Difference
OB → INT0.0400.3400.2370.010−0.1980.082No Difference
HB → INT0.0970.1570.1000.173−0.0030.477No Difference
SI → INT0.5600.0000.2450.0320.3150.041Sig. Difference
INT → SMP0.9010.0000.8560.0000.0450.094No Difference
Note: RT: Risk Tolerance, FW: Financial Wellbeing; FL: Financial Literacy; OB: Overconfidence Bias; HB: Herding Behaviors; SI: Social Interaction; INT: Investment Intention; SMP: Stock Market Participation. Source: Author’s data analysis.
Publisher’s Note: MDPI stays neutral with regard to jurisdictional claims in published maps and institutional affiliations.

