
How Governance Paradigms and Other Drivers Affect Public Managers’ Use of Innovation Practices. A PLS-SEM Analysis and Model


Department of Business and Economics, Faculty of Business, Economics, and Tourism, University of Alcala (UAH), 28802 Alcalá de Henares, Spain
*
Author to whom correspondence should be addressed.
Mathematics 2021, 9(9), 1055; https://0-doi-org.brum.beds.ac.uk/10.3390/math9091055
Submission received: 18 March 2021
/
Revised: 3 May 2021
/
Accepted: 5 May 2021
/
Published: 7 May 2021
(This article belongs to the Special Issue Partial Least Squares Structural Equation Modeling (PLS-SEM) Applications in Economics and Finance)
Abstract
:Using the Unified Theory of Acceptance and Use of Technology for Innovations in the Public Sector (UTAUT-IPS) model, this study examined the influences on using a specific innovation practice on public managers. We based our analysis on an end-of-2019 sample of 227 Spanish public managers, aiming to answer the question “Are public innovation and project managers driven only by a governance paradigm, influencing their intention and usage of an innovation practice?” Using the Partial Least Squares Structural Equation Modelling (PLS-SEM) algorithm, we singled out the effects of the governance paradigm, performance expectancy, and motivation, among seven other behavioral composite variables. The PLS-Prediction-Oriented Segmentation routine was used to segment our sample into three distinct groups of innovation managers: (i) those driven by nearly all influences; (ii) those driven by results and the governance paradigm; and (iii) those driven by governance and habits. The three groups highlight the different practical approaches to public innovation and co-creation initiatives, which clearly reflect the complex process of deciding which tool (or tools) should be used to implement these. Our UTAUT-IPS model helps visualize this complex decision-making process.
Keywords:
public service logic; new public management; innovation; co-creation; co-production; PLS-SEM; Spain1. Introduction
Public decision makers increasingly see innovation as a source of organizational change, adaptation to uncertainty, and trust from the citizenry. In scenarios that favor the adoption of innovations in the public sector, Damanpour and Schneider [1] and others [2,3,4,5,6,7] presented the conditions for their usage, namely, “macro constructs” that facilitate (or inhibit) the use of innovations by organizations, e.g., their cost, complexity, or impact. These studies also encompassed the moderating effects of a public manager’s age, tenure, education, gender, pro-innovation attitude, and political orientation.
However, academics and practitioners continue to struggle with the translation of these conditions into the acceptance and adoption of innovation practices for the effective design and deployment of public innovation; that is, although the relevance of innovations for public decision makers may be understood, there is a lack of understanding about the factors that drive the selection of a particular practice—e.g., agile methods, participation or experimentation, tenders—used to implement these innovations in their organizations and environments.
Among the few, but prominent, voices attempting a theoretical answer to this question, the proponents of “service innovation studies” [8,9,10,11,12,13,14,15] propose that the selection of innovation practices is based on the governance paradigms dominating a certain public entity. Here, we adhere to Osborne’s neat definition of these governance paradigms, or regimes, as the “different modes of design and implementation of public policy and delivery of public services” [16]. Therefore, Traditional Public Administration (TPA), New Public Management (NPM), and New Public Governance (NPG) or Public Service Logic (PSL) are then presented as “policy and implementation regimes” [16].
Associated with these paradigms, some authors ([17,18,19] and the CoVAL project) have theoretically connected linear innovation practices and models with the TPA and NPM paradigms, and connected interactive, circular, or networked practices with NPG or PSL. They even recognize that networked practices create distinctive public policy and services, integrating “multilevel, cross-border settings, in which former demarcations of policy fields become blurred.” [17]. In short, they perceive the significant impact of the governance paradigms on the selection of an innovation practice and the type of policy or services developed by a public entity.
However, with the exception of these governance paradigms, we were unable to find any other references to predictors of the use of innovation practices in the public sector, although we did find such studies applied to the IS sector and others [20,21,22]. These predictors of the use of technologies and practices are important because the design, deployment, and success of any public innovation are intimately related to the practice(s) used to deploy them. Furthermore, our earlier research and experience indicated that multiple drivers of the acceptance and use of a practice exist: predictors, decision-maker characteristics, and other “macro” contextual drivers, such as the “macro-constructs” of Damanpour and Schneider.
In this context, we ask if governance paradigms—i.e., TPA, NPM, and NPG or PSL—are the only determinants of the use of innovation practices in public administration. Equally importantly, which are the observable and meaningful characteristics of the governance paradigms and other criteria—i.e., Habit, Performance Expectancy, Effort Expectancy, Cost, Social Influence, Hedonic Motivation, and Facilitating Conditions—that influence the use of public innovation practices? Finally, are gender, age, tenure, or experience relevant moderators of the acceptance and use of innovation tools by public innovators?
Our first expected contribution is an exploration of the measurements of the criteria using Partial Least Squares Structural Equation Modelling (PLS-SEM). In line with research on public governance structures [17,23,24], the value of our present work lies in the identification of the scales—from 114 indicators—and measurement modes of each of our model’s 10 composite drivers.
In addition, we investigated the inner connections of the criteria using a structural PLS-SEM model. This model visualizes how public managers decide to adopt an NPM-, NPG- or other paradigm-related practice to achieve public innovation goals. We constructed the Unified Theory of Acceptance and Use of Technology for Innovations in the Public Sector (UTAUT-IPS) model to visualize how its criteria work and which dynamics (i.e., indirect effects) exist. Finally, this model helps understand how different groups of managers (e.g., women, men, older, younger) behave toward innovation tools.
We describe each of the composite drivers in the next section, drawing on the references that helped us develop a sound set of observable elements of the behavior of public innovators and decision makers. This previous analysis allowed us to build the scales and composites of the UTAUT-IPS model, and set out our research hypotheses. The third section describes our method, and we present our results in the fourth section. Our discussion and conclusions come in the fifth and sixth sections, respectively.
2. Theoretical Framework and Hypotheses
Due to the innovation gap, which refers to the researchers’ marginalization of non-technological innovations—including social and public-sector innovations—Gallouj and Weinstein [25], Windrum and Koch [26], Djellal et al. [10], Osborne and Brown [27], Desmarchelier et al. [28], and others, have integrated public services innovation into wider “innovation studies” and, specifically, into “service innovation studies.” They note the trend towards the advancement, adaptation, and re-definition of public services. This approach complements other innovation initiatives that reach most levels of public entities: improvements (visible and invisible) in organizations and systems, changes in modes of formation of these improvements (e.g., spontaneous vs. planned), and disruptions in form and content (e.g., bottom-up vs. top-down) [17,26,29].
Beyond the description of these innovations and the drivers of their adoption [1], we know little about what inspires or influences public decision makers and managers to accept and use a specific practice to design and implement innovations. The current practices in developing public innovations include agile development, design thinking, world-cafe meetings, social hackathons, living lab workshops, and conventional tenders and bids. Here, we gather governance and other social and environmental research to identify the drivers or criteria of the acceptance and use of a practice.
2.1. Understanding the Drivers of the Use of Public Innovation Practices
Based on the above premises, the selection and analysis of the observable elements that affect the acceptance of public innovation practices are particularly relevant, and have multilevel effects and multiple origins. To the best of our knowledge, this is a novel line of research, contributing to “services innovation studies” the observable elements, grouped into (latent) drivers or criteria, of the innovators’ decision to use a technology, tool, or practice to innovate in a public service.
A useful option in which to frame these elements (items) and drivers is the Unified Theory of Acceptance and Use of Technology (UTAUT [21]). This is a summary model that outperforms each of its underpinning eight psychological and sociological theories that describe the adoption of a technology. With the UTAUT model, Venkatesh et al. successfully separated the intention to use a tool from actual behavior (the usage of the tool), and corroborated the role of the intention as a predictor of usage, in the context of information systems [30,31,32].
Using the UTAUT model, we believe we can select and analyze the individual traits, and social and environmental elements, that comprise the drivers of the acceptance and use of a certain technology or practice in the context of public innovation. As in the case of Venkatesh et al., we also believe that intention acts as the predictor of usage of a technology in our context—we define a technology in the public innovation context as a summary of visible and invisible transformations, protocols, designs, and implementation tools, adhering to the original UTAUT definition.
The UTAUT model identifies the elements or items of “four key constructs (Performance Expectancy, Effort Expectancy, Social Influence, and Facilitating Conditions) that influence behavioral intention to use a technology and/or technology use” [33] (p. 159). UTAUT2, a later development [33], adapted the original indicators to technology consumers, and added three new constructs—Hedonic Motivation, Costs/price, and Habit [33] (p. 160).
To extend the UTAUT model, Venkatesh et al. demanded “careful theoretical consideration to the context being studied,” to advance and complement existing practice with new constructs (drivers) or elements, the “scope and generalizability of UTAUT” [33] (p. 160). Following this instruction, and following other previous studies [34,35,36], we extended the original scope of the UTAUT model, which was restricted to IS and IT technologies, to a broader spectrum of technologies, including tools and practices commonly used in public innovation projects. (Although “technology” is, in lay terms, often regarded as software applications or hardware, it also includes practices, methods, skills, or knowledge used to accomplish any objective.)
Consequently, we concentrated on applying the UTAUT drivers to our public innovation context and developed our UTAUT for Innovation in the Public Sector (UTAUT-IPS) model. Prior to describing this model, however, we examine why “the governance paradigm” must complement the original UTAUT drivers to allow analysis of the behavior of public innovators.
2.2. Why Should the “Governance Paradigm” Variable Be Added as a New Driver of the UTAUT for Public Innovation Model?
Whether hierarchical (Traditional Public Administration—TPA), market (New Public Management—NPM) or network (New Public Governance—NPG, or Public Service Logic—PSL), governance paradigms (GPs) reflect different approaches to the nature and mode of production of public services [37,38,39,40]. They are also theoretically connected to different practices (Table 1). Conceptually, the GPs, or policy and implementation regimes, represent the “different modes of design and implementation of public policy and delivery of public services” [16]. Although they are associated with different historical moments of the public sector, we currently find hybrid forms of governance [17,41] that complement each other, including one GP within another, at the larger scale of a public organization.
Our research cases confirmed this coexistence at a broader scale (e.g., a municipality or region might be top-down governed across its areas, and they may have occasional social hackathons and volunteer groups in living labs, enacting bottom-up government initiatives, such as in the cases of Madrid or Valencia (Spain), or the EU Commission). Due to the potential risk associated with innovations abiding by any of the GPs of a public organization, the behavioral influence of the GPs is stochastic or, potentially, chaotic.
To simplify this apparent randomness, we decided to investigate how public administrations innovate services, organizations, or processes. Desmarchelier et al. [28] conceptually discussed the three stated paradigms of public administration and their influence on the use of innovation tools and practices in innovation projects: a concession or the conventional tender process, for example, might be associated with TPA; an adapted bidding process, following goods-dominant and market-dominant logic [43], is associated with NPM; and more interactive alternatives, such as a citizens jury for a city or the collaborative development of a library, which involve an integrative perspective and a service-dominant logic, are clearly closer to NPG or PSL [44].
We found that only one type of GP is dominant at the project level. If a top-down practice—e.g., tender, concession—is used as the innovation tool in an innovation project, then a top-down, traditional TPA paradigm is in effect. If a bottom-up practice—e.g., citizens’ jury or a co-designed square in the middle of a town—is selected, it results from the bottom-up (NPG or PSL) governance approach of the project manager. At this project level, the other paradigms are apparently excluded, at least when managers choose the innovation practice used to start their project. We can conclude that the paradigm governing each specific innovation project is a clear driver of the public decision maker’s behavior. Consequently, in this research, we situated our analysis at the project level, investigating the meaningful influence of the GP in the use of practices, and theorize as follows:
Hypothesis 1a (H1a).
At a given moment, the GP in effect in a public innovation project will influence the use (US) of its innovation practice (we explain US in the following section).
To describe the indicators of GP, we followed Desmarchelier et al. [28], who identified a collection of intrinsic indicators, or predictors, of the type of GP in effect in a given service or project: the coordination mode, the nature of the product, the mode of production organization, and the mode of performance evaluation. Each predictor refines and translates the influence of the citizenry and other stakeholders on the decision makers. Then, the GP driver indicators must capture the intrinsic predictors (refer to the Appendix A for the complete list of our GP indicators).
In innovation scenarios that involve absence or scarcity of references, isolation of teams, or multiple paths or requirements derived from networking with citizens, public managers often combine the different modes of governance—e.g., TPA, NPM, or PSL [1,19,45]. As experience increases with any of these, the managers become used to the written and unwritten norms and rules of each governance paradigm, and tend to limit their choices to earlier successes. Age works similarly because older individuals might experience difficultly in applying tools or practices associated with a different form of governance. Gender might also play a role because inclusion, equity, or collaboration with minorities are linked to NPG or PSL. Thus, we hypothesize:
Hypothesis 1b (H1b).
Gender, age, and experience will moderate the relationship of the GP and the intention to use a tool or practice (BI) (we explain BI in the following section), and the effect will be stronger for older men with high levels of experience with a tool or practice.
2.3. Other Behavioral Drivers Complementing the Governance Paradigms in the UTAUT-IPS Model
Here, we review the original drivers and indicators of UTAUT, reworking them and their original relationships in the public innovation context.
2.3.1. Usage (US) and Behavioral Intention (BI)
Usage (US) is the key dependent variable of our research; Behavioral Intention (BI) is its main predictor. Following the original tenets of the UTAUT model, we explain the relationship between an individual’s intention (acceptance) to use a practice, tool, or technology and their final behavior (usage [21] p. 427); that is, how a public innovator’s intention to use a particular practice to develop a new service drives their actual use of that practice.
The relevance of the BI–US pair stems from the different approaches (e.g., [20,21,43,46]) to proactively designing interventions, which mainly consist of training programs, but also to disseminating the different modes of governance within a public organization. According to UTAUT, solely acting on the acceptance of an individual leads to their use of a certain practice. In the absence of this acceptance, as a composite predictor of the behavior (i.e., the use of new practices), the intervention over the individual must control for the compounding (or contradicting) effects of several other predictors on the behavior. Thus, we theorize:
Hypothesis 2 (H2).
The acceptance (BI) of a public innovation practice has a positive relationship with the use (US) of this practice.
To select the practices (refer to the Appendix A for our list of innovation practices and tools) in use by public innovation project managers and decision makers, we used three dimensions. The linearity dimension [28,47,48] distinguishes linear and non-linear innovation practices and their related dynamics (see Table 2). The monitoring dimension differentiates the handling of missed expectations due to fallbacks, failures, or tests [49,50,51,52]. Finally, the collaborative dimension discriminates between stage-gate practices [53] and bottom-up practices [17,18,20] (Table 2).
2.3.2. Costs (CO)
Following the concerns expressed by Venkatesh et al. [33] (p. 161), innovators bear the responsibility of the costs (budget) and economic burden of their innovation projects. They usually begin projects by seeking funding [61,62], knowing that they are primarily accountable for costs (CO). This accountability for costs then impacts on the search for funds throughout the development stages of the new service. This is a constant that affects the intention and behavior of public managers and innovators.
In UTAUT, men’s sensitivity to costs and prices differs from those of women, and sensitivity also differs between younger and older individuals. This may also be applicable when deciding to use a new practice to innovate a public service because sensitivity to value differs by gender and age among managers. Thus, we theorize:
Hypothesis 3 (H3).
Gender and age will moderate the relationship of CO and BI, and the effect will be stronger among women, particularly older women.
2.3.3. Effort Expectancy (EE)
“Effort expectancy is defined as the degree of ease associated with the use of the system” [21] (p. 450). In our context, service innovation practices help clarify a complex and often ambiguous design-implementation gap [63] and a linear or multilinear innovation process. The EE construct captures the feeling and experience of seasoned innovators regarding practices for service design and implementation.
Of note, however, EE in the original UTAUT was significant only during training and post-training, and became insignificant with use. In the early phases, gender, age, and experience (i.e., the lack of it) played a role in the relationship between effort demanded by, and the use of, a practice. Thus, in our public context, we hypothesize:
Hypothesis 4 (H4).
Gender, age, and experience will moderate the relationship of EE and BI, and the effect will be stronger for women, particularly younger women, and in their early stages of experience with a tool or technology.
2.3.4. Facilitating Conditions (FC)
“Facilitating conditions are defined as the degree to which an individual believes that an organizational and technical infrastructure exists to support use of the system” [21] (p. 453). FCs thus help deal with the factors that, externally and internally, foster or hinder the development and implementation of public innovations and, consequently, the use of innovation practices.
We found the morphological analysis of Desmarchelier et al. [28] appropriate in establishing a comprehensive framework to analyze the support available to an innovator or innovation project. First, from their topographical variables, the actors involved and their interactions produce part of the support, or lack thereof. Regardless of it being recognized, any public innovation practice involves multiple stakeholders. These are different in nature—public, private, individuals, collectives—and intervene in different ways—directly, indirectly, or neither—but are emotionally, ideologically, or otherwise connected to it. In addition, they occupy different places, depending on the quantity and quality of the interactions with others, and their influence may be temporary or permanent. Thus, the different stakeholders produce an evolution and dynamism, and interactions ranging from ignoring others to cooperation, collaboration, and even close partnerships.
Second, functional variables identify the sector or field in which the innovation occurs. In addition, the type of innovation—policy, service, managerial system, organizational mode—translates into different degrees of support for innovation projects. Based on this, managers might find a supportive culture and systems, a collaborative reputation, or help when facing difficulties.
Our UTAUT-IPS includes these topographical and functional variables, and measures their effects in the design and execution phases, for technological and nontechnological innovations. Age and experience moderate the effects of FC: older and seasoned project managers are able to navigate bureaucratic and departmental cultures, and find support for their projects, more easily than younger and newer managers. Thus, we hypothesize:
Hypothesis 5 (H5).
Age and experience will moderate the relationship of FC and US, and the effect will be stronger for older managers, particularly with increasing experience in the use of a tool or practice.
2.3.5. Habit (HT)
“Habit is viewed as prior behavior; and second, habit is measured as the extent to which an individual believes the behavior to be automatic” [33] (p. 161). Prior experiences are a predictor of HT because they form beliefs and influence behavior. In our context, HT is also a perceptual construct that is intrinsic to the individual [64].
Regarding HT, our context differs significantly from that of the original UTAUT user or consumer contexts. In our case, and given the complexity of any of the tools, practices, and processes of public innovation, we agree with Venkatesh et al. [33] that, whether automatic behavior or instant intention [65], the selection of a practice requires a “stable environment.” In the public innovation context, this stability may come from two sources: first, innovation in public organizations is the result of a sometimes long, reflective, and compliant process that demands stability. Second, the cue processing and association—i.e., the habit—that affects the public innovator is highly dependent on the innovator’s perception of change. In environments that are perceived as being stable, HT will have a large amount of behavioral control; in situations perceived as changing, sensitivity to the changes will affect HT [66].
Additionally, experience affects the sensitivity of HT in its relationship with BI and US, because more experienced users will weaken their sensitivity, increasing the control of HT over BI and US. Similarly, age increases the control of HT. Furthermore, women are more conscious and detailed about new cues or changes, lowering the strength of HT on BI and US. Thus, we hypothesize:
Hypothesis 6a (H6a).
Gender, age, and experience will moderate the relationship of HT and BI, and the effect will be stronger for older men with high levels of experience with a tool or practice.
Hypothesis 6b (H6b).
Gender, age, and experience will moderate the relationship of HT and US, and the effect will be stronger for older men with high levels of experience with a tool or practice.
2.3.6. Hedonic Motivation (HM)
“Hedonic motivation is defined as the fun or pleasure derived from using a technology” [32] (p. 161). This construct relates to the “perceived enjoyment” and inspiration of the innovator, using a practice or technology to develop a new service [67]. Like HT, HM is an intrinsic construct, adding items from motivation theory: it is fun to use a tool, or its use brings recognition, or the public servant fulfills their vocation. Furthermore, HM is also influenced by experience, age, and gender, and we theorize that they control the relationship HM→BI:
Hypothesis 7 (H7).
Gender, age, and experience will moderate the relationship of HM and BI, and the effect will be stronger among younger men in the early stages of experience with a tool or practice.
2.3.7. Performance Expectancy (PE)
“Performance expectancy is defined as the degree to which an individual believes that using the system will help him or her to attain gains in job performance.” [33] (p. 447)
Examination of the step that follows the achievement of success, or the failure to achieve the expected results, is an underexplored field in innovation studies. These drive intention and behavior, but we have not seen examples of the manner in which any of the types of practices steer the governance process, or set controls, to reassert the process once it succeeds (or fails) [68]. Apparently, conventional models of governance (TPA and NPM) are not prone to recognizing failures. The response of these models to a failure is to return, if possible, to the previous state (status quo ante), or the end of the project. The NPG approach appears to more adaptive to failures, most probably due to its open, networked, iterative approach. It seeks public value through collaborative processes [69], and is prone to failure or unexpected results. Nonetheless, as White [70] noted, with unclear, even absent, measures of success or failure, public innovation practices will be “commended” to the voters to decide on their adequacy.
Moreover, gender and age moderate the relationship of PE and BI (e.g., [71,72]). Thus, we hypothesize:
Hypothesis 8 (H8).
Gender and age will moderate the relationship of PE and BI, such that the effect will be stronger for men and particularly for younger men.
2.3.8. Social Influence (SI)
“Social influence is defined as the degree to which an individual perceives that important others believe he or she should use the new system.” [33] (p. 451) Then, the one-self [73] is relevant when speaking of decision making to innovate public services. Individual intrapreneurs, public innovators [74,75,76], or citizens identify and then act upon the need for an innovation.
The instigators or paladins of innovation in public entities are isolated individuals, who seek agreement and strength through critical masses and collectivities [77]. They clearly share some characteristics with corporate innovators [78,79]: knowledge of their organizations, and strong motivation based on beliefs, challenges, or explicit mandates. They also have power and set the expectations for the new service, in addition to influencing the value proposals, groups to develop the service, networks, and the mind-sets and cognitive mechanisms behind the new service [74]. (Innovation in the public sector is a radically different strategy than its cousin in the private sector (see [22]). In the private sector, innovation usually follows an illusion, sometimes called vision, which is generally vaguely defined and unquantifiable. In the public sector, the new services appear to address an identifiable need or demand, whether current or future.)
Then, the innovators’ individual traits must correlate with the dynamics and changes that are so typical of innovation processes. Therefore, they support the argument in favor of researching the use of public innovation tools as an individual’s triggered effort [74,80] (p. 1329).
In addition to public innovators, many examples exist (library of San Fermin, Artropoloops, or the experiments in Experimenta Distrito) of individual citizens triggering collective demands for new or updated public services. Private citizens regroup into virtual networks, temporary gatherings, or conventional families or associations, and have significant mobilization power and a strong voice [75,76,80]. They not only create demands that translate into mandates for conventional TPA or NPM designs; NPG, PSL, or open government practices empower them [16,29,73], and provide means to co-design and co-create policy (e.g., the Observatory of Madrid, or Madrid en Verde). Our UTAUT-IPS framework also integrates the influences of individual citizens, reflecting their social impact.
This SI construct reflects, more intensely than the remaining variables, the dynamism and time limitations of public innovation. It captures the top-down or bottom-up styles of the managers’ influencers, who would be different in voluntary and mandatory situations. In addition, gender, age, and experience may also play a role [32]. Thus, we hypothesize:
Hypothesis 9 (H9).
Gender, age, experience, and voluntariness will moderate the relationship of SI and BI, and the effect will be stronger for women, particularly older women, in mandatory settings, in their early stages of experience with a practice.
Figure 1 presents our research model, and highlights our hypotheses.
3. Methodology
3.1. Survey
To select our participants, we screened social network sites where public managers presented their professional profiles and activities. We examined the public profiles of a random population of more than 4500 managers in an attempt to identify for each their responsibility for leading innovation projects in their public units. Based on this extensive analysis, we selected Spanish directors, deputy directors, managers, heads, or chiefs of innovation or projects, with 4+ years’ experience in leading public projects. They had improved (rationalized), changed, complemented, or created public services, whether internal or external to their governments, public agencies, and government-owned corporations. We finally sent an anonymous survey to 1034 public officials who matched our requirements between August and December 2019.
The selection of Spain as the region for our study was motivated by the continuation of the research that we led for the CoVAL project. Based on this experience, the practices of public administrations and managers in Spain are relatively homogeneous with those of other European Union administrations [81,82,83,84]. Thus, we decided to choose these common practices and study them and their antecedents here.
3.2. Measurement
Because this is one of the first studies in the decisions field to examine the practice of innovating in public services, we decided to use partial least squares structural equations modelling (PLS-SEM [85]) due to its “ability to [create] independent latent variables directly on the basis of cross-products involving the response variable(s)” [79]. Hinseler et al. [85] recommended PLS path modeling “in an early stage of theoretical development in order to test and validate exploratory models.”
As shown in Figure 2, after setting up our hypotheses and concept model, and validating it with our case studies, we designed our questionnaire. The first version was distributed in July 2019 to test the on-line tool, introductory text, and categorical scales. The prototype also helped us rework the layout and final wording of the questionnaire, limit the time spent in each section, and adjust the expected response rate. From August to December 2019, we administered the final on-line survey (Limesurvey, V. 2.73.1), aiming for a minimum sample size of 84 cases, as estimated using G*Power [86]. (F2: 0.015; alpha: 0.5; Power: 0.8; # of predictors (maximum of any latent variable): 16. G*Power, version 3.1.9.4, t-tests: linear multiple regression.)
To measure our constructs, following the systematic application of the nonparametric criteria of PLS-SEM [85] (p. 96), we first needed to assess our measurement indicators. Then, using the factor weighting scheme in the PLS algorithm and bootstrapping [90] included in Smart-PLS 3 software [91], we calculated the structural components and relationships of our theoretical UTAUT-IPS framework.
Our behavioral manifest items helped respondents self-report on personality traits, perceptions, and behaviors. This might lead to common method bias (CMV), which could affect the validity of our conclusions. To control for CMV, we followed the recommendations of Tehseen et al. for mixed controls [92] (p. 146). We used a Measured Latent Marker Variable (social desirability) and different formats of response (e.g., randomly presenting the items for each construct). Our questions were laid out in a general positive style, interchanged with a negative style for some items and constructs (e.g., FC7 or CO). We protected the anonymity of participants. We then used the Construct Level Correction (CLC) approach, [92] (p. 158) and Levene’s test of variances [89] to assess CMV and ensure its absence in our model.
4. Results
We sufficiently met the required minimum sample size (84 at 0.8 power) with our sample of 227 cases. The sample had a similar number of cases at employee level—employee responsible for innovating processes or services, 31%; manager in support of teams creating innovative services in their agency, 31%; and senior manager, general manager of their agency, 38% (Table 3). Most interviewees were males (68%), aged between 30 and 65 (99%), with an education level of master’s or higher degree (65%). Our interviewees were distributed among federal agencies (23%), regional entities (37%), and municipalities (40%) (refer to the Appendix A for an extended presentation of the sample participants).
Next, following the guidelines of Sarsted et al. [88] (Figure 2), we present our measurement model assessment.
4.1. Measurement Model Assessment
The relevant latent construct loadings and weights of our study were 68 measurement indicators (refer to the Appendix A for the complete list) grouped into six reflective (Mode A) constructs (42) and four formative (Mode B) constructs (26).
4.1.1. Reflective (Mode A) Constructs
After assessing Jöreskog’s composite reliability levels, several of our items were dropped due to low loadings, until each composite reached “satisfactory to good” marks (0.70–0.95 [93] p. 112). Cronbach’s alpha values and rho-A scores of each composite were also within the same thresholds. The composites’ convergent validity, measured using the Average Variance Extracted (AVE) values, showed that all constructs explained more than 50% (0.50) of the variance of their respective items. As recommended for PLS-SEM models [93], we assessed the discriminant validity of our reflective constructs, and all of them exhibited discriminant validity with HTMT scores lower than 0.8 (Table 4).
4.1.2. Formative (Mode B) Constructs
To assess the formative mode constructs of the UTAUT-IPS model, we followed the suggested assessment procedure of Hair et al. [93] (Exhibit 5.1). We checked the formative items for collinearity by examining their VIF values, and confirmed that all of them were below the threshold value of 5. Next, we analyzed the outer indicators’ weights for significance and relevance using the rules of thumb of Hair et al. [93] (Exhibit 5.7). We retained all significant weights, and only retained nonsignificant weights with significant or relatively high (≥0.5) loadings (Table 5) (refer to the complete lists of indicators in the Appendix A).
4.2. Structural Model Assessment
Following Garson [87] and Hair et al. [89] (Exhibit 6.1), the second step to appropriately build the UTAUT-IPS model was the analysis of the inner relationships between its constructs, and to identify the model’s capability to predict the endogenous US. We confirmed that, with the data in our sample, there were no collinearity issues in our constructs (Table 6).
Thus, our analysis concludes that only six path coefficients were significant and relevant, three connected with BI (see Figure 3) and three with US. The exogenous constructs GP, HT, and SI were significantly connected with BI; and GP, HM, and PE significantly connected with US. The inner or structural model showed weak coefficients of determination: 0.36 (weak [88]) for BI and 0.31 for usage (weak [88]). In addition, the model showed predicted relevance, although its effect size was small.
The paths of the UTAUT-IPS pooled model presented small (e.g., CO → BI, GP → BI, HM → US, PE → US) and moderate (e.g., GP → US, HT → BI) f-square effect measures [45], [94]. Although some indirect effects added strength to the GP → US and PE → US paths and some of the other relationships, none of these were significant at this stage of our analysis.
From our set of hypotheses, our sample confirmed H1a, with significant and positive effects of GP over BI and US. We were unable to confirm the relationship (H2) between BI and US, which prevents the mediation effect of BI over US.
Other unpredicted relationships were found to be significant using our model. (GP → US) was the strongest connection of UTAUT-IPS. PE → US shows the significant effect of the performance expectations on the use of innovation tools in our context, and HM → US meaningfully connects the motivation of public servants with the use of innovation tools.
4.3. Analysis by Observed Groups
The next step in our analysis was the assessment of the groups we selected using our descriptive variables (age, gender, experience, and voluntariness). We first established the measurement invariance, supported by configurational and compositional invariances. We applied the MICOM procedure [95,96] to all of the variables we controlled for—i.e., age, gender, experience, voluntariness, organizational level, geographical reach, success of last project, type of collaboration, education, and type of project objectives. Then, we applied a Multigroup Analysis (MGA [88,97]), and found that only geographical reach produced any significant differences, as confirmed by a permutation analysis [96,98]: regional representatives showed a stronger, and more positive and relevant, GP → US path than municipal interviewees.
We were unable to confirm our hypotheses—H1b (GP → BI), H3 (CO → BI), H4 (EE → BI), H5 (FC → US), H6a (HT → BI), H6b (HT → US), H7 (HM → BI), H8 (PE → BI), and H9 (SI → BI)—due to very low and, in most cases, unmeaningful path coefficients. For all of the relationships, the effect of age, gender, experience, or voluntariness—or any other moderating variable—resulted in unmeaningful differences between observable groups.
4.4. Analysis by Unobserved Groups
Complementing our observed heterogeneity analyses, we performed extensive analyses using the PLS Prediction-Oriented Segmentation (POS) routine to discover unexpected and unobserved heterogeneity in our data [37,86,93]. Our election of POS for the unobserved heterogeneity analysis was derived from our mixed formative–reflective measurement model. This is also a routine with improved explanatory power as a nonparametric method to assess nonnormal distributions. Using POS, we found three unobserved groups, which bettered our analysis, reaching substantial coefficients of determination (between 0.68 and 0.85) and predictive relevance (between 0.045 and 0.19).
4.4.1. Group #1
PLS-POS Group #1 shows stronger positive Effort Expectancy, Facilitating Conditions, Government Paradigm, Hedonic Motivation, and Social Influence paths, and strong negative Cost, Habit, Performance Expectancy paths—EE is the strongest construct (Table 7). The negative paths might be the main difference with the other groups: CO, HT, and PE inversely relate to Behavioral Intention or Usage. BI shows an insignificant relationship with US, but strengthens the paths of CO, EE, and FC, and weakens the connection of PE with US (Table 8).
In Group #1, the specific predictors of BI and US (Table 7) show an extended version of the pooled sample case, which was limited to six significative paths, highlighting the complexity of the decision process and the diverse influences on the selection process of a practice to develop innovation in the public context.
4.4.2. Group #2
This group shows Government Paradigm, Hedonic Motivation, and Social Influence as the stronger constructs, of which GP is the strongest (Table 9). Due to the relevance of the GP construct, this group stands out. Performance Expectancy shows a negative, significative path that also qualifies the group. Behavioral Intention is unmeaningfully connected with Usage, and its mediating effects are weak on HM and PE (Table 10).
In Group #2, as in the case of Group #1, the predictors of BI and US (Table 9) extend the pooled sample case list. In this group, the number of constructs is significantly lower than in Group #1, but their power to explain the behavior of its managers, measured by the coefficient of determination, is stronger.
4.4.3. Group #3
Government Paradigm and Habit are the stronger, significant constructs (Table 11) in Group #3, of which HT is the strongest construct. In this group, the negative significant loadings characterize the relationship of Cost and Effort Expectancy with Behavioral Intention. BI, as in the case of the other groups, shows an unmeaningful relationship with Usage, and only slightly mediates the relationships of GP and HT (Table 12).
Group #3 predictors are different from the those of the other two groups. BI is meaningfully predicted by six predictors, some of which are negatively loaded (CO, EE), but only two constructs predict US (Table 11). Our model is evidently less powerful with this group; nonetheless, its coefficient of determination has moderate strength.
5. Discussion
In this research we used Partial Least Squares Structural Equation Modelling (PLS-SEM) [88,93,97] to identify that governance paradigms (GP) are only one, albeit highly relevant, of the determinants of the use of innovation practices in a public administration. Using this method, we constructed the Unified Theory of Acceptance and Use of Technology for Innovations in the Public Sector (UTAUT-IPS) model. This complements the GP with performance expectancy (PE) and hedonic motivation (HM).
We investigated GP as a descriptor of the policy and implementation regimes [16] or modes of production of public services [37]. Furthermore, we confirmed its importance in the use of an innovation practice (H1a) due to their strong relationship. Additionally, we featured the indicators of GP (GP1, GP4, GP7) from the theorized group of nine indicators [27,37] (refer to the complete list in the Appendix A). These reflect the involvement of users/citizens and other agents (consultants, technical staff, etc.) in the (co-)creation of public innovation.
Thus, we corroborated the few theoretical references of the influence of GP on the usage of innovation practices (e.g., [17,37,99]) in public organizations in Spain, where the traditional public administration (TPA) and new public management (NPM) paradigms dominate [100]. However, our sample innovation managers confirmed that, at the project level, their preferred implementation regime or mode of production of innovations deeply involves the citizenry—i.e., the new public governance/public service logic (NPG/PSL) regimes). From a practical perspective, innovation managers are then willing to involve citizens in the innovation of services, and the intention to involve citizenry drives the innovation practice selection.
The implementation regime that inspires managers, as identified by our empirical definition of GP, partially drives the practices and tools they use. Top-down (agile, design thinking) and bottom-up (collaboration) practices form their mixed preferences. This is a mixed toolbox, and although bottom-up practices are the most prominent, these combine with top-down practices.
Our results then expanded the theoretical prediction of Desmarchelier et al. [28]. They linked collaborative tools with the NPG/PSL paradigm. Our results blurred this connection. We demonstrated that the mixed-practices toolbox is available and used, and also dependent on other significant drivers. Practically speaking, managers appear to avoid the use of conventional tools (e.g., public–private partnerships, surveys and polls, or conventional metrics) when designing their innovation projects. They opt for a toolset combining collaborative (world cafe, open space, wise action, etc.) and novel top-down innovation tools (e.g., design-thinking, agile methodologies, or safaris).
The broader theoretical implications of the lack of a meaningful connection between Behavioral Intention (BI) and Usage (US) require further investigation. A larger sample of managers might help in an investigation into the lack of an effect of managers’ age, experience, gender, and other moderators.
Nonetheless, from a methodological perspective, we can highlight three relevant implications of the effect of BI in our model. The original UTAUT model [21,33] predicts BI as a mediating variable. The dynamism between the exogenous variables and the endogenous US is reflected in the direct effects complemented with significant indirect effects. In our UTAUT-IPS model, this dynamism is clearly less evident, because no mediation effects are observable for the pooled sample. For the POS groups, in Group #1, we find BI partially mediating CO → US, EE → US, and FC → US, and fully mediating PE → US. In Group #3, BI partially mediates GP → US.
Furthermore, from a modelling perspective, these BI indirect effects might evidence the actual link between BI and US predicted by Venkatesh et al. [20,21]. BI already shows strong reliability and validity.
From the practice perspective, BI highlights four significant behavioral predictors of intention: the will of managers to continue to use a practice in subsequent projects; their scheduling of activities following the requirements of the practice; their securing of resources to use the practice in the future; and their preference for one practice over others. These predictors clearly highlight the strategies of managers when planning innovation projects.
Strengthening our UTAUT-IPS model, exogenous constructs other than BI and GP show meaningful effects on the endogenous US. These raise the model’s predictive power of the behavior of three different types of innovation managers: more experienced or senior managers (Group #1), those pursuing their careers (Group #2), and novel or low-ranked managers (Group #3). In the following, we describe the influences of Costs (CO), Effort Expectancy (EE), Facilitating Conditions (FC), and Habit (HT) on managers:
- Group #1 managers are motivated by CO, EE, HT, FC, GP, and HM. Consequently, a manager in Group #1 opts for practices that are easier to use and have more resources and help. The practices should allow more collaboration with the citizenry and other stakeholders, and, to a lesser extent, allow motivational rewards to be earned from using them. In addition, the manager favors practices that lower costs and are novel or contrary to habit. The group of experienced managers remains neutral regarding stakeholders’ influences; social influences are insignificant from the manager’s perspective at the early project stage of innovation tool selection.
- Group #2 managers are motivated by GP, HM, and PE. For these managers, the use of a practice correlates with better chances to co-create and collaborate with citizens. In addition, this usage is linked to the motivational rewards earned by the manager from using the practice. These managers do not believe the practice they choose will benefit their organization, increase their team’s productivity, or help identify new services. Group #2 managers lack sufficient experience or do not have enough influence on outcomes because they lack sufficient rank. In addition, they are also neutral regarding social influences at the early project stage of innovation tool selection.
- Group #3 managers are motivated by HT and GP. These managers choose tools and practices that foster co-creation with citizens and other stakeholders. These tools are popular in their agency or department. Group #3 appears to be the least experienced, or lowest ranked, of the three types of managers. As with the other groups, social influences are insignificant for these managers at the early stage of innovation tool selection.
The predictive power of the UTAUT-IPS model was relatively weak for the pooled sample and is clearly weaker than the psychology and sociology models which underpin UTAUT-IPS. The observable groups (e.g., gender, age, experience, or education) were unable to improve this power with any of the underlying models, because they do not differ from each other or from the pooled sample.
However, the results found from the POS groups, and their drivers, presented a different picture. The strength of the model for these groups demonstrated the capacity of the model to capture the different drivers of the use of a practice, and explain a large portion of its variance. Our results complement the findings of Damanpour and Schneider [1] and others [2,3,4,5,6,7], and help to understand the results of this earlier research; that is, a public manager willing to produce an innovation will first need to choose a tool to design and implement it. Our contribution is the identification of the types of managers and their different behavioral drivers in using a practice to innovate in a public service.
Our research is clearly limited by its exploratory nature [101] because it deals with an under-scrutinized behavior with a novel systematic PLS-SEM approach. This study is mainly limited by its geographical reach and the characteristics of our sample participants, who were self-selected experienced public innovators and innovation managers. In addition, our model is affected by the practices we studied, the timing of measurement, and the nature of measurement. The public practices and participants we included in our research differed from those of the original UTAUT model, which only analyzed the private sector. Consequently, the two studies might complement each other, because we also used the previous recommendations for expanding the original model [33]. In an attempt to limit unexpected effects or wishful thinking, we asked our participants to relate to a recent past project, after they had chosen their tools. This may have produced common method bias, despite attempts to control for it, as explained in the Methods section. In addition, our measurement is cross-sectional, lacking dynamic or longitudinal analysis of the cyclical interactions between intention, behavior, and performance.
6. Conclusions and Future Research
This paper presents a new model, the PLS-SEM-based UTAUT-IPS model, to theorize the drivers of the use of public innovation practice. The model includes the acting government paradigms, and other personal characteristics of public managers and their context, such as performance, motivation, habit, effort, or social influence. We tested this model with a sample of 227 Spanish public managers gathered at the end of 2019. Our PLS-SEM analyses adequately assessed 124 behavioral indicators (114 items and 10 composite variables) of the managers’ attitude towards collaboration, measurement of innovation, and the (non-)linearity of the innovation practices.
Our first contribution with the UTAUT-IPS model applied to our study sample demonstrates the powerful connection between the governance paradigms, or regimes, in effect in one public entity with the practices used by the innovators of that entity: agile methods, participatory practices, and collaborative prototyping. The behavioral drivers of the use of an innovation practice are linked to the type of manager: governance, cost, effort, available help, motivation, and novelty correlate with experienced managers (Group #1); governance, motivation, and expectations of performance influence less experienced managers (Group #2); and governance and habit correlate with novel managers (Group #3).
Second, with our exploratory research, we contribute by identifying the mixed toolbox of practices of innovation managers, and expose the coexistence of collaborative and conventional (top-down) practices, independent of the governance paradigm or regime, at the entity level.
The future of this research line lies in investigating the changes in the selection of innovation practices over the course of a project. We also suggest extending our scope to other geographies. Using the indicators and constructs identified here, and with an enlarged base of respondents, future investigations can confirm the connection of the governance paradigms and the other behavioral drivers. More importantly, future research should strive to validate the mediating role of the acceptance (intention) of an innovation practice, and more closely examine the characteristics of the types of public innovation manager.
Author Contributions
Conceptualization, A.P. and L.R.; methodology, A.P.; formal analysis, A.P. and L.R.; investigation, A.P.; writing—original draft preparation, A.P.; writing—review & editing, A.P. and L.R.; supervision, L.R.; funding acquisition, L.R. All authors have read and agreed to the published version of the manuscript.
Funding
This paper has received funding from the European Union’s Horizon 2020 research and innovation programme under grant agreement No 770356: Co-VAL. This publication reflects the views only of the authors, and the Agency cannot be held responsible for any use, which may be made of the information contained therein. The paper has also been co-funded by the Spanish National Research Programme RTI2018-101473-B-100.
Institutional Review Board Statement
Not applicable.
Informed Consent Statement
Not applicable.
Data Availability Statement
Not applicable.
Conflicts of Interest
The authors declare no conflict of interest.
Appendix A

Table A1.
Interviewee distribution by geographical scope of their government agency.
| Total | |
|---|---|
| Federal | 52 (23%) |
| Collaborative | 23 |
| Conventional | 26 |
| No practice | 3 |
| Regional | 83 (37%) |
| Collaborative | 33 |
| Conventional | 49 |
| No practice | 1 |
| Municipality | 92 (40%) |
| Collaborative | 31 |
| Conventional | 55 |
| No practice | 6 |
| Total | 227 |
Note: Collaborative—using practices such as networks of public–private agents for social innovation, participatory practices (world cafe, open space, wise action), experimentation and iteration. Conventional—using practices such as surveys and polls, traditional prototyping, traditional public-private partnerships. No practice—using no concrete practice, but a mixed toolbox.
Table A2.
Lists of all items per latent construct of UTAUT-IPS.
| Usage (US) |
| USE1. Agile methods: scrum, lean, kanvan and similar USE2. Design thinking, safaris, interviews, observation and similar USE3. Tenders, over-arching agreements and similar USE4. Network of public–private agents for social innovation and similar USE5. Participatory practices: world cafe, open space, wise action and similar USE6. Classical public–private partnerships USE7. Classical metrics and indicators USE8. Budget USE9. Surveys and polls USE10. Collaborative prototyping with citizens USE11. Classical prototyping USE12. Experimentation and iteration USE13. Not really following a particular practice—just discovering |
| Behavioral Intention (BI) |
| BI1. you will continue using this practice in the next project BI2. this practice drives your calendar of next actions for the coming 3 months BI3. you have already secured resources for this practice in the next 3 months BI4. you will use this practice again before any other |
| Performance Expectancy (PE) |
| PE1. meet the time requirement of your project PE2. adapt a process/service to a new regulation PE3. it helped our organization to reap the benefits/returns of the project PE4. improve the adoption or use of a process/service PE5. increase your (or team’s) productivity PE6. in my organization the use of this practice satisfies the confirmed political guidelines PE8. better address a crisis/urgent demand PE10. identify new un-serviced areas/users PE11. identify duplicated or useless services/processes |
| Effort Expectancy (EE) |
| EE1. the practice sequence of steps was clear and understandable EE2. given my progress, I expected to become a master very easily EE7. made collaboration with users/citizens easier EE8. made collaboration with other agents (different from users) easier EE10. within our team, made collaboration and contribution to the dialogue easier EE6. actionable (you can apply it rather quickly) |
| Social Influence (SI) |
| SI20. others around you were using it SI21. people who you inquired suggested you should use this practice SI22. you influenced the behavior of others suggesting they should use this practice SI1 Potential users SI2 Current users SI03 User influencers (associations, communities) SI4 District council SI5 Municipality council/board SI6 Politician SI7 National or regional government/public institutions SI8 Corporate influencers (businesses or business associations) SI9 Other members of your team SI10 Mentors/consultants SI11 Teachers/instructors SI12 Other fellow managers in other departments or institutions SI13 Boss/direct managers |
| Facilitating Conditions (FC) |
| FC1. had enough budget FC4. easily got help when you had difficulties using this practice FC5. found your unit’s culture and people supportive to use this practice FC6. found it easy to recruit your expected number of users/citizens to use this practice FC7. you had to work out the extra, non-budgeted costs because the practice did not help with them FC8. found the structure and systems of your organization supportive of this practice |
| Hedonic Motivation (HM) |
| HM1. was inspiring HM2. fun made you had a good time HM4. brought me recognition in my organization and helped my career development HM5. allowed me to emotionally connect with the people involved HM6. fulfill your public service vocation HM8. feel good because you made it against all |
| Costs (CO) |
| CO1. We had extra, non-budgeted costs due to the use of this practice CO2. we spent more time due to the use of this practice CO3. costs are less controlled due to this practice CO4. we needed to revise the service after implementation because results were not satisfactory CO5. risks of failure were higher due to this practice |
| Habit (HT) |
| HT1. engaging (I could spend a lot of time on it without much effort) HT2. an everyday or regular activity HT4. I am so used to this practice that it is natural for me to use it, before any other HT6. in my unit we use this innovation practice all the time |
| Government Paradigm (GP) |
| GP1. evaluate the actual engagement of users/citizens GP2. assess user/citizen satisfaction with the service or process, pre- and after its innovation GP3. assess the needs of users/citizens GP4. include users/citizens in co-creation/prototyping sessions GP5. include users/citizens in services or processes co-production/co-implementation GP6. include users in analysis of data on their experiences GP7. include any other agents (consultants, technical staff or any other) in idea generation or prototyping sessions GP8. include any non-user (consultants, technical staff or any other) in services or processes co-production/co-implementation GP9. work with users’ representatives (e.g., NGOs, associations) more than with individual end users |
Lists of loadings and weights per indicator.
Table A3.
Outer loadings.
| Behavioral Intention (BI) | Loading | Mean | SD |
| [BI1] ← BI | 0.797 | 0.797 | 0.035 |
| [BI2] ← BI | 0.774 | 0.773 | 0.040 |
| [BI3] ← BI | 0.796 | 0.794 | 0.034 |
| [BI4] ← BI | 0.712 | 0.711 | 0.046 |
| Effort Expectancy (EE) | Loading | Mean | SD |
| [EE10] ← EE | 0.750 | 0.747 | 0.061 |
| [EE1] ← EE | 0.769 | 0.764 | 0.050 |
| [EE2] ← EE | 0.763 | 0.758 | 0.057 |
| Facilitating Conditions (FC) | Loading | Mean | SD |
| [FC1] ← FC | 0.798 | 0.745 | 0.150 |
| [FC4] ← FC | 0.746 | 0.703 | 0.141 |
| [FC5] ← FC | 0.622 | 0.588 | 0.226 |
| [FC6] ← FC | 0.721 | 0.677 | 0.201 |
| Habit (HT) | Loading | Mean | SD |
| [HT2] ← HT | 0.804 | 0.802 | 0.041 |
| [HT4] ← HT | 0.783 | 0.778 | 0.044 |
| [HT6] ← HT | 0.868 | 0.868 | 0.023 |
| Hedonic Motivation (HM) | Loading | Mean | SD |
| [HM1] ← HM | 0.813 | 0.809 | 0.047 |
| [HM2] ← HM | 0.815 | 0.811 | 0.049 |
| [HM4] ← HM | 0.648 | 0.643 | 0.075 |
| [HM5] ← HM | 0.827 | 0.825 | 0.036 |
| Social Influence (SI) | Loading | Mean | SD |
| [SI22] ← SI | 1.000 | 1.000 | 0.000 |
Table A4.
Outer weights.
| Cost (CO) | Weight | Mean | SD |
| [CO3] → CO | −0.599 | −0.202 | 0.621 |
| [CO4] → CO | 0.992 | 0.669 | 0.635 |
| Government Paradigm (GP) | Weight | Mean | SD |
| [GP1] → GP | 0.377 | 0.361 | 0.145 |
| [GP7] → GP | 0.259 | 0.254 | 0.168 |
| [GP4] → GP | 0.712 | 0.702 | 0.114 |
| Performance Expectancy (PE) | Weight | Mean | SD |
| [PE10] → PE | 0.464 | 0.457 | 0.160 |
| [PE5] → PE | 0.786 | 0.673 | 0.121 |
| [PE3] → PE | 0.433 | 0.424 | 0.157 |
| Usage (US) | Weight | Mean | SD |
| [US10] → US | 0.416 | 0.384 | 0.151 |
| [US1] → US | 0.430 | 0.406 | 0.147 |
| [US2] → US | 0.217 | 0.214 | 0.147 |
| [US4] → US | −0.095 | −0.101 | 0.176 |
| [US5] → US | 0.479 | 0.443 | 0.152 |
| [US6] → US | 0.031 | 0.031 | 0.233 |
Note: Dropped items are stricken.
References
- Damanpour, F.; Schneider, M. Characteristics of innovation and innovation adoption in public organizations: Assessing the role of managers. J. Public Adm. Res. Theory 2009, 19, 495–522. [Google Scholar] [CrossRef]
- Zaltman, G.; Holbek, J.; Duncan, R. Innovations and Organizations; John Wiley & Sons: New York, NY, USA, 1973. [Google Scholar]
- Boyne, G.A.; Gould-Williams, J.S.; Law, J.; Walker, R.M. Explaining the adoption of innovation: An empirical analysis of public management reform. Environ. Plan. Gov. Policy 2005, 23, 419–435. [Google Scholar] [CrossRef]
- Meyer, A.D.; Goes, J.B. Organizational assimilation of innovation: A multilevel contextual analysis. Acad. Manag. J. 1988, 31, 897–923. [Google Scholar]
- Schneider, M. Do attributes of innovative administrative practices influence their adoption? An exploratory study of US local government. Public Perform. Manag. Rev. 2007, 30, 590–614. [Google Scholar] [CrossRef]
- Elenkov, D.S.; Manev, I.M. Top management leadership and influence on innovation: The role of socio-cultural context. J. Manag. 2005, 31, 381–402. [Google Scholar]
- Hooijberg, R.; DiTomaso, N. Leadership in and of demographically diverse organizations. Leadersh. Q. 1996, 7, 1–19. [Google Scholar] [CrossRef]
- Gallouj, F.; Rubalcaba, L.; Windrum, P.; Toivonen, M. Understanding social innovation in service industries. Ind. Innov. 2018, 25, 551–569. [Google Scholar] [CrossRef] [Green Version]
- Rubalcaba, L.; Windrum, P.; Gallouj, F.; Di Meglio, G.; Pyka, A.; Sundbo, J.; Weber, M. ServPPIN. The Contribution of Public and Private Services to European Growth and Welfare, and the Role of Public-Private Innovation Networks; Servppin Final Publishable Report; European Commision: Brussels, Belgium; Available online: https://hal.archives-ouvertes.fr/hal-01111787 (accessed on 7 May 2021).
- Djellal, F.; Gallouj, F.; Miles, I. Two decades of research on innovation in services: Which place for public services? Struct. Chang. Econ. Dyn. 2013, 98–117. [Google Scholar] [CrossRef]
- Gallouj, F.; Windrum, P. Services and services innovation. J. Evol. Econ. 2009, 19, 141–148. [Google Scholar] [CrossRef] [Green Version]
- Naor, M.; Druehl, C.; Bernardes, E.S. Servitized business model innovation for sustainable transportation: Case study of failure to bridge the design-implementation gap. J. Clean. Prod. 2018, 170, 1219–1230. [Google Scholar] [CrossRef]
- Albury, D. Creating the conditions for radical public service innovation. Aust. J. Public Adm. 2011, 70, 227–235. [Google Scholar] [CrossRef]
- Fuglsang, L. Bricolage and invisible innovation in public service innovation. J. Innov. Econ. Manag. 2010, 5, 67–87. [Google Scholar] [CrossRef]
- Vickers, I.; Lyon, F.; Sepulveda, L.; McMullin, C. Public service innovation and multiple institutional logics: The case of hybrid social enterprise providers of health and wellbeing. Res. Policy 2017, 46, 1755–1768. [Google Scholar] [CrossRef] [Green Version]
- Osborne, S.P. Meta-Governance and Public Management; Routledge: Oxfordshire, UK, 2010. [Google Scholar]
- Koppenjan, J.; Koliba, C. Transformations towards new public governance: Can the new paradigm handle complexity? Int. Rev. Public Adm. 2013, 18, 1–8. [Google Scholar] [CrossRef]
- Martin, B.R. Twenty challenges for innovation studies. Sci. Public Policy 2016, 43, 432–450. [Google Scholar] [CrossRef] [Green Version]
- Kline, S.J.; Rosenberg, N. An overview of innovation. In The Positive Sum Strategy: Harnessing Technology for Economic Growth; Landau, R., Rosenberg, N., Eds.; National Academy of Sciences: Washington, DC, USA, 1986; pp. 275–305. [Google Scholar]
- Davis, F.D.; Bagozzi, R.; Warshaw, P.R. User acceptance of computer technology: A comparison of two theoretical models user acceptance of computer technology: A comparison of two. Manag. Sci. 1989, 35, 982–990. [Google Scholar] [CrossRef] [Green Version]
- Venkatesh, V.; Morris, M.G.; Davis, G.B.; Davis, F.D. User acceptance of information technology: Toward a unified view. MIS Q. 2003, 27, 425–478. [Google Scholar] [CrossRef] [Green Version]
- Peralta, A.; Carrillo-Hermosilla, J.; Crecente, F. Sustainable business model innovation and acceptance of its practices among Spanish entrepreneurs. Sustainable Innovation: Processes, Strategies, and Outcomes. J. Corp. Soc. Responsab. Environ. Manag. 2019, 26, 1119–1134. [Google Scholar] [CrossRef]
- Ansell, C.; Gash, A. Collaborative platforms as a governance strategy. J. Public Adm. Res. Theory 2017, 28, 16–32. [Google Scholar] [CrossRef]
- Mergel, I.; Desouza, K.C. Implementing open innovation in the public sector: The case of Challenge.gov. Public Adm. Rev. 2013, 73, 882–890. [Google Scholar] [CrossRef] [Green Version]
- Gallouj, F.; Weinstein, O. Innovation in services. Res. Policy 1997, 26, 537–556. [Google Scholar] [CrossRef]
- Windrum, P.; Koch, P. (Eds.) Innovation in Public Sector Services. Entrepreneurship, Creativity and Management; Edward Elgar Publishing Ltd.: Cheltenham, UK; Northampton, UK, 2008. [Google Scholar]
- Osborne, S.P.; Brown, L. (Eds.) Handbook of Innovation in Public Services; Edward Elgar Publishing Limited: Cheltenham, UK, 2014. [Google Scholar]
- Desmarchelier, B.; Djellal, F.; Gallouj, F. Public Service Innovation Networks (PSINs): Collaborating for Innovation and Value Creation; HAL: Lyon, France, 2018. [Google Scholar]
- Gallouj, F.; Rubalcaba, L.; Windrum, P. Public–Private Innovation Networks in Services; Edward Elgar Publishing Limited: Cheltenham, UK, 2013. [Google Scholar]
- Ajzen, I. The theory of planned behavior. Organ. Behav. Hum. Decis. Process. 1991, 50, 179–211. [Google Scholar] [CrossRef]
- Shepherd, D.A.; Haynie, J.M.; McMullen, J.S. Confirmatory search as a useful heuristic? Testing the veracity of entrepreneurial conjectures. J. Bus. Ventur. 2012, 27, 637–651. [Google Scholar] [CrossRef]
- Taylor, B. The 4 Leadership Styles, and How to Identify Yours. HBR. Available online: https://cb.hbsp.harvard.edu/cbmp/product/H031MR-PDF-ENG (accessed on 7 May 2021).
- Venkatesh, V.; Thong, J.Y.L.; Xu, X. Consumer acceptance and use of information technology: Extending the unified theory of acceptance and use of technology. MIS Q. 2012, 36, 157–178. [Google Scholar] [CrossRef] [Green Version]
- Peralta, A.; Rubalcaba, L.; Carrillo-Hermosilla, J. How governance paradigms and other drivers affect public managers acceptance of innovation practices. Acad. Manag. Annu. Meet. 2020 (Vanc. Can.) 2020, 2020, 20024. [Google Scholar] [CrossRef]
- Peralta, A.; Carrillo-Hermosilla, J.; Crecente, F. Modelling the Entrepreneur’s Decision on Which Practice Use to Create Sustainable Businesses. Acad. Manag. Annu. Meet. 2020 (Vanc. Can.) 2020, 2020, 19467. [Google Scholar] [CrossRef]
- Lima, M.; Baudier, P. Business model canvas acceptance among French entrepreneurship students: Principles for enhancing innovation artefacts in business education. J. Innov. Econ. 2017, 23, 159. [Google Scholar] [CrossRef]
- Desmarchelier, B.; Djellal, F.; Gallouj, F. Towards a servitization of innovation networks: A mapping. Public Manag. Rev. 2020, 22, 1368–1397. [Google Scholar] [CrossRef] [Green Version]
- Ropret, M.; Aristovnik, A. Public sector reform from the post-new public management perspective: Review and bibliometric analysis. Cent. Eur. Public Adm. Rev. 2019, 17. [Google Scholar] [CrossRef] [Green Version]
- Ropret, M.; Aristovnik, A.; Kovač, P. A content analysis of the rule of law within public governance models: Old vs. new EU member states. NISPAcee J. Public Adm. Policy 2018, 11, 129–152. [Google Scholar] [CrossRef] [Green Version]
- Cepiku, D.; Mititelu, C. Public administration reforms in transition countries: Albania and Romania between the Weberian model and the new public management. In Public Administration in the Balkans: From Weberian Bureaucracy to New Public Management; Matei, L., Flogaitis, S., Eds.; ASsee Online Series, South-Eastern European administrative studies; Editura Economica: Bucharest, Romania, 2011; p. 299. [Google Scholar]
- Peralta, A.; Gismera, L. Sustainable business model innovation and ethics: A conceptual review from the institutional theory addressing (un)sustainability. Int. J. Innov. Sustain. Dev. 2020. [Google Scholar] [CrossRef]
- Djellal, F.; Gallouj, F. Fifteen advances in service innovation studies. Serv. Exp. Innov. Integr. Extending Res. 2018, 39–65. [Google Scholar] [CrossRef]
- Page, S. What’s new about the new public management? Administrative change in the human services. Public Adm. Rev. 2005, 65, 713–727. [Google Scholar] [CrossRef]
- Osborne, S.P. From public service-dominant logic to public service logic: Are public service organizations capable of co-production and value co-creation? Public Manag. Rev. 2018, 20, 225–231. [Google Scholar] [CrossRef] [Green Version]
- Gilmore, T.N.; Krantz, J. Innovation in the public sector: Dilemmas in the use of ad hoc processes. J. Policy Anal. Manag. 1991, 10, 455–468. [Google Scholar] [CrossRef]
- Compeau, D.R.; Higgins, C.A. Computer self-efficacy: Development of a measure and initial test. MIS Q. 1995, 19, 189–211. [Google Scholar] [CrossRef] [Green Version]
- Martin, B.R. Science Policy Research—Having an Impact on Policy? Sussex. 2010. Available online: http://www.ohe.org/publications/article/science-policy-research-having-an-impact-on-policy-14.cfm%5Cnpapers3://publication/uuid/D7320A30-A725-4138-AE2B-15CF5A30E257 (accessed on 7 May 2021).
- Blank, S.; Dorf, B. The Startup Owner’s Manual, The Step-By-Step Guide for Building a Great Company; K&S Ranch: Pescadero, CA, USA, 2012. [Google Scholar]
- Jessop, B. Governance and meta-governance: On reflexivity, requisite variety and requisite irony. In Governance, Governmentality and Democracy; Bang, H., Ed.; Manchester University Press: Manchester, UK, 2002. [Google Scholar]
- Bell, S.; Park, A. The problematic metagovernance of networks: Water reform in New South Wales. J. Public Policy 2006, 26, 63–83. [Google Scholar] [CrossRef]
- Radin, B. Challenging the Performance Movement: Accountability, Complexity and Democratic Values; Georgetown University Press: Washington, DC, USA, 2006. [Google Scholar]
- Wirtz, B.W.; Pistoia, A.; Ullrich, S.; Göttel, V. Business models: Origin, development and future research perspective. Long Range Plan. 2016, 49, 36–54. [Google Scholar] [CrossRef]
- Cooper, R.G. What’s next? After stage-gate. Res. Manag. 2014, 57, 20–31. [Google Scholar] [CrossRef]
- Bush, V. Science the Endless Frontier; Office of Scientific Research and Development: Washington, DC, USA, 1945. [Google Scholar]
- Schmookler, J. Invention and Economic Growth; Harvard University Press: Cambridge, MA, USA, 1966. [Google Scholar]
- York, J.L.; Danes, J.E. Customer development, innovation, and decision-making biases in the lean startup. J. Small Bus. Manag. 2014, 24, 21–39. [Google Scholar] [CrossRef] [Green Version]
- Blank, S. The Four Steps to the Epiphany: Successful Strategies for Products that Win, 3rd ed.; K&S Ranch: Pescadero, CA, USA, 2007. [Google Scholar]
- Dybå, T.; Dingsøyr, T. Empirical studies of agile software development: A systematic review. Inf. Softw. Technol. 2008, 50, 833–859. [Google Scholar] [CrossRef]
- Rounsevell, M.; Arneth, A.; Brown, D.; Noblet-Ducoudré, N.; Ellis, E.C.; Finnigan, J.; Galvin, K.; Grigg, N.; Harman, I. Incorporating Human Behaviour and Decision Making Processes in Land Use and Climate System Models; Global Land Project International Project Office: São José dos Campos, Brazil, 2013; Volume 7, pp. 1–25. [Google Scholar]
- Osterwalder, A. The Business Model Ontology—A Proposition in a Design Science Approach. Ph.D. Thesis, Universite de Lausanne, Lausanne, Switzerland, 2004. [Google Scholar]
- Page, S. Entrepreneurial strategies for managing interagency collaboration. J. Public Adm. Res. Theory J. 2003, 13, 311–339. Available online: http://0-www-jstor-org.brum.beds.ac.uk/stable/3525852 (accessed on 7 May 2021). [CrossRef]
- Karadag, H. Financial management challenges in small and medium-sized enterprises: A strategic management approach. EMAJ Emerg. Mark. J. 2015, 5, 26–40. [Google Scholar] [CrossRef] [Green Version]
- Geissdoerfer, M.; Savaget, P.; Evans, S. The Cambridge business model innovation process. In Proceedings of the 14th Global Conference on Sustainable Manufacturing GCSM, Stellenbosch, South Africa, 3–5 October 2016; pp. 262–269. [Google Scholar] [CrossRef]
- Yin, R.K. Life histories of innovations: How new practices become routinized. Public Adm. Rev. 1981, 41, 21–28. [Google Scholar] [CrossRef]
- Kim, S.S.; Malhotra, N.K. A longitudinal model of continued IS use: An integrative view of four mechanisms underlying post-adoption phenomena. Manag. Sci. 2005, 51, 741–755. [Google Scholar] [CrossRef]
- Verplanken, B.; Wood, W. Interventions to break and create consumer habits. J. Public Policy Mark. 2006, 25, 90–103. [Google Scholar] [CrossRef] [Green Version]
- Fernandez, S.; Moldogaziev, T. Using employee empowerment to encourage innovative behavior in the public sector. J. Public Adm. Res. Theory 2013, 23, 155–187. [Google Scholar] [CrossRef] [Green Version]
- Sorenson, E. Metagovernance: The changing role of politicians in processes of democratic governance. Am. Rev. Public Adm. 2006, 36, 98–124. [Google Scholar] [CrossRef]
- Yang, K. Creating public value and institutional innovations across boundaries: An integrative process of participation, legitimation, and implementation. Public Adm. Rev. 2016, 76, 873–885. [Google Scholar] [CrossRef]
- White, L.D. Trends in Public Administration; McGraw-Hill: New York, NY, USA, 1933. [Google Scholar]
- Minton, H.L.; Schneider, F.W. Differential Psychology; Waveland Press: Prospect Heights, IL, USA, 1980. [Google Scholar]
- Hall, D.; Mansfield, R. Relationships of age and seniority with career variables of engineers and scientists. J. Appl. Psychol. 1995, 60, 201–210. [Google Scholar] [CrossRef]
- Castells, M. The Rise of the Network Society, 2nd ed.; Wiley-Blackwell: Chichester, UK, 2010. [Google Scholar]
- Cavalcante, S.; Kesting, P.; Ulhøi, J. Business model dynamics and innovation: (re)establishing the missing linkages. Manag. Decis. 2011, 49, 1327–1342. [Google Scholar] [CrossRef] [Green Version]
- Alford, J. The multiple facets of co-production: Building on the work of Elinor Ostrom. Public Manag. Rev. 2014, 16, 299–316. [Google Scholar] [CrossRef]
- Bovaird, T. Beyond engagement and participation: User and community coproduction of public services. Public Adm. Rev. 2007, 67, 846–860. [Google Scholar] [CrossRef]
- Scott, T.A.; Thomas, C.W.; Magallanes, J.M. Convening for consensus: Simulating stakeholder agreement in collaborative governance processes under different network conditions. J. Public Adm. Res. Theory 2018, 29, 32–49. [Google Scholar] [CrossRef]
- Felin, T.; Foss, N.J. Strategic organization: A field in search of micro-foundations. Strateg. Organ. 2005, 3, 441–455. [Google Scholar] [CrossRef] [Green Version]
- Crossan, M.M.; Apaydin, M. A multi-dimensional framework of organizational innovation: A systematic review of the literature. J. Manag. Stud. 2010, 47, 1154–1191. [Google Scholar] [CrossRef]
- Kearney, C.; Hisrich, R.; Roche, F. Facilitating public sector corporate entrepreneurship process: A conceptual model. J. Enterp. Cult. 2007, 15, 275–299. [Google Scholar] [CrossRef]
- Ramió, C. Una administración pública de futuro sostenible económicamente e innovadora en el contexto de la globalización. Cuad. Gob. Adm. Pública 2017, 3, 103–122. [Google Scholar] [CrossRef] [Green Version]
- Benéitez, M.B.; Engelken, M. De la Nueva Gestión Pública al Nuevo Servicio Público: De Ciudadano a Cliente y Vuelta a Empezar; Asociación Española de Ciencia Polítíca y de la Administración: Madrid, Spain, 2011. [Google Scholar]
- Graells, I.; Costa, J.; Ramilo-Araujo, M.C. Ciudadanía y administraciones en red. La administración pública ante la nueva sociedad. Cuad. Gob. Adm. Pública 2014, 1, 221–226. [Google Scholar]
- Desmarchelier, B.; Djellal, F.; Gallouj, F. Public Service Innovation Networks (PSINs): An Instrument for Collaborative Innovation and Value Co-Creation in Public Service(s). 2018. Available online: https://halshs.archives-ouvertes.fr/halshs-01934284 (accessed on 7 May 2021).
- Hair, J.F.; Sarstedt, M.; Hopkins, L.; Kuppelwieser, V. Partial least squares structural equation modeling (PLS-SEM): An emerging tool for business research. Eur. Bus. Rev. 2014, 26, 106–121. [Google Scholar] [CrossRef]
- Faul, F.; Erdfelder, E.; Buchner, A.; Lang, A.-G. Statistical power analyses using G*Power 3.1: Tests for correlation and regression analyses. Behav. Res. Methods 2009, 41, 1149–1160. Available online: http://www.psychologie.hhu.de/arbeitsgruppen/allgemeine-psychologie-und-arbeitspsychologie/gpower.html (accessed on 7 May 2021). [CrossRef] [Green Version]
- Garson, D.G. Partial least squares: Regression & structural equation models. In Blue Book; Statistical Associates Publishing: Asheboro, NC, USA, 2016. [Google Scholar]
- Sarstedt, M.; Ringle, C.M.; Hair, J.F. Partial Least Squares Structural Equation Modeling; Springer: Cham, Switzerland, 2017; Volume 26. [Google Scholar]
- Hair, J.F., Jr.; Hult, G.T.M.; Ringle, C.M.; Sarstedt, M. A Primer on Partial Least Squares Structural Equation Modeling (Pls-Sem); SAGE Publications Inc.: Thousand Oaks, CA, USA, 2014. [Google Scholar]
- Lohmöller, J.B. Latent Variable Path Modeling with Partial Least Squares; Physica: Heidelberg, Germany, 1989. [Google Scholar]
- Ringle, C.M.; Wende, S.; Becker, J.-M. SmartPLS 3; SmartPLS GmbH: Boenningstedt, Germany, 2015. [Google Scholar]
- Tehseen, S.; Ramayah, T.; Sajilan, S. Testing and controlling for common method variance: A review of available methods. J. Manag. Sci. 2017, 4, 142–168. [Google Scholar] [CrossRef]
- Hair, J.F.; Hult, G.T.M.; Ringle, C.M.; Sarstedt, M. A Primer on Partial Least Squares Structural Equation Modeling (PLS-SEM), 2nd ed.; SAGE Publications: Thousand Oaks, CA, USA, 2016. [Google Scholar]
- Cohen, J. Statistical Power Analysis for the Behavioral Sciences; Lawrence Erlbaum: Mahwah, NJ, USA, 1988. [Google Scholar]
- Edgington, E.; Onghena, P. Randomization Tests; Chapman and Hall/CRC: Boca Raton, FL, USA, 2007. [Google Scholar]
- Hair, J.F.; Sarstedt, M.; Ringle, C.M.; Gudergan, S.P. Advanced Issues in Partial Least Squares Structural Equation Modeling (PLS-SEM); SAGE Publications Inc.: Thousand Oaks, CA, USA, 2018. [Google Scholar]
- Onghena, P. Randomization and the randomization test: Two sides of the same coin. In Randomization, Masking and Allocation Concealment; Chapman and Hall/CRC: Boca Raton, FL, USA, 2019; pp. 185–208. [Google Scholar] [CrossRef]
- Becker, J.M.; Rai, A.; Ringle, C.M.; Völckner, F. Discovering unobserved heterogeneity in structural equation models to avert validity threats. MIS Q. 2013, 37, 665–694. [Google Scholar] [CrossRef] [Green Version]
- Hartley, J.; Sørensen, E.; Torfing, J. Collaborative innovation: A viable alternative to market-competition and organizational entrepreneurship? Public Adm. Rev. 2013, 76, 821–830. [Google Scholar] [CrossRef]
- Criado, I. Nuevas tendencias en la gestión pública: Innovación abierta, gobernanza inteligente y tecnologías sociales en unas administraciones públicas colaborativas. In Monografías; Instituto Nacional de Administración Pública: Madrid, Spain, 2016. [Google Scholar]
- Given, L.M. Exploratory research. In The SAGE Encyclopedia of Qualitative Research Methods; SAGE Publications Inc.: Thousand Oaks, CA, USA, 2008; pp. 327–329. [Google Scholar]
Figure 1.
Research model.


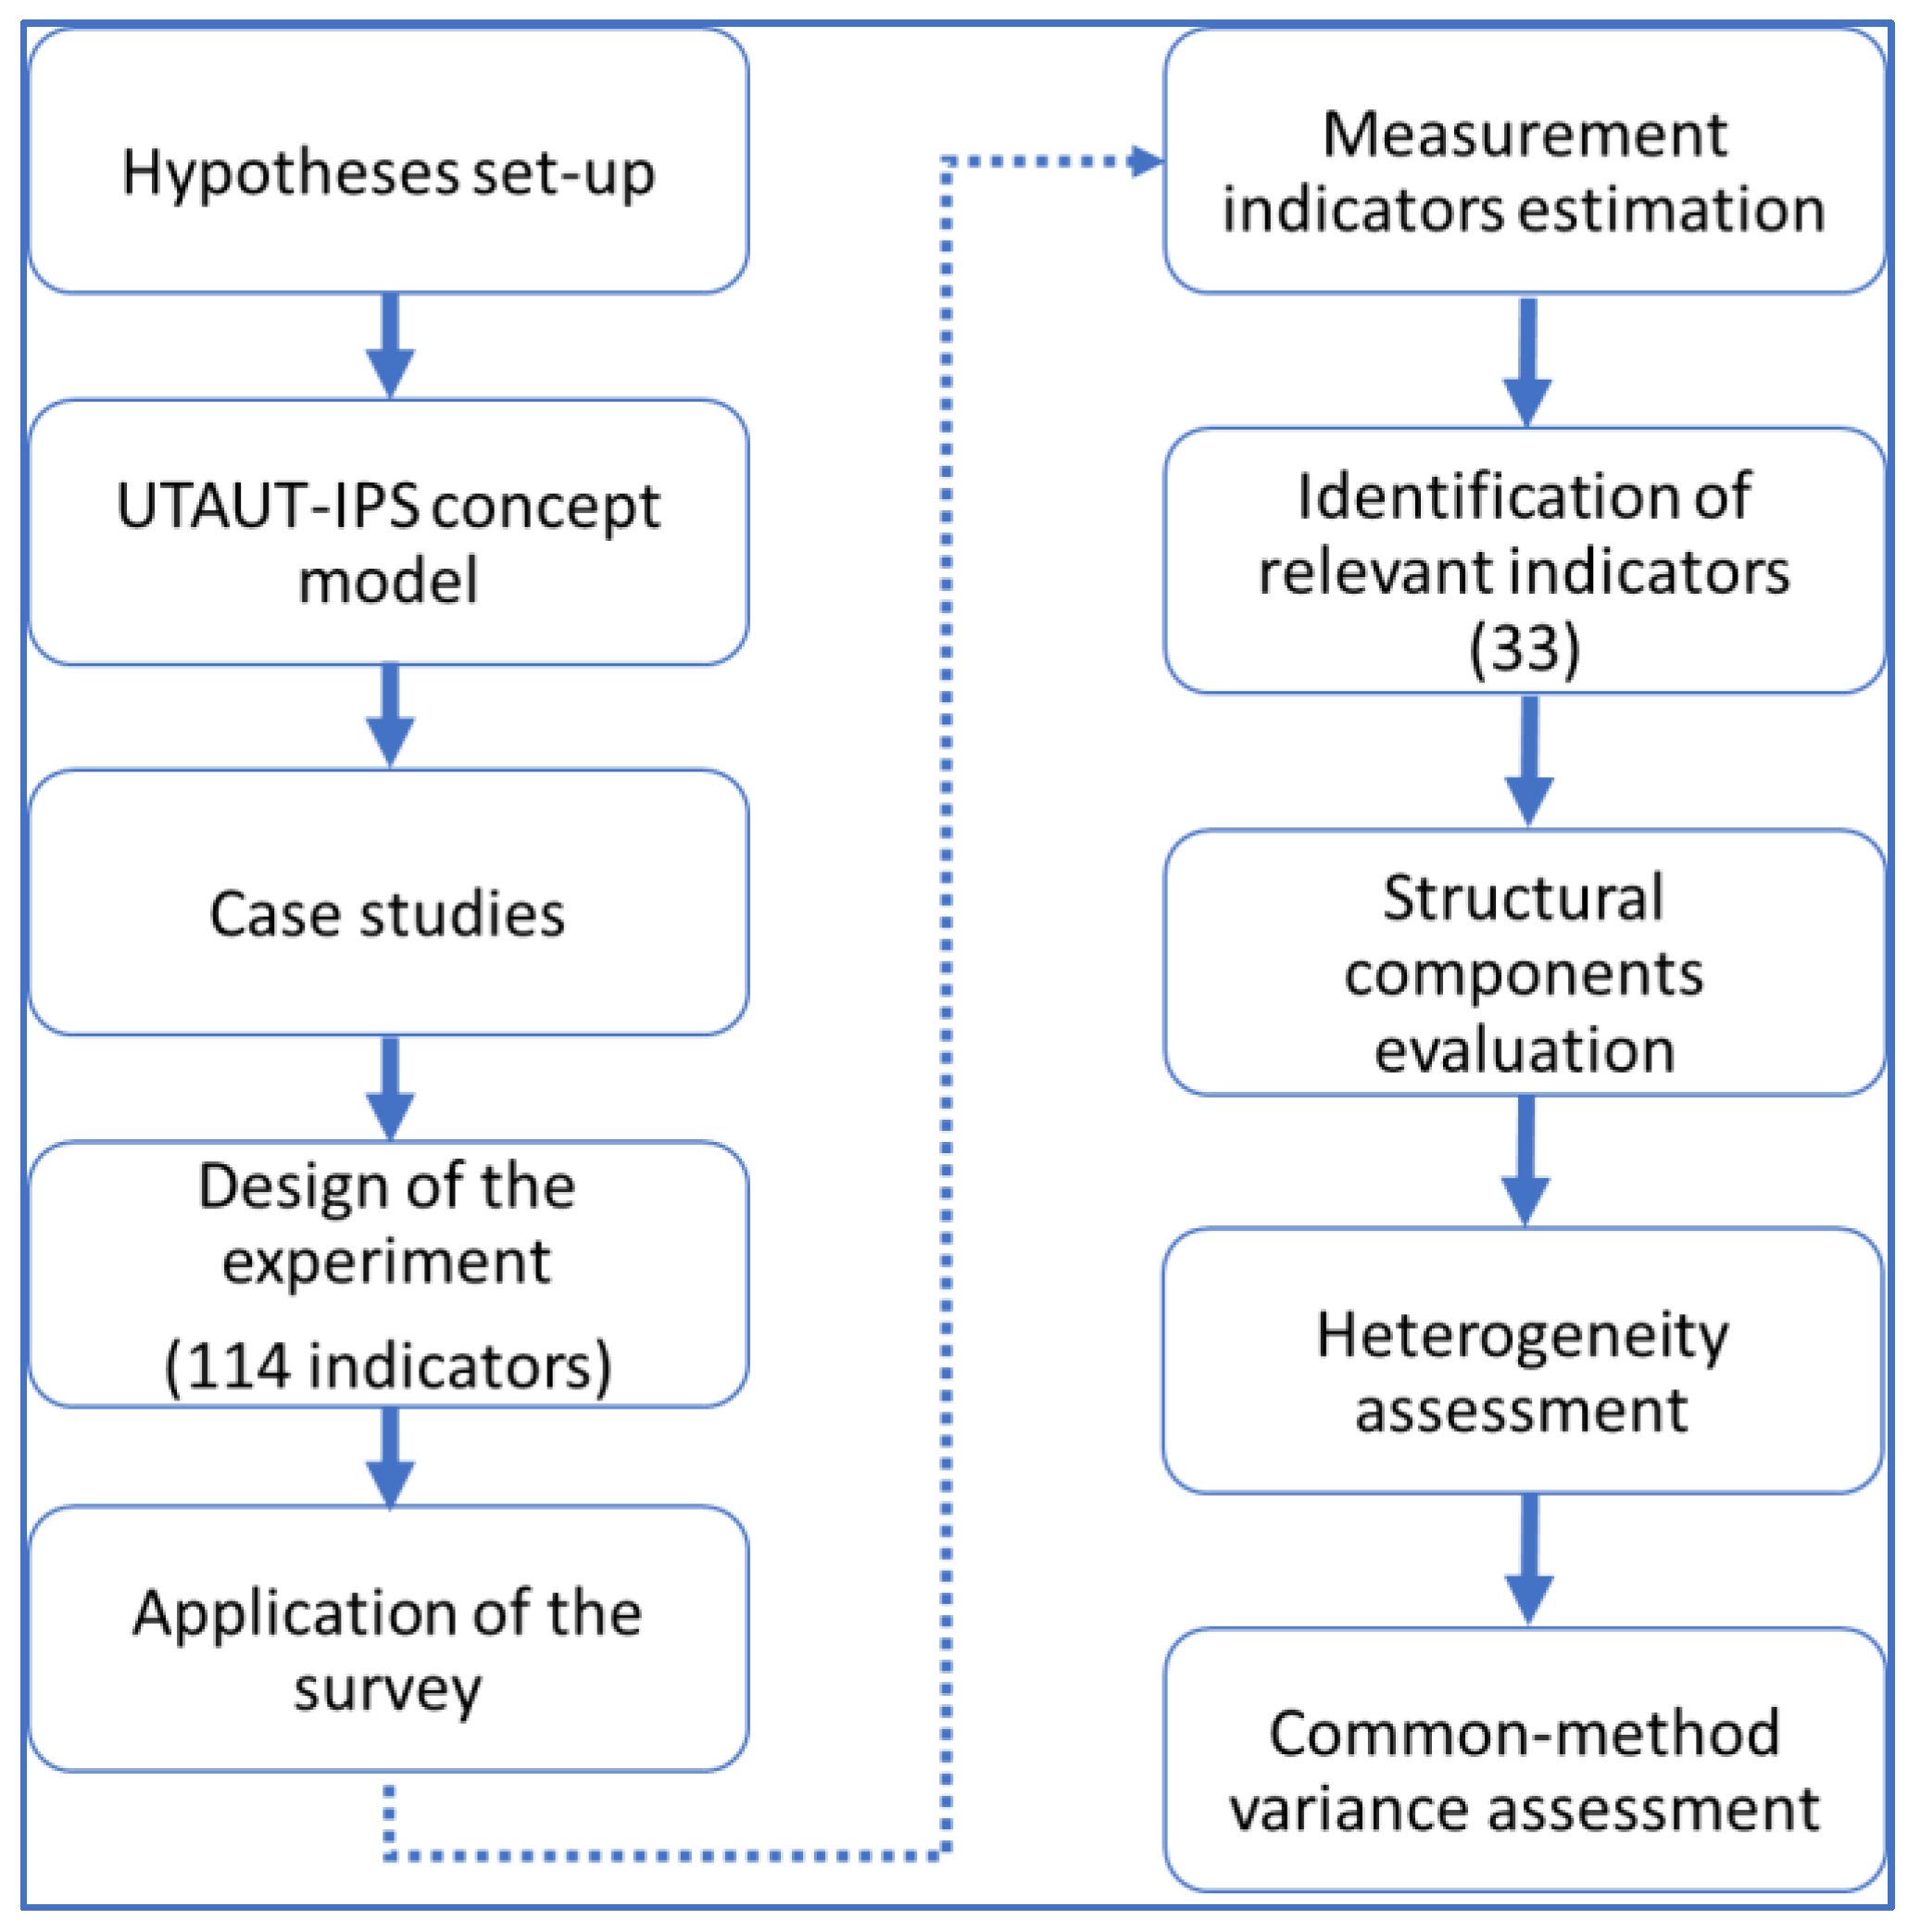
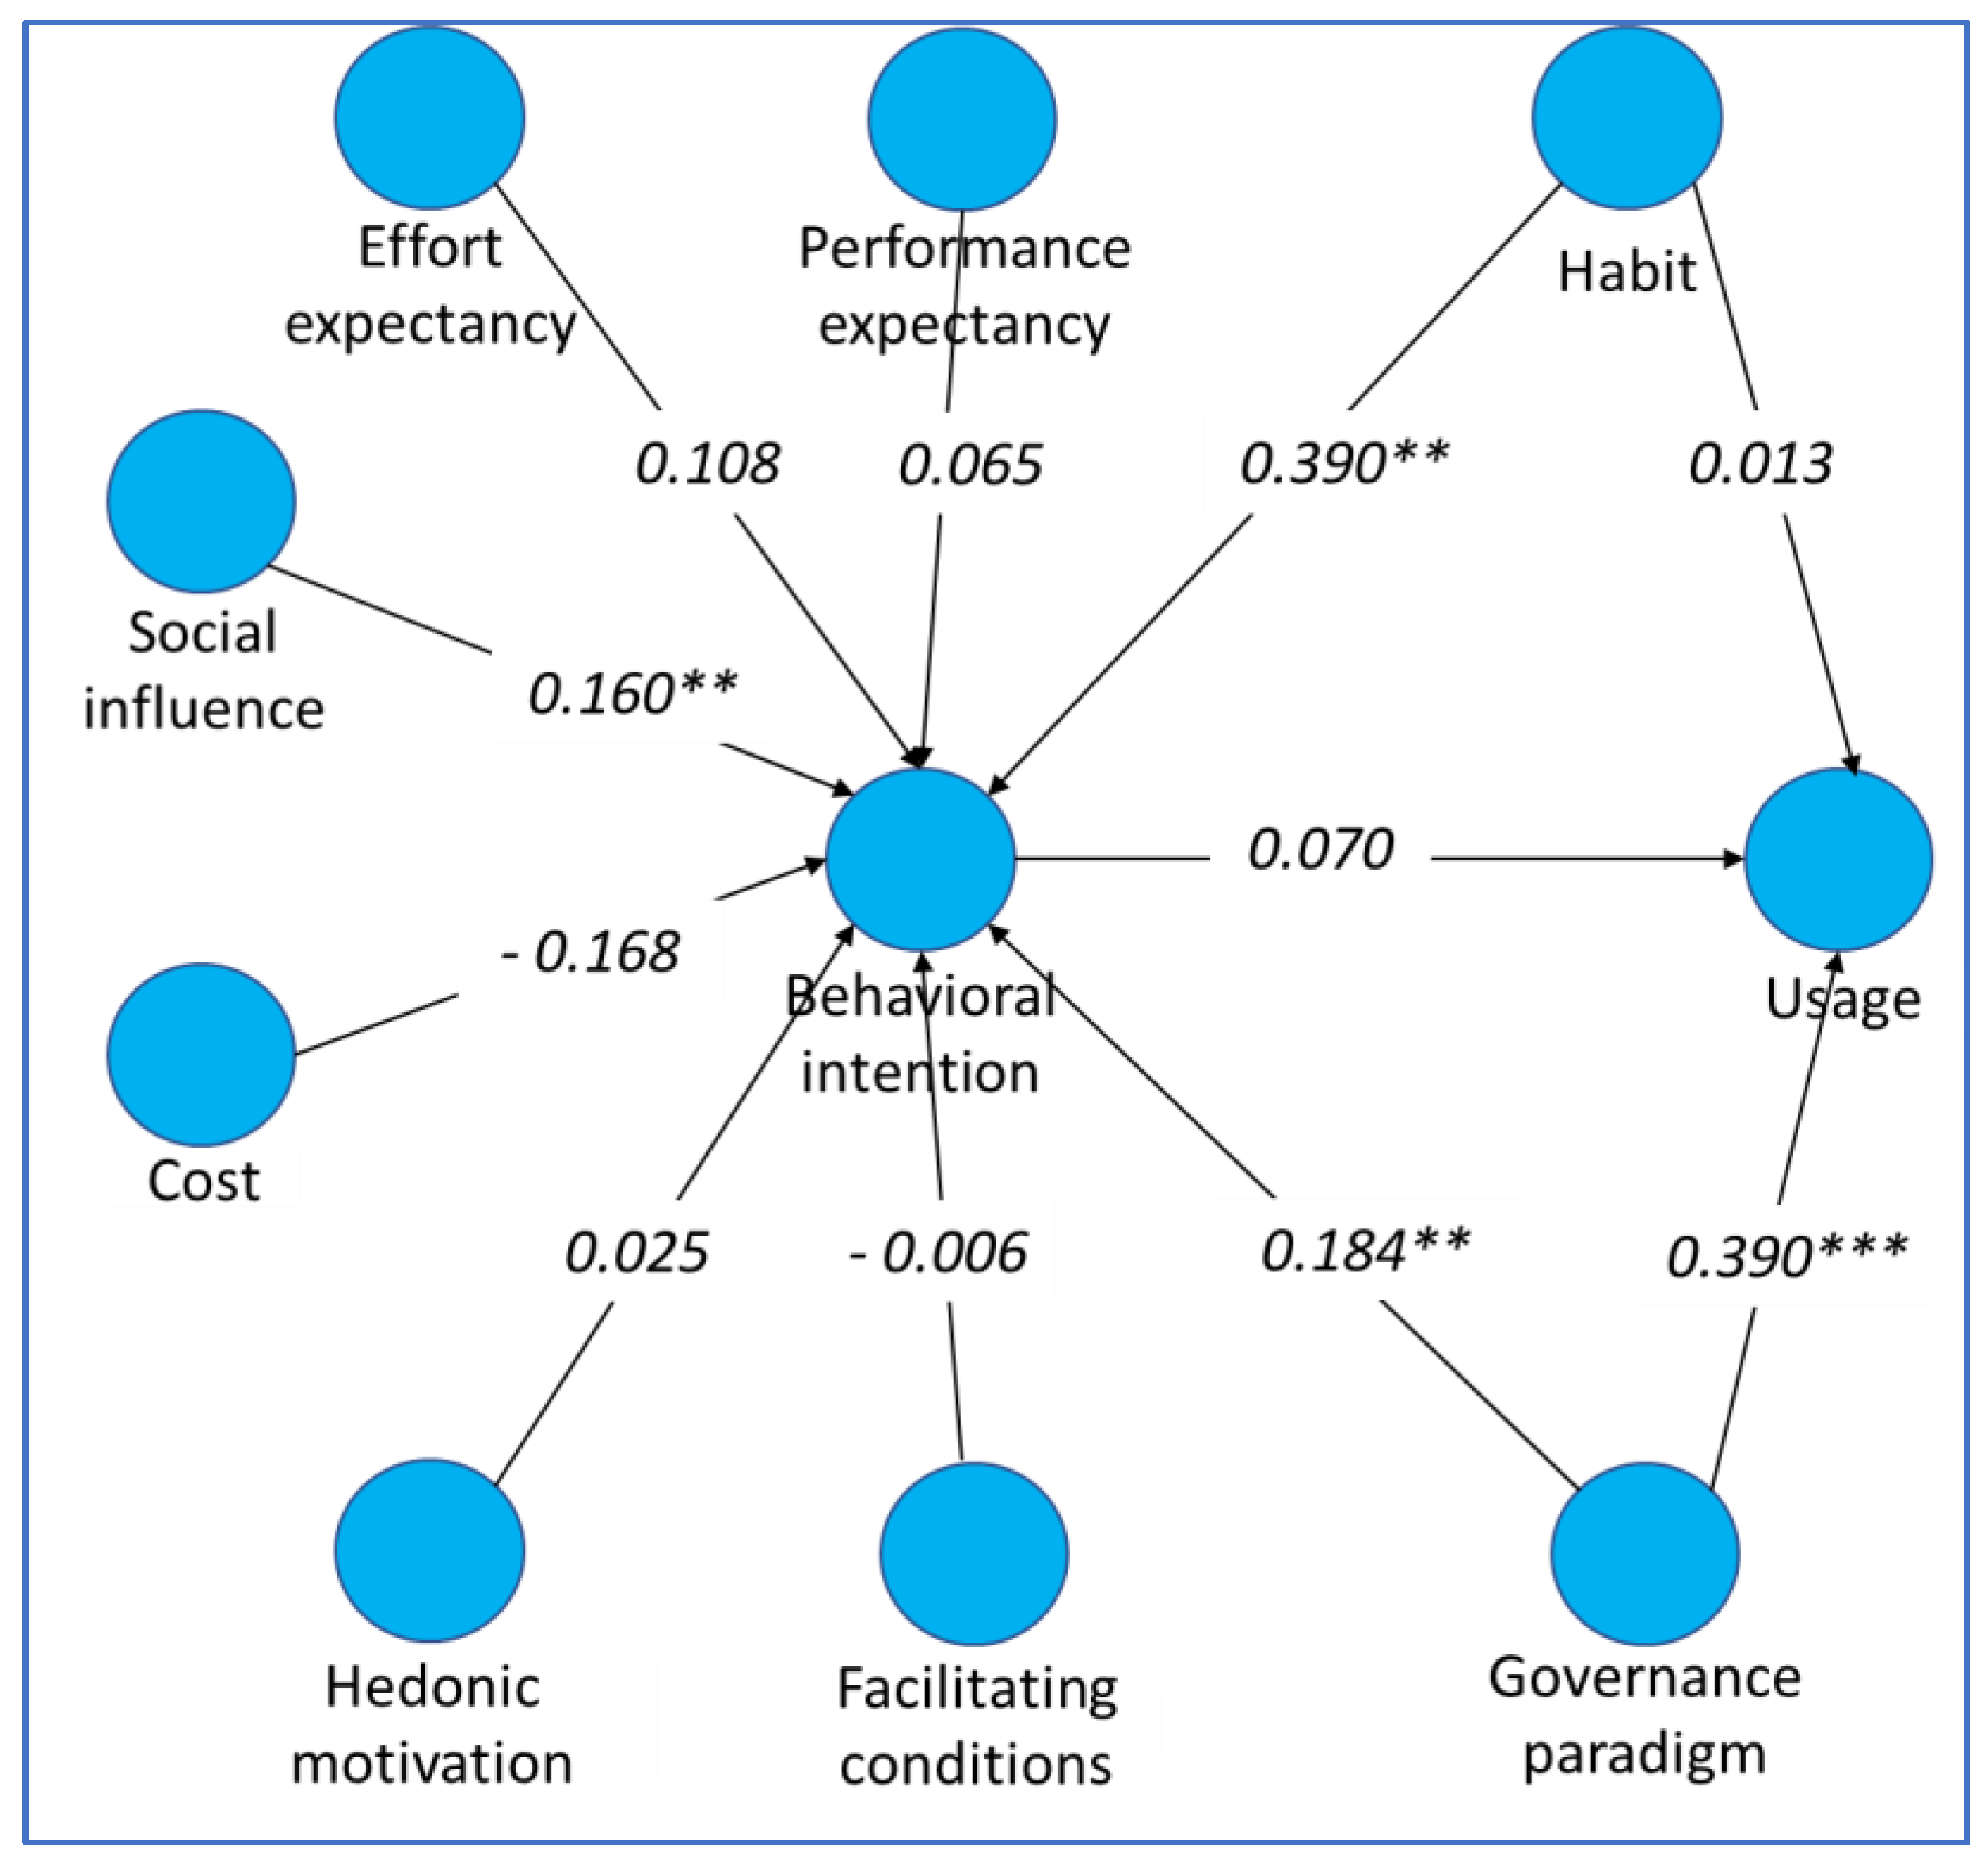
Figure 3.
Structural (inner) model for the pooled sample. Note: ** p < 0.05; *** p < 0.001.

| Governance Paradigm | Coordination Mode | Services as a…? | Role of Citizen | Performance Evaluation | Type of Innovation |
|---|---|---|---|---|---|
| Traditional Public Administration (TPA) | Bureaucracy Hierarchy Top-down governance Monopoly Monitoring based on control of processes | Standard “Good” or quasi-product | Passive user/consumer. Client, who expresses his preferences through office elections or as instructed | Objective, tangible output metrics (e.g., productivity, efficiency) Cost-benefit analysis Goods-Dominant Logic | Technological Linear (new product development) Internal to the public organization Top-down driven Politicians are the decision makers and process owners |
| New Public Management (NPM) | The market decides Competition Privatization Public-private partnerships and outsourcing Hierarchy Top-down governance Departments, areas (silos) | “Marketable good” or a market quasi- product | User and customer, who can freely choose the service and make public services compete Tester | Market and mostly economic and political metrics (e.g., outputs, costs, returns, loyalty, reputation) Goods-Dominant Logic and Market-Dominant Logic | Technological Linear (new product development) Internal to the public organization Top-down driven Managers are process owners Politicians are the decision makers |
| New Public Governance (NPG) Public Service Logic (PSL) | Networks (formal and informal) Multi-agent partnerships Horizontal governance | Service (immaterial, co-produced, un-stockable) Product/service bundle | Co-designer Co-producer | Multicriteria evaluation: objective and subjective Evolution/time Complex leading and lagging indicators Service-Dominant Logic | Technological and non-technological, including social innovation Linear and non-linear (new product development and new service development) Multi-agent, internal and external The network owns the process Bottom-up and top-down ways Most decisions have political implications, but their scope is usually narrower |
Table 2.
Public service innovation practice types.
| Type of Innovation Practice | Description |
|---|---|
| Linear and closed [18] | Although the science-push model [54] prevailed in the public sector connected to the TPA paradigm, the market demand for innovation was considered relevant following economists such as Schmookler [55]. Today, most administrations and governments act following market demands, which then call for applied research and technical development, hence innovation; this is the antecedent of the NPM paradigm. The demand-pull model and the “government” push model have very different policy implications, but they are enacted similarly: idea, concept design, development, launch, post-service. This linear deployment is popularly referred to as a traditional, stage-gate, or incremental means of executing a service (also called new product development—NPD [28,56]). |
| Interactive and open or networked [19] | Neither the science-push nor the demand-pull models are sufficient to explain how design and implementation of services work if a manager applies a service logic. In 1986, Kline and Rosenberg [19] proposed the interactive chain-link model; this is a highly effective representation of the complex public service production reality, with its constant feedback loops, and potential step-backs. Subsequently, Blank’s [57] customer development process, agile software experimentation [49,50], and business model design [58,59,60] further clarified this non-linear process. All of these references assume that the relevant stakeholders must be present and contribute to the design and deployment of an innovation from the inception of the idea, rather than merely validating, agreeing, or giving feedback, in the final development steps of any service [19,52]. |
Table 3.
Distribution of observations by employee rank.
| Employee | Mid-mngr | Senior mngr | Total | |
|---|---|---|---|---|
| Female | 24 | 26 | 22 | 72 (32%) |
| ECON | 10 | 14 | 8 | 32 |
| Collaborative | 4 | 6 | 3 | 13 |
| Conventional | 5 | 7 | 5 | 17 |
| No practice | 1 | 1 | - | 2 |
| TBL | 14 | 12 | 14 | 40 (56%) |
| Collaborative | 5 | 4 | 4 | 13 |
| Conventional | 9 | 7 | 10 | 26 |
| No practice | - | 1 | - | 1 |
| Male | 47 | 44 | 64 | 155 (68%) |
| ECON | 19 | 17 | 27 | 63 |
| Collaborative | 5 | 4 | 11 | 20 |
| Conventional | 13 | 13 | 12 | 38 |
| No practice | 1 | - | 4 | 5 |
| TBL | 28 | 27 | 37 | 92 (59%) |
| Collaborative | 14 | 13 | 14 | 41 |
| Conventional | 14 | 13 | 22 | 49 |
| No practice | - | 1 | 1 | 2 |
| Total | 71 (31%) | 70 (31%) | 86 (38%) | 227 |
Notes: Collaborative—using practices such as networks of public-private agents for social innovation, participatory practices (world cafe, open space, wise action), experimentation and iteration. Conventional—using practices such as surveys and polls, traditional prototyping, traditional public-private partnerships. No practice—using no concrete practice, but a mixed toolbox. ECON—agency concentrates only on economic goals (according to respondents). TBL—agency concentrates on economic, social, and environmental goals (according to respondents).
Table 4.
Items forming the reflective constructs.
| Loading | Mean | SD | VIF | Cronbach’s Alpha | rho_A | Composite Reliability | Average Variance Extracted (AVE) | |
|---|---|---|---|---|---|---|---|---|
| (BI1) ← BI | 0.797 | 0.797 | 0.035 | 2.146 | 0.771 | 0.773 | 0.854 | 0.594 |
| (BI2) ← BI | 0.774 | 0.773 | 0.040 | 2.079 | - | - | - | - |
| (BI3) ← BI | 0.796 | 0.794 | 0.034 | 2.078 | - | - | - | - |
| (BI4) ← BI | 0.712 | 0.711 | 0.046 | 2.128 | - | - | - | - |
| (EE10) ← EE | 0.750 | 0.747 | 0.061 | 1.485 | 0.638 | 0.637 | 0.805 | 0.579 |
| (EE1) ← EE | 0.769 | 0.764 | 0.050 | 1.541 | - | - | - | - |
| (EE2) ← EE | 0.763 | 0.758 | 0.057 | 1.338 | - | - | - | - |
| (FC1) ← FC | 0.798 | 0.745 | 0.150 | 1.327 | 0.710 | 0.742 | 0.814 | 0.525 |
| (FC4) ← FC | 0.746 | 0.703 | 0.141 | 1.501 | - | - | - | - |
| (FC5) ← FC | 0.622 | 0.588 | 0.226 | 1.328 | - | - | - | - |
| (FC6) ← FC | 0.721 | 0.677 | 0.201 | 1.257 | - | - | - | - |
| (HT2) ← HT | 0.804 | 0.802 | 0.041 | 1.626 | 0.757 | 0.781 | 0.859 | 0.671 |
| (HT4) ← HT | 0.783 | 0.778 | 0.044 | 1.457 | - | - | - | - |
| (HT6) ← HT | 0.868 | 0.868 | 0.023 | 1.555 | - | - | - | - |
| (HM4) ← HM | 0.648 | 0.643 | 0.075 | 1.203 | 0.780 | 0.785 | 0.860 | 0.607 |
| (HM1) ← HM | 0.813 | 0.809 | 0.047 | 1.757 | - | - | - | - |
| (HM2) ← HM | 0.815 | 0.811 | 0.049 | 1.777 | - | - | - | - |
| (HM5) ← HM | 0.827 | 0.825 | 0.036 | 1.397 | - | - | - | - |
| (SI22) ← SI | 1.000 | 1.000 | 0.000 | 1.000 | 1.000 | 1.000 | 1.000 | 1.000 |
| HTMT Matrix (Discriminant Validity) | ||||||||
| BI | EE | FC | HM | HT | ||||
| EE | 0.470 | - | - | - | - | - | - | - |
| FC | 0.326 | 0.432 | - | - | - | - | - | - |
| HM | 0.313 | 0.693 | 0.317 | - | - | - | - | - |
| HT | 0.558 | 0.204 | 0.369 | 0.132 | - | - | - | - |
| SI | 0.352 | 0.531 | 0.264 | 0.635 | 0.136 | - | - | - |
Note: Items in bold are showing the strongest path loadings/weights per composite variable.
Table 5.
Indicators forming the formative constructs.
| Weight (Loading) | Mean | SD | VIF | |
|---|---|---|---|---|
| (CO4) → CO | 0.992 (0.819) | 0.669 | 0.635 | 1.098 |
| (GP1) → GP | 0.377 ** | 0.361 | 0.145 | 1.163 |
| (GP7) → GP | 0.259 (0.553) | 0.254 | 0.168 | 1.229 |
| (GP4) → GP | 0.711 *** | 0.702 | 0.114 | 1.186 |
| (PE3) → PE | 0.432 ** | 0.424 | 0.157 | 1.069 |
| (PE10) → PE | 0.46 ** | 0.457 | 0.160 | 1.006 |
| (PE5) → PE | 0.54 ** | 0.521 | 0.158 | 1.070 |
| (US10) → US | 0.416 ** | 0.384 | 0.151 | 1.730 |
| (US1) → US | 0.429 ** | 0.406 | 0.147 | 1.152 |
| (US2) → US | 0.217 (0.585) | 0.214 | 0.147 | 1.385 |
| (US5) → US | 0.479 ** | 0.443 | 0.152 | 1.290 |
Notes: ** p < 0.05; *** p < 0.001.
Table 6.
Path coefficients, effect size, and collinearity values of the inner model constructs.
| Complete | Path Coefficients | f-Squared | VIF |
|---|---|---|---|
| BI → US | 0.070 | 0.004 | 1.573 |
| CO → BI | −0.168 | 0.043 + | 1.078 |
| CO → US | −0.001 | 0.000 | 1.122 |
| EE → BI | 0.108 | 0.014 | 1.539 |
| EE → US | −0.022 | 0.001 | 1.557 |
| FC → BI | −0.006 | 0.000 | 1.234 |
| FC → US | −0.030 | 0.001 | 1.234 |
| GP → BI | 0.184 ** | 0.038 + | 1.172 |
| GP → US | 0.390 *** | 0.163 ++ | 1.225 |
| HM → BI | 0.025 | 0.002 | 1.844 |
| HM → US | 0.202 * | 0.029 + | 1.845 |
| HT → BI | 0.390 ** | 0.224 ++ | 1.095 |
| HT → US | 0.013 | 0.000 | 1.335 |
| PE → BI | 0.065 | 0.003 | 1.438 |
| PE → US | 0.181 ** | 0.030 + | 1.444 |
| SI → BI | 0.160 ** | 0.016 | 1.534 |
| SI → US | −0.020 | 0.000 | 1.574 |
| R2 = 0.307; q2 = 0.077 | |||
Table 7.
Path coefficients, effect size, and collinearity values of the inner model constructs for the PLS-POS group #1.
Table 7.
Path coefficients, effect size, and collinearity values of the inner model constructs for the PLS-POS group #1.
| Path Coefficients | f-Squared | VIF | |
|---|---|---|---|
| BI → US | −0.221 | 0.066 + | 4.068 |
| CO → BI | −0.435 ** | 0.679 +++ | 1.131 |
| CO → US | −0.370 ** | 0.394 +++ | 1.899 |
| EE → BI | 0.721 *** | 1.367 +++ | 1.546 |
| EE → US | 0.361 ** | 0.195 ++ | 3.660 |
| FC → BI | 0.324 ** | 0.281 ++ | 1.525 |
| FC → US | 0.316 ** | 0.279 ++ | 1.953 |
| GP → BI | 0.123 | 0.055 + | 1.117 |
| GP → US | 0.224 ** | 0.233 ++ | 1.178 |
| HM → BI | 0.130 | 0.042 + | 1.624 |
| HM → US | 0.209 ** | 0.141 + | 1.693 |
| HT → BI | −0.021 | 0.001 | 1.296 |
| HT → US | −0.313 ** | 0.414 +++ | 1.298 |
| PE → BI | −0.761 *** | 1.138 +++ | 2.073 |
| PE → US | 0.217 | 0.058 + | 4.431 |
| SI → BI | 0.272 ** | 0.212 ++ | 1.423 |
| SI → US | −0.046 | 0.007 | 1.724 |
| R2 = 0.817; q2 = 0.190 | |||
Table 8.
Mediation size of Behavioral Intention for the PLS-POS group #1.
| Mediation Effect Size | |
|---|---|
| CO → US | 26% |
| EE → US | 44% |
| FC → US | 23% |
| GP→US | 12% |
| PE → US | 78% |
Table 9.
Path coefficients, effect size, and collinearity values of the inner model constructs for the PLS-POS group #2.
Table 9.
Path coefficients, effect size, and collinearity values of the inner model constructs for the PLS-POS group #2.
| Path Coefficients | f-Squared | VIF | |
|---|---|---|---|
| BI → US | −0.058 | 0.009 | 2.529 |
| CO → BI | 0.002 | 0.000 | 1.073 |
| CO → US | 0.088 | 0.049 + | 1.073 |
| EE → BI | 0.067 | 0.009 | 1.225 |
| EE → US | −0.040 | 0.007 | 1.237 |
| FC → BI | 0.086 | 0.016 | 1.166 |
| FC → US | −0.048 | 0.011 | 1.184 |
| GP → BI | −0.089 | 0.017 | 1.189 |
| GP → US | 0.710 *** | 2.763 +++ | 1.209 |
| HM → BI | −0.232 * | 0.075 | 1.803 |
| HM → US | 0.595 *** | 1.174 +++ | 1.938 |
| HT → BI | 0.554 *** | 0.512 +++ | 1.517 |
| HT → US | 0.194 | 0.150 ++ | 2.295 |
| PE → BI | 0.391 ** | 0.237 ++ | 1.633 |
| PE → US | −0.432 ** | 0.559 +++ | 2.020 |
| SI → BI | 0.089 | 0.012 | 1.698 |
| SI → US | 0.287 | 0.334 ++ | 1.718 |
| R2 = 0.851; q2 = 0.140 | |||
Table 10.
Mediation size of Behavioral Intention for the PLS-POS group #2.
| Mediation Effect Size | |
|---|---|
| GP → US | 1% |
| HM → US | 2% |
| PE → US | 6% |
Table 11.
Path coefficients, effect size, and collinearity values of the inner model constructs for the PLS-POS group #3.
Table 11.
Path coefficients, effect size, and collinearity values of the inner model constructs for the PLS-POS group #3.
| Path Coefficients | f-Squared | VIF | |
|---|---|---|---|
| BI → US | 0.263 | 0.069 + | 2.529 |
| CO → BI | −0.334 * | 0.328 ++ | 1.073 |
| CO → US | 0.065 | 0.052 + | 1.073 |
| EE → BI | −0.338 ** | 0.166 ++ | 1.225 |
| EE → US | −0.150 | 0.005 | 1.237 |
| FC → BI | −0.077 | 0.014 | 1.166 |
| FC → US | −0.517 | 0.594 +++ | 1.184 |
| GP → BI | 0.389 *** | 0.381 +++ | 1.189 |
| GP → US | 0.426 ** | 0.192 ++ | 1.209 |
| HM → BI | 0.469 *** | 0.382 +++ | 1.803 |
| HM → US | 0.011 | 0.016 | 1.938 |
| HT → BI | 0.310 *** | 0.251 ++ | 1.517 |
| HT → US | 0.501 ** | 0.370 +++ | 2.295 |
| PE → BI | −0.116 | 0.039 + | 1.633 |
| PE → US | 0.387 | 0.486 +++ | 2.020 |
| SI → BI | 0.214 ** | 0.079 + | 1.698 |
| SI → US | 0.180 | 0.024 + | 1.718 |
| R2 = 0.679; q2 = 0.045 | |||
Table 12.
Mediation size of Behavioral Intention for the PLS-POS group #3.
| Mediation Effect Size | |
|---|---|
| GP → US | 32% |
| HT → US | 19% |
Publisher’s Note: MDPI stays neutral with regard to jurisdictional claims in published maps and institutional affiliations. |
© 2021 by the authors. Licensee MDPI, Basel, Switzerland. This article is an open access article distributed under the terms and conditions of the Creative Commons Attribution (CC BY) license (https://creativecommons.org/licenses/by/4.0/).
Share and Cite
MDPI and ACS Style
Peralta, A.; Rubalcaba, L. How Governance Paradigms and Other Drivers Affect Public Managers’ Use of Innovation Practices. A PLS-SEM Analysis and Model. Mathematics 2021, 9, 1055. https://0-doi-org.brum.beds.ac.uk/10.3390/math9091055
AMA Style
Peralta A, Rubalcaba L. How Governance Paradigms and Other Drivers Affect Public Managers’ Use of Innovation Practices. A PLS-SEM Analysis and Model. Mathematics. 2021; 9(9):1055. https://0-doi-org.brum.beds.ac.uk/10.3390/math9091055
Chicago/Turabian StylePeralta, Alberto, and Luis Rubalcaba. 2021. "How Governance Paradigms and Other Drivers Affect Public Managers’ Use of Innovation Practices. A PLS-SEM Analysis and Model" Mathematics 9, no. 9: 1055. https://0-doi-org.brum.beds.ac.uk/10.3390/math9091055
Note that from the first issue of 2016, this journal uses article numbers instead of page numbers. See further details here.