Article

Effect of Quality Lean Manufacturing Tools on Commercial Benefits Gained by Mexican Maquiladoras

by
Jorge Luis García Alcaraz
1,*,
Flor Adriana Martínez Hernández
1,
Jesús Everardo Olguín Tiznado
2,
Arturo Realyvásquez Vargas
3,
Emilio Jiménez Macías
4 and
Carlos Javierre Lardies
5
1
Department of Industrial Engineering and Manufacturing, Autonomous University of Ciudad Juárez, Juarez 32310, Mexico
2
Faculty of Engineering, Architecture and Design, Autonomous University of Baja California, Ensenada 22860, Mexico
3
Department of Industrial Engineering, Instituto Tecnológico de Tijuana, Tijuana 22414, Mexico
4
Department of Electric Engineering, University of La Rioja, 26006 La Rioja, Spain
5
Department of Mechanical Engineering, University of Zaragoza, 50009 Zaragoza, Spain
*
Author to whom correspondence should be addressed.
Submission received: 25 March 2021 / Revised: 20 April 2021 / Accepted: 23 April 2021 / Published: 26 April 2021

Abstract

:
Companies implement lean manufacturing (LM) tools in their production processes to reduce waste; however, it is difficult to quantify the effect on benefits gained after their implementation. This article proposes a structural equations model (SEM) that relates three LM tools associated with quality as total quality management (TQM), waste, and right first time (RFT) as independent variables associated with commercial benefits gained as a dependent variable. Those four variables were related by six hypotheses that were validated with information from 169 responses to a survey applied to the Mexican maquiladora industry. Partial least squared was used to validate the hypotheses as direct effects. The sum of indirect and total effects was also estimated, and a sensitivity analysis was developed for relationships between variables. Findings indicate that TQM directly affects waste reduction, drives doing RFT, and directly and indirectly affects the commercial benefits gained.

1. Introduction

The industry in a nation plays an essential role in its development, and therefore its administrative and operational practices are often studied. Specifically, programs have focused on improving national industries in Mexico such as the maquiladora industry. Foreign companies establish subsidiaries in Mexican territory, where manufacturing activities require a high level of workforce. These maquiladoras are closer to the world’s largest market, the United States of America [1], and take advantage of various tariff benefits when exporting their products due to the free trade agreements that Mexico has with the United States of America and Canada, which are low or preferential. These tariff rates are different if these companies export their products from the headquarters in their country of origin.
Currently, there are 5153 maquiladora companies established in Mexican territory, 495 of which are in the State of Chihuahua, representing 9.6% of the national total and specifically in Ciudad Juárez, there are 332, representing 6.44% of the national total and 67.1% of the state total. Maquiladora companies directly provide 2,689,209 direct jobs nationwide, 477,480 corresponding to the State of Chihuahua and 361,619 to Ciudad Juárez; hence the importance of studying this sector [2].
Along with maquiladoras being established in Mexico, some philosophies, techniques, and tools applied to production systems are arriving. One of the most important is lean manufacturing (LM), which consists of tools that help to identify and eliminate operations that do not add value to the product, service, or process. However, as Alfieri, et al. [3] mentioned, the concept is still unclear after decades of application. Nevertheless, there is consensus that LM is focused on Wastes elimination, inventories, and space reduction, generating robust production systems, and providing agility and flexibility.
LM tools are classified according to their focus on the production process; some are focused on the production system’s operational stability, others have focused on the flow of materials and on quality [3]. Together, all are focused on obtaining a more significant reduction of waste and guaranteeing product quality at a lower cost, having a customer focus with small production batches, and providing high safety and morale in workers [4].
Companies that apply LM tools hope to obtain some operational, economic, commercial, social, or environmental benefit. Many studies have been carried out in this regard over the last two decades. For example, Melton [5] in 2005 had already considered what lean thinking offered to industries, while Rajenthirakumar and Shankar [6] analyzed the benefits that LM tools provide to a company that manufactures durable products. Recently, Islam [4] examined whether the manufacturer or suppliers obtained more benefits by applying LM to each other, while Palange and Dhatrak [3] concluded that LM was vital to achieving the productivity rates of the companies. However, Hao, et al. [7] stated that it is often challenging to award to LM or some of its tools the benefits obtained since several are implemented simultaneously in the production lines.
Other studies have focused on identifying the benefits that companies gain from a specific LM tool. For example, García-Alcaraz et al. [8] reported the benefits obtained by just-in-time (JIT) in operational performance; Singh et al. [9] analyze the impact of Total Quality Management (TQM) on organizational performance, and Sahoo and Yadav [10] report the benefits of Total Productive Maintenance (TPM) and TQM on operational performance.
Specifically, the commercial and economic effects that LM has on companies has also been reported. For example, as early as the past decade, Meade, et al. [11] simulated the financial effects obtained from LM implementation to determine its viability; Fullerton, et al. [12] related LM tools to operational performance and how to generate financial performance, and recently, Shashi et al. [13] identified the economic benefits obtained from LM in small and medium enterprises in India.
However, there are also barriers in LM implementation that avoid receiving the financial and Commercial benefits. For example, Elkhairi et al. [14] mentioned that the most common barriers were a lack of planning, experience, managerial commitment, misunderstanding of LM, lack of resources, and resistance to change; while Abu et al. [15] indicated that companies without the technical knowledge to implement LM sometimes subcontract external consultants who do not know the real needs of the company. Then, there are barriers such as lack of training and education, strong unions that do not accept improvement changes, and long and complicated hierarchical structures in which communication is slow with information lost.
In the maquiladora industry, one of the most used LM tools is TQM, which focuses on generating awareness at the organizational level about the importance of developing products and services that meet customer expectations [16]. Although some authors declare that TQM is a LM tool such as Lynn [17] and Sisternas [18], others such as Salleh et al. [19] consider that TQM and LM are different techniques. In this research, the authors decided to integrate TQM as a LM tool because that is the industrial practice in the maquiladora sector.
Although the relationship between LM tools and company performance makes common sense, very few authors have studied it. For example, York and Miree [20] reported the relationship between TQM and financial performance; Singh, Kumar, and Singh [9] analyzed TQM and its impact on the general performance of companies; Moitra [21] examined the role of human resources in the success of TQM; Green et al. [22] reported that TQM impacted environmental sustainability; and García-Alcaraz et al. [23] analyzed the TQM structure and its effect on customer satisfaction.
Although TQM is a complete LM tool, it is sometimes studied separately and requires support from other tools that focus on eliminating Wastes, and RFT, which guarantees obtaining Commercial benefits that mean the best economic performance. The relationship of these variables makes common sense, since, if there are no Wastes in resources and the products are produced Right first time, it means that there are no rework or losses in the raw material, and, therefore, greater benefits and reputation are obtained for the company. However, the relationships between these variables have not been quantified, so this article presents a structural equation model (SEM) with three independent variables associated with quality such as TQM, Wastes, and RFT related to each other and to the Commercial benefits that companies obtain.
Quantifying the relationships between TQM, Wastes, RFT, and Commercial benefits, our findings will support the managers’ decision-making process in maquiladoras to identify those essential activities for achieving the commercial objectives. This will allow them to focus on human, material, and economic resource management.

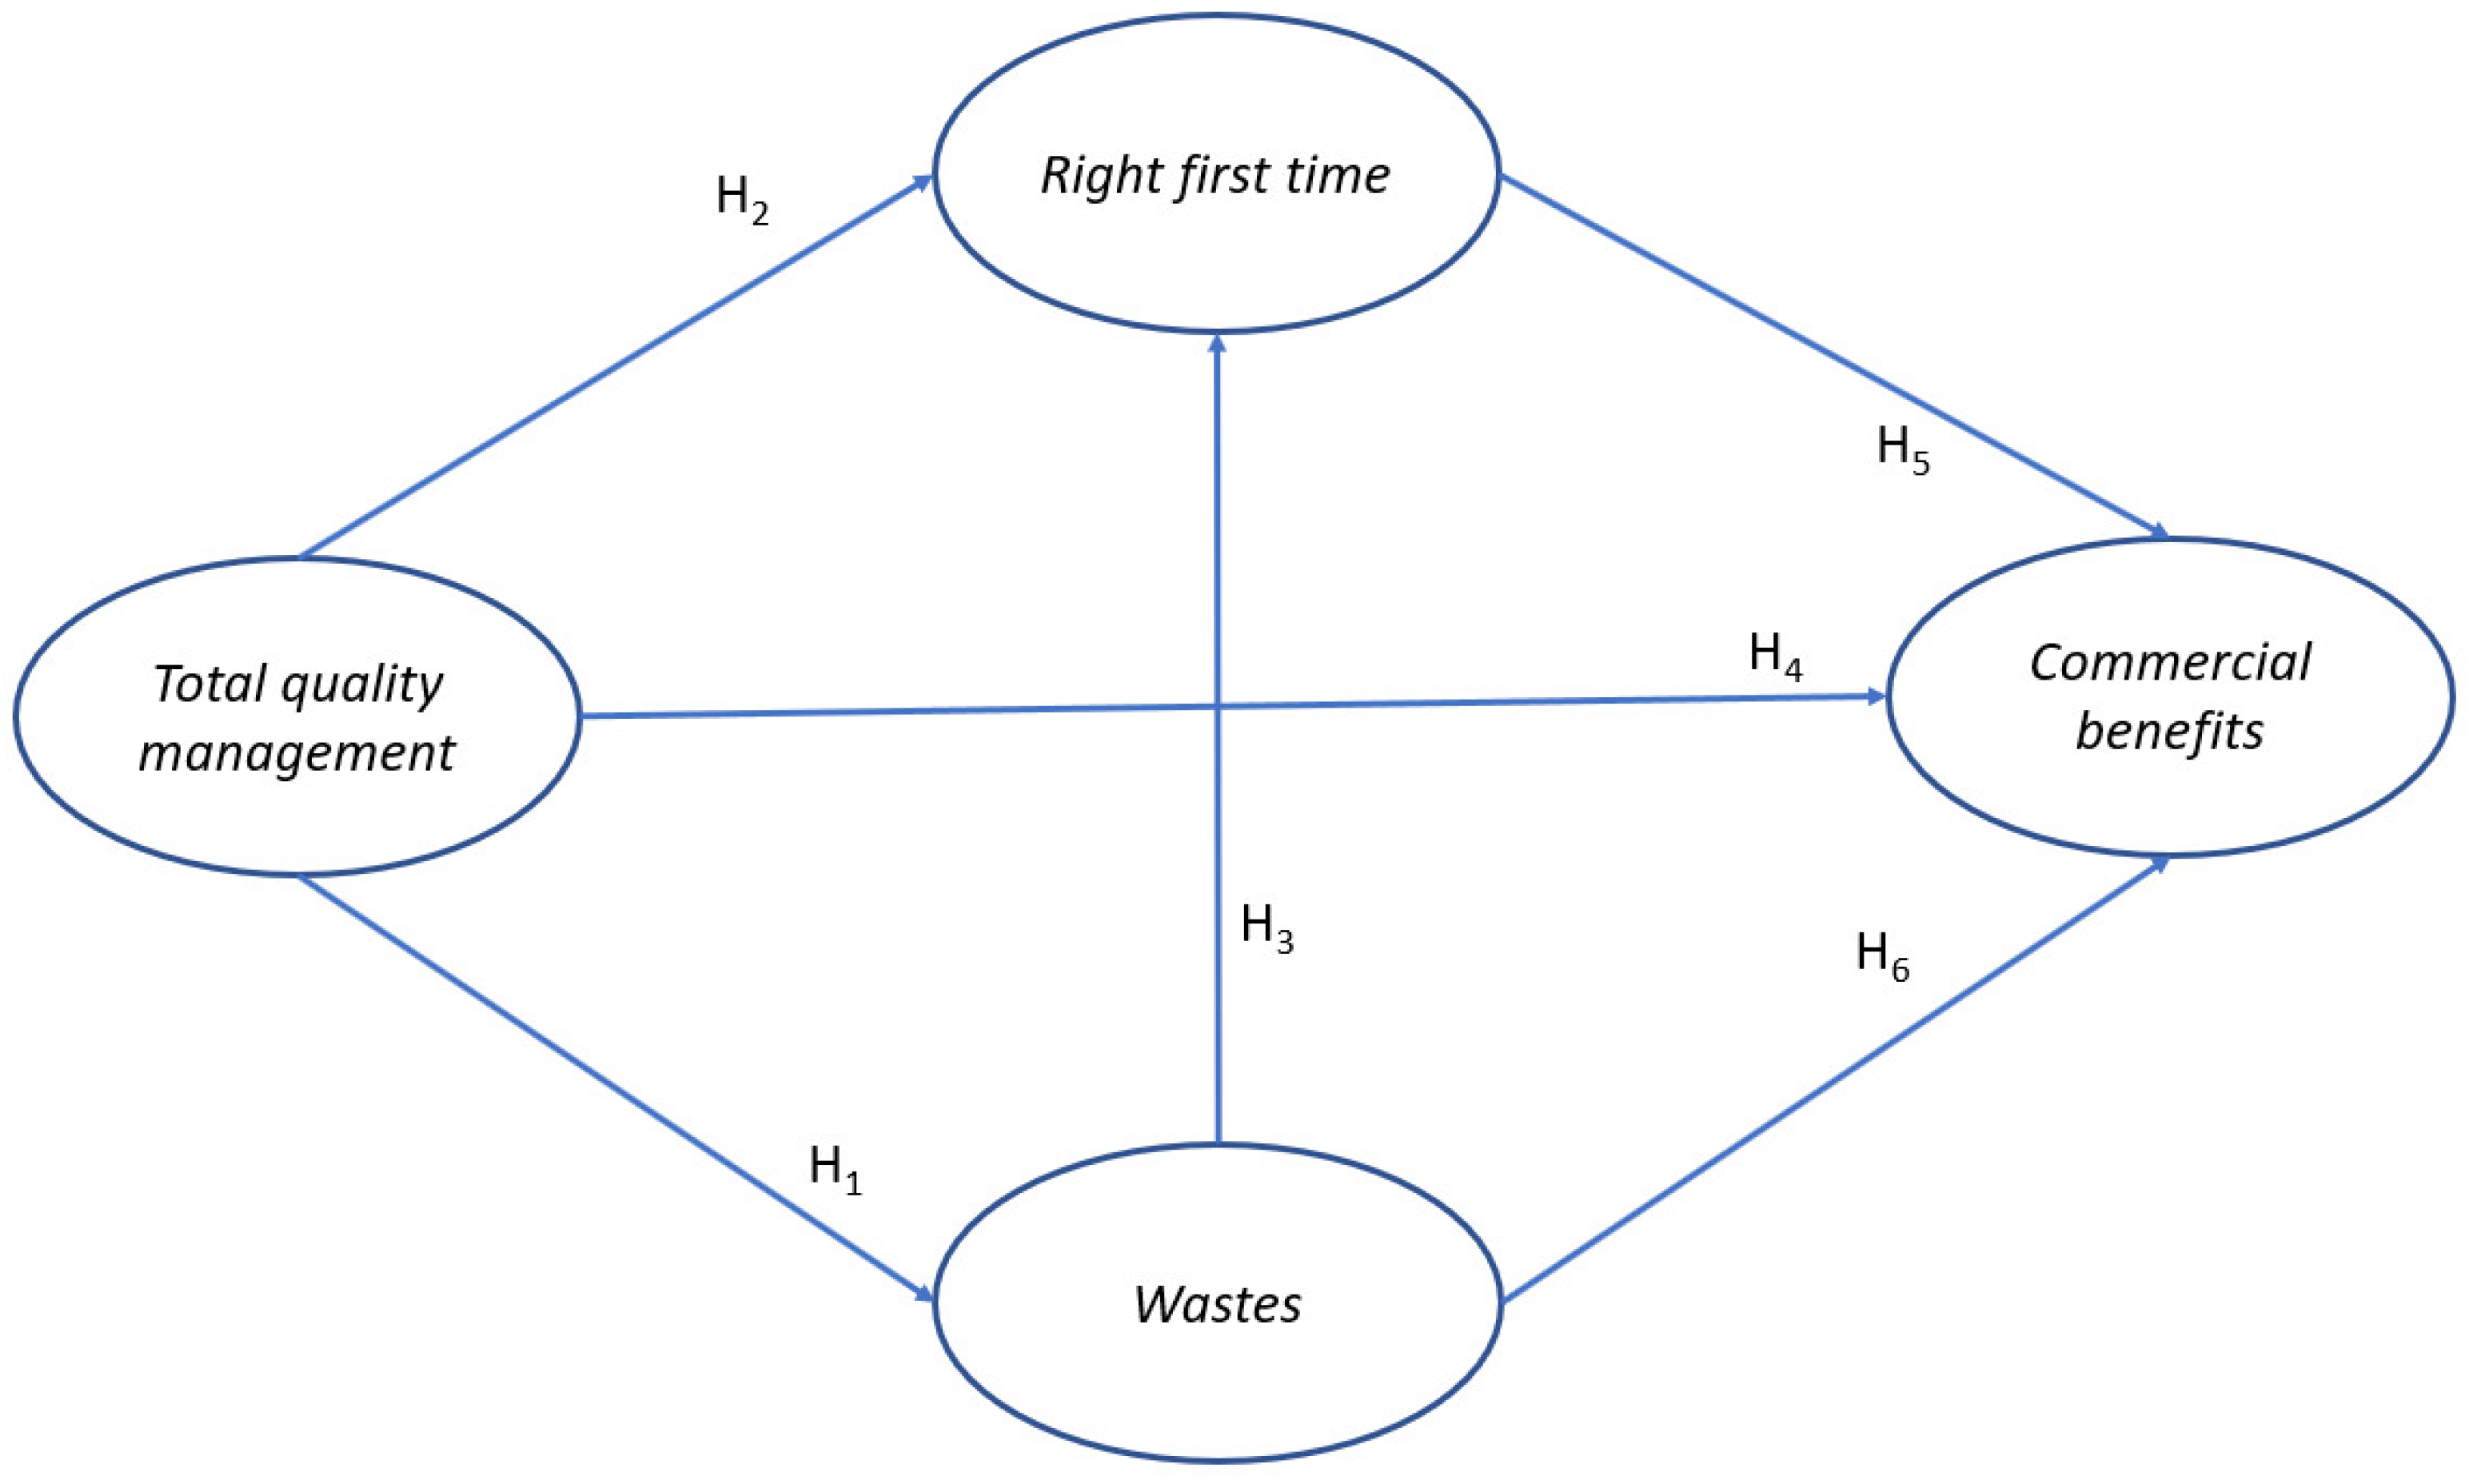
2. Hypothesis and Literature Review

2.1. TQM

TQM’s programs are a set of techniques, procedures, and methods that serve as the basis for ensuring quality in products and services, and proof of this is that many standards govern them such as ISO-9001 for management systems, ISO 19011 for audits of these systems, and ISO16946 for quality in the automotive sector, among others. However, standards alone do not guarantee quality as they are just guidelines, and their success depends on the people who implement them [21], indicating that several critical success factors (CSFs) of TQM are required. Sreedharan et al. [24] noted that the main ones were management engagement, communication, training, customer focus, and organizational culture.
Therefore, TQM requires dissemination throughout the organizational structure, and from receiving the raw material up until it becomes a finished product, always focused on the customer. TQM practices gain knowledge that companies must manage to grow and solve future problems [25] as this tool acts as a facilitator [26].

2.2. Waste

A production process that generates Wastes has poor quality and is not standardized [27], concluding that some LM-based tools have not been applied correctly. Waste is any element within the production process that does not add value to the final product, but adds cost [28]. There are seven types of Waste reported in the literature: overproduction, waiting, transportation, inadequate processes, unnecessary inventory, excessive movement of elements, and excess defects [29], which represent economic losses for the company, and value stream mapping is a tool that can help to discover them [30].
Given that eliminating all Wastes and increasing quality cost money, these two variables are related because a product generated with Wastes in the production process and defects is usually cheaper than those that do not have them. Therefore, there must be a balance among them (quality and Wastes) [31], and that is not a new problem. Womack and Jones [32] indicated that they considered Waste reduction to be the basis for generating Economic benefits for the company. Then, the following hypothesis is proposed.
Hypothesis 1 (H1).
TQM implementation in the maquiladora industry has a direct impact on waste reduction.

2.3. Doing It RFT

As the name implies, RFT emphasizes that production processes are correct. Its implementation requires analysis of the available quality indices, focusing on identifying problems associated with human error to propose improvement strategies systematically. This technique has its origin with Philip B. Crosby, who presented the motto of “zero defects” and RFT. However, today, many applications of RTF are seen in the medical and health areas, where errors can be fatal causes.
Industrial applications of RFT have been observed in reports by Moshiri et al. [33] in additive manufacturing processes in Industry 4.0, and Eldessouky et al. [34] proposed a contextual framework for RFT when the process generates waste and the raw material is expensive. Therefore, there is no doubt that RFT is part of TQM’s programs. The number of defects in a product is a critical metric [35] as well as the number of accidents that occur [36], indicating that the company has an efficient system for solving problems in its production process through its leaders [37] and TQM, so the following hypothesis was proposed.
Hypothesis 2 (H2).
TQM implementation in the maquiladora industry has a direct and positive impact on RFT.
Another critical aspect of RFT is that Wastes are not allowed from materials when they are expensive. If companies focus on eliminating Wastse in their production process, then the products may have the quality according to customer specifications [29,38]. In other words, if the number of products requiring rework is minimized due to programs focused on improving the process, then there is a greater likelihood of getting it right the first time. Additionally, if production methods have reduced transport times and operators have been trained, then the likelihood of getting it right the first time increases [39]. Besides, other quality-focused tools that support TQM such as six sigma help eliminate Wastes [40]. Therefore, this research proposes the following hypothesis:
Hypothesis 3 (H3).
Wastse implementation in the maquiladora industry has a direct and positive impact on RFT reduction in the maquiladora industry.

2.4. Commercial Benefits

Commercial benefits are the means of generating economic income in maquiladora companies. This is why managers strive to achieve them, which is reflected in reducing the costs of acquiring materials, using electricity, the rate paid for treatment and dumping of Wastes, and penalties for environmental fails. These problems affect the return on sales and investment and economic benefits, among others.
García-Alcaraz, Montalvo, Sánchez-Ramírez, Avelar-Sosa, Saucedo, and Alor-Hernández [23] declared that the organizational structure for TQM was the basis for achieving customer satisfaction and achieving a better market coverage. That indicates that the quality of a company’s products is the first thing that customers evaluate. Magdy and Tamer [41] stated that TQM is directly linked to the performance of companies, as it is how value is added to services. However, as indicated by Sila [35], the performance of companies in implementing TQM may be affected by the sector and the country; that is, by religious and cultural aspects. Then, the following hypothesis was proposed.
Hypothesis 4 (H4).
TQM implementation in maquiladora industries has a direct and positive impact on Commercial benefits obtained.
The benefits obtained from quality programs are not based on luck; they are the product of a broad cultural and philosophical deployment in this concept. For example, Kappelman and Prybutok [42] and Kassicieh and Yourstone [43] indicated that staff training is vital in avoiding mistakes, which was recently confirmed by García-Alcaraz et al. [44]. Trained operators will make fewer mistakes in their work, and therefore there will be low rework rates with savings in energy and labor, among others. In conclusion, there are protocols to follow to reduce Wastes that comply with the standards in the production process, thus allowing for obtaining social and commercial acceptance to take place before the customers. Then, the following hypothesis was proposed.
Hypothesis 5 (H5).
RFT implementation in the maquiladora industry has a direct and positive impact on the Commercial benefits they obtain.
Quality could not exist if there is Wastes in the production process. For example, if there is a significant transport in the materials, then the cost is increased, or if people make a lot of movement, they will be unproductive [45] and unsustainable [44]. Similarly, proper inventory management favors a circulation of the company’s material and economic goods, lowering the storage costs and final price. Sreedharan, Sunder, and Raju [24] saw the elimination of Wastes as a key to LM’s success, while Sahoo and Yadav [10] mentioned that the elimination of leisure time from machines in the production system facilitated deliveries on time and in the quantity and quality required. As such, the following hypothesis was proposed.
Hypothesis 6 (H6).
Wastes implementation in the maquiladora industry has a direct and positive impact on the Commercial benefits they obtain.
Figure 1 graphically represents all of the proposed hypotheses.

3. Methodology

3.1. Questionnaire Design

To validate the hypotheses statistically in Figure 1, a questionnaire was designed to obtain information from the maquiladora companies. It started with a literature review in scientific databases to learn about the activities required to implement the LM tools and their benefits. This literature review corresponded to rational validation.
These activities allowed for the validation of the level of implementation of the LM tools analyzed. The first draft of the questionnaire was generated and presented to seven managers of regional maquiladora companies and four academics to obtain validation by experts. After two rounds with the experts, a final questionnaire containing TQM, RFT, Wastes, and Commercial benefits with five, seven, six, and seven items, respectively. Such a questionnaire had to be answered on a six-point Likert scale, where one means that the activity is not performed or the profit is never obtained, while six indicates that the activity is always performed or that the benefit is always obtained. The final questionnaire with all LM tools is available in Martínez Hernández and García Alcaraz [46].
The questionnaire consists of three sections: Section 1 seeks to identify the demographic data of the respondent such as gender, years in the position, and number of employees in the company, among others. Section 2 contains the three tools and their activities, and finally, Section 3 evaluates the Commercial benefits obtained and thanks the respondent for their participation.

3.2. Application of the Questionnaire

With support from IMMEX (Manufacturing Industry, Maquiladora and Export Services), only one manager or engineer from each regional maquiladora was invited to answer the questionnaire. The questionnaire was designed on an online platform, and the electronic link was shared with potential respondents during the June–August 2020 period.
As inclusion criteria, respondents had to have at least one year of experience in their job position, were active, had participated in at least two quality projects completed to ensure that they understood the benefits gained, and only one person per company could respond to the survey. Thus, sampling was initially stratified, focusing only on a particular sector of managers or engineers within the company. Then, the snowball technique was used as the respondent was asked about other colleagues in different companies who could answer the questionnaire [47].
An email was sent with the electronic link to prospective respondents inviting them to participate in the investigation, and 15 days were given to receive a response. If an answer was not received, a second email was sent reminding them of the invitation, and if the answer was not received in another 15 days, that case was discarded.

3.3. Obtaining Information and Debugging It

In early September 2020, a database of the platform on which the questionnaire is broadcast is downloaded, read in SPSS software v.25®. Database debugging consists of the following activities [48]:
  • Identification of uncommitted respondents. The standard deviation was obtained from each case and those where it was less than 0.5 were omitted from the analysis.
  • Identification of missing values. If the percentage was lower than 10%, they were replaced by the median, but if the rate was higher, then that case was removed from the analysis.
Extreme values identification. The median replaced the standardized values greater than four in absolute value.

3.4. Descriptive Analysis of the Sample and Items

Crosstables were built to describe the sample with information from the demographic section. The median was reported as a central trend measure for describing the items since the information was on a Likert scale and the interquartile range as a deflection measure. High values in the median indicate that the activity is always performed or that a profit is always obtained. In contrast, low values in the median suggest that the activity is not executed or that the benefit is not obtained.

3.5. Validation of Latent Variables

With a debugged database, each latent variable in the model was validated, and the following indexes were used [49]:
  • Cronbach alpha index and composite reliability index to measure the reliability and internal consistency of variables, Values greater than 0.7 were accepted, being iteratively obtained.
  • R-squared and adjusted R-squared to measure the parametric predictive validity. Values greater than 0.02 were accepted and significantly associated with p-value.
  • Q-square to measure non-parametric predictive validity. This should be similar to the R-square value.
  • Average extracted variance (AVE) to measure the discriminant validity of each latent variable, which must be greater than 0.5.
  • Variance inflation indexes (VIFs) to measure collinearity in each construct, which should be lower than 3.3.
This paper contains Supplementary Materials reporting the T ratios for the path coefficients and their confidence intervals; factor loadings, their T ratios and confidence intervals; and PLSc reliabilities (Dijkstra’s rho), PLSc loadings, p-values for loadings (one-tailed), p-values for loadings (two-tailed), among others.

3.6. Structural Equation Modeling

The structural equation modeling methodology was chosen to validate the hypotheses in Figure 1 and the partial least squares technique integrated into WarpPLS v7.0® software was used. Latent variables already validated were integrated into the model, and the following indexes with a 95% confidence level were reviewed before being analyzed [48]:
  • Average path coefficient (APC) to measure the dependency between latent variables. p-values must be less than 0.05.
  • Average R-squared (ARS) and average adjusted R-squared (AARS) to measure predictive validity, and associated p-values lower than 0.05.
  • Average block VIF (AVIF) and average full collinearity VIF (AFVIF) to measure collinearity between variables. Values lower than 3.3 were accepted.
  • Tenenhaus GoF (GoF) to measure the fit of the data to the model, which must be greater than 0.36.
To validate the scenarios raised, the direct effects between the variables analyzed at a confidence level of 95% were calculated, so a standardized value was obtained, β, as a dependency measure. The null hypothesis H0 was tested, β = 0, against the alternative hypothesis H1 that β ≠ 0. If it was statistically proven that β = 0, then it was concluded that there is no relationship between the analyzed variables. Otherwise, if β ≠ 0, then it was supposed that there is a relationship between variables.
However, indirect effects were also calculated, which occur through a mediating variable and can have two or more segments, which help to understand the effects that do not directly occur. Finally, the total effects was estimated, which was the sum of direct and indirect effects. Indirect and total effects were estimated under the same assumptions of direct effects. Finally, each of the estimated effects was associated with the effect size (ES) as a measure of the variance explained in the dependent variable, which helps determine the level of importance they have.

3.7. Sensitivity Analysis

WarpPLS analysis uses standardized values of latent variables, so it is possible to obtain the probabilities of scenarios and calculate the conditional probabilities. Specifically, the sensitivity analysis evaluates the probability of simultaneously finding the two related variables in their low scenario, high scenario, or their combinations (i.e., P(Zi > 1) and P(Zd > 1), P(Zi > 1) and P(Zd < −1), P(Zi < −1) and P(Zd > 1) y P(Zi < −1) and P(Zd < −1). Similarly, conditional probabilities for P(Zd > 1)/P(Zi > 1), P(Zd > 1)/P(Zi < −1), P(Zd < −1)/P(Zi > 1), and P(Zd < −1)/P(Zi < −1)) were calculated, where Zi represents an independent variable, Zd represents a dependent variable, −1 represents a low scenario, and 1 represents a high scenario.

4. Results

4.1. Descriptive Analysis of the Sample

A total of 169 complete surveys were collected at the end of August 2020, of which 57 respondents were women and 112 men; 74 held the position of managers and 95 engineers. The dataset collected are available in Martínez Hernández and García Alcaraz [50]. Table 1 illustrates the industrial sector and the years of experience for respondents in that job position. Observe that everyone had at least two years of experience, so it was concluded that the respondents were a reliable source of information.
It was also noted that the automotive and medical sectors had the most participation. In this research, the electric industrial sector focuses on producing wires, harnesses, and electric motor assemblies. In contrast, the electronics industrial sector focuses on programmable products, which integrate microcircuits or control motherboards.

4.2. Descriptive Analysis of Items

Table 2 illustrates the descriptive analysis of the items. The median and inter quarterly range (IR) are shown, as the information came from assessments. The values are sorted in descending order in each variable according to the median value, and it was observed that all activities were implemented, or the expected benefits were obtained since all medians were always greater than 4. Furthermore, it was noted that the activities associated with TQM had the highest medians and that Wastes had the lowest values.

4.3. Variables Validation
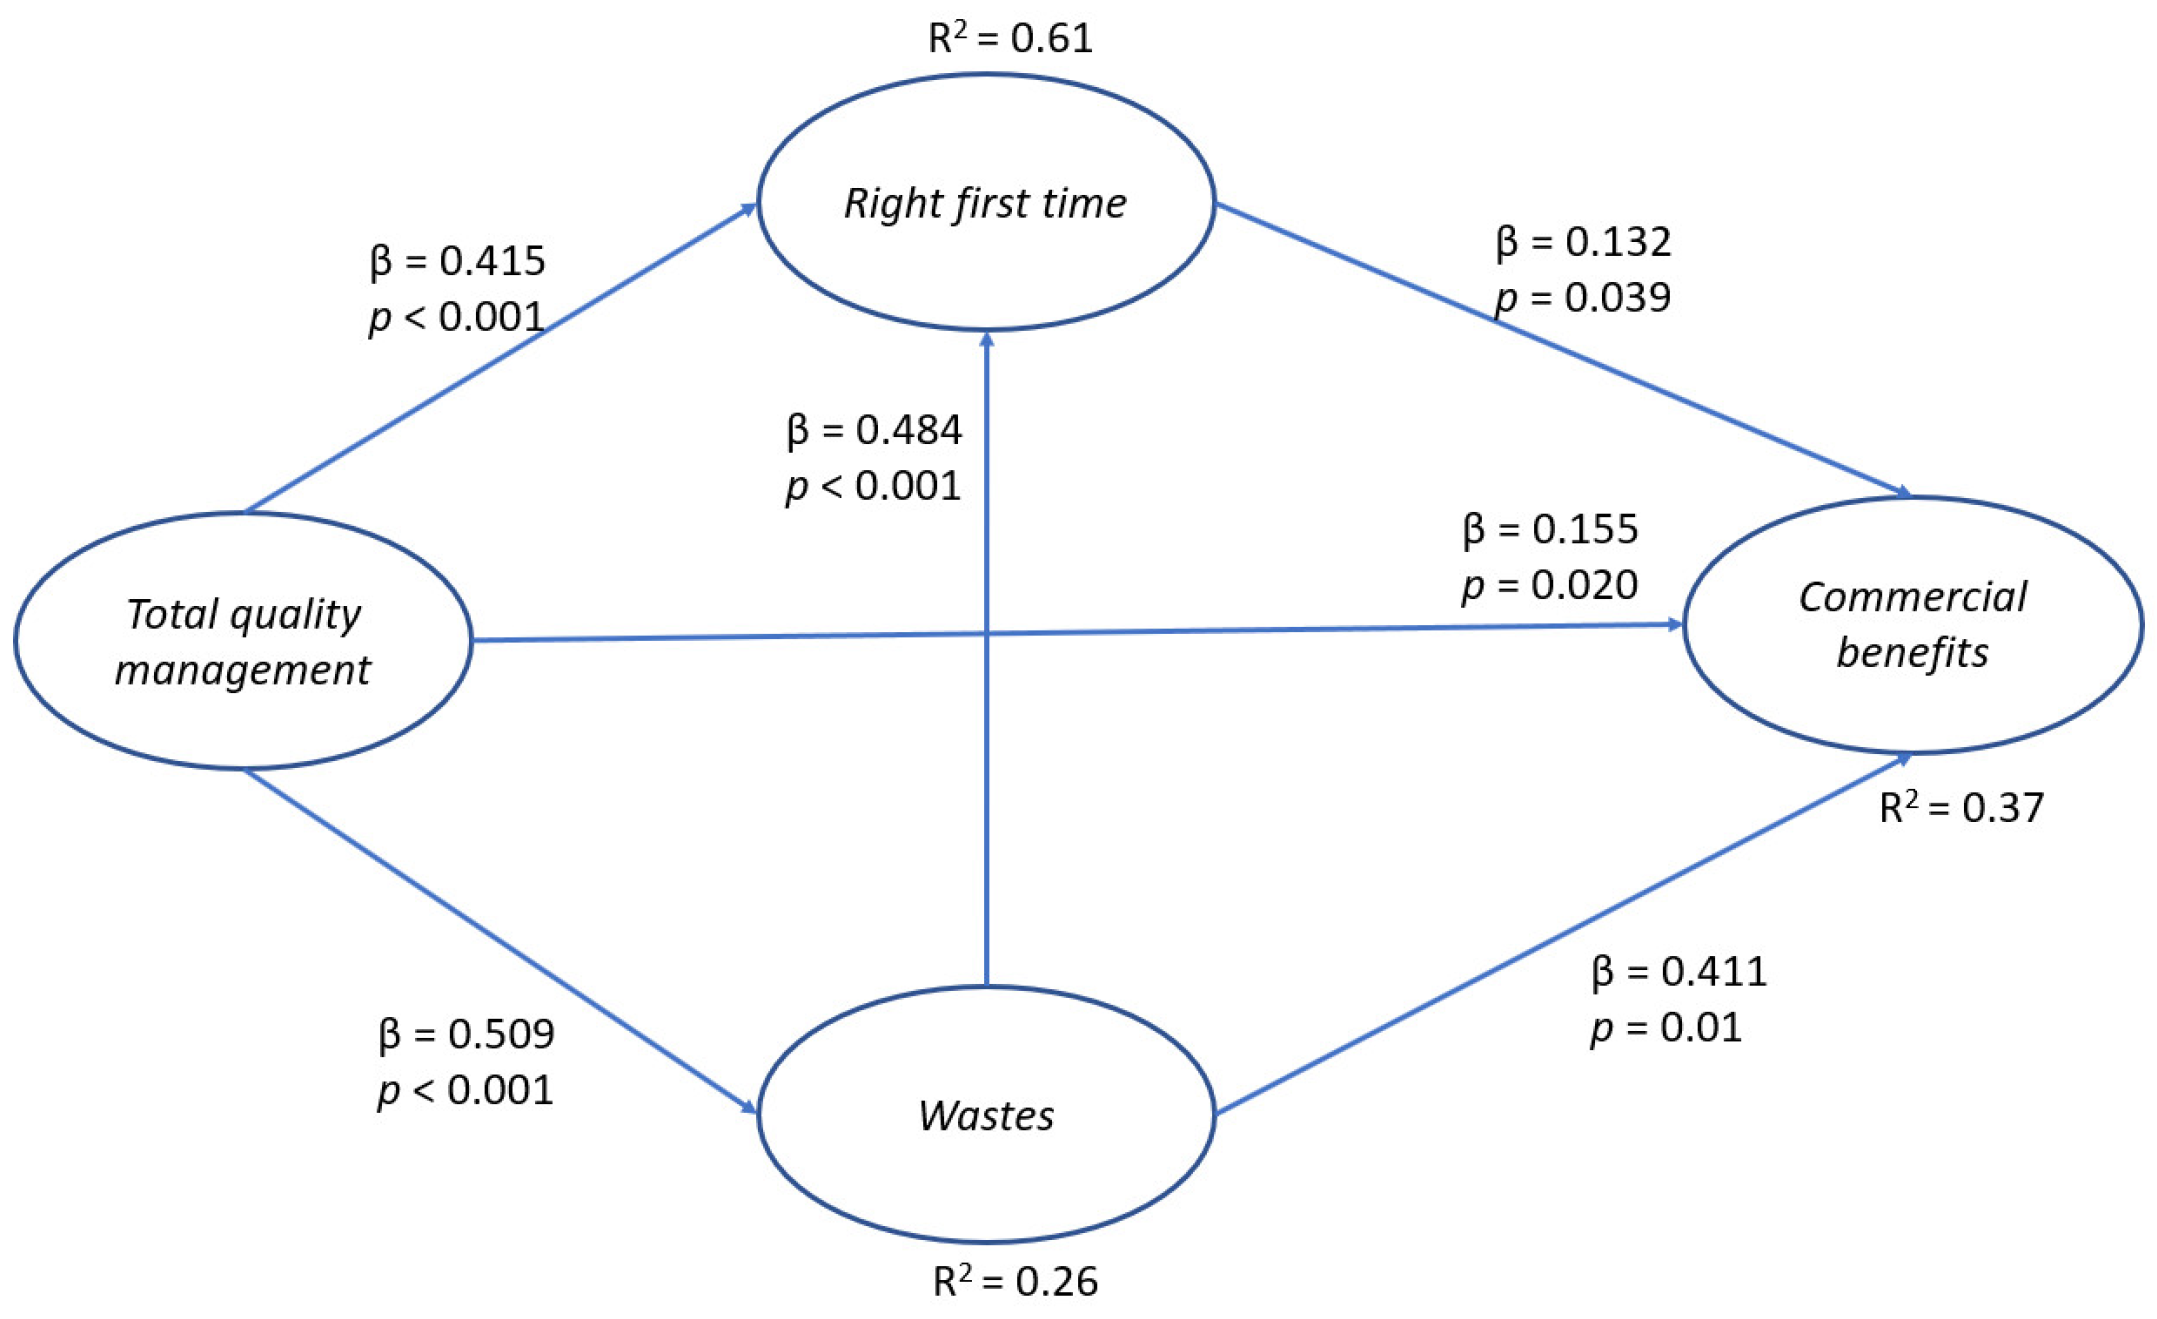
Table 3 illustrates the validation of latent variables, which was obtained iteratively. The row corresponding to the number of items was divided into two columns for each variable, where the first value indicates the initial number of items in the questionnaire. In contrast, the second value indicates the number of items left after the validation process. According to the information in Table 2, it can be concluded that all variables had sufficient predictive, content, and convergent validity and that they had no problems of collinearity. Based on the above, the variables were integrated into the model.

4.4. SEM

The model was generated with the final variables and items after the validation process. The efficiency indices on the evaluated model are illustrated below. It was observed that they met the high- and low-established cutoff values, concluding that it had sufficient predictive validity, a good data fit to the model, and no collinearity problems. The evaluated model is illustrated in Figure 2.
  • Average path coefficient (APC) = 0.363, p < 0.001
  • Average R-squared (ARS) = 0.443, p < 0.001
  • Average adjusted R-squared (AARS) = 0.437, p < 0.001
  • Average block VIF (AVIF) = 1.754, ideally <=3.3
  • Average full collinearity VIF (AFVIF) = 2.116, ideally ≤ 3.3
  • Tenenhaus GoF (GoF) = 0.565, large ≥ 0.36

4.4.1. Direct Effects

According to Figure 2, all relationships were statistically significant, so based on the direct effects, it can be concluded that the relationships established as hypotheses were valid with 95% confidence. Table 4 summarizes the information, the size effect size (ES) as a measure of variance explained, and conclusions of the hypotheses.

4.4.2. The Sum of Indirect Effects and Total Effects

Table 5 illustrates the sum of indirect effects, the total effects, their p-value, and associated ES. It should be noted that all the effects were statistically significant to a 95% confidence level. Here, it is important to emphasize that the relationship between TQM and Commercial benefits had a p-value of 0.046 (almost not significant) in the direct effect, but in the indirect and total effect, this effect was large and statistically significant.

4.4.3. Sensitivity Analysis

Table 6 illustrates the sensitivity analysis of the probability that independent and dependent variables will occur in high (p > 1) and low (p < −1) scenarios. By column, are the independent variables and, per row, the dependent variables. In this analysis, the probability that independent and dependent variables appear simultaneously in a scenario is denoted by the symbol “&”, while the conditional probability of the dependent variable occurring since the independent variable has occurred is represented by “if”.
For example, the probability of simultaneously finding TQM and Wastes at high levels was 0.083 [P(TQM+∩Wastes+)]. Still, the probability of Wastes occurring at a high level, since TQM occurred at its high level, was also 0.500 [P(Wastes+/TQM+)], and hence the importance of TQM programs, as they guarantee the success of other LM tools such as waste reduction. However, suppose that TQM occurs at a low level due to quality deployment problems. In that case, it is possible to obtain Wastes in a low level with a probability of 0.178, which is a risk for managers. The additional probabilities were similarly interpreted.

5. Discussion of Results and Conclusions

The implementation of LM tools such as TQM must be based on the actual data of the company’s quality situation and support many other tools. This study linked three LM tools associated with quality to Commercial benefits.

5.1. Conclusions from Descriptive Analysis

The descriptive analysis shows that TQM is the tool with the highest average values, indicating that respondents considered that activities were always carried out to achieve them. TQM had the lowest inter-quarterly range in item TQM5, meaning that there was consensus that the companies were focused on meeting the needs of customers. With regard to the activity that had the lowest median, this referred to item W6 (Wastes) with a value of only 4.50, focused on minimizing the transport of material; moreover, BCR2 (Commercial benefits) was the item with an enormous IR value, indicating that there was a lower consensus regarding its actual average value.
Concluding from an univariate point of view, to achieve success in TQM implementation, maquiladora companies need to focus on meeting customer needs to promote quality throughout the company. To achieve RFT, companies need to focus on education and training, verifying compliance with standards. To reduce Wastes, companies need to focus on identifying the waste origin and implementing improvements. Finally, the most important Commercial benefits gained from applying LM tools are reducing material costs, increasing sales, and return on investment.

5.2. Conclusions from SEM and Sensitivity Analysis

The relationship between TQM and Wastes in H1 was statistically significant, meaning that focus on quality customers and promoting its concept within the company allowed a reduction in Wastes in the production process, delays in delivery time, rework due to human errors, and transport of material. Additionally, the sensitivity analysis showed that TQM+ encourages activities aimed at eliminating Wastes+ with a probability of 0.500, but generates very little probability of Wastes−; also, TQM− never helps eliminate Wastes+ since the probability is null, and there exists the risk of having Waste− with a probability of 0.478. In this sense, this work coincides with Johri and Kumar [51], who established that compliance with international quality standards allowed for improvements in the operational performance of companies such as certified recognition for their products and management.
The relationship between TQM and RFT in H2 proves that focusing on customers, spreading the concept of quality throughout the company, and a decision-making process focused on continuous improvement with training support leads companies to generate protocols for quality assurance and comply with the product standards. The sensitivity analysis showed that when TQM+ occurs, managers have a 0.357 chance of having RFT+; however, TQM− is never associated with RFT+, since the probability is null. Additionally, TQM− can generate RFT− with a probability of 0.565. The results match the Moitra [18] report, indicating that errors and defects can be prevented from the root, training operators to ensure product quality.
Wastes have also been shown in this study to positively affect RFT, as activities aimed at identifying and eliminating Wastes lead to RFT products and services being generated. From the sensitivity analysis, we observed that Wastes+ favored RFT+ with a probability of 0.625 and that it never generated RFT−, since the probability was null. Additionally, it can be noted that Wastes− only had a probability of generating RFT+ of 0.037, but 0.593 of RFT− happens. In this sense, the results coincide with Singh and Hussain [29] and Purushothaman et al. [52], who mentioned that focusing on dismissing Wastes leads to the generation of quality products the first time and with minimum human error.
One of the most exciting relationships was TQM → Commercial benefits, since the direct effect was only 0.120 and had a p-value of 0.046, very close to 0.05, set as a maximum cutoff, indicating no direct relationship. However, the indirect effects showed that the relationship between those variables was high and is given through the RFT and Wastes tools. This means that focusing on the customer and promoting quality throughout the company favors reducing costs associated with materials and energy consumption in the production process and logically increases sales. However, it is first necessary to develop employee training, standardize processes, and eliminate Wastes that does not add value. From the sensitivity analysis, it can be concluded that TQM+ favors Commercial benefits+, since the conditional probability was 0.464, and, in addition, the probability of generating Commercial benefits− was 0.036; also, TQM− values did not generate Commercial benefits+ because the probability was null, but it could generate Commercial benefits−, since their conditional probability was 0.478. Our results coincide in this regard with Singh, Kumar and Singh [9] and Kaouthar and Lassaad [53], who investigated TQM’s effect on the performance of manufacturing companies in India and Tunisia, respectively.
RFT has also been proven to affect Commercial benefits directly; that is, employee training, adherence to standards, and decreasing defects allow a reduction in the cost of used material and energy consumption, which means an increase in sales. The sensitivity analysis concluded that RFT+ generated Commercial benefits+, as the probability was 0.440, and was unlikely to generate Commercial benefits−, since the probability was 0.040. However, RFT− never caused Commercial benefits+, since the probability was null, and there exists the risk of having Commercial benefits−, since the probability was 0.542.
Finally, it is statistically and empirically demonstrated that Wastes had a direct and positive effect on Commercial benefits. The elimination of Wastes generated in the production process and improvements focused on minimizing the transport of material and human resources generated a reduction in the cost of materials by avoiding accidents and energy loss in conveyor equipment. The sensitivity analysis concluded that Wastes+ generated Commercial benefits+ with a conditional probability of 0.542, but never created Commercial benefits−, since the probability was null. Additionally, Wastes− could not cause Commercial benefits+, and there was a risk of 0.444 to obtain Commercial benefits−. This work coincides with Eldessouky, Flynn, and Newman [34], who stated that getting things right required great coordination of many machines and high levels of precision, as everyday standards are higher, production batches are smaller, and products require more components.
Finally, it is important to mention that this work has the limitation of analyzing only three LM tools associated with quality in maquiladora companies and many others are being implemented. Proof of this is that the value of R-square in the dependent latent variables was not the unit, indicating that they were not fully explained, so in future research, other tools will be integrated, seeking to have greater explanatory power.

5.3. Practical Implications

Quality has been a concern of production managers since it is the basis on which the product is accepted or rejected by customers, and is directly related to the economic income of the company. In this research, it has been empirically and statistically demonstrated that TQM is a fundamental basis for the financial sustainability of maquiladora companies, both directly and indirectly.
Since TQM implementation requires economic and human resources, this study has shown that in the opinion of managers and engineers, the investments made to achieve quality in production processes will always reduce costs when acquiring materials, energy used, and penalization for environmental accidents. Still, above all, there will be an increase in sales in a competitive market since the products meet the customer expectations.
However, TQM does not act alone in a production process to generate quality products, but tools such as RFT and Wastes reduction are vital to support.
Proof of the above is that the direct effect between TQM and Commercial benefits was only 0.120 and the indirect effects through RFT and Wastes were 0.379; that is, the indirect effect was greater than the direct one by more than 300%, which indicates that support tools such as RFT and Wastes strengthen the impact of TQM on the economic benefits obtained from its implementation.
Therefore, when applying TQM as part of a program focused on improving the quality of their products and production processes, it should be supported with other tools such as RFT and Wastes, as they allow for the identification of activities that do not add value, but a lot of costs that may represent a loss in customer preferences.

Supplementary Materials

The following are available online at https://0-www-mdpi-com.brum.beds.ac.uk/article/10.3390/math9090971/s1, Full validation index for latent variables appears at García-Alcaraz, J.L. Data validation for paper: Effect of Quality Lean Manufacturing Tools on Commercial Benefits Gained by Mexican Maquiladoras, University of Ciudad Juárez: Ciudad Juárez, Mexico, 2021, Mendeley Data, V1, https://0-doi-org.brum.beds.ac.uk/10.17632/7tkj88dmf6.1.

Author Contributions

Conceptualization, J.L.G.A. and F.A.M.H.; Methodology, J.L.G.A. and F.A.M.H.; Software, A.R.V. and J.E.O.T.; Validation, E.J.M. and C.J.L.; Formal analysis, J.L.G.A.; Investigation, F.A.M.H.; Resources, E.J.M.; Data curation, F.A.M.H.; Writing—original draft preparation, J.L.G.A. and F.A.M.H.; Writing—review and editing, E.J.M.; Visualization, C.J.L. and J.E.O.T.; Supervision, J.L.G.A.; Project administration, J.L.G.A. All authors have read and agreed to the published version of the manuscript.

Funding

This research received no external funding.

Institutional Review Board Statement

Not applicable.

Informed Consent Statement

Not applicable.

Data Availability Statement

The full survey applied in this research is available at a repository located at https://0-doi-org.brum.beds.ac.uk/10.6084/m9.figshare.14301275 (accessed on 18 March 2021). Dataset in SAV version for SPSS software is available at https://0-doi-org.brum.beds.ac.uk/10.6084/m9.figshare.14308736.v1 (accessed on 18 March 2021).

Acknowledgments

The authors thank all of the managers and engineers who dedicated their time to answering the questionnaire applied in this research. We hope that the results are helpful to them.

Conflicts of Interest

The authors declare no conflict of interest.

References

  1. Diaz-Reza, J.R.; García-Alcaraz, J.L.; Mendoza-Fong, J.R.; Maldonado-Macías, A.A.; Sánchez-Ramírez, C. The role of information sharing in the supply chain from maquiladoras in northern mexico. In Handbook of Research on Industrial Applications for Improved Supply Chain Performance; Luis, G.-A.J., Leal, J.G., Liliana, A.-S., Briones, P.A.J., Eds.; IGI Global: Hershey, PA, USA, 2020; pp. 175–199. [Google Scholar]
  2. IMMEX. Index Juárez—Monthly Statistic Information (January 22, 2021); Asociación de Maquiladoras AC: Ciudad Juárez, Mexico, 2021; pp. 1–3. [Google Scholar]
  3. Palange, A.; Dhatrak, P. Lean manufacturing a vital tool to enhance productivity in manufacturing. Mater. Today Proc. 2021, in press. [Google Scholar] [CrossRef]
  4. Islam, A.S.M.T. End of the day, who is benefited by lean manufacturing? A dilemma of communication and pricing in buyer-supplier relationship. Manuf. Lett. 2019, 21, 17–19. [Google Scholar] [CrossRef]
  5. Melton, T. The benefits of lean manufacturing: What lean thinking has to offer the process industries. Chem. Eng. Res. Des. 2005, 83, 662–673. [Google Scholar] [CrossRef] [Green Version]
  6. Rajenthirakumar, D.; Shankar, R. Analyzing the benefits of lean tools: A consumer durables manufacturing company case study. Ann. Fac. Eng. Hunedoara 2011, 9, 335–339. [Google Scholar]
  7. Hao, Z.; Liu, C.; Goh, M. Determining the effects of lean production and servitization of manufacturing on sustainable performance. Sustain. Prod. Consum. 2021, 25, 374–389. [Google Scholar] [CrossRef]
  8. García-Alcaraz, J.L.; Macías, A.A.M.; Luevano, D.J.P.; Fernández, J.B.; López, A.J.G.; Macías, E.J. Main benefits obtained from a successful JIT implementation. Int. J. Adv. Manuf. Technol. 2016, 86, 2711–2722. [Google Scholar] [CrossRef]
  9. Singh, V.; Kumar, A.; Singh, T. Impact of TQM on organisational performance: The case of indian manufacturing and service industry. Oper. Res. Perspect. 2018, 5, 199–217. [Google Scholar] [CrossRef]
  10. Sahoo, S.; Yadav, S. Influences of tpm and TQM practices on performance of engineering product and component manufacturers. Procedia Manuf. 2020, 43, 728–735. [Google Scholar] [CrossRef]
  11. Meade, D.J.; Kumar, S.; Houshyar, A. Financial analysis of a theoretical lean manufacturing implementation using hybrid simulation modeling. J. Manuf. Syst. 2006, 25, 137–152. [Google Scholar] [CrossRef]
  12. Fullerton, R.R.; Kennedy, F.A.; Widener, S.K. Lean manufacturing and firm performance: The incremental contribution of lean management accounting practices. J. Oper. Manag. 2014, 32, 414–428. [Google Scholar] [CrossRef]
  13. Shashi, P.C.; Cerchione, R.; Singh, R. The impact of leanness and innovativeness on environmental and financial performance: Insights from indian smes. Int. J. Prod. Econ. 2019, 212, 111–124. [Google Scholar] [CrossRef]
  14. Elkhairi, A.; Fedouaki, F.; Alami, S.E. Barriers and critical success factors for implementing lean manufacturing in smes. IFAC PapersOnLine 2019, 52, 565–570. [Google Scholar] [CrossRef]
  15. Abu, F.; Gholami, H.; Saman, M.Z.M.; Zakuan, N.; Streimikiene, D. The implementation of lean manufacturing in the furniture industry: A review and analysis on the motives, barriers, challenges, and the applications. J. Clean. Prod. 2019, 234, 660–680. [Google Scholar] [CrossRef]
  16. Jun, M.; Cai, S.; Shin, H. TQM practice in maquiladora: Antecedents of employee satisfaction and loyalty. J. Oper. Manag. 2006, 24, 791–812. [Google Scholar] [CrossRef]
  17. Lynn, R. Useful Lean Manufacturing Tools. Available online: https://www.planview.com/resources/guide/what-is-lean-manufacturing/lean-manufacturing-tools/ (accessed on 17 April 2021).
  18. Sisternas, P. The Main Lean Manufacturing Tools for Your Company [in Spanish]. Available online: https://www.emprendepyme.net/las-principales-herramientas-de-lean-manufacturing-para-tu-empresa.html (accessed on 16 April 2021).
  19. Salleh, N.A.M.; Kasolang, S.; Jaffar, A. Simulation of integrated total quality management (TQM) with lean manufacturing (LM) practices in forming process using delmia quest. Procedia Eng. 2012, 41, 1702–1707. [Google Scholar] [CrossRef] [Green Version]
  20. York, K.M.; Miree, C.E. Causation or covariation: An empirical re-examination of the link between TQM and financial performance. J. Oper. Manag. 2004, 22, 291–311. [Google Scholar] [CrossRef]
  21. Moitra, T. From employees to customers: Impact of HRM on TQM. HCM Sales Mark. Alliance Excell. Essent. 2019, 18, 18–21. [Google Scholar]
  22. Green, K.W.; Inman, R.A.; Sower, V.E.; Zelbst, P.J. Impact of jit, TQM and green supply chain practices on environmental sustainability. J. Manuf. Technol. Manag. 2019, 26. [Google Scholar] [CrossRef]
  23. García-Alcaraz, J.L.; Montalvo, F.J.F.; Sánchez-Ramírez, C.; Avelar-Sosa, L.; Saucedo, J.A.M.; Alor-Hernández, G. Importance of organizational structure for TQM success and customer satisfaction. Wirel. Netw. 2019, 27, 1601–1614. [Google Scholar] [CrossRef]
  24. Sreedharan, R.V.; Sunder, V.M.; Raju, R. Critical success factors of TQM, six sigma, lean and lean six sigma: A literature review and key findings. Benchmarking 2018, 25, 3479–3504. [Google Scholar] [CrossRef]
  25. Qasrawi, B.T.; Almahamid, S.M.; Qasrawi, S.T. The impact of TQM practices and km processes on organisational performance: An empirical investigation. Int. J. Qual. Reliab. Manag. 2017, 34, 1034–1055. [Google Scholar] [CrossRef]
  26. Ooi, K.-B. TQM: A facilitator to enhance knowledge management? A structural analysis. Expert Syst. Appl. 2014, 41, 5167–5179. [Google Scholar] [CrossRef]
  27. Katare, V.D.; Madurwar, M.V. Process standardization of sugarcane bagasse ash to develop durable high-volume ash concrete. J. Build. Eng. 2021, 39, 102151. [Google Scholar] [CrossRef]
  28. Sutharsan, S.M.; Prasad, M.M.; Vijay, S. Productivity enhancement and waste management through lean philosophy in indian manufacturing industry. Mater. Today Proc. 2020, 33, 2981–2985. [Google Scholar] [CrossRef]
  29. Singh, S.; Hussain, C.M. Chapter three—Zero waste manufacturing. In Concepts of Advanced Zero Waste Tools; Hussain, C.M., Ed.; Elsevier: Amsterdam, The Netherlands, 2021; pp. 45–67. [Google Scholar]
  30. Amjad, M.S.; Rafique, M.Z.; Khan, M.A. Leveraging optimized and cleaner production through industry 4.0. Sustain. Prod. Consum. 2021, 26, 859–871. [Google Scholar] [CrossRef]
  31. Wang, Y.; Huang, A.; Quigley, C.A.; Li, L.; Sutherland, J.W. Tolerance allocation: Balancing quality, cost, and waste through production rate optimization. J. Clean. Prod. 2021, 285, 124837. [Google Scholar] [CrossRef]
  32. Womack, J.; Jones, D. Lean Thinking: Banish Waste and Create Wealth in Your Corporation; Free Press: New York, NY, USA, 2003; p. 400. [Google Scholar]
  33. Moshiri, M.; Charles, A.; Elkaseer, A.; Scholz, S.; Mohanty, S.; Tosello, G. An industry 4.0 framework for tooling production using metal additive manufacturing-based first-time-right smart manufacturing system. Procedia CIRP 2020, 93, 32–37. [Google Scholar] [CrossRef]
  34. Eldessouky, H.M.; Flynn, J.M.; Newman, S.T. On-machine error compensation for right first time manufacture. Procedia Manuf. 2019, 38, 1362–1371. [Google Scholar] [CrossRef]
  35. Sila, I. Country and sector effects on the relationships among TQM practices and key performance measures. Int. J. Product. Perform. Manag. 2018, 67, 1371. [Google Scholar] [CrossRef]
  36. Álvarez-Santos, J.; Miguel-Dávila, J.-Á.; Herrera, L.; Nieto, M. Safety management system in TQM environments. Saf. Sci. 2018, 101, 135–143. [Google Scholar] [CrossRef]
  37. Kumar, V.; Sharma, R.R.K. Relating management problem-solving styles of leaders to TQM focus: An empirical study. TQM J. 2017, 29, 218–239. [Google Scholar] [CrossRef]
  38. Singh, S.; Ramakrishna, S.; Gupta, M.K. Towards zero waste manufacturing: A multidisciplinary review. J. Clean. Prod. 2017, 168, 1230–1243. [Google Scholar] [CrossRef]
  39. Um, N.; Park, S.-O.; Yoon, C.-W.; Jeon, T.-W. A pretreatment method for effective utilization of copper product manufacturing waste. J. Environ. Chem. Eng. 2021, 105509. [Google Scholar] [CrossRef]
  40. Bañuelas, R.; Antony, J.; Brace, M. An application of six sigma to reduce waste. Qual. Reliab. Eng. Int. 2005, 21, 553–570. [Google Scholar] [CrossRef] [Green Version]
  41. Magdy, K.; Tamer, M.S. The moderating effect of structural barriers on TQM-performance relationship in egyptian service organizations. Int. J. Qual. Serv. Sci. 2018, 349. [Google Scholar] [CrossRef]
  42. Kappelman, L.; Prybutok, V. Empowerment, motivation, training, and TQM program implementation success. Ind. Manag. 1995, 37, 12–15. [Google Scholar]
  43. Kassicieh, S.K.; Yourstone, S.A. Training, performance evaluation, rewards, and TQM implementation success. J. Qual. Manag. 1998, 3, 25–38. [Google Scholar] [CrossRef]
  44. García-Alcaraz, J.L.; Flor-Montalvo, F.J.; Avelar-Sosa, L.; Sánchez-Ramírez, C.; Jiménez-Macías, E. Human resource abilities and skills in TQM for sustainable enterprises. Sustainability 2019, 11, 6488. [Google Scholar] [CrossRef] [Green Version]
  45. Bari, M.W.; Fanchen, M.; Baloch, M.A. TQM soft practices and job satisfaction; mediating role of relational psychological contract. Procedia Soc. Behav. Sci. 2016, 235, 453–462. [Google Scholar] [CrossRef]
  46. Hernández, F.A.M.; Alcaraz, J.L.G. Survey to Determine the Level of Implementation of Lean Manufacturing Practices; Autonomous University of Ciudad Juárez: Ciudad Juárez, Mexico, 2021. [Google Scholar]
  47. Parsazadeh, N.; Ali, R.; Rezaei, M.; Tehrani, S.Z. The construction and validation of a usability evaluation survey for mobile learning environments. Stud. Educ. Eval. 2018, 58, 97–111. [Google Scholar] [CrossRef]
  48. Kock, N. Warppls 6.0 User Manual; ScriptWarp Systems: Laredo, TX, USA, 2018. [Google Scholar]
  49. Kock, N. Factor-based structural equation modeling with warppls. Australas. Mark. J. 2019, 27, 57–63. [Google Scholar] [CrossRef]
  50. Hernández, F.A.M.; Alcaraz, J.L.G. Dataset with Lean Manufacturing Tools and Its Commercial Benefits; Autonomous University of Ciudad Juárez: Ciudad Juárez, Mexico, 2021. [Google Scholar]
  51. Johri, S.; Kumar, D. Evaluation of effect of iso 9001:2008 standard implementation on TQM parameters in manufacturing & production processes performance in small enterprises. Mater. Today Proc. 2021, in press. [Google Scholar] [CrossRef]
  52. Purushothaman, M.B.; Seadon, J.; Moore, D. Waste reduction using lean tools in a multicultural environment. J. Clean. Prod. 2020, 265, 121681. [Google Scholar] [CrossRef]
  53. Kaouthar, L.; Lassaad, L. Impact of TQM/six sigma practices on company’s performance: Tunisian context. Int. J. Qual. Reliab. Manag. 2018, 35, 1881–1906. [Google Scholar] [CrossRef]
Figure 1. Proposed model.
Mathematics 09 00971 g001
Figure 2. Evaluated model.
Mathematics 09 00971 g002
Table 1. Number of respondents by industry sector and years of experience.
Industrial SectorJob Experience in YearsTotal
2 and <55 and <10>10
Automotive26381074
Medical1916540
Machining1412733
Electronic28010
Logistic5117
Electric3115
Total697624169
Table 2. Descriptive analysis of the items.
Total Quality ManagementMedianIR
TQM5. The organization focuses on meeting the needs of customers, involving employees5.231.42
TQM3. The concept of total quality from raw material collection to after-sales customer service is promoted5.181.58
TQM4. Decision-making for improvement is justified by facts and data4.981.57
TQM2. Participatory management is promoted aimed at continuous improvement in all operations4.871.61
Right first time
RFT5. Training and awareness is carried out in relation to the quality and need to do well the activities4.921.67
RFT3. Compliance with quality standards is verified with a zero-defect approach4.831.55
RFT4. There is a standardized protocol for sampling when you want to do an analysis4.811.74
RFT2. Ensures proper process operation to prevent defects4.771.53
Wastes
W8. Waste is identified in the production process and supply chain4.811.55
W5. Improvements are encouraged to reduce Waste4.701.54
W4. Product rework is reduced to the acceptable minimum4.521.89
W6. Seeks to minimize the transport of material4.501.80
Commercial benefits
BCR1. There is a reduction in the cost of acquiring materials4.731.74
BCR6. Average profit growth has been had in the last two years4.681.77
BCR5. There has been an average return on sales and investment in the last two years4.651.77
BCR2. There is a reduction in the cost of using energy4.621.91
Table 3. Validation of latent variables.
IndexBest
Value If
TQMRFTWastesCommercial
Benefits
Number of items 63748473
R-squared>0.02 0.6120.2590.459
Adjusted R-squared>0.02 0.6070.2550.449
Composite reliability>0.70.8880.9170.9110.907
Cronbach’s alpha>0.70.8320.8790.8690.845
Average variance extracted>0.50.6660.7340.7190.765
Full collinearity VIF<3.31.8042.7042.1521.806
Q-squared>0.02 0.6130.2600.463
Table 4. Direct effect and hypotheses conclusions.
Independent
Variable
Dependent
Variable
β (p-Value)Effect SizeConclusion
TQMWastes0.509 (p < 0.001)0.259Accept
TQMRFT0.415 (p < 0.001)0.275Accept
WastesRFT0.484 (p < 0.001)0.337Accept
TQMCommercial benefits0.120 (p = 0.046)0.046Accept
RFTCommercial benefits0.316 (p < 0.001)0.196Accept
WastesCommercial benefits0.334 (p < 0.001)0.204Accept
Table 5. Sum of indirect and total effects.
Sum of Indirect Effects
TQMRFTWastes
RFT0.246 (p < 0.001)
ES = 0.163
Commercial benefits0.379 (p <0.001)
ES = 0.187
0.153 (p = 0.002)
ES = 0.093
Total Effects
RFT0.662 (p < 0.001)
ES = 0.438
0.484 (p < 0.001)
ES = 0.337
Wastes0.509 (p < 0.001)
ES = 0.259
Commercial benefits0.499 (p < 0.001)
ES = 0.246
0.316 (p < 0.001)
ES = 0.196
0.487 (p < 0.001)
ES = 0.297
Table 6. Sensitivity analysis.
Sign/Value TQMWastesRFT
+++
0.1660.1360.1480.1600.1780.154
Wastes+0.142& = 0.083
If = 0.500
& = 0.000
If = 0.000
0.160& = 0.018
If = 0.107
& = 0.065
If = 0.478
RFT+0.148& = 0.059
If = 0.357
& = 0.000
If = 0.000
& = 0.089
If = 0.625
& = 0.006
If = 0.037
0.142& = 0.000
If = 0.000
& = 0.077
If = 0.565
& = 0.000
If = 0.000
& = 0.095
If = 0.593
Commercial
benefits
+0.178& = 0.077
If = 0.464
& = 0.000
If = 0.000
& = 0.077
If = 0.542
& = 0.006
If = 0.037
& = 0.065
If = 0.440
& = 0.000
If = 0.000
0.154& = 0.006
If = 0.036
& = 0.065
If = 0.478
& = 0.000
If = 0.0000
& = 0.071
If = 0.444
& = 0.006
If = 0.040
& = 0.077
If = 0.542
Publisher’s Note: MDPI stays neutral with regard to jurisdictional claims in published maps and institutional affiliations.

