Article

Development of a Screening Method for Sulfamethoxazole in Environmental Water by Digital Colorimetry Using a Mobile Device

by
Patrícia S. Peixoto
1,
Pedro H. Carvalho
2,
Ana Machado
3,4,
Luisa Barreiros
1,
Adriano A. Bordalo
3,4,
Hélder P. Oliveira
2,5 and
Marcela A. Segundo
1,*
1
LAQV, REQUIMTE, Faculty of Pharmacy, University of Porto, 4050-313 Porto, Portugal
2
INESC TEC—Institute for Systems and Computer Engineering, Technology and Science, 4200-465 Porto, Portugal
3
Department of Population Studies, ICBAS, Instituto de Ciências Biomédicas Abel Salazar, Universidade do Porto, 4050-313 Porto, Portugal
4
CIIMAR—Interdisciplinary Centre of Marine and Environmental Research, 4450-208 Matosinhos, Portugal
5
Faculty of Sciences, University of Porto, 4169-007 Porto, Portugal
*
Author to whom correspondence should be addressed.
Submission received: 10 December 2021 / Revised: 24 December 2021 / Accepted: 3 January 2022 / Published: 7 January 2022
(This article belongs to the Section Applied Chemical Sensors)

Abstract

:
Antibiotic resistance is a major health concern of the 21st century. The misuse of antibiotics over the years has led to their increasing presence in the environment, particularly in water resources, which can exacerbate the transmission of resistance genes and facilitate the emergence of resistant microorganisms. The objective of the present work is to develop a chemosensor for screening of sulfonamides in environmental waters, targeting sulfamethoxazole as the model analyte. The methodology was based on the retention of sulfamethoxazole in disks containing polystyrene divinylbenzene sulfonated sorbent particles and reaction with p-dimethylaminocinnamaldehyde, followed by colorimetric detection using a computer-vision algorithm. Several color spaces (RGB, HSV and CIELAB) were evaluated, with the coordinate a_star, from the CIELAB color space, providing the highest sensitivity. Moreover, in order to avoid possible errors due to variations in illumination, a color palette is included in the picture of the analytical disk, and a correction using the a_star value from one of the color patches is proposed. The methodology presented recoveries of 82–101% at 0.1 µg and 0.5 µg of sulfamethoxazole (25 mL), providing a detection limit of 0.08 µg and a quantification limit of 0.26 µg. As a proof of concept, application to in-field analysis was successfully implemented.

1. Introduction

Antimicrobial agents are considered emerging pollutants in water due to their contribution to the spread of bacterial resistance genes and their harmful effect to ecosystems through death or inhibition of natural microbiota [1]. Sulfonamides comprise an important antimicrobial group and are widely used in treatment of bacterial infections both in human and in animals being raised for consumption, and are among the most-consumed antibiotics in food-producing species [2]. These compounds and their metabolites are frequently found in environmental water, and they can reach the aquatic medium through different pathways, such as wastewater discharges, contaminated manure and slurry [3]. Furthermore, these compounds seem to be quite resistant to biodegradation in surface water, which can lead to contamination of aquatic environments [4]. Hence, detection of sulfonamides in water matrices are demanded to assess their impact on the aquatic environment in order to establish action plans and regulatory policies. The European Medicines Agency (EMA) updated its scientific advice on the categorization of antimicrobials in 2019 in reaction to the risk that their use in animals causes to public health through the possible development of antimicrobial resistance. Sulfonamides were placed in the category D, meaning this class of antimicrobials can be used in animals in a prudent manner, while avoiding unnecessary use and long treatment periods [5]. Furthermore, these compounds are classified as Veterinary Highly Important Antimicrobials (according to the World Organization for Animal Health) and Highly Important Antimicrobials (according to the World Health Organization Critically Important Antimicrobials list) [6]. Additionally, pertaining to sulfonamides antibiotics, sulfamethoxazole was included in the 3rd Watch list of recommended substances for European Union-wide monitoring in the Water Framework Directive [7,8].
In the last decade, sulfamethoxazole has been quantified in high concentrations (microgram per liter) in wastewater in different countries [9]. In more recent reports, sulfamethoxazole was found in concentrations of up to 5.1 µg L−1 in wastewater treatment plants and up to 66.4 µg L−1 in a hospital’s wastewater effluent in Belgium [10]. Sulfamethoxazole has also been detected in maximum concentrations of 7.8 µg L−1 and 20.6 µg L−1 in ponds and hospital wastewater, respectively, in Kenya [11]. Furthermore, sulfamethoxazole levels were found to be from 1 to 5.6 µg L−1 in Lake Victoria, Uganda [12]. In the USA, this antibiotic was quantified up to 22 µg L−1 in wastewater treatment plants in the state of Pennsylvania [13]. Finally, sulfamethoxazole levels of 0.31 to 15.6 µg L−1 were detected in wastewater in Vietnam [14].
The current methods for determination of sulfonamides in water are mostly based on high-performance liquid chromatography coupled to tandem mass spectrometry (LC-MS/MS) [15,16,17], which is widely used due to its high sensitivity and specificity. Other approaches comprise electrochemical methods [18], and LC coupled to ultraviolet, diode array or fluorescence detectors [17]. Nevertheless, these strategies are unsuitable for screening purpose due to the high cost of equipment and its maintenance, need of trained personnel and high reagent consumption for sample pretreatment and extraction of target compounds.
Methods based on digital image colorimetry have been applied in point-of-care tests, forensic analysis and environmental monitoring [19,20,21,22]. Image sensors features, such as simplicity, sensitivity and portability [23,24], make them very promising as field screening techniques. The implementation of colorimetric sensors is based on image processing, and the color formation can occur in solution or on a solid support. The colorimetric reaction on a solid support has been mostly reported in paper-based format [25,26,27,28,29,30,31,32], with other types of solid supports including chitosan film [33], carbon dots-sodium alginate hydrogel [34], aerogel [35], modified wood [36] and microtube containing fiber glass [37]. Despite this, the association of preconcentration features and imaging analysis has been seldom exploited [31].
Most of the methods have been developed with controlled illumination [25,26,30,31,32,33,34,37,38,39,40], as lighting conditions can influence color perception [23]. However, algorithms have been developed to ensure color constancy under uncontrolled illumination, and/or to simplify the retrieval of the color. For instance, by using a paper-based device and an algorithm developed in MATLAB, Sankar et al. [41] developed a method to quantify chlorpyrifos in water resulting from washing fruits and vegetables. The algorithm was able to establish a region of interest (ROI) and to subtract the background (different area from the paper device) from the mean values of ROI to determine change in color. In another example, Sicard et al. [42] proposed a colorimetric sensor for on-site quantification of organophosphate pesticides in natural water. They accomplished this by combining a colorimetric reaction on a paper-based sensor with a mobile phone application that processed the image based on an algorithm which used the ratios between different pixel values in the RGB space.
In this work, a smartphone-based colorimetric sensor for screening of sulfamethoxazole (SMZ) in water is proposed, based on miniaturized solid-phase extraction, followed by a computer vision algorithm for color quantification. The color identifies the product of the reaction between the colorimetric reagent p-dimethylaminocinnamaldehyde (DMACA) and SMZ on the disk surface where the target analyte is retained. Studies concerning the image processing algorithm under ambient light are pursued, with the aim of validating screening tests in both lab and field environments.

2. Materials and Methods

All chemicals and solvents were of analytical grade. Sulfamethoxazole (SMZ) and p-dimethylaminocinnamaldehyde (DMACA) were purchased from Sigma Aldrich (St. Louis, MO, USA). All solutions were prepared with ultrapure water from Arium water purification systems (resistivity > 18 MΩ cm; Sartorius, Goettingen, Germany).
The sulfuric acid solution (5 mM) was prepared by appropriate dilution of sulfuric acid 96% (w/w, Sigma Aldrich) solution. All sulfonamide solutions were prepared daily. The stock solution (250 mg L−1) was prepared by dissolution of the appropriate mass in methanol. The sulfonamide intermediate solution (1 mg L−1) was prepared by dilution of the respective stock solution in sulfuric acid 5 mM. Sulfonamide working solutions (from 5–150 µg L−1) were prepared by dilution of appropriate volumes of intermediate solution in sulfuric acid 5 mM. Hydrochloric acid solution (6.0 M) was prepared by appropriate dilution of commercial hydrochloric acid 37% (w/w; VWR International, Fontenay-sous-Bois, France) in water. For the preparation of DMACA stock solution 0.44 g L−1 (25 mL), 11 mg were dissolved in 3.5 mL of 0.6 M HCl, and the volume was completed with methanol (VWR International). DMACA working solution 0.22 g L−1 was prepared by dilution of DMACA stock solution in methanol:chloroform (1:1; v/v).
The extraction procedure consisted in conditioning, cutting and fitting the polystyrene divinylbenzene sulfonated (SDB-RPS) disks into a polypropylene holder for 13-mm diameter disks (Swinnex®, filter holder, SX0001300, Millipore-Billerica, MA, USA). Disks from different suppliers were tested, namely AttractSPE™ Disks (from AFFINISEP, Val de Reuil, France) and SDB-RPS Disks (from Empore™, Bellefonte, PA, USA).
For the AttractSPE™ disks, disks were conditioned following the manufacturer’s instructions: contact with 10 mL of acetone, followed by washing with 10 mL of isopropanol. After cutting and housing, disks were also conditioned with 2 mL of methanol and 8 mL of water. If the surface of the disk became dry before the sample was added, these two steps of the conditioning procedure were repeated. For Empore™ disks, no conditioning was required [43].
To perform the retention of SMZ in the disks for lab experiments, an extraction system composed of a peristaltic pump (Gilson Minipuls 2, Villiers-le-Bel, France), able to connect four disk units in parallel to propulsion tubes (Tygon®, 1.02 mm i.d.), was used (Figure S1). Standards and samples (10 to 50 mL) were loaded at 822 rpm (2.0 mL min−1), though other flow rates (1–4 mL min−1) were tested in preliminary studies. After sending the total volume through the disks, the disks were dried for 10 min by passing air through them at a pumping rate of 900 rpm. The disks were subsequently removed from the holders. For experiment-in-field set-ups, samples and all solutions sent through the disks were manipulated using 10 mL glass syringes (Hamilton, Bonaduz, Switzerland).
For image acquisition, an official classic chart with 24 patches of different colors arranged in a 6 by 4 grid (Colorchecker, X-rite, Grand Rapids, MI, USA) was placed on a white, A4 paper sheet (Figure 1). The disks, previously removed from each holder, were placed beside the color chart. Images were acquired 90 s (SDB-RPS Empore™ disks) or 5 min (AttractSPE™ disks) after reagent addition (10 μL of DMACA 1.25 mM) with a smartphone (Xiaomi (Beijing, China), model A1, 12 MP, f/2.2 + 12 MP, f/2.6) under ambient light. The acquired images were used to develop an automatic image processing algorithm for color quantification, considering three color spaces: CIELAB, RGB and HSV. The color chart allowed for calibration of the image to account for variations in lighting conditions, enabling the extraction of the correct color from the disk.
For the algorithm development, an image dataset was built [44]. For this, 10 mL of SMZ standards (0, 5, 10, 15, 20, 25, 40, 50, 100 and 150 μg L−1) were loaded through the disks (Empore™), the color reagent was added, and images of the colored products were acquired under ambient light, using the color chart as reference for color correction. Four disks for each concentration were prepared, and duplicate images of each disk were acquired, providing a total of 80 measurements.
To achieve results independent of environmental light [45], color correction was performed by finding the color correction matrix T, which minimized the difference between the measured RGB values of the color checker patches, MRGB, in each image, and the corresponding ground truth XYZ values, MXYZ, see Equation (1). This is a minimization problem and T is found with the Least Squares Method, see Equation (2). Transforming the image using T will result in a color corrected image in the XYZ color space, which is then converted back to RGB.
T = a r g min T M X Y Z T · M R G B 2
b = ( X T X ) 1 X T y
For the study of the influence of light conditions on the algorithm response, experiments under indoor lighting and outdoors under natural light were performed using SMZ standards containing 10 and 25 µg L−1 in triplicate, and blanks (sulfuric acid 5 mM with no SMZ).
The Student’s t-test was carried out at 95% confidence limit to compare results from the light conditions study. First, an F-test was applied to verify if the variances of the groups were significantly different. When the Ftab > Fcalc, a t-test assuming that the variances were similar was applied. If Ftab < Fcalc, a t-test assuming that the variances were different was implemented.

3. Results and Discussion

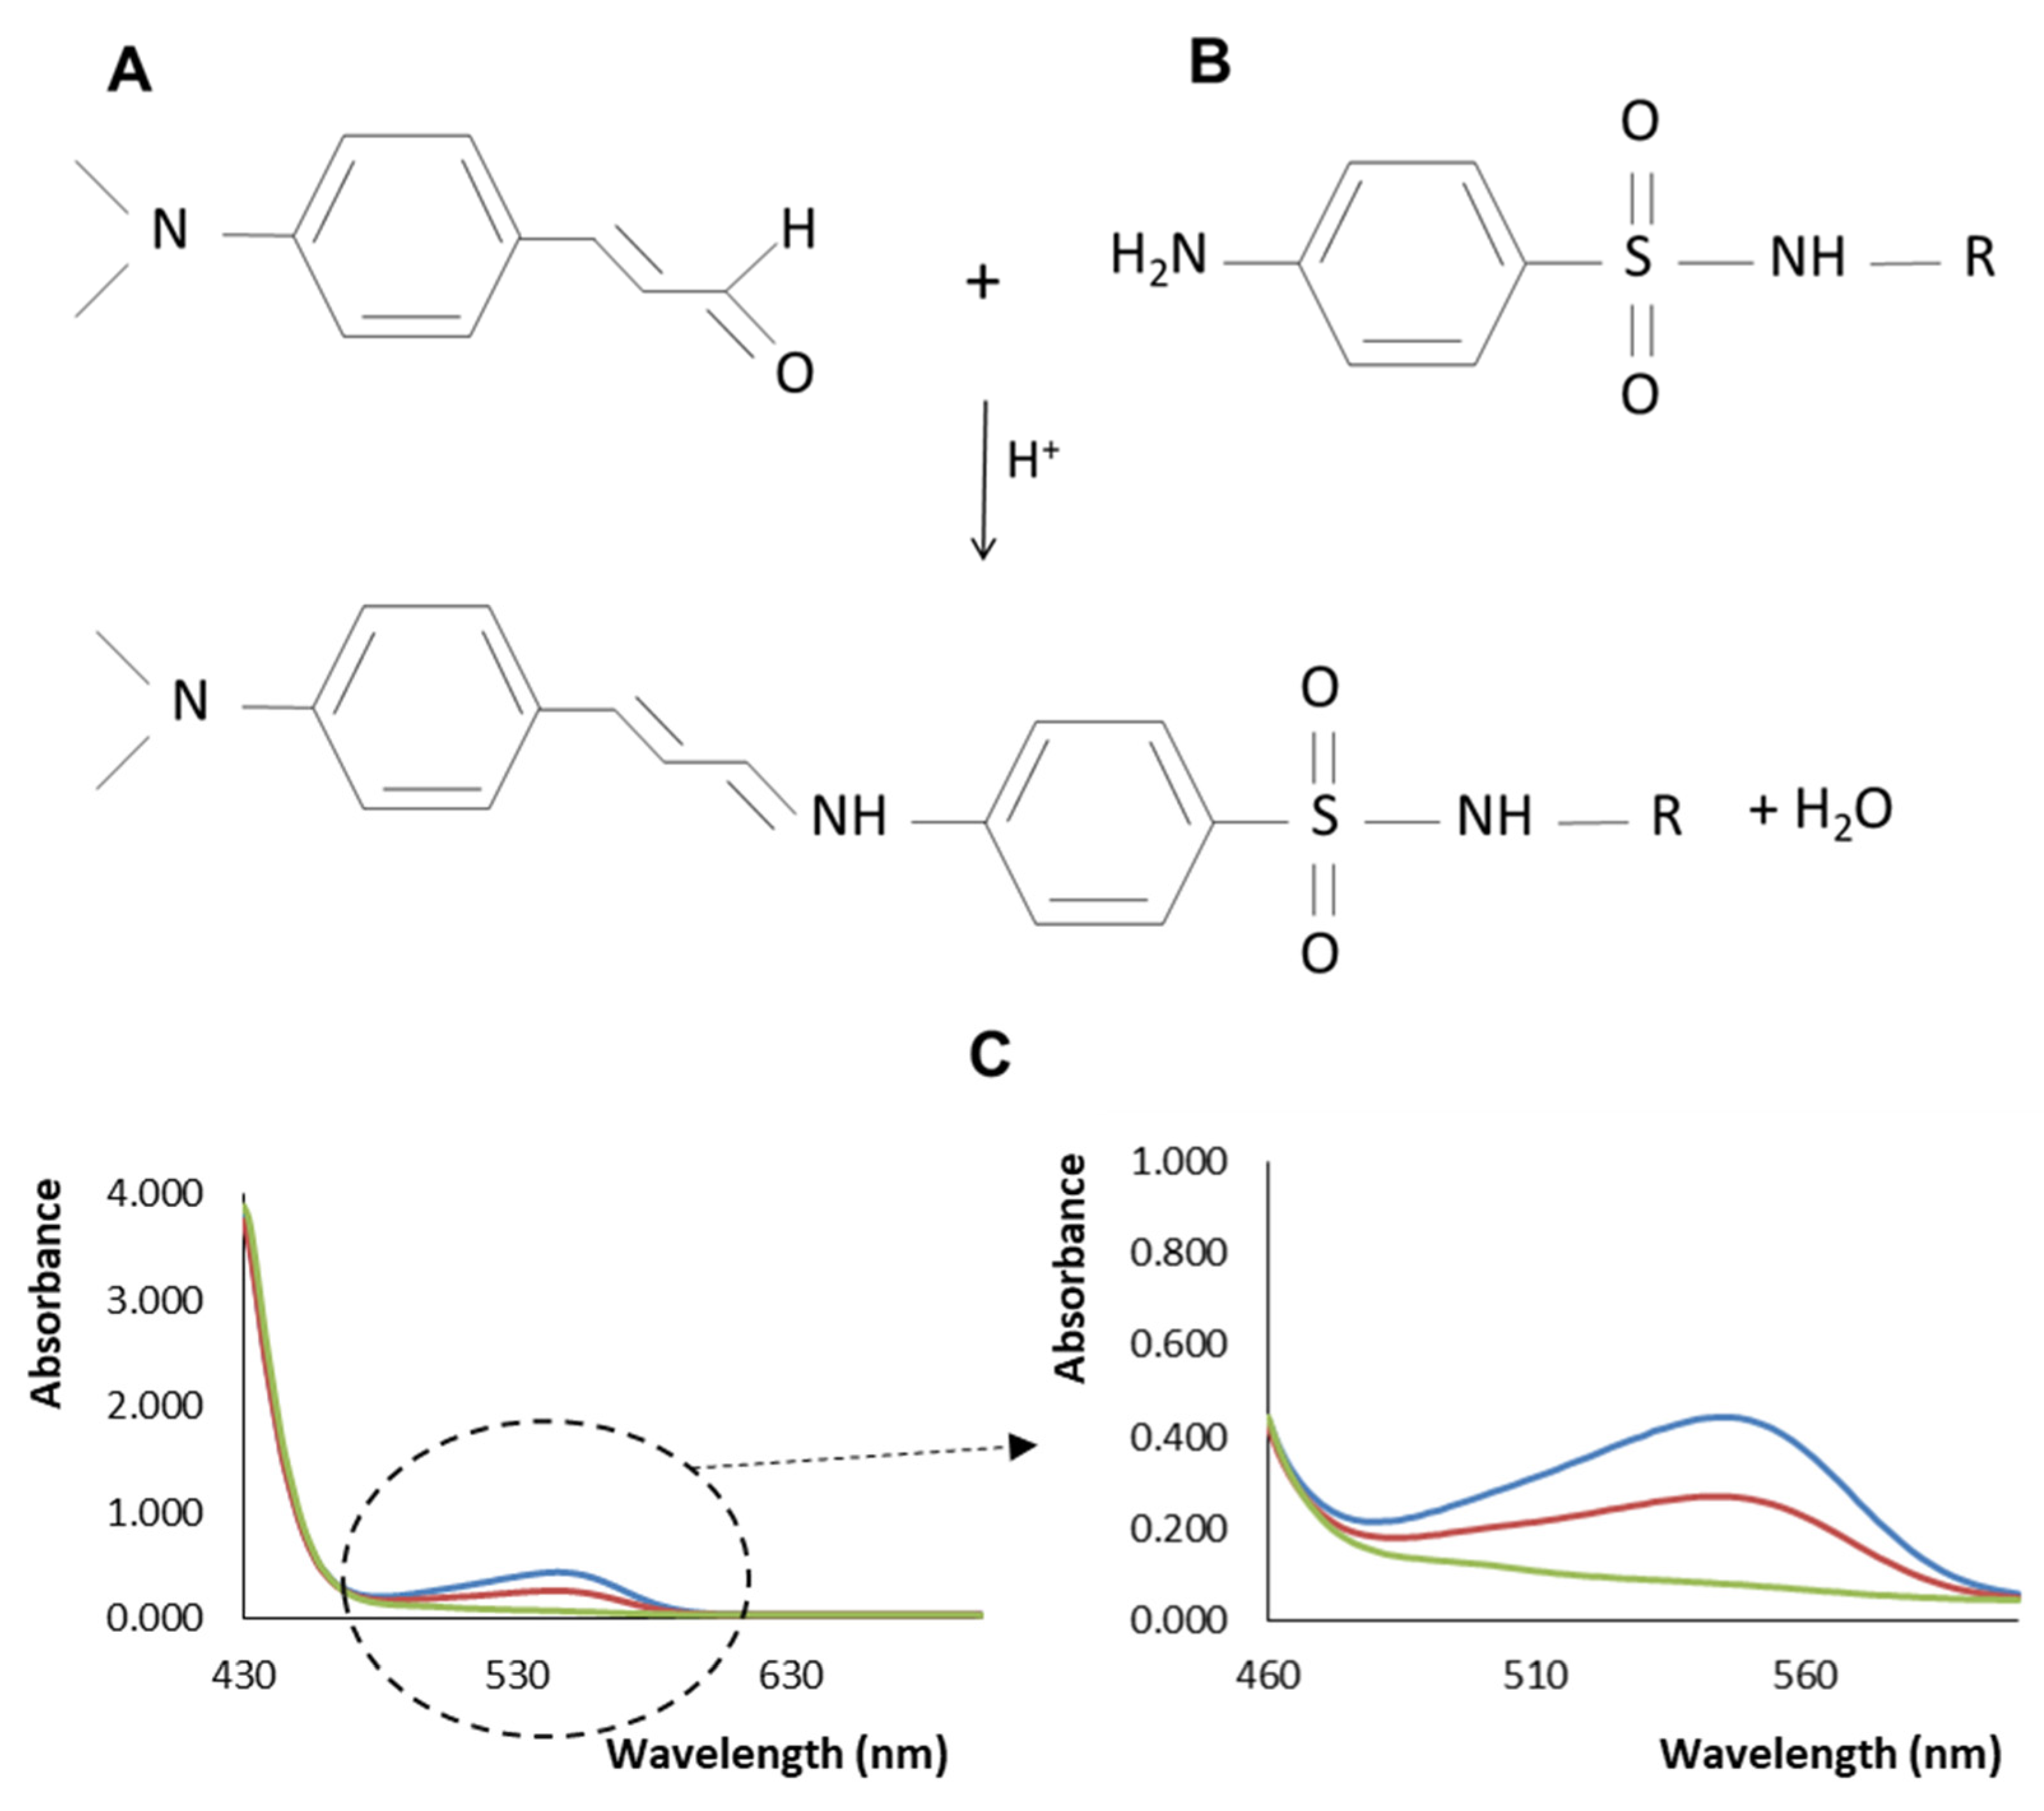
3.1. Reaction Conditions

The colorimetric reaction between DMACA and aromatic amines, including sulfonamides, is based on the condensation between the formyl group of DMACA and the amino group of sulfonamides, which results in a violet-red, stable-colored product corresponding to a Schiff base (Figure 2) [43,46,47,48]. Several working parameters related to DMACA and SMZ reactions were evaluated previously [43], where it was found that the color intensity of the reaction product was proportional to the concentration of sulfonamides, as depicted in the spectrum shown in Figure 2. In the present work, this relation was evaluated upon probing at the disk surface, where the reaction product was immobilized and concentrated.

3.2. Solid Phase Extraction Support

A membrane-based solid support was chosen to perform solid-phase extraction and as a platform for color development. SDB-RPS is a resin that has been modified with sulfonic acid groups to make it hydrophilic and prone to cationic exchange. The aromatic nature of the styrene divinylbenzene allows π-π electron interactions with analytes containing the aromatic functionality, while the sulfonic acid group aids the retention of positively charged species.
The influence of the AttractSPE™ and Empore™ disk conditioning on analyte retention was evaluated. For this, SMZ standard working solutions of 10 and 15 μg L−1 were loaded through both conditioned and unconditioned disks. Regarding the AttractSPE™ disks, as no colored product was seen after adding the color reagent, no detectable SMZ recovery was observed. In fact, the sorbent particles and the PTFE components of the disk are both hydrophobic when dry, therefore an aqueous solution cannot properly wet the surface. Thus, the disk conditioning with organic solvents (acetone, isopropanol and methanol) allows the reduction of surface tension and the solvation of the hydrocarbon chains. On the other hand, the colored product of the SMZ and DMACA reaction was visualized on the surface of the Empore™ disks even without conditioning, as demonstrated in previous research [43]. Despite the general composition of the AttractSPE™ and Empore™ disks being the same (sulfonated styrene divinylbenzene entrapped in a matrix of inert PTFE), the fabrication of the AttractSPE™ and the Empore™ membranes differ, in the latter leading to a lower surface tension and higher availability of the hydrocarbon chains even without conditioning.
Additionally, with respect to the AttractSPE™ disks, the color stability study showed that the images should be acquired from 1 to 5 min after DMACA addition, because after that period the color (probed as a_star coordinate) response started to decrease, providing values under 80%. The color instability may be promoted by the solid membrane characteristics; the interaction with SMZ might be weaker, or the hygroscopic capacity of the disk could be high, leading to a higher water content on the disk surface that can evaporate after DMACA addition, promoting color degradation. Otherwise, the Empore™ disks showed lower color degradation than the AttractSPE™ disks, as 10 min after DMACA reagent addition there was only a 13% decrease from the initial values. The Empore™ disks were used for further method development, providing <10% color bleach within the first 3 min of reaction.

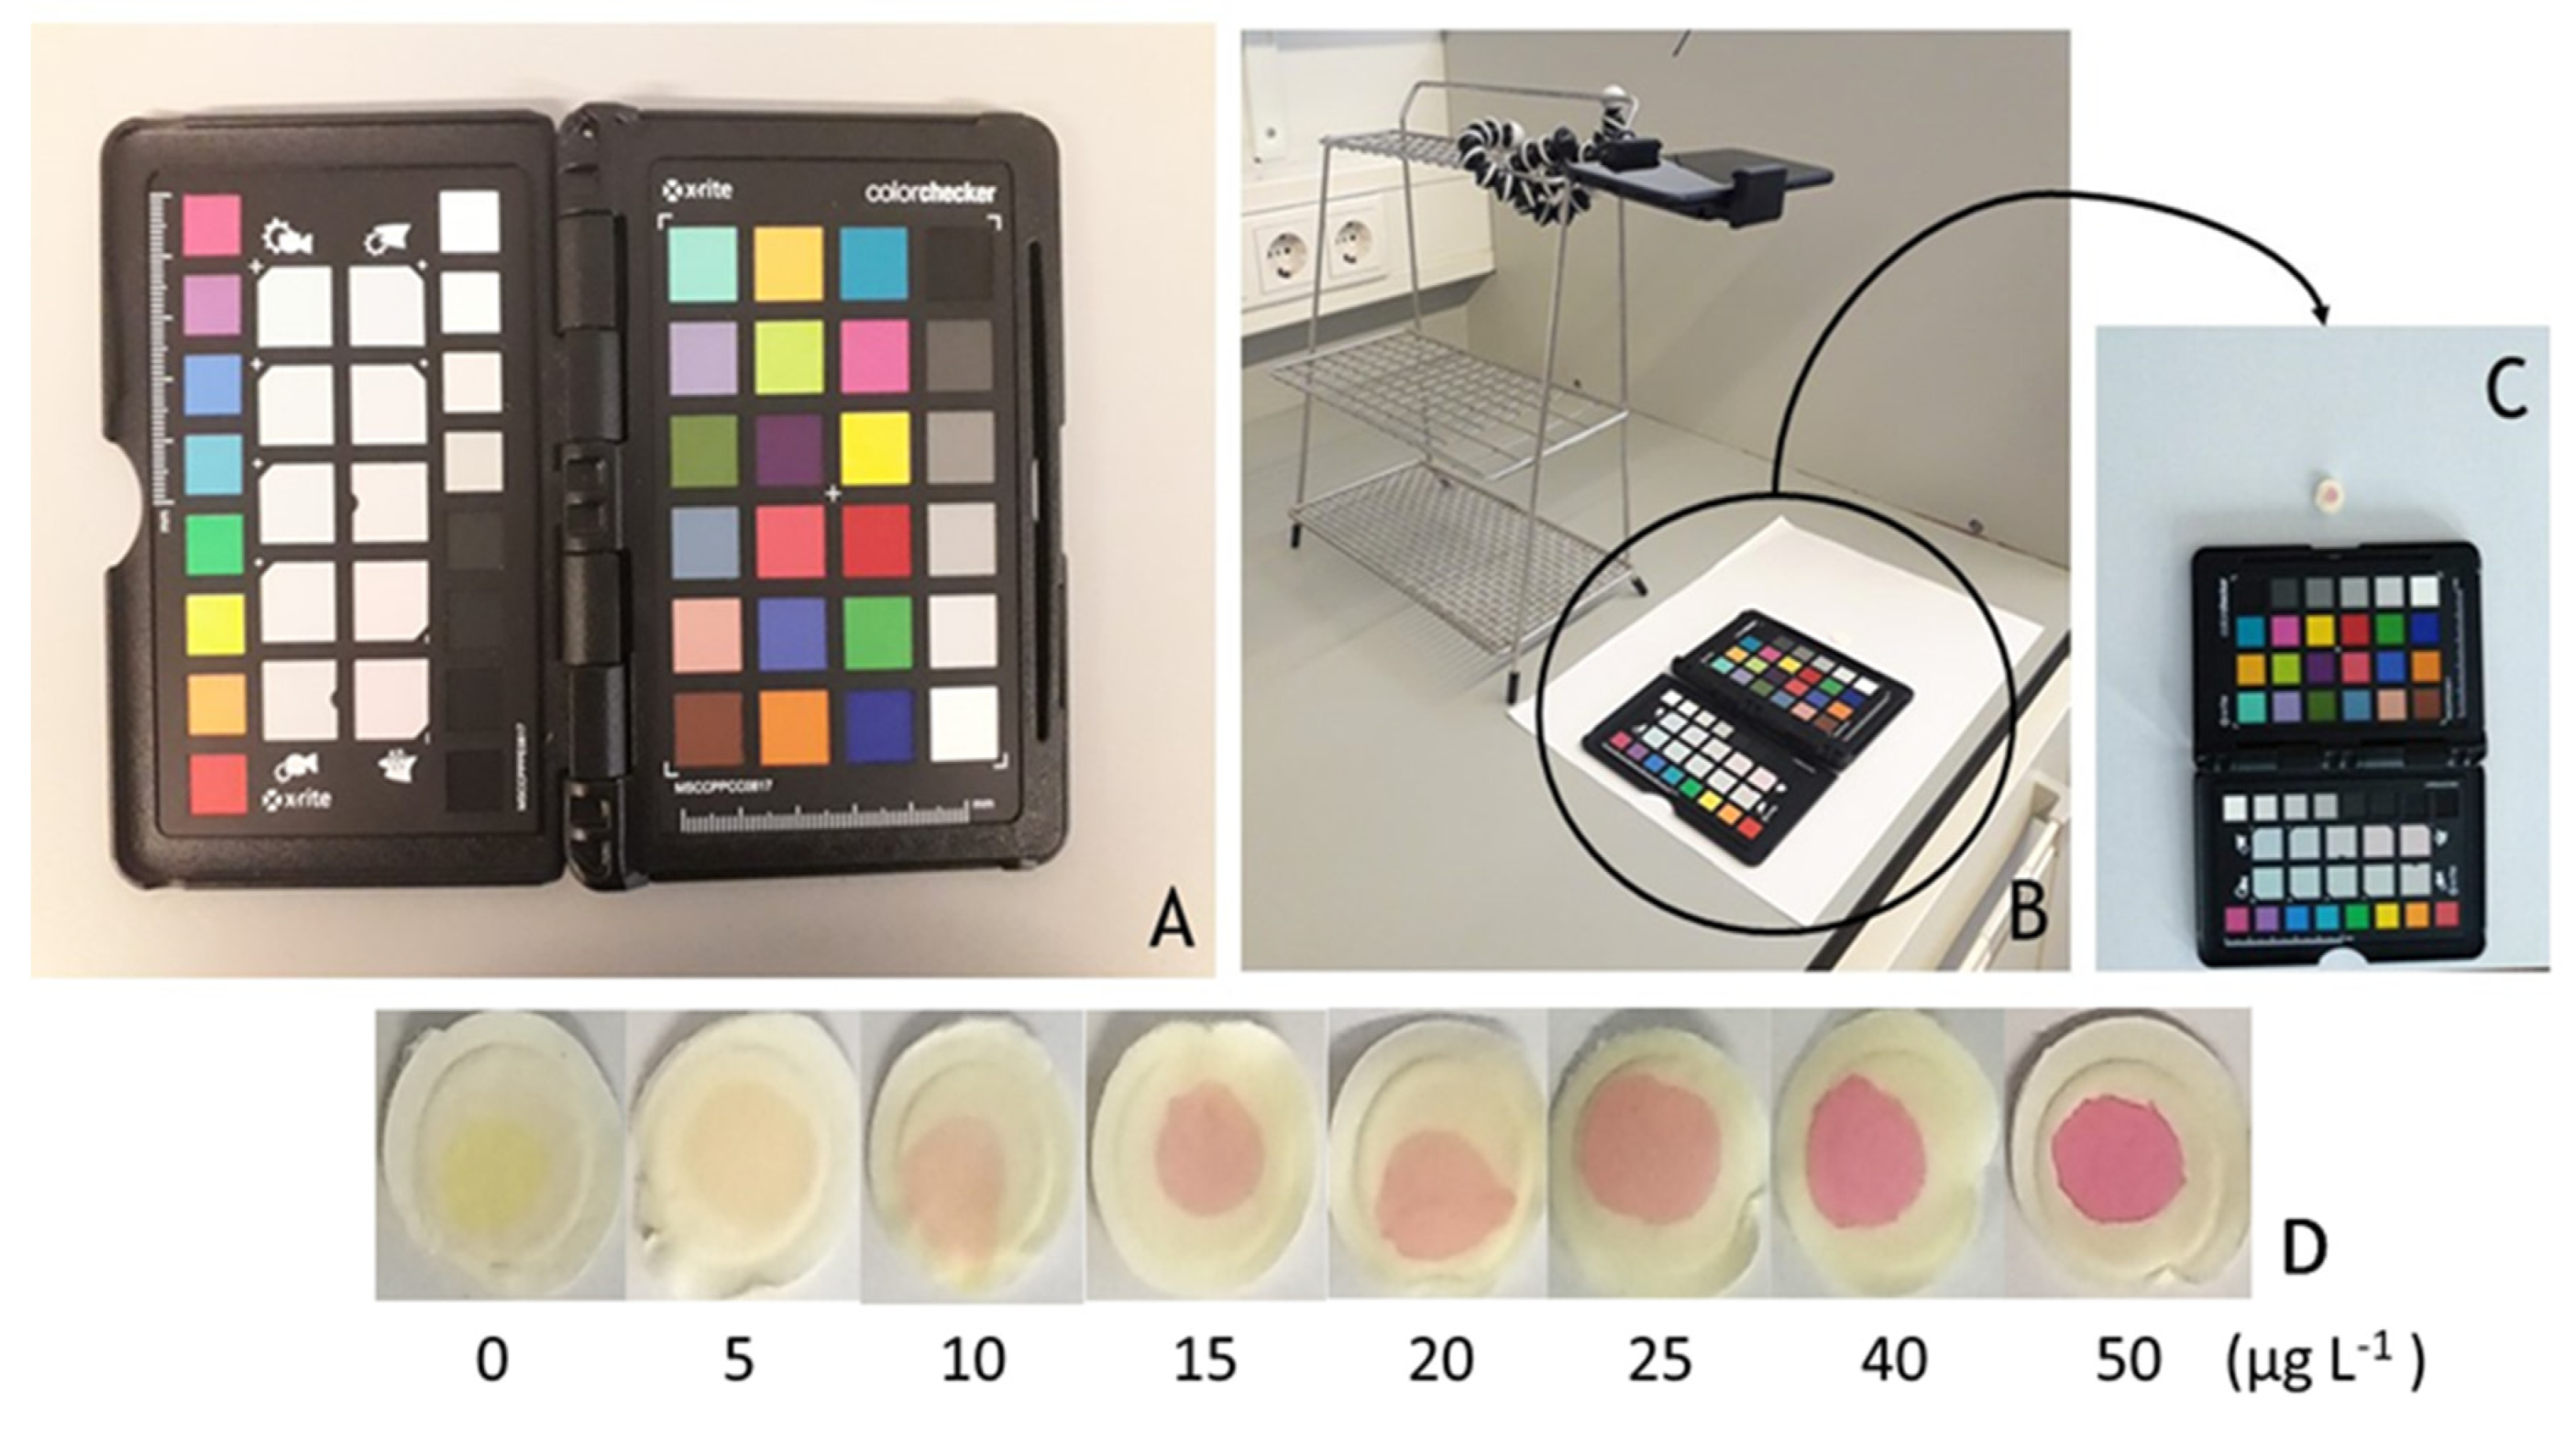
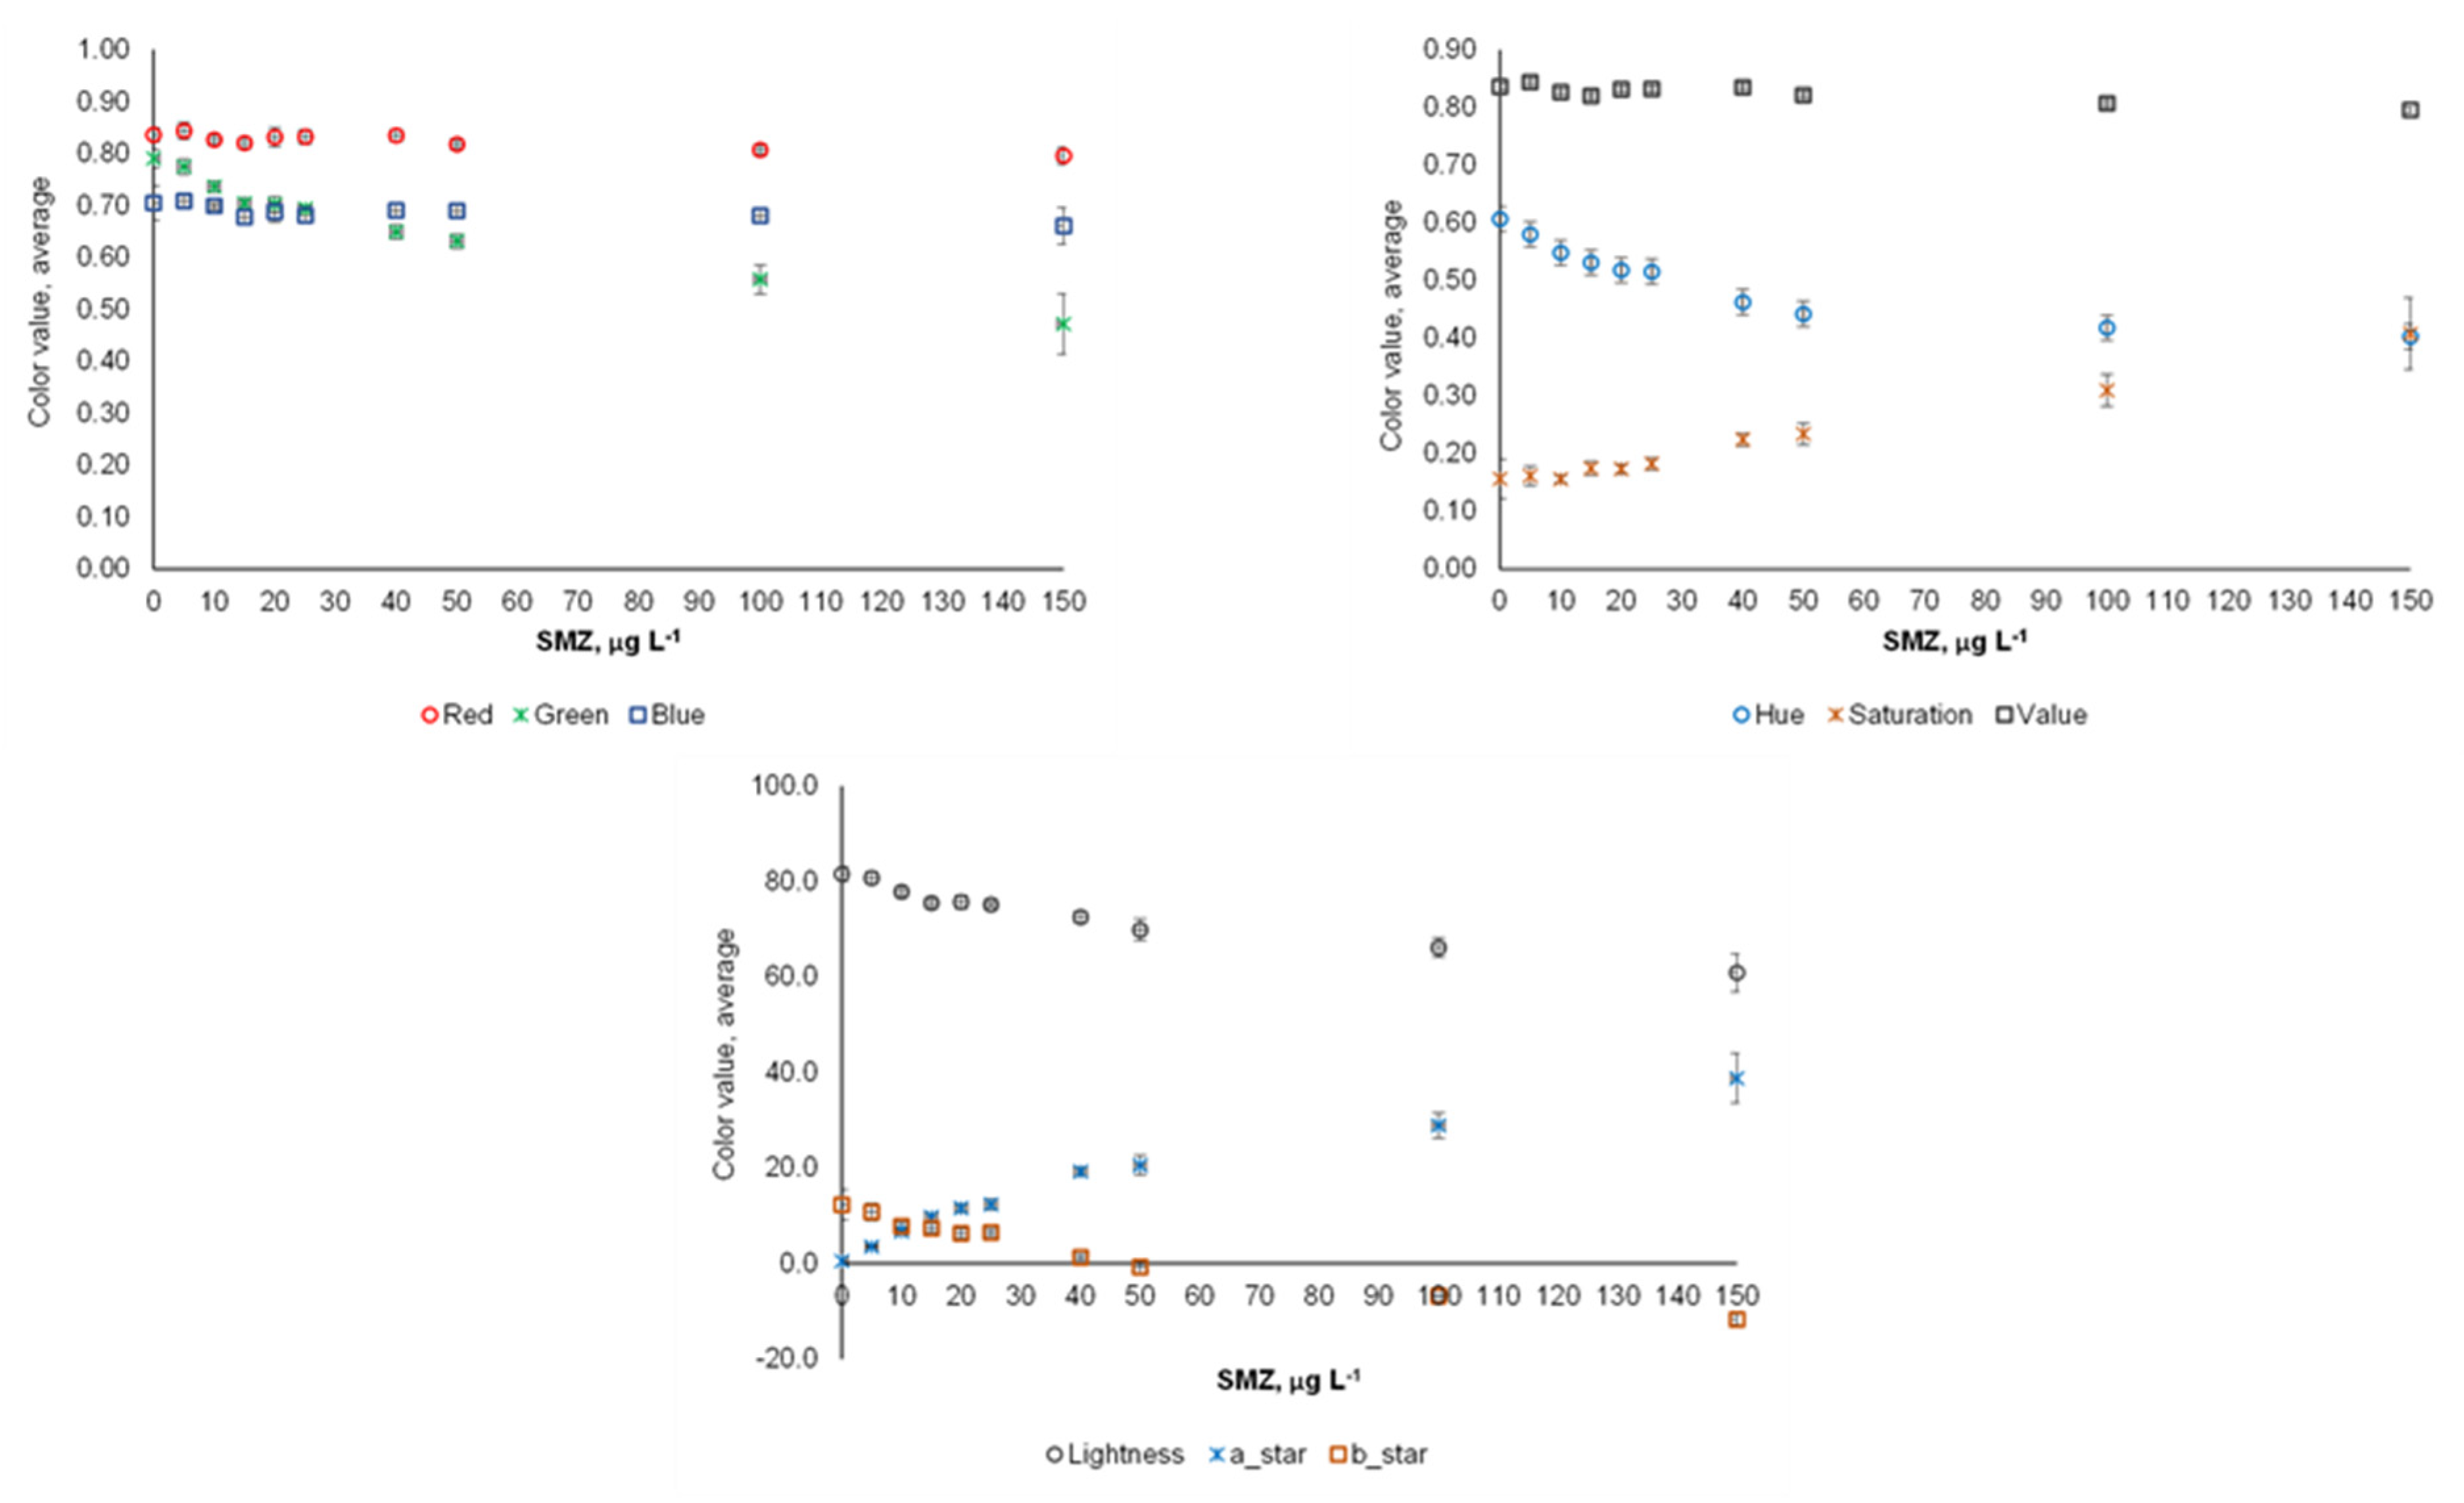
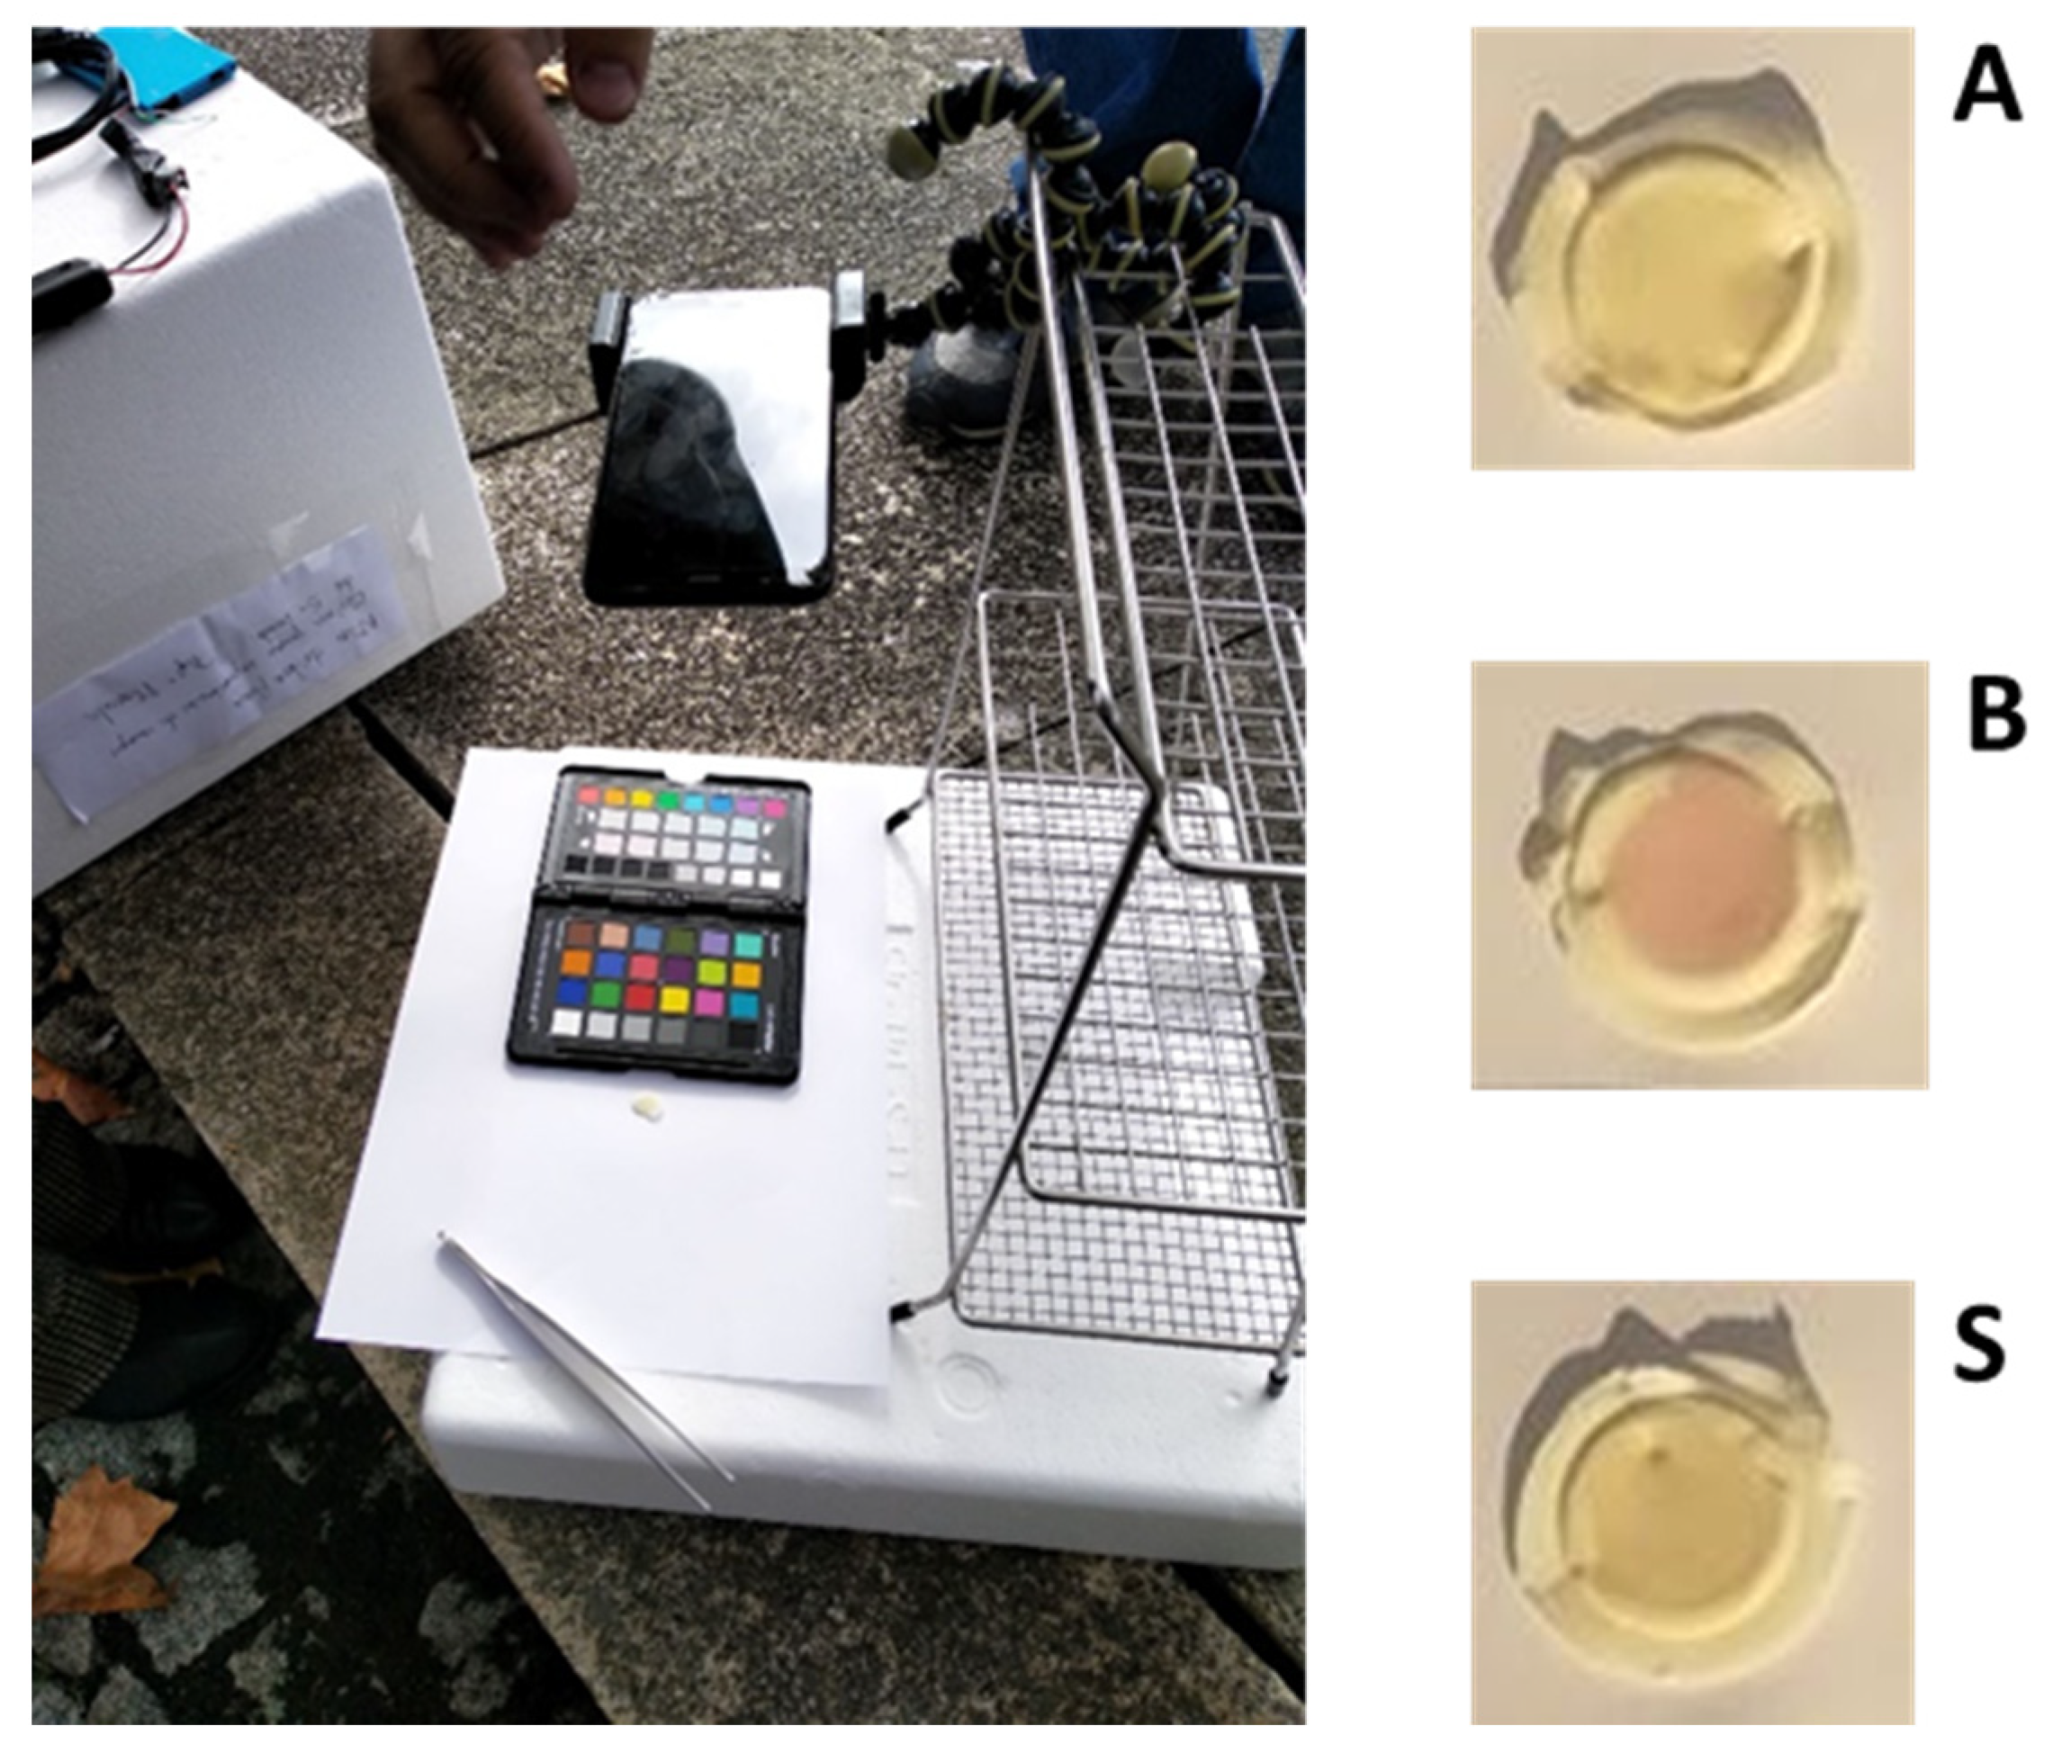
3.3. Image Acquisition and Data Processing Features

Prior to performing the color correction, a method to automatically detect the ROIs (patches of the color chart and the colored product on the disk surface) was applied. First, segmentation of the color chart and the color patches was performed. Then, the disk and the region containing the colored product were also segmented. The details about the segmentation method have been described in more detail elsewhere [44].
The relation between color and SMZ concentration in the range of 0 to 150 μg L−1 was evaluated using RGB (Red, Green, Blue), HSV (Hue, Saturation, Value) and CIELAB (L, a_star, b_star) color spaces (Figure 3). The RGB results demonstrated a smaller variation in the Blue and Red coordinates, while a decrease of the Green component was observed according to the SMZ concentration. This trend can be correlated with the CIELAB coordinates. The a_star values increased as the concentration of SMZ increased (positive slope). This coordinate is related to the red and green components of the color, being expressed as an axis. The red component of the color is in the positive direction of the axis. An increasing a_star value means that a higher SMZ concentration is present, causing the development of a reddish color. By data analysis, one specific coordinate was selected for further evaluation due to its higher sensitivity.
The influence of light conditions on the algorithm response was also evaluated. In a first experiment, images of the colored product on the disks were acquired inside the laboratory, and in a second experiment, image acquisition was performed outdoors. Color values at the different light conditions were significantly different for SMZ at 10 µg L−1 (tcalc = 3.29, ttab = 2.78, α = 0.05) but similar for SMZ at 25 µg L−1 (tcalc = 1.54, ttab = 2.78, α = 0.05), indicating that the algorithm was not able to correct for illumination conditions for the target concentrations.
Hence, a strategy based on the ratio between the a_star coordinate obtained for the colored product and for each color patch (from the color chart) was considered, with the aim of enhancing detection performance. From the 24 evaluated color patches, seven of them improved the similarity between the color readings obtained under different illumination conditions (see Table 1), as tcalc < ttab, indicating that the mean value for each condition was not significantly different. For the selection of the most appropriate color patch (Figure S2), we compared the regression equations of the seven color patch ratios. We observed a higher sensitivity to color patches 1 (slope 0.028 ± 0.002) and 2 (slope 0.034 ± 0.002) for the SMZ calibration curve from 0 to 40 µg L−1. Although the correction using patch 2 showed a higher sensitivity, results corrected by patch 1 provided a better correlation from concentration values and signals (R2 = 0.967 for patch 1 vs. R2 = 0.958 for patch 2) and this was selected for further assessments.

3.4. Figures of Merit and Application to Environmental Screening

The influence of different sample volumes on the retention of sulfamethoxazole in the disks was studied in order to try to attain the lower detection limits compatible with environmental analysis. Considering this purpose, the retention of the same amount of SMZ (0.1 and 0.5 μg), using different sample volumes (10, 25 and 50 mL) was performed. For data treatment purposes, the coordinate a_star from CIELAB spaces was considered after correction from the patch 1 value as described above, with recovery results summarized in Table 2.
In general, recoveries close to 80–120% were observed, with the values of 161% and 63% being outliers. In both situations, extreme experimental conditions were tested. For the lowest recovery of 63%, this corresponded to the largest volume tested (50 mL) with the highest concentration tested for this volume (10 µg L−1). In this case, it is possible that analyte pre-elution occurred, justifying the low recovery. The other extreme situation corresponded to the loading of 10 mL of a 10 µg L−1 SMZ solution, where the target SMZ mass is close to the LOD (please see below). This situation is seen in two other experiments, where larger volumes were used for lower concentrations, thus providing acceptable recoveries (>77%). For the overestimated result of 161%, it is possible that an error in image acquisition or processing has occurred, and due to the closeness of the expected value regarding the LOD, this should be considered as possibly causing a large deviation from the expected value.
The limit of detection (LOD) and limit of quantification (LOQ) were estimated based on the standard deviation of the signal obtained for disks processed with the standard matrix (0 μg L−1, n = 10), and corresponded to 3 × and 10 ×, respectively. Values of 0.08 and 0.26 µg were obtained, corresponding to 8 and 26 µg L−1 for a 10 mL sample and to 3.2 and 10 µg L−1 for 25 mL.
To demonstrate the applicability of the proposed methodology, experiments were performed under lab and field conditions. Using a 25 mL sample, a mean recovery of 94.8% was attained for standards containing 10 or 25 µg L−1 of SMZ. For a sample collected from Douro River, SMZ was not detected and recoveries of 90.4% and 58.1% were observed with the addition of 10 or 25 µg L−1 of SMZ, respectively. As an acceptable recovery was obtained for the lowest concentration, pre-elution effects by matrix components may justify the lower recovery observed for the highest concentration. Additionally, a field experiment was undertaken as proof of concept, and SMZ was not detected in the tested samples, as depicted in Figure 4. An Android application is currently under final development [49] which will allow users to automatically process a picture of the disk taken close to the color palette and will return the estimated concentration of sulfamethoxazole in the sample without requiring either an internet connection or specific analysis equipment.
Other methods proposed for evaluation of sulfonamides in environmental waters using the same colorimetric reaction either require a dedicated automated manifold that is not commercially available [47,50] or involve a desorption step of the retained SMZ in the solid support, making the analytical process longer and requiring more organic solvent and the use of microplate equipment [43]. Moreover, compared to other methods developed for screening [43,50,51], the present method offers similar LOD values, particularly when using 25 mL of sample. Finally, there are methods that provided lower LOD values, but they require chromatographic equipment connected to fluorimeters [52] or mass spectrometry detectors [53,54,55], and this type of technology cannot be applied in the field in the manner of our proposed mobile device sensor.

4. Conclusions

Screening for antibiotics in the environment can help prevent the surge of antibiotic resistance by detecting contaminated sites for further remediation. The proposed methodology using a commercially available disk sorbent to preconcentrate SMZ as a model of sulfonamides antibiotics with associated image analysis was shown to be useful for screening purposes, providing quantitative results at the microgram per liter level using only 10 mL of sample. The proposed methodology enables the screening of potential samples to identify those that require further, detailed, laboratorial analysis. The use of a rapid, on-site, user-friendly and low-cost methodology allows for extensive spatial-temporal monitoring of aquatic ecosystems, particularly those subject to heavy anthropogenic contamination. Therefore, the application of the methodology in-field will help ensure on-time/on-site implementation of mitigation strategies in accordance with national, WHO and United Nations directives.
The present work is a clear example of the benefits of the association of technology, particularly computer vision-based algorithms, to separation science and colorimetry. The availability of a dedicated app is envisioned, which can also contribute to the implementation of citizen science, where non-scientist members of the community can engage in environmental contamination data collection.

Supplementary Materials

The following are available online at https://0-www-mdpi-com.brum.beds.ac.uk/article/10.3390/chemosensors10010025/s1, Figure S1: Experimental apparatus for solid-phase extraction performed in the laboratory (A. Extraction disk; B. Placement of disk in the holder; C. Flow set-up for SPE); Figure S2: Detail of the color palette with numbers assigned to each patch.

Author Contributions

Conceptualization, A.A.B., H.P.O. and M.A.S.; methodology, P.H.C., H.P.O. and M.A.S.; software, H.P.O.; validation, L.B. and M.A.S.; formal analysis, P.S.P., P.H.C. and L.B.; investigation, P.S.P. and A.M.; resources, A.A.B., H.P.O. and M.A.S.; data curation, P.S.P. and M.A.S.; writing—original draft preparation, P.S.P.; writing—review and editing, P.S.P., A.M., L.B., A.A.B., H.P.O. and M.A.S.; visualization, P.S.P. and M.A.S.; supervision, H.P.O. and M.A.S.; project administration, A.A.B., H.P.O. and M.A.S.; funding acquisition, A.A.B., H.P.O. and M.A.S. All authors have read and agreed to the published version of the manuscript.

Funding

This work received financial support from the European Union (FEDER funds through COMPETE POCI-01-0145-FEDER-031756) and National Funds (FCT/MEC, Fundação para a Ciência e Tecnologia and Ministério da Ciência, Tecnologia e Ensino Superior) through project PTDC/CTAAMB/31756/2017. Financial support from PT national funds (FCT/MCTES) through the project UIDB/50006/2020 is also acknowledged. L. Barreiros acknowledges funding from FCT through program DL 57/2016—Norma transitória.

Institutional Review Board Statement

Not applicable.

Data Availability Statement

Data is available upon written request to authors.

Acknowledgments

Diana Cunha and Ana Rosa Silva are acknowledged for technical assistance in lab and field experiments.

Conflicts of Interest

The authors declare no conflict of interest.

References

  1. Martinez, J.L. Environmental pollution by antibiotics and by antibiotic resistance determinants. Environ. Pollut. 2009, 157, 2893–2902. [Google Scholar] [CrossRef]
  2. European Centre for Disease Prevention and Control (ECDC); European Food Safety Authority (EFSA); European Medicines Agency (EMA). Third Joint Inter-Agency Report on Integrated Analysis of Consumption of Antimicrobial Agents and Occurrence of Antimicrobial Resistance in Bacteria from Humans and Food-Producing Animals in the EU/EEA, JIACRA III. 2016–2018; ECDC: Stockholm, Sweden; EFSA: Parma, Italy; EMA: Amsterdam, The Netherlands, 2021. Available online: https://www.ecdc.europa.eu/sites/default/files/documents/JIACRA-III-Antimicrobial-Consumption-and-Resistance-in-Bacteria-from-Humans-and-Animals.pdf (accessed on 23 December 2021).
  3. Martin-Laurent, F.; Topp, E.; Billet, L.; Batisson, I.; Malandain, C.; Besse-Hoggan, P.; Morin, S.; Artigas, J.; Bonnineau, C.; Kergoat, L.; et al. Environmental risk assessment of antibiotics in agroecosystems: Ecotoxicological effects on aquatic microbial communities and dissemination of antimicrobial resistances and antibiotic biodegradation potential along the soil-water continuum. Environ. Sci. Pollut. Res. 2019, 26, 18930–18937. [Google Scholar] [CrossRef]
  4. Liu, X.W.; Lv, K.; Deng, C.X.; Yu, Z.M.; Shi, J.H.; Johnson, A.C. Persistence and migration of tetracycline, sulfonamide, fluoroquinolone, and macrolide antibiotics in streams using a simulated hydrodynamic system. Environ. Pollut. 2019, 252, 1532–1538. [Google Scholar] [CrossRef] [PubMed]
  5. Committee for Medicinal Products for Veterinary use (CVMP); Committee for Medicinal Products for Human Use (CHMP). Categorisation of Antibiotics in the European Union Answer to the Request from the European Commission for Updating the Scientific Advice on the Impact on Public Health and Animal Health of the Use of Antibiotics in Animals—EMA/CVMP/CHMP/682198/2017; European Medicines Agency (EMA): Amsterdam, The Netherlands, 2019. Available online: https://www.ema.europa.eu/en/documents/report/categorisation-antibiotics-european-union-answer-request-european-commission-updating-scientific_en.pdf (accessed on 23 December 2021).
  6. WHO Advisory Group on Integrated Surveillance of Antimicrobial Resistance (AGISAR). Critically Important Antimicrobials for Human Medicine, 6th ed.; World Health Organization (WHO): Geneva, Switzerland, 2019; Available online: https://www.who.int/publications/i/item/9789241515528 (accessed on 23 December 2021).
  7. Official Journal of the European Union. Comission Implementing Decision (EU) 2018/840 of 5 June 2018 Establishing a Watch List of Substances for Union-Wide Monitoring in the Field of Water Policy Pursuant to Directive 2008/105/EC of the European Parliament and of the Council and Repealing Commission Implementing Decision (EU) 2015/495. Available online: https://eur-lex.europa.eu/eli/dec_impl/2018/840/oj (accessed on 23 December 2021).
  8. Gomez Cortes, L.; Marinov, D.; Sanseverino, I.; Navarro Cuenca, A.; Niegowska, M.; Porcel Rodriguez, E.; Lettieri, T. Selection of Substances for the 3rd Watch List under the Water Framework Directive; EUR 30297 EN; Luxembourg Publications Office of the European Union: Luxembourg, 2020; JRC121346. [Google Scholar] [CrossRef]
  9. Kovalakova, P.; Cizmas, L.; McDonald, T.J.; Marsalek, B.; Feng, M.B.; Sharma, V.K. Occurrence and toxicity of antibiotics in the aquatic environment: A review. Chemosphere 2020, 251, 126351. [Google Scholar] [CrossRef]
  10. Lorenzo, P.; Adriana, A.; Jessica, S.; Caries, B.; Marinella, F.; Marta, L.; Luis, B.J.; Pierre, S. Antibiotic resistance in urban and hospital wastewaters and their impact on a receiving freshwater ecosystem. Chemosphere 2018, 206, 70–82. [Google Scholar] [CrossRef]
  11. Ngigi, A.N.; Magu, M.M.; Muendo, B.M. Occurrence of antibiotics residues in hospital wastewater, wastewater treatment plant, and in surface water in Nairobi County, Kenya. Environ. Monit. Assess. 2020, 192, 18. [Google Scholar] [CrossRef] [PubMed]
  12. Nantaba, F.; Wasswa, J.; Kylin, H.; Palm, W.U.; Bouwman, H.; Kummerer, K. Occurrence, distribution, and ecotoxicological risk assessment of selected pharmaceutical compounds in water from Lake Victoria, Uganda. Chemosphere 2020, 239, 124642. [Google Scholar] [CrossRef] [PubMed]
  13. Franklin, A.M.; Williams, C.F.; Watson, J.E. Assessment of Soil to Mitigate Antibiotics in the Environment Due to Release of Wastewater Treatment Plant Effluent. J. Environ. Qual. 2018, 47, 1347–1355. [Google Scholar] [CrossRef] [PubMed] [Green Version]
  14. Tran, N.H.; Hoang, L.; Nghiem, L.D.; Nguyen, N.M.H.; Ngo, H.H.; Guo, W.S.; Trinh, Q.T.; Mai, N.; Chen, H.T.; Nguyen, D.D.; et al. Occurrence and risk assessment of multiple classes of antibiotics in urban canals and lakes in Hanoi, Vietnam. Sci. Total Environ. 2019, 692, 157–174. [Google Scholar] [CrossRef]
  15. Peixoto, P.S.; Toth, I.V.; Segundo, M.A.; Lima, J.L.F.C. Fluoroquinolones and sulfonamides: Features of their determination in water. A review. Int. J. Environ. Anal. Chem. 2016, 96, 185–202. [Google Scholar] [CrossRef]
  16. Dmitrienko, S.G.; Kochuk, E.V.; Apyari, V.V.; Tolmacheva, V.V.; Zolotov, Y.A. Recent advances in sample preparation techniques and methods of sulfonamides detection—A review. Anal. Chim. Acta 2014, 850, 6–25. [Google Scholar] [CrossRef] [PubMed]
  17. Xie, X.T.; Huang, S.Y.; Zheng, J.; Ouyang, G.F. Trends in sensitive detection and rapid removal of sulfonamides: A review. J. Sep. Sci. 2020, 43, 1634–1652. [Google Scholar] [CrossRef] [PubMed]
  18. Lahcen, A.A.; Amine, A. Mini-review: Recent Advances in Electrochemical Determination of Sulfonamides. Anal. Lett. 2018, 51, 424–441. [Google Scholar] [CrossRef]
  19. Zhang, D.M.; Liu, Q.J. Biosensors and bioelectronics on smartphone for portable biochemical detection. Biosens. Bioelectron. 2016, 75, 273–284. [Google Scholar] [CrossRef] [PubMed]
  20. Firdaus, M.L.; Aprian, A.; Meileza, N.; Hitsmi, M.; Elvia, R.; Rahmidar, L.; Khaydarov, R. Smartphone coupled with a paper-based colorimetric device for sensitive and portable mercury ion sensing. Chemosensors 2019, 7, 25. [Google Scholar] [CrossRef] [Green Version]
  21. Sidlo, M.; Lubal, P.; Anzenbacher, P. Colorimetric chemosensor array for determination of halides. Chemosensors 2021, 9, 39. [Google Scholar] [CrossRef]
  22. Voskoboynikova, O.; Sukhanov, A.; Duerkop, A. Optical pH sensing in milk: A small puzzle of indicator concentrations and the best detection method. Chemosensors 2021, 9, 177. [Google Scholar] [CrossRef]
  23. Capitan-Vallvey, L.F.; Lopez-Ruiz, N.; Martinez-Olmos, A.; Erenas, M.M.; Palma, A.J. Recent developments in computer vision-based analytical chemistry: A tutorial review. Anal. Chim. Acta 2015, 899, 23–56. [Google Scholar] [CrossRef]
  24. Woolf, M.S.; Dignan, L.M.; Scott, A.T.; Landers, J.P. Digital postprocessing and image segmentation for objective analysis of colorimetric reactions. Nat. Protoc. 2021, 16, 218–238. [Google Scholar] [CrossRef]
  25. Shrivas, K.; Patel, S.; Sinha, D.; Thakur, S.S.; Patle, T.K.; Kant, T.; Dewangan, K.; Satnami, M.L.; Nirmalkar, J.; Kumar, S. Colorimetric and smartphone-integrated paper device for on-site determination of arsenic (III) using sucrose modified gold nanoparticles as a nanoprobe. Microchim. Acta 2020, 187, 173. [Google Scholar] [CrossRef]
  26. Muhammad-aree, S.; Teepoo, S. On-site detection of heavy metals in wastewater using a single paper strip integrated with a smartphone. Anal. Bioanal. Chem. 2020, 412, 1395–1405. [Google Scholar] [CrossRef]
  27. Bai, C.-B.; Liu, X.-Y.; Zhang, J.; Qiao, R.; Dang, K.; Wang, C.; Wei, B.; Zhang, L.; Chen, S.-S. Using Smartphone APP to Determine the CN- Concentration Quantitatively in Tap Water: Synthesis of the Naked-Eye Colorimetric Chemosensor for CN- and Ni2+ Based on Benzothiazole. ACS Omega 2020, 5, 2488–2494. [Google Scholar] [CrossRef] [PubMed] [Green Version]
  28. Shrivas, K.; Monisha; Kant, T.; Karbhal, I.; Kurrey, R.; Sahu, B.; Sinha, D.; Patra, G.K.; Deb, M.K.; Pervez, S. Smartphone coupled with paper-based chemical sensor for on-site determination of iron(III) in environmental and biological samples. Anal. Bioanal. Chem. 2020, 412, 1573–1583. [Google Scholar] [CrossRef] [PubMed]
  29. Erdemir, S.; Malkondu, S. On-site and low-cost detection of cyanide by simple colorimetric and fluorogenic sensors: Smartphone and test strip applications. Talanta 2020, 207, 120278. [Google Scholar] [CrossRef]
  30. Maruthupandi, M.; Thiruppathi, D.; Vasimalai, N. One minute synthesis of green fluorescent copper nanocluster: The preparation of smartphone aided paper-based kit for on-site monitoring of nanomolar level mercury and sulfide ions in environmental samples. J. Hazard. Mater. 2020, 392, 122294. [Google Scholar] [CrossRef] [PubMed]
  31. Zhai, H.-M.; Zhou, T.; Fang, F.; Wu, Z.-Y. Colorimetric speciation of Cr on paper-based analytical devices based on field amplified stacking. Talanta 2020, 210, 120635. [Google Scholar] [CrossRef] [PubMed]
  32. Arsawiset, S.; Teepoo, S. Ready-to-use, functionalized paper test strip used with a smartphone for the simultaneous on-site detection of free chlorine, hydrogen sulfide and formaldehyde in wastewater. Anal. Chim. Acta 2020, 1118, 63–72. [Google Scholar] [CrossRef]
  33. Xu, W.; Lu, S.S.; Chen, Y.Y.; Zhao, T.T.; Jiang, Y.Q.; Wang, Y.R.; Chen, X. Simultaneous color sensing of O2 and pH using a smartphone. Sens. Actuator B Chem. 2015, 220, 326–330. [Google Scholar] [CrossRef]
  34. Ehtesabi, H.; Roshani, S.; Bagheri, Z.; Yaghoubi-Avini, M. Carbon dots-Sodium alginate hydrogel: A novel tetracycline fluorescent sensor and adsorber. J. Environ. Chem. Eng. 2019, 7, 103419. [Google Scholar] [CrossRef]
  35. Wang, Y.; Zhang, L.; Yang, L.; Chang, G. An indole-based smart aerogel for simultaneous visual detection and removal of trinitrotoluene in water via synergistic effect of dipole-pi and donor-acceptor interactions. Chem. Eng. J. 2020, 384, 123358. [Google Scholar] [CrossRef]
  36. Zhang, Y.; Cai, Y.; Dong, F.; Bian, L.; Li, H.; Wang, J.; Du, J.; Qi, X.; He, Y. Chemically modified mesoporous wood: A versatile sensor for visual colorimetric detection of trinitrotoluene in water, air, and soil by smartphone camera. Anal. Bioanal. Chem. 2019, 411, 8063–8071. [Google Scholar] [CrossRef] [PubMed]
  37. Amin, N.; Torralba, A.S.; Alvarez-Diduk, R.; Afkhami, A.; Merkoci, A. Lab in a Tube: Point-of-Care Detection of Escherichia coli. Anal. Chem. 2020, 92, 4209–4216. [Google Scholar] [CrossRef] [PubMed]
  38. Incel, A.; Akin, O.; Cagir, A.; Yildiz, U.H.; Demir, M.M. Smart phone assisted detection and quantification of cyanide in drinking water by paper based sensing platform. Sens. Actuator B Chem. 2017, 252, 886–893. [Google Scholar] [CrossRef]
  39. Rong, M.C.; Deng, X.Z.; Chi, S.T.; Huang, L.Z.; Zhou, Y.B.; Shen, Y.N.; Chen, X. Ratiometric fluorometric determination of the anthrax biomarker 2,6-dipicolinic acid by using europium(III)-doped carbon dots in a test stripe. Microchim. Acta 2018, 185, 201. [Google Scholar] [CrossRef]
  40. Sarwar, M.; Leichner, J.; Naja, G.M.; Li, C.-Z. Smart-phone, paper-based fluorescent sensor for ultra-low inorganic phosphate detection in environmental samples. Microsyst. Nanoeng. 2019, 5, 56. [Google Scholar] [CrossRef] [Green Version]
  41. Sankar, K.; Lenisha, D.; Janaki, G.; Julian, J.; Kumar, R.S.; Selvi, M.C.; Srinivasan, G. Digital image-based quantification of chlorpyrifos in water samples using a lipase embedded paper based device. Talanta 2020, 208, 120408. [Google Scholar] [CrossRef] [PubMed]
  42. Sicard, C.; Glen, C.; Aubie, B.; Wallace, D.; Jahanshahi-Anbuhi, S.; Pennings, K.; Daigger, G.T.; Pelton, R.; Brennan, J.D.; Filipe, C.D.M. Tools for water quality monitoring and mapping using paper-based sensors and cell phones. Water Res. 2015, 70, 360–369. [Google Scholar] [CrossRef]
  43. Peixoto, P.S.; Toth, I.V.; Machado, S.; Barreiros, L.; Machado, A.; Bordalo, A.A.; Lima, J.L.F.C.; Segundo, M.A. Screening of sulfonamides in waters based on miniaturized solid phase extraction and microplate spectrophotometric detection. Anal. Methods 2018, 10, 690–696. [Google Scholar] [CrossRef]
  44. Carvalho, P.H.; Bessa, S.; Silva, A.R.M.; Peixoto, P.S.; Segundo, M.A.; Oliveira, H.P. Estimation of Sulfonamides Concentration in Water Based on Digital Colourimetry. In Pattern Recognition and Image Analysis; Morales, A., Fierrez, J., Sánchez, J., Ribeiro, B., Eds.; IbPRIA 2019; Lecture Notes in Computer Science; Springer: Cham, Switzerland, 2019; Volume 11867. [Google Scholar]
  45. Carvalho, P.H.; Rocha, I.; Azevedo, F.; Peixoto, P.S.; Segundo, M.A.; Oliveira, H.P. Cost-Efficient Color Correction Approach on Uncontrolled Lighting Conditions. In Computer Analysis of Images and Patterns; Tsapatsoulis, N., Panayides, A., Theocharides, T., Lanitis, A., Pattichis, C., Vento, M., Eds.; CAIP 2021; Lecture Notes in Computer Science; Springer: Cham, Switzerland, 2021; Volume 13052. [Google Scholar]
  46. Klokova, E.V.; Dmitrienko, S.G. Spectrophotometric determination of sulfanilamides by a condensation reaction with p-dimethylaminocinnamaldehyde. Mosc. Univ. Chem. Bull. 2008, 63, 284–287. [Google Scholar] [CrossRef]
  47. Catelani, T.A.; Toth, I.V.; Lima, J.L.F.C.; Pezza, L.; Pezza, H.R. A simple and rapid screening method for sulfonamides in honey using a flow injection system coupled to a liquid waveguide capillary cell. Talanta 2014, 121, 281–287. [Google Scholar] [CrossRef] [Green Version]
  48. Dmitrienko, S.G.; Kochuk, E.V.; Tolmacheva, V.V.; Apyari, V.V.; Zolotov, Y.A. Determination of the total content of some sulfonamides in milk using solid-phase extraction coupled with off-line derivatization and spectrophotometric detection. Food Chem. 2015, 188, 51–56. [Google Scholar] [CrossRef]
  49. Reis, P.; Carvalho, P.H.; Peixoto, P.S.; Segundo, M.A.; Oliveira, H.P. Mobile Application for Determining the Concentration of Sulfonamides in Water Using Digital Image Colorimetry. In Universal Access in Human-Computer Interaction. Access to Media, Learning and Assistive Environments; Antona, M., Stephanidis, C., Eds.; HCII 2021; Lecture Notes in Computer Science; Springer: Cham, Switzerland, 2021; Volume 12769. [Google Scholar]
  50. Catelani, T.A.; Castoldi, K.; Tóth, I.V.; Santos, J.L.M.; Lima, J.L.F.C.; Pezza, L.; Pezza, H.R. An eco-friendly method for analysis of sulfonamides in water samples using a multi-pumping system. Can. J. Chem. 2016, 94, 812–817. [Google Scholar] [CrossRef] [Green Version]
  51. Nong, C.; Niu, Z.; Li, P.; Wang, C.; Li, W.; Wen, Y. Dual-cloud point extraction coupled to high performance liquid chromatography for simultaneous determination of trace sulfonamide antimicrobials in urine and water samples. J. Chromatogr. B 2017, 1051, 9–16. [Google Scholar] [CrossRef]
  52. Sun, N.; Han, Y.; Yan, H.; Song, Y. A self-assembly pipette tip graphene solid-phase extraction coupled with liquid chromatography for the determination of three sulfonamides in environmental water. Anal. Chim. Acta 2014, 810, 25–31. [Google Scholar] [CrossRef] [PubMed]
  53. Xu, Y.; Zhao, Q.; Jiang, L.; Li, Z.; Chen, Y.; Ding, L. Selective determination of sulfonamides from environmental water based on magnetic surface molecularly imprinting technology. Environ. Sci. Pollut. Res. 2017, 24, 9174–9186. [Google Scholar] [CrossRef] [PubMed] [Green Version]
  54. Mala, Z.; Gebauer, P.; Bocek, P. New methodology for capillary electrophoresis with ESI-MS detection: Electrophoretic focusing on inverse electromigration dispersion gradient. High-sensitivity analysis of sulfonamides in waters. Anal. Chim. Acta 2016, 935, 249–257. [Google Scholar] [CrossRef] [PubMed]
  55. Wu, J.Y.; Li, Y.Y.; Li, W.C.; Gong, Z.B.; Huang, X.J. Preparation of a novel monolith-based adsorbent for solid-phase microextraction of sulfonamides in complex samples prior to HPLC-MS/MS analysis. Anal. Chim. Acta 2020, 1118, 9–17. [Google Scholar] [CrossRef] [PubMed]
Figure 1. Experimental apparatus for image acquisition (A). Color chart; (B,C). Representation of the placement of the disk beside the color chart; (D). Disks after loading of SMZ (0–50 µg L−1) and color development.
Chemosensors 10 00025 g001
Figure 2. Scheme of colorimetric reaction between DMACA and sulfonamides in acid medium: (A). DMACA; (B). Sulfonamide; (C). Colored Schiff base product. Followed by the absorbance spectrum between 430 and 700 nm. Green line: no SMZ; red line: 10 µM SMZ; blue line: 20 µM SMZ.
Chemosensors 10 00025 g002
Figure 3. Relation between color and SMZ concentration in the range of 0 to 150 μg L−1 using the coordinates from the color spaces RGB (Red, Green, Blue), HSV (Hue, Saturation, Value) and CIELAB (Lightness, a_star, b_star).
Chemosensors 10 00025 g003
Figure 4. Set-up for in-field screening of SMZ and results from a test sample S (A—negative control, absence of SMZ; B—positive control, SMZ at 25 µg L−1).
Chemosensors 10 00025 g004
Table 1. Values (Student’s t-test) for the color patches that provided no significantly different reading under various illumination conditions (ttab = 2.78, α = 0.05).
Color Patch NumberColor PatchSMZ 10 µg L−1SMZ 25 µg L−1
#1 0.360.70
#2 0.600.93
#7 −0.330.20
#9 2.451.44
#11 −1.89−0.03
#14 −0.660.67
#15 1.580.33
Table 2. Recovery results for loading SMZ using different concentrations and volumes.
Mass SMZ/µgVolume/mLConcentration/µg L−1Recovery (%)
0.1001010161
25482.3
50277.1
0.500105089.1
2520101.4
501063.4
Publisher’s Note: MDPI stays neutral with regard to jurisdictional claims in published maps and institutional affiliations.

