Article

In Situ Detection of Hydrogen Sulfide in 3D-Cultured, Live Prostate Cancer Cells Using a Paper-Integrated Analytical Device

1
Department of Biomedical Engineering, College of Medicine, Kyung Hee University, Seoul 02447, Korea
2
Department of Medical Engineering, Graduate School, Kyung Hee University, Seoul 02447, Korea
*
Author to whom correspondence should be addressed.
Submission received: 13 December 2021 / Revised: 7 January 2022 / Accepted: 8 January 2022 / Published: 10 January 2022
(This article belongs to the Section Analytical Methods, Instrumentation and Miniaturization)

Abstract

:
In this study, a paper-integrated analytical device that combined a paper-based colorimetric assay with a paper-based cell culture platform was developed for the in situ detection of hydrogen sulfide (H2S) in three-dimensional (3D)-cultured, live prostate cancer cells. Two kinds of paper substrates were fabricated using a simple wax-printing methodology to form the cell culture and detection zones, respectively. LNCaP cells were seeded directly on the paper substrate and grown in the paper-integrated analytical device. The cell viability and H2S production of LNCaP cells were assessed using a simple water-soluble tetrazolium salt colorimetric assay and H2S-sensing paper, respectively. The H2S-sensing paper showed good sensitivity (sensitivity: 6.12 blue channel intensity/μM H2S, R2 = 0.994) and a limit of quantification of 1.08 μM. As a result, we successfully measured changes in endogenous H2S production in 3D-cultured, live LNCaP cells within the paper-integrated analytical device while varying the duration of incubation and substrate concentration (L-cysteine). This paper-integrated analytical device can provide a simple and effective method to investigate H2S signaling pathways and drug screening in a 3D culture model.

1. Introduction

Prostate cancer is the second most frequently occurring cancer in men and the fifth leading cause of death worldwide [1]. Prostate cancer is a hormonally regulated malignancy, and androgen receptor signaling is essential for its evolution from the beginning androgen-dependent state to the late aggressive androgen-resistant state [2]. Androgen deprivation therapy (ADT) is the main treatment option for early-stage prostate cancer. However, ADT is palliative, and prostate cancer eventually progresses to an androgen-independent state that is more aggressive and fatal, for which hormone blockade therapy fails [3]. As no effective therapy for prostate cancer is available, new diagnostic methods and preventive interventions must be developed urgently to lower morbidity, mortality, and medical costs related with this tumor.
Hydrogen sulfide (H2S) acts as a gaseous transmitter in organisms, and abnormal H2S concentration is linked with various diseases, including Alzheimer’s disease [4], hypertension [5], Parkinson’s disease [6], diabetes [7] and cancer [8]. In particular, increased expression of H2S-synthesizing enzymes such as cystathionine β-synthase (CBS) and cystathionine γ-lyase (CSE) has been associated to the aggressiveness of several solid tumors [9]. In addition, the reduction of endogenous H2S release suppresses the growth of various tumors, including breast and prostate cancer [10]. As endogenous H2S can induce tumorigenesis [11], inhibitors of H2S-synthesizing enzymes have been developed to block the H2S production and have proven effective in cancer therapy [7,10,12,13]. Conversely, various H2S-releasing compounds, such as sulfide salts, diallyl disulfide, diallyl trisulfide, and other polysulfides, have been reported to inhibit the growth and metastasis of prostate cancer [14]. As such, H2S displays bimodal pharmacological characteristics in cancer, in that its biosynthesis is suppressed, but the increase in its level beyond a certain threshold can show anticancer effects [15]. Therefore, to better understand H2S signaling as a target for cancer diagnosis and treatment, it is important to quantify H2S in cancer cells and tissue.
Several studies investigating non-destructive methods to reliably detect free H2S gas in living cells have been reported [16,17,18]. In particular, paper-based colorimetric assays utilizing silver/Nafion™/polyvinylpyrrolidone (PVP) membranes are able to detect quantitatively endogenous H2S in live cancer cells without the need for expensive and large instruments or special probes for H2S [19]. However, cell-based bioassays to assess the efficacy of anticancer drugs have been evaluated in two-dimensional (2D) cultures of cancer cell lines. A 2D culture condition does not reflect the microenvironment of the original tumors, which grow three-dimensionally [20,21,22]. The use of three-dimensional (3D) cell cultures can avoid certain drawbacks of 2D culture models, including the loss of intrinsic cellular properties and an inability to mimic the in vivo architecture of issues [23]. Therefore, 3D cancer models are increasingly recognized as biologically relevant tools for preclinical drug testing or cell-based diagnostics. Recently, paper with specialized fibrous, porous, and flexible properties has revealed great capability as an alternative material for 3D cell culture because it not only acts as a supporting substrate but also offers a 3D environment for cells [24,25,26]. Paper provides additional advantages including biocompatibility, cost-effectiveness, easy availability, passive mass transport, and suitability for chemical and physical modifications. Therefore, paper is used increasingly in various cell-based assays, including drug screening [27], cell migration/invasion assays [28], and cellular crosstalk [29]. However, to the best of our knowledge, the selective and sensitive detection of endogenous H2S in 3D-cultured, live cancer cells using a paper-based cell culture platform has not been reported.
In this study, we introduce a paper-integrated analytical device that combines a paper-based colorimetric assay with a paper-based cell culture platform for the in situ detection of H2S in 3D-cultured prostate cancer LNCaP cells. Two kinds of paper substrates were fabricated using a simple wax-printing methodology that allowed the creation of a distinct cell culture and detection zones by separating hydrophilic regions from hydrophobic ones. First, we evaluated the proliferation and viability of LNCaP cells on the paper substrate using colorimetric methods and then used these results to validate the use of the paper-integrated analytical device for 3D cell culture. Paper is a good substrate for colorimetric detection, allowing results to be assessed directly by the naked eye [30]. For this reason, we also prepared a colorimetric H2S-sensing paper utilizing a silver- and Nafion™-embedded PVP membrane on the paper surface. The working mechanism for H2S detection is that silver reacts with H2S to produce Ag2S, which becomes brown in color. We used PVP to disperse silver on the paper, and a small amount of Nafion was used to avoid the oxidation of silver in air. This membrane-coated paper was calibrated by assessing the color changes occurring within the detection zone after the application of various concentrations of H2S donor solution. Finally, we quantified endogenous H2S production in 3D-cultured, live LNCaP prostate cancer cells within the paper-integrated analytical device while varying the incubation period (24, 48, or 72 h) and L-cysteine (Cys) substrate concentration (0, 0.2, 1, or 5 mM). The experimental scheme is presented in Figure 1.

2. Materials and Methods

2.1. Chemicals

PVP (K90), silver nitrate (AgNO3), Nafion™ solution, sodium sulfide (Na2S), agarose, collagen I (Type I solution from rat tail), extracellular matrix (ECM) gel (from Engelbreth-Holm-Swarm murine sarcoma), Cys (≥98.0%), L-homocysteine (H-Cys, ≥98.0%), dithiothreitol (DTT), reduced L-glutathione (GSH), 4′,6-diamidino-2-phenylindole (DAPI), and bovine serum albumin (BSA) were purchased from Sigma Aldrich (St. Louis, MO, USA). The RPMI 1640 medium supplemented with L-glutamine was purchased from Corning (Glendale, AZ, USA). Fetal bovine serum (FBS), streptomycin, and penicillin were obtained from Gibco (Grand Island, NY, USA). All reagents with an analytical grade were used without further purification. All aqueous solutions were prepared using de-ionized water of 18.3 MΩ/cm resistivity.
Water-soluble tetrazolium salt (WST) assay kits were obtained from DoGenBio (Seoul, Korea). LIVE/DEAD™ (L&D) viability/cytotoxicity kits were purchased from Invitrogen (MA, USA). The rabbit-anti-PSA/KLK3 (D6B1) XP® monoclonal antibody (mAb) and anti-rabbit IgG (H+L):Alexa Fluor® 488 conjugate were purchased from Cell Signaling Technology, Inc. (Denvers, MA, USA).

2.2. Fabrication of Wax-Patterned Paper Substrates for 3D Cell Culture and H2S Sensing

Two types of paper substrates (34 mm × 34 mm) were designed on Whatman® filter paper (Grade 1; GE Healthcare Bio-Sciences, Pittsburgh, PA, USA) using AutoCAD, as follows: first, the paper substrate for 3D cell culture was marked with four circular zones, each of 5 mm diameter. To cultivate the cells within only these four zones, all the background area was printed with wax (Figure S1A of the Supplementary Information (SI)). Hydrophobic wax barriers were patterned using a Xerox ColorQube™ 8570N printer (Fuji Xerox, Tokyo, Japan). The wax-printed paper was heated in a BF-150C drying oven (DAIHAN Scientific, Seoul, Korea)) at 130 °C for 90 s to uniformly impregnate with wax. Next, the paper substrate for the detection of H2S was prepared. This H2S-sensing paper was printed with four circular ring-type wax barriers surrounding 7 mm inner diameter detection zones (Figure S1B of the SI). Hydrophobic barriers were formed using the same printer, and the paper was impregnated uniformly with wax by heating in the drying oven at 125 °C for 45 s. Finally, the paper was taken out from the oven and cooled to room temperature (RT).

2.3. Cell Culture and Cell Seeding on Wax-Patterned Paper for 3D Cell Culture

Human prostate cancer cell lines LNCaP and PC-3 were purchased from the Korea Cell Line Bank (Seoul, South Korea). Cells were cultured in RPMI 1640, supplemented with 10% heat-inactivated FBS, L-glutamine, and 1% penicillin/streptomycin, at 37 °C in a humidified atmosphere of 5% CO2 incubator.
Prior to cell seeding, the wax-patterned paper was sterilized under ultra-violet light for 2 h. After sterilization, the surface of each circular zone on the paper was coated with 20 μL of collagen I (100 μg/mL in phosphate-buffered saline (PBS)) to enhance cell attachment and increase proliferation capacity. First, LNCaP cells were seeded onto each hydrophilic area on the paper at a density of 3.0 × 10⁴ cells/20 μL culture media to characterize the 3D-cultured LNCaP cells when grown on the collagen-coated paper. The seeded paper was pre-incubated at 37 °C in a humidified 5% CO2 incubator for 30 min to ensure stable adhesion of the cells. Meanwhile, the hydrogel containing 5% (w/v) agarose in culture medium was prepared for use in paper-based cell culture. After the agarose solution had solidified on the tray plate, the cell-treated paper was placed on the agarose-medium hydrogel and incubated at 37 °C in a 5% CO2 incubator. For 3D cell culture and in situ H2S detection in LNCaP cells using the paper-integrated analytical device, cells were seeded onto each hydrophilic zone on the paper at a density of 1.0 × 10⁵ cells/20 μL culture media. After pre-incubation for 30 min, the cell-treated paper was placed on the agarose-medium hydrogel within the reservoir and incubated at 37 °C in a humidified 5% CO2 atmosphere.

2.4. Preparation and Evaluation of the H2S-Sensing Paper

The H2S sensing paper was prepared as described previously [19]. Briefly, PVP (5% w/v) solution was mixed with Nafion™ at a mixing ratio of 6 to 4 (v/v). Then, 30 μL of 0.05 M AgNO3 solution was added into 1 mL of Nafion™/PVP mixture and mixed well using a vortex mixer. Then, 20 μL of the mixture was dropped on each detection zone in the wax-patterned paper substrate. The prepared paper substrate was dried in a clean room (23.5 ± 1.0 °C, 25.0 ± 5.0% humidity) for at least 3 h. To test the analytical performance of the H2S sensing paper, a standard solution of Na2S as the H2S donor with concentrations ranging from 3.125 to 50 μM was prepared with 100 mM PBS (pH 7.4). Then, 300 μL of Na2S solution with each concentration was added into each well of a 96-well microplate. The fabricated H2S-sensing paper was placed on the Na2S-loaded 96-well microplate and covered with a lid. After the reaction with H2S at RT for 1 h, the H2S-sensing paper was removed from the 96-well plate, and the color changes in this paper were confirmed with the naked eye and subsequently measured utilizing an Epson scanner (Perfection V700 Photo flatbed scanner, Seiko Epson, Nagano, Japan) and ImageJ software (version 1.8.0_172). The blue channel intensity of the circular area with 4.5 mm in diameter on each detection zone was analyzed [19]. The acquisition process was repeated five times in different regions on one detection zone to obtain an average value of the blue channel intensity. All the values of the blue channel intensity were displayed as a change in blue channel intensity after subtraction of the measured value from the intensity value of Ag/Nafion™/PVP-coated paper (blank zone).

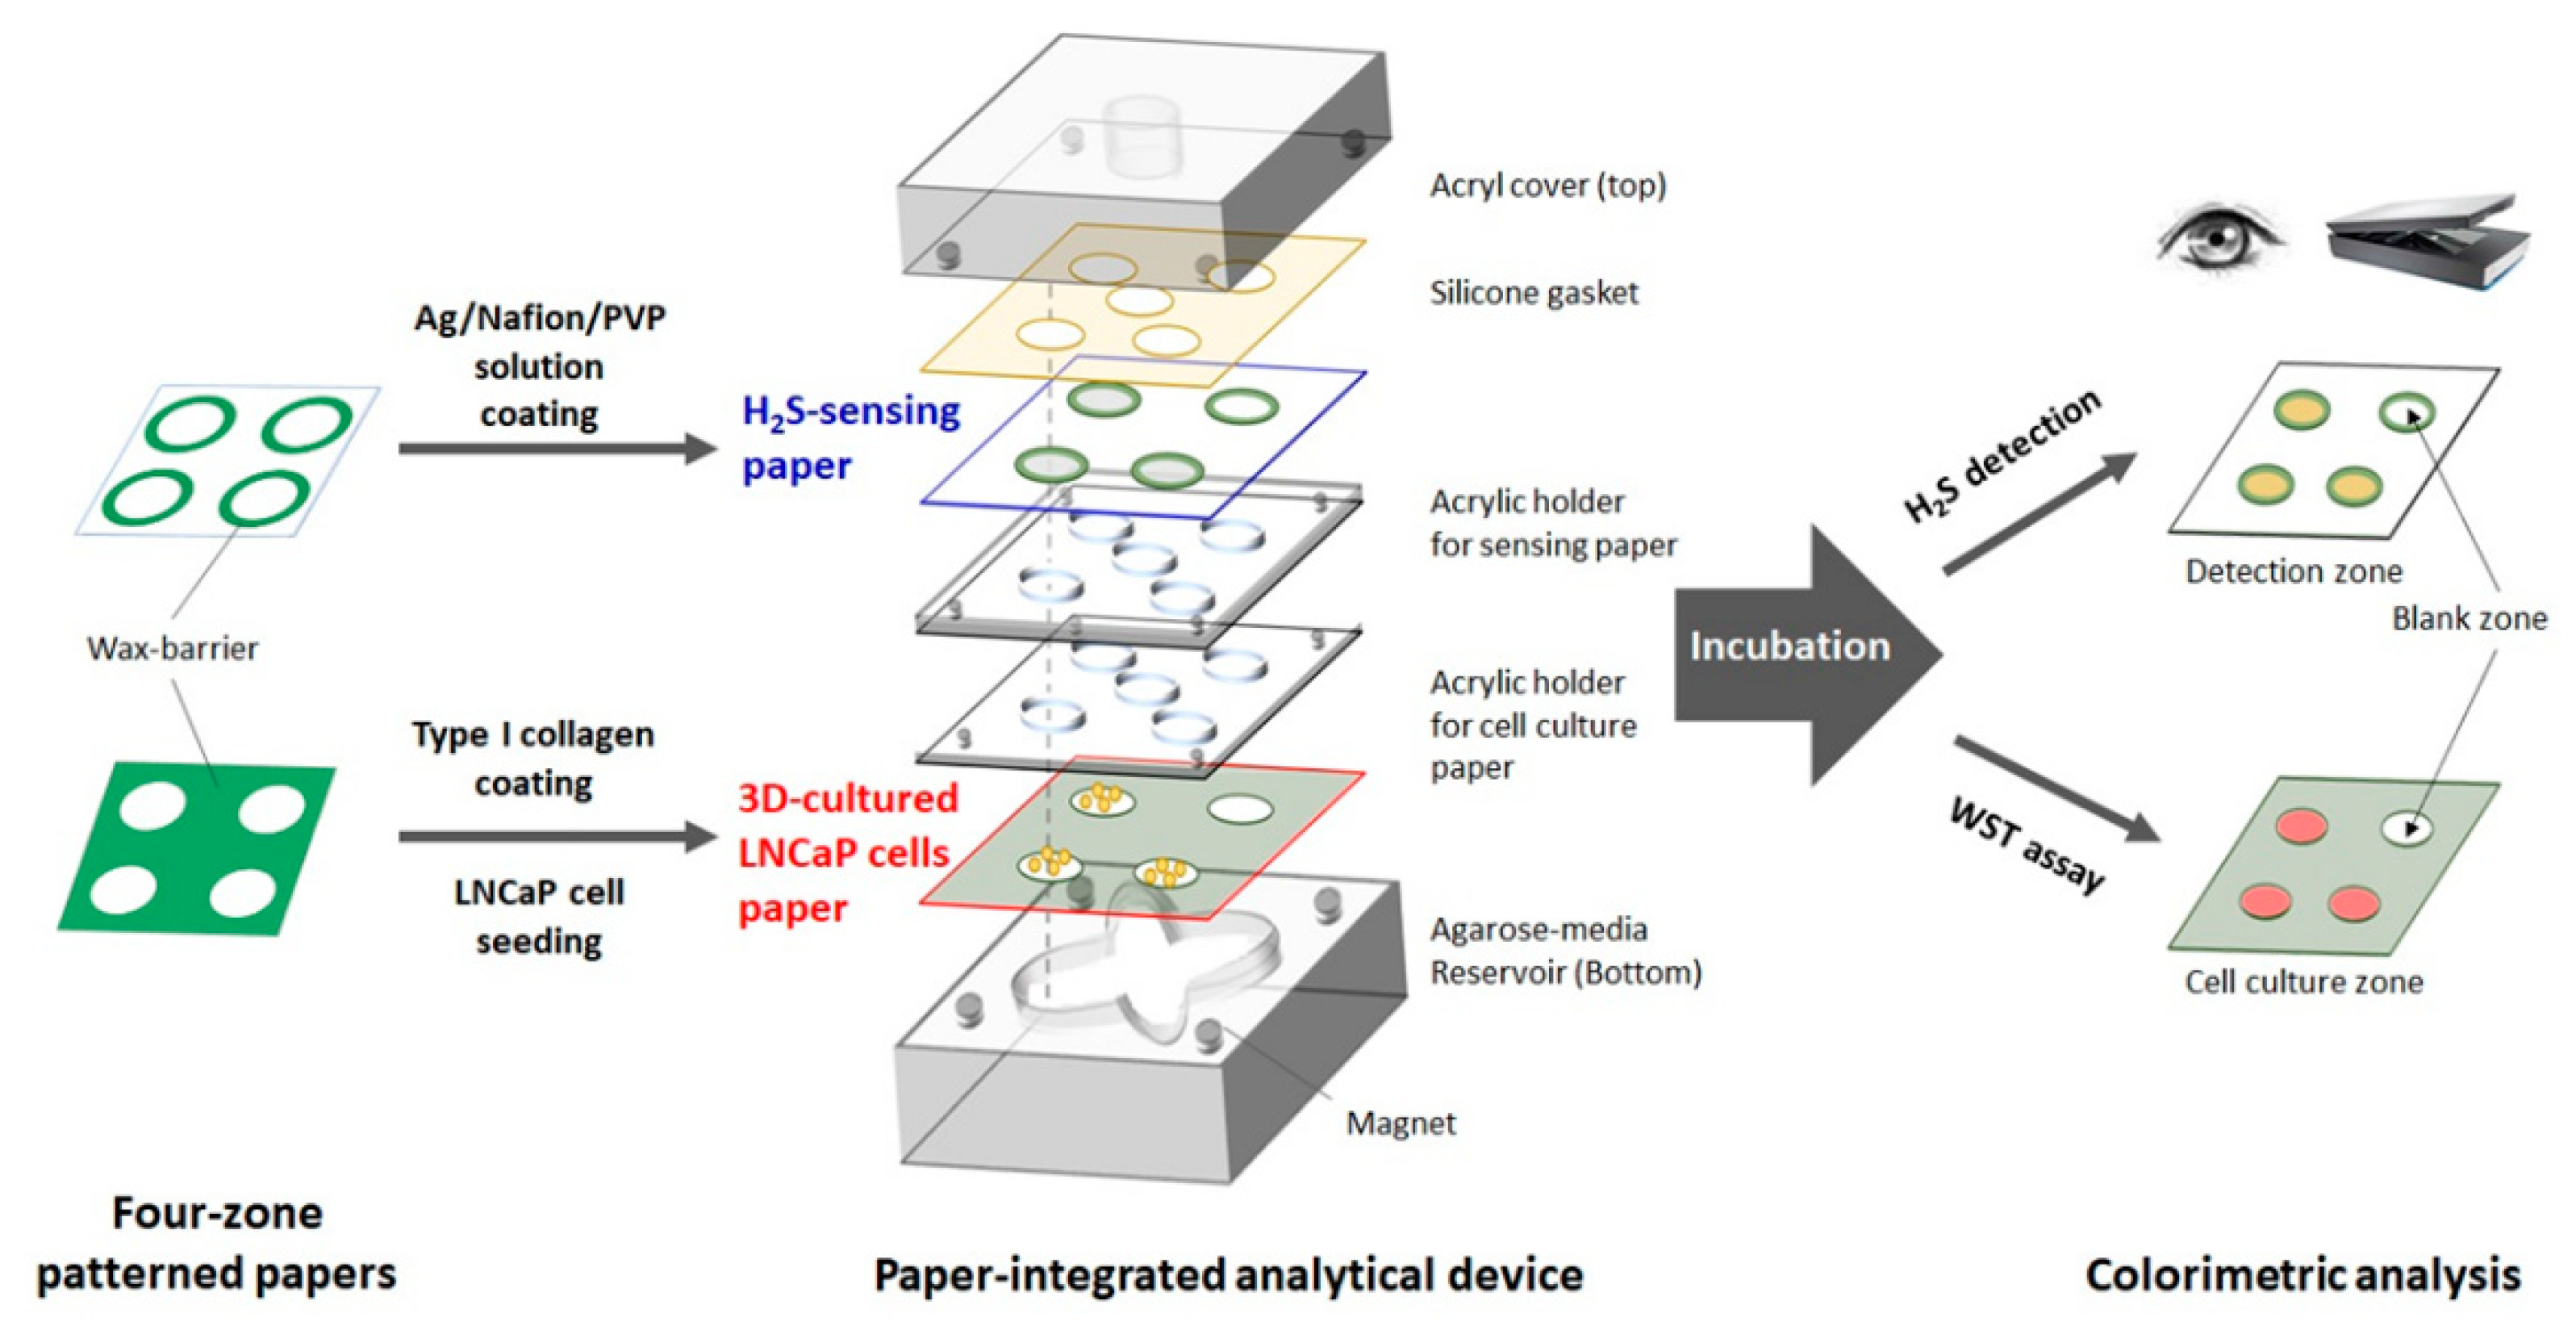
2.5. Fabrication of the Paper-Integrated Analytical Device for In Situ Detection of H2S in 3D-Cultured LNCaP Cells

To cultivate cells and detect H2S simultaneously, we designed a novel analytical device using the above-described two papers for 3D cell culture and H2S sensing, respectively. The paper-integrated analytical device consisted of seven parts, as shown in Figure 1. The first part was an acrylic bottom plate (46 mm × 46 mm × 15 mm) with a flower-shaped reservoir (5 mm in depth) to hold the agarose-medium hydrogel (Figure S1C in the SI). This hydrogel provided nutrients to the cells within the paper and acted as a substrate for H2S-synthesizing enzymes such as Cys and H-Cys. During H2S detection, the hydrogel was not replaced or refreshed. The second part was the paper for 3D cell culture of LNCaP cells. This paper was placed on the agarose-medium hydrogel with proper alignment (Figure S1D in the SI). The third part was an acrylic holder (2 mm in thickness) with four small magnets on the holder and bottom plate that improved the contact between cell culture paper and hydrogel. The fourth part was an acrylic holder for the H2S-sensing paper (2 mm outer thickness; 1 mm inner thickness) that facilitated alignment of the sensing paper with each zone of the 3D cell culture paper. The fifth part was the H2S-sensing paper, and the sixth part was a silicon gasket to immobilize the sensing paper. Finally, the seventh part was an acrylic top plate with a 5 mm-diameter hole to allow transfer of the gas during culture. After integration of the seven parts, the sides of the paper-integrated analytical device were wrapped in parafilm to minimize leakage of H2S gas and moisture (Figure S1E in the SI).

2.6. Cell Viability of LNCaP Cells Cultured on the Paper

To evaluate cell viability in the paper-based culture environment and paper-integrated analytical device, cell proliferation in the 3D-cultured LNCaP cells paper was measured using a colorimetric WST cell viability assay. Briefly, LNCaP cells cultured on a prepared paper placed on the agarose-medium hydrogel were washed with PBS, and the paper was treated with 10 μL of WST reagent and reacted at 37 °C for 1 h. Since WST reacts with living cells to produce orange water-soluble formazan, the number of viable cells was directly related with the color intensity of the cell paper. The changes in color intensity of the cell paper were analyzed quantitatively using an Epson scanner (300 dots per inch resolution) and ImageJ software (version 1.8.0_172). The images were split into red, green, and blue channels: the blue channel intensity was quantified because it showed the greatest change under the scanner conditions (Figure S2 in the SI). It may be attributed that the complementary color of the brownish orange is blue [31,32]. In addition, this can be caused that an orange water-soluble formazan has the maximum absorption between 460 and 480 nm, which corresponds to the blue region of the visible light spectrum [33,34]. The blue channel intensity of the whole area of each detection zone was analyzed to minimize the deviation between each paper. The change in blue channel intensity was defined as the blue channel intensity of the blank zone minus that of the detection zone. An L&D assay was used to confirm the results from the WST assay. The LNCaP cells cultured on a prepared paper placed on the agarose-medium hydrogel were incubated with a mixture of 8 mM ethidium homodimer (EtdD-1; red color, non-viable cell) and 2 mM calcein acetoxymethyl (calcein-AM; green color, viable cell) in PBS at RT for 30–45 min. Then, stained samples were washed with PBS. Images were collected by a Zeiss LSM-700 confocal microscopy system (Thornwood, NY, USA).

2.7. Immunofluorescence Staining of PSA in LNCaP Cells Cultured on the Paper

LNCaP cells, cultured in the paper-based culture environment and paper-integrated analytical device, were fixed with 4% paraformaldehyde at 4 °C for 30 min. Fixed cells were washed three times in PBS while shaking for 5 min. Cells were blocked with 5% (w/v) BSA in PBS at RT for 2 h. After blocking, the cells were incubated with rabbit-anti-PSA/KLK3 (D6B1) XP® mAb diluted with PBS (1:200) overnight at 37 °C. Cells were washed four times with PBS for 5 min while shaking and then incubated with anti-rabbit IgG (H+L):Alexa Fluor® 488 conjugate diluted in PBS (1:1000) for 1 h at RT. Cells were washed five times with 0.1% Tween-20 in PBS (PBST) while shaking for 5 min. After staining with DAPI mounting solution, images were collected using a Zeiss LSM-700 confocal microscopy system (Jena, Germany).

2.8. In Situ Detection of Endogenous H2S in 3D-Cultured, Live Cancer Cells Using the Paper-Integrated Analytical Device

To confirm the performance of our paper-integrated analytical device, we compared the difference in H2S release between two LNCaP and PC-3 prostate cancer cell lines cultured on the prepared paper, as reported in our previous study [19]. The LNCaP and PC-3 cells were seeded onto hydrophilic zones on each paper at a density of 2.5 × 10⁴, 5.0 × 10⁴, or 1.0 × 10⁵ cells/20 μL culture media, respectively. Meanwhile, both Cys (5 mM) and H-Cys (1 mM) were mixed with the agarose-medium hydrogel solution before solidification. The treated agarose medium was solidified within the bottom reservoir of the paper-integrated analytical device. After pre-incubation for 30 min, cell paper was placed on the agarose-medium hydrogel containing Cys and H-Cys. After inserting the H2S-sensing paper, the paper-integrated analytical device was transferred to a 5% CO2 incubator and incubated at 37 °C for 72 h. After incubation, the blue channel intensity of the H2S-sensing paper was analyzed using a scanner and ImageJ software. The concentration of H2S was calculated using the calibration plot for the H2S-sensing paper.
In addition, to investigate the effect of H-Cys on H2S production, LNCaP cells were seeded onto each detection zone of the collagen-coated paper at a density of 1 × 10⁵ cells/20 μL culture media, which was a density determined to reliably produce confluence within the required time. Various concentrations of H-Cys (0, 0.25, 0.5, and 1 mM) together with a constant concentration of Cys (5 mM) were added to the agarose-medium hydrogel solution before solidification. After the agarose-medium hydrogel mixtures were placed in the acrylic reservoir, the paper-integrated analytical device containing the cell-seeded paper and H2S-sensing paper was transferred to a 5% CO2 incubator and incubated at 37 °C for 72 h.
To measure endogenous H2S release of the LNCaP cells from a single substrate, 5 mM Cys was added to the LNCaP cells within the paper-integrated analytical device, and the cells were incubated for 24, 48, or 72 h using the same procedures as described above. In addition, we assessed the effects of varying the Cys concentration (0, 0.2, 1, or 5 mM) on the H2S production of LNCaP cells after 72 h of incubation. To compare the difference in endogenous H2S release between 2D- and 3D-cultured LNCaP cells, LNCaP cells were seeded in 96-well plates (1 × 10⁵ cells/well) and incubated with the same concentrations of Cys (0, 0.2, 1, or 5 mM) in a final volume of 300 μL. The plates were covered with H2S-sensing paper (24 circular detection zones for each microplate, Figure S3 in SI) and the plate cover. After incubation for 72 h, the H2S-sensing paper was analyzed using the methodology described above.

3. Results and Discussion

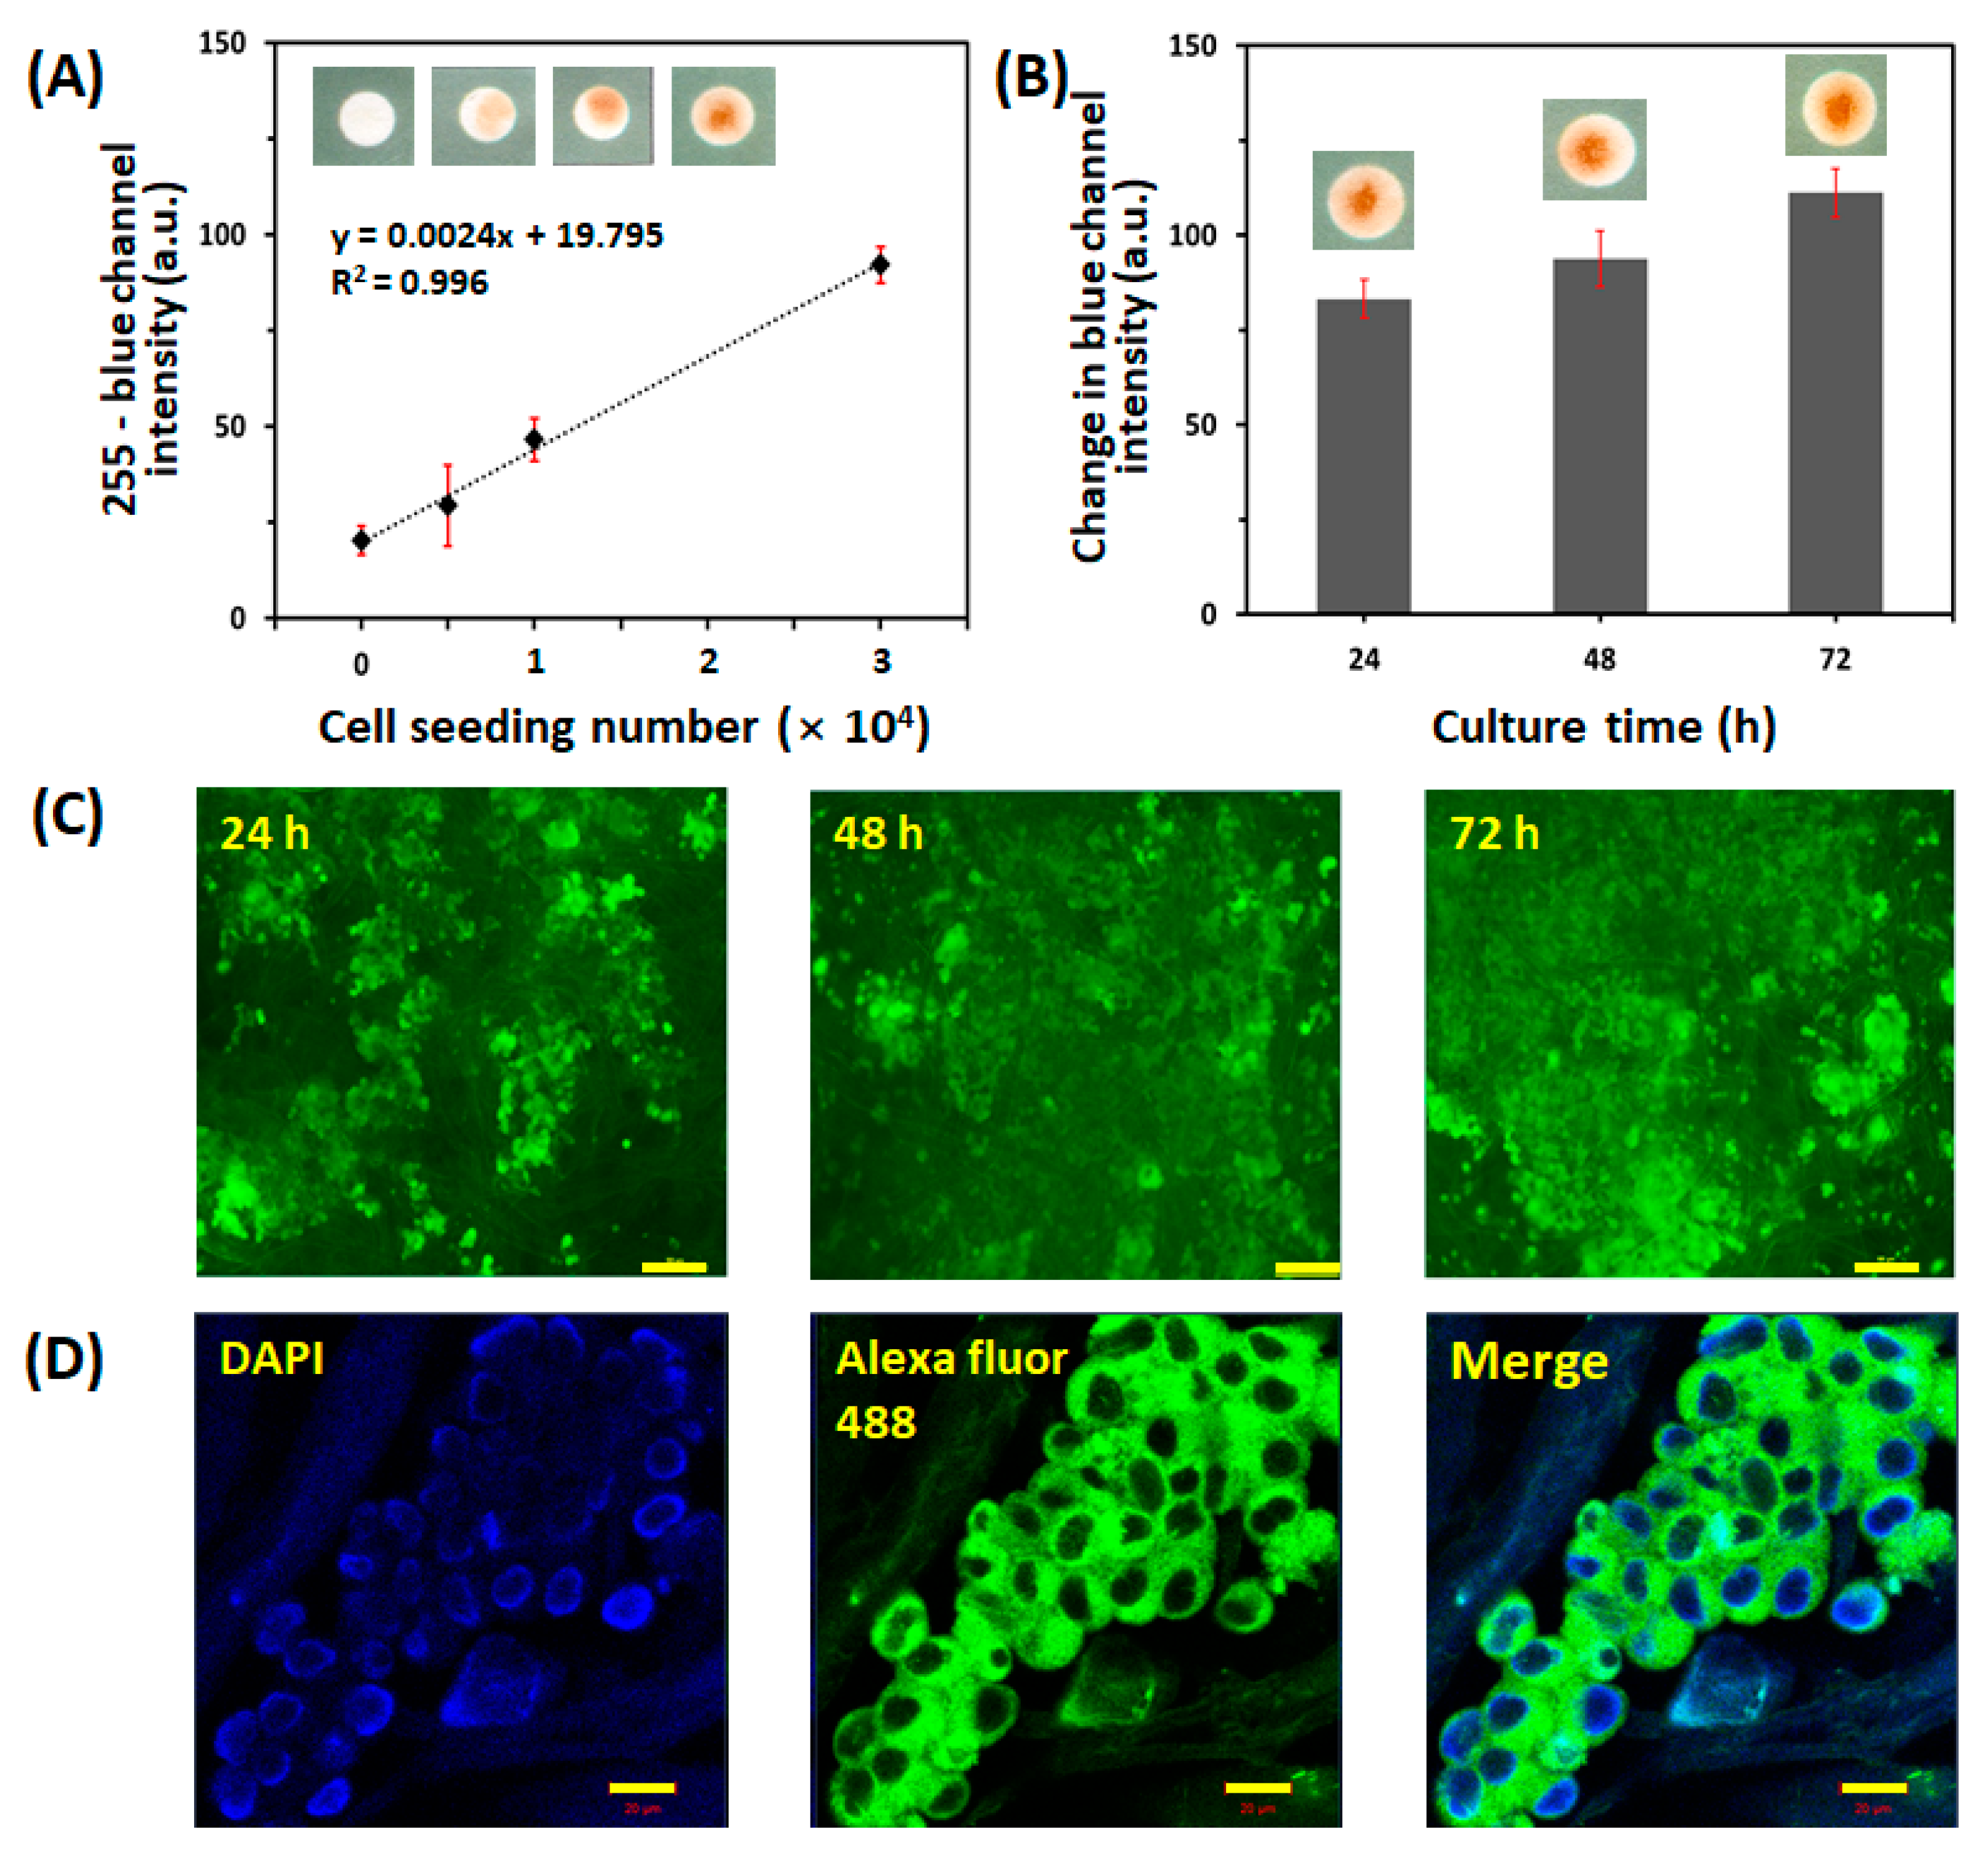
3.1. Characterization of the Paper-Based 3D Cell Culture Platform

Given its porous internal microstructure and diverse surface morphology, paper is an interesting alternative to traditional 3D cell culture with hydrogels or porous scaffolds. However, paper itself is not suitable for cell culture because it does not have any cell adhesion moieties [25]. So, it is necessary to modify the surface of the paper for improvement of cell attachment and proliferation. In many studies, 3D cell culture has been performed by culturing hydrogel- or MatrigelTM-encapsulated cells on a paper substrate to prevent cells from passing through the paper pores [24,27,28]. However, MatrigelTM is expensive and is better suited to the creation of oxygen and nutrient gradients on paper. Collagen is the most widely used ECM protein for 3D cell culture because it can promote cell attachment through integrin receptors, which results in the activation of cell signaling pathways that subsequently control cell survival, growth, and differentiation [35]. Therefore, we utilized collagen to enhance cell adhesion and proliferation on the paper.
We evaluated the efficiency of cell seeding in the paper-based 3D cell culture platform of collagen-coated paper substrate and agarose-medium hydrogel. First, we seeded varying numbers of LNCaP cells (0, 5.0 × 10³, 1.0 × 10⁴, or 3.0 × 10⁴ cells/20 μL culture medium) on the collagen-coated paper, cultured them on the agarose-medium hydrogel for 24 h, and then performed a WST assay. As the WST reagent is only active in metabolically intact cells, the intensity of the reacted product directly relates with the number of viable cells [36]. Figure 2A shows the effect of the number of paper-based 3D-cultured LNCaP cells on WST color intensity (255-blue channel intensity): the LNCaP cell number was linearly proportional to the color intensity with R2 = 0.996. This result indicated that LNCaP cells were viable on the paper-based 3D cell culture platform. To confirm cell survival and proliferation over time in the paper-based 3D cell culture platform, 3.0 × 10⁴ cells were seeded on collagen-coated paper and cultured for 24, 48, or 72 h, which was followed by WST and L&D analyses. As shown in Figure 2B,C, the LNCaP cells were not only viable for up to 72 h but were also able to proliferate in the paper-based 3D cell culture platform over this period. The characterization of LNCaP cells on the paper-based cell culture platform was performed using confocal microscopy. The expression of prostate-specific antigen (PSA), a prostate cancer marker used clinically for early screening, was demonstrated in LNCaP cells cultured in the paper-based 3D cell culture platform, as shown in Figure 2D. These results demonstrated that the paper-based 3D cell culture platform provided an appropriate culture environment for LNCaP cells.

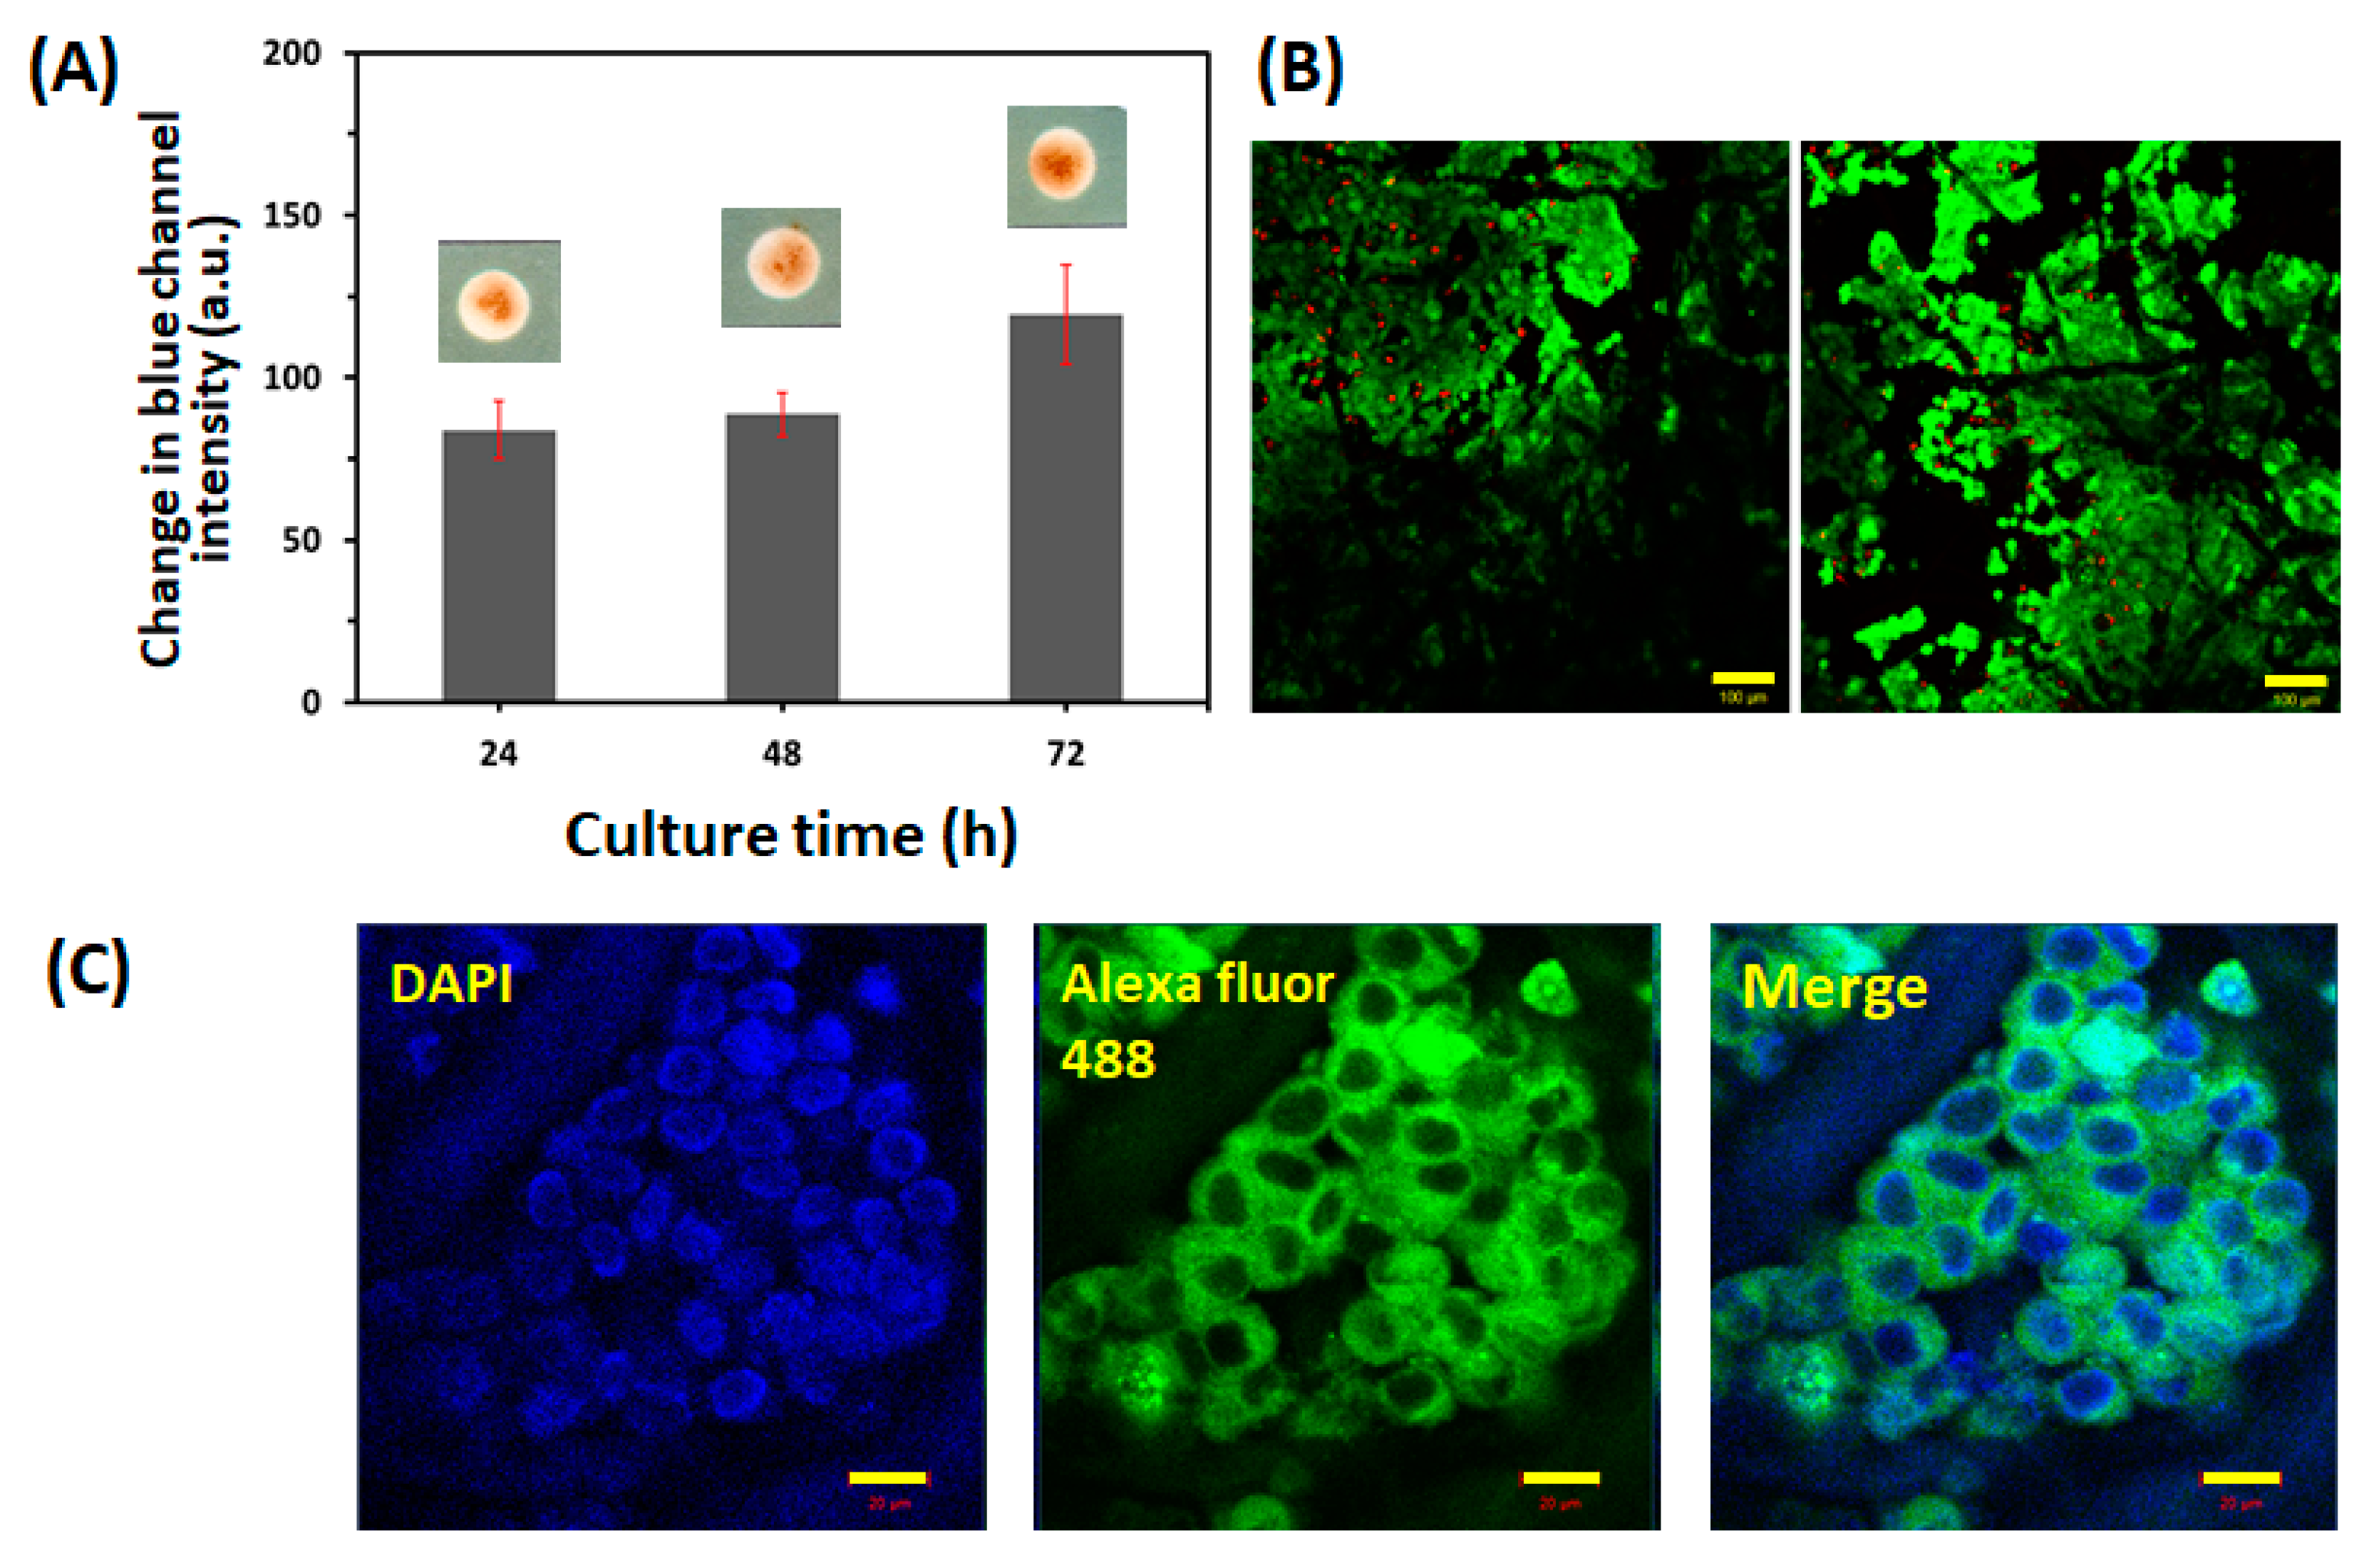
3.2. Evaluation of LNCaP Cells Cultured within the Paper-Integrated Analytical Device

To validate the feasibility of cell culture within the paper-integrated analytical device, we compared the viability and proliferation of LNCaP cells between the paper-based 3D cell culture platform and the paper-integrated analytical device. First, 3.0 × 10⁴ cells were seeded onto the collagen-coated paper and cultivated on the agarose-medium hydrogel within the paper-integrated analytical device for up to 72 h. Then, the quantification of viable cells was performed using the WST assay. As shown in Figure 3A, LNCaP cells were able to proliferate in the paper-integrated analytical device for up to 72 h: the change in blue channel intensity of the WST assay of LNCaP cells in the paper-integrated analytical device was very similar to that in the paper-based 3D cell culture platform at 48 and 72 h. In addition, as shown in Figure 3B, LNCaP cells were able to proliferate and form clusters for up to 72 h, which was consistent with the results of previous reports indicating that LNCaP cells tended to aggregate in 3D culture environments [37]. Therefore, LNCaP cells in the paper-integrated analytical device were as proliferative as those on the paper-based 3D cell culture platform. Figure 3C shows an immunofluorescence staining image of anti-PSA-stained LNCaP cells after 72 h of culture in the paper-integrated analytical device. As shown in Figure 3C, LNCaP cells were stained successfully with PSA antibody and showed similar morphology to cells grown on the paper-based 3D cell culture platform alone, indicating that LNCaP cells in the paper-integrated analytical device maintained the characteristics of this prostate cancer cell line. These results showed that the paper-integrated analytical device was able to provide an appropriate cell culture environment for the growth and proliferation of LNCaP cells.

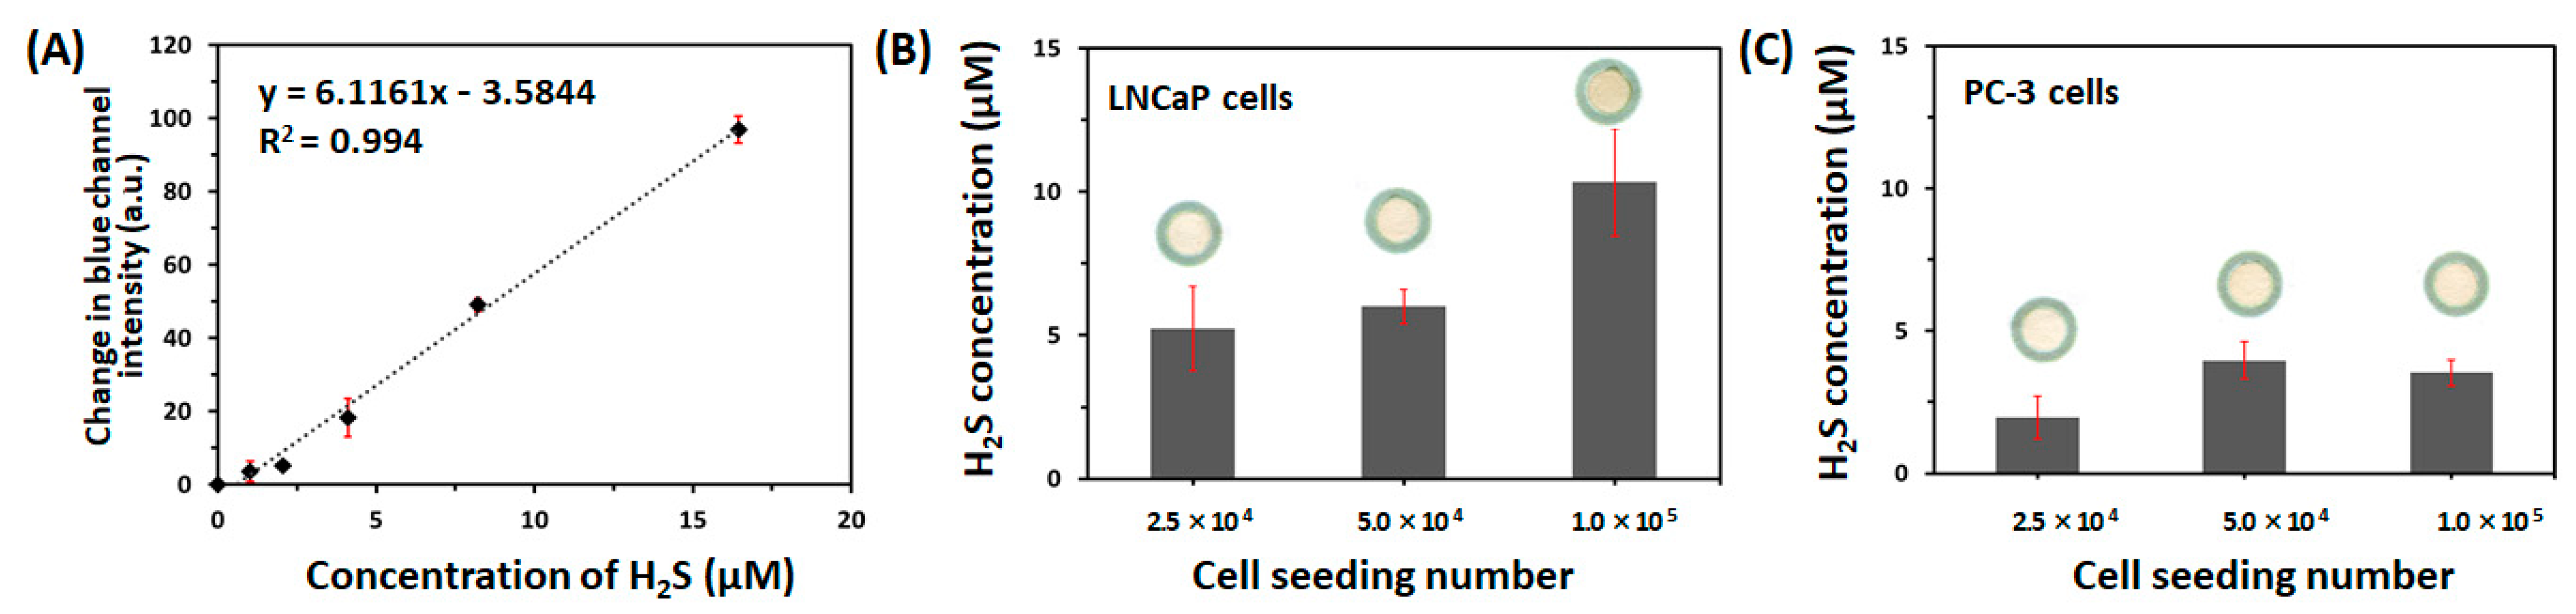
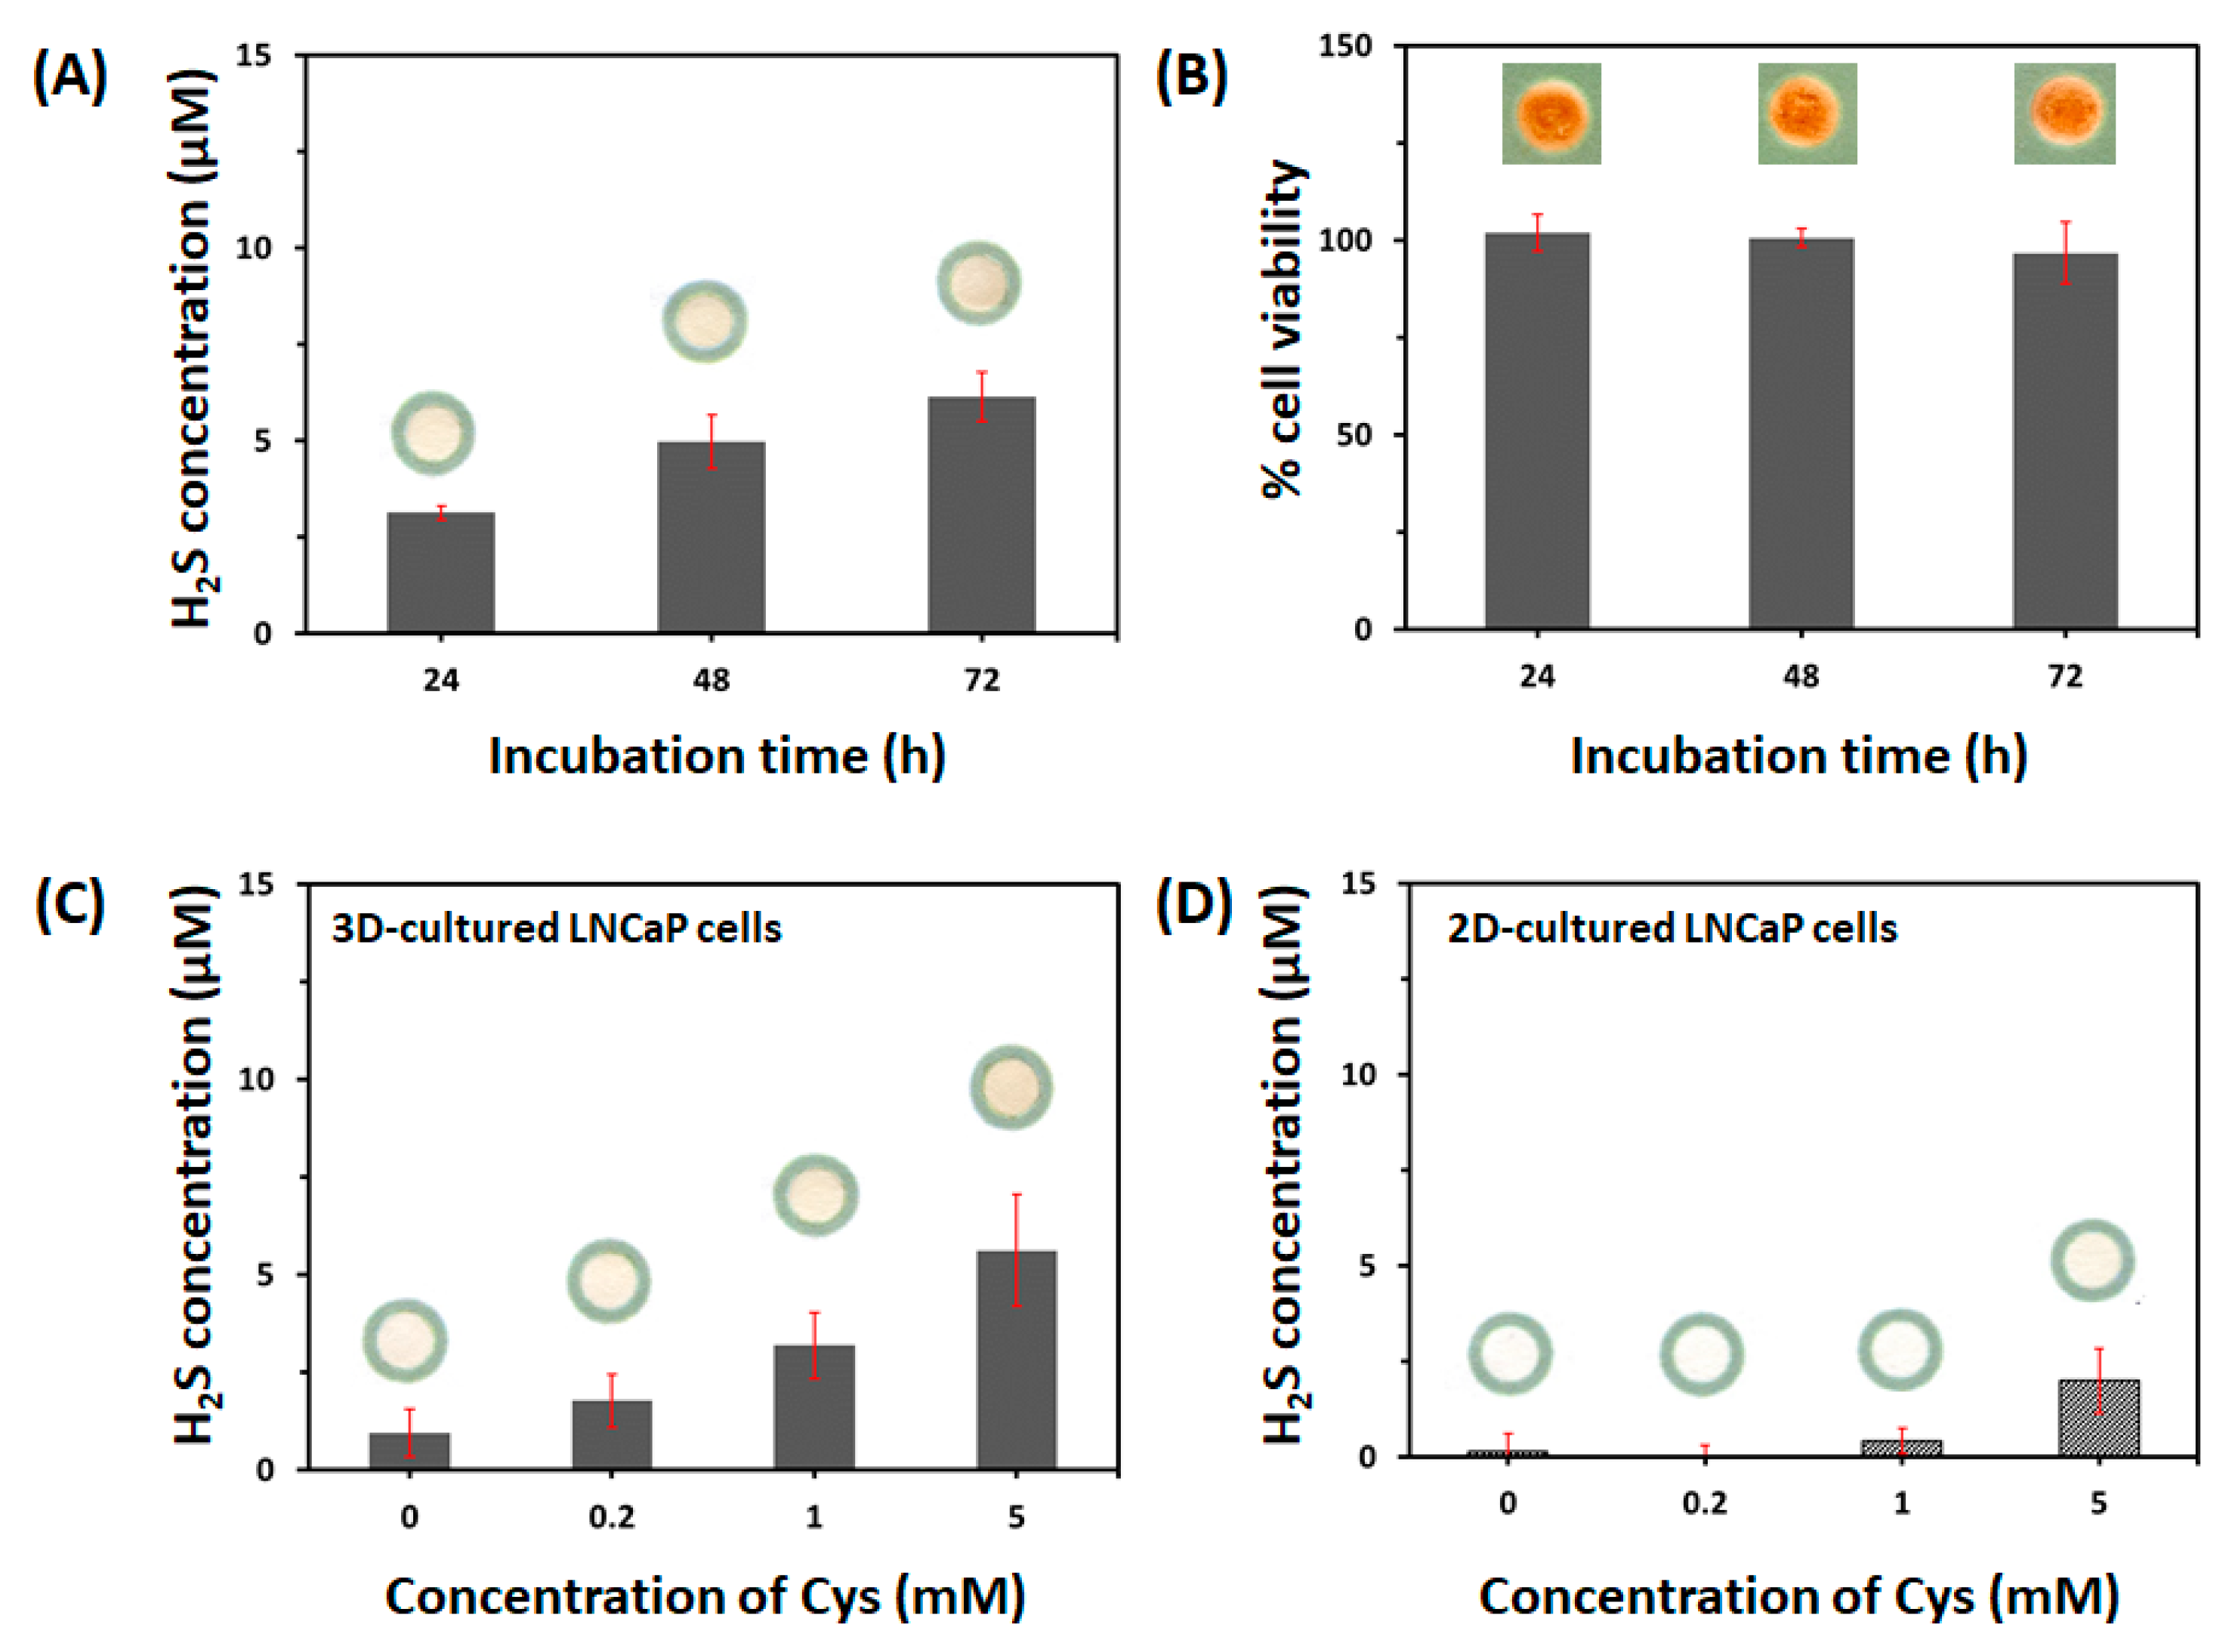
3.3. Detection of H2S from LNCaP Cells within the Paper-Integrated Analytical Device

We constructed the paper-integrated analytical device to cultivate cells and detect H2S from live cells simultaneously. Prior to the detection of H2S, we evaluated the sensitivity of the H2S-sensing paper. As shown in Figure 4A, the responses of the H2S-sensing paper showed a linear relationship with H2S concentration ranging from 1.03 to 16.4 μM (slope: 6.12 blue channel intensity/μM H2S, R2 = 0.994). The limit of detection (LOD) and limit of quantification (LOQ) were found to be 323 nM and 1.08 μM, respectively (n = 5). The LOD was estimated to be 3 sbl/S, while the LOQ was calculated to be 10 sbl/S, where sbl was the standard deviation of the blank, and S was the slope of the calibration curve [38]. As the mean of change in blue channel intensity of blank is zero, the LOD and LOQ are the same as 3 sbl/S and 10 sbl/S. The blue channel intensity of the H2S-sensing paper was changed by only H2S gas, as other biologically relevant sulfur-containing molecules such as DTT (1 mM), GSH (1 mM), Cys (5 mM), and H-Cys (1 mM) did not cause a change in blue channel intensity of the H2S-sensing paper (data not shown).
Two prostate cancer cell lines, LNCaP and PC-3 cells, have different expression levels of H2S-producing enzymes including CBS and CSE [14]. We previously used the paper-based colorimetric assay to confirm the difference in endogenous H2S production of 2D-cultured, two cell lines (2 × 10⁵ cells/well) after treatment with Cys (5 mM) and H-Cys (1 mM) over varying incubation periods (24, 48, or 72 h) [19]. Therefore, to validate the sensing performance of our paper-integrated analytical device, we compared the difference in H2S release between LNCaP and PC-3 cells. Figure 4B,C show the H2S concentration released from 3D-cultured LNCaP and PC-3 cells (2.5 × 10⁴, 5.0 × 10⁴, or 1.0 × 10⁵ cells/zone) incubated with Cys (5 mM) and H-Cys (1 mM) for 72 h within the paper-integrated analytical device. As shown in Figure 4B, the H2S concentration produced by the LNCaP cells after incubation with Cys and H-Cys was 5.23 ± 1.47 μM when cultured at 2.5 × 10⁴ cells/zone, 6.00 ± 0.60 μM at 5.0 × 10⁴ cells/zone, and 10.34 ± 1.88 μM at 1.0 × 10⁵ cells/zone. However, the H2S concentration produced by PC-3 cells after Cys and H-Cys treatment was 1.95 ± 0.74 μM when cultured at 2.5 × 10⁴ cells/zone, 3.96 ± 0.65 μM at 5.0 × 10⁴ cells/zone, and 3.53 ± 0.45 μM at 1.0 × 10⁵ cells/zone. As a result, endogenous H2S released from LNCaP cells increased significantly at 1.0 × 10⁵ cells/zone after 72 h incubation with Cys and H-Cys; however, PC-3 cells increased neither the blue channel intensity nor the correlation of H2S production with the cell number. This result was consistent with our previous results for the paper-based colorimetric assay [19]. LNCaP and PC-3 cells show different capabilities for angiogenesis and tumor aggressiveness as well as different responses to pro-inflammatory modulators [39,40]. In addition, both CBS and CSE were more highly expressed in LNCaP than PC-3 [19]. Therefore, the paper-integrated analytical device was able to detect free H2S gas from live cancer cells simultaneous with 3D cell culture.
In addition, to evaluate endogenous H2S release from LNCaP cells cultured in the presence of a single substrate (Cys), we measured the effects of Cys concentration (0. 0.2, 1, or 5 mM) and incubation duration (24, 48, and 72 h) on H2S production in LNCaP cells (1.0 × 10⁵ cells/zone). First, 5 mM Cys was added to the LNCaP cells cultured within the paper-integrated analytical device, and the cultures were incubated for 24, 48, or 72 h. The cytotoxicity of the various concentrations of Cys was assessed using the WST assay. As shown in Figure 5A, LNCaP cells produced H2S in a time-dependent manner under when incubated with Cys (3.13 ± 0.18 μM at 24 h, 4.98 ± 0.69 μM at 48 h, and 6.15 ± 0.64 μM at 72 h); however, the increased H2S production at 72 h was not significantly different from that at 48 h. Incubation with 5 mM Cys did not cause cytotoxicity up to 72 h, as shown in Figure 5B. Next, we measured the H2S release from 72 h LNCaP cell cultures according to the concentration of Cys (0. 0.2, 1, or 5 mM). As shown in Figure 5C, the production of H2S increased as the Cys concentration increased (0.95 ± 0.62 μM at 0 mM, 1.77 ± 0.69 μM at 0.2 mM, 3.19 ± 0.84 μM at 1 mM, and 5.62 ± 1.43 μM at 5 mM). Although H2S release from LNCaP cells increased in a Cys concentration-dependent manner, H2S production after treatment with only Cys was lower than that in the presence of both Cys (5 mM) and H-Cys (1 mM). In LNCaP cells, CBS was more highly expressed than CSE [19]. Singh et al. [41] reported that CBS produced much higher levels of H2S in Cys plus H-Cys than in Cys alone. This report is in agreement with our results. This might be attributed to CBS catalyzing the production of H2S gas via a reaction where Cys combines with H-Cys to form cystathionine [42].
Finally, we compared H2S release from 2D- and 3D-cultured LNCaP cells using the H2S-sensing paper. As shown in Figure 5D, H2S release from 2D-cultured LNCaP cells was detected only after incubation with 5 mM Cys (2.00 ± 0.85 μM) but not with 0, 0.2, or 1 mM (results were below the LOQ). This result indicated that 3D-cultured LNCaP cells produced more H2S than did 2D-cultured cells, which is a result that might be attributed to the difference of LNCaP cell morphology of 2D and 3D cultures as well as more effective activation of cells by Cys in the 3D environment.
Therefore, our paper-based 3D cell culture platform was able to maintain the typical characteristics of cancer cells by mimicking in vivo microenvironments, as well as treat substrate or drug more effectively. Our paper-integrated analytical device exhibited some distinct advantages over 2D cultures: (1) it is easy to fabricate and use, with low cost; (2) it can easily detect free H2S gas from 3D-cultured, live cells without complex, invasive processes or requiring additional time for H2S detection; (3) it can mimic the in vivo microenvironment; (4) cell viability can be detected directly on the paper; and (5) it can be easily applied to various drug studies of H2S signaling and pathophysiology in cancer biology. Thus, our paper-integrated analytical device is a simple and effective analytical tool for the in situ H2S detection in 3D-cultured, live cells.

4. Conclusions

In summary, we developed a simple, easy to use, and effective paper-integrated analytical device for 3D cell culture and in situ H2S detection in live LNCaP cells. This device consisted of a colorimetric sensing paper for H2S and paper-based cell culture platform. The paper-based cell culture platform was able to provide a suitable microenvironment for LNCaP cells to maintain their proliferative capacity, viability, and characteristics such as PSA expression within the paper-integrated analytical device. Moreover, we successfully detected endogenous H2S release from 3D-cultured LNCaP cells on the paper using the H2S-sensing paper. As a result, our paper-integrated analytical device easily detected free H2S in live 3D cell cultures, which can better mimic the in vivo cell environment compared to 2D culture, and no additional time for H2S detection or complicated sample preparation was required. In addition, quantitative analysis of H2S production, as well as cell viability, can be easily performed by scanning the paper and measuring the color intensity with ImageJ software. Therefore, we expect that this paper-integrated analytical device will be effectively utilized as a tool to investigate H2S signaling in 3D-culture models as well as pathophysiology in cancer biology and cancer therapeutics.

Supplementary Materials

The following supporting information can be downloaded at https://0-www-mdpi-com.brum.beds.ac.uk/article/10.3390/chemosensors10010027/s1, Figure S1: Design illustrating the four-zone patterned paper substrates for (A) 3D cell culture and (B) H2S sensing. Photographic images of (C) the agarose-medium reservoir, (D) the 3D cell culture paper placed on the agarose-medium, and (E) the paper-integrated analytical device after wrapping in parafilm, Figure S2: Image analysis of the WST assay of LNCaP cells in 3D-cultured cell paper, using ImageJ software. The original images from the scanner were split into red, green, and blue channels. Each channel was assessed to analyze the extent of scattered intensity. Among them, the blue channel showed the maximum changes and linearity under scanner conditions (slope −0.0034, R2 = 0.9909), compared with the red channel (slope −0.0006, R2 = 0.7075) and green channel (slope −0.0022, R2 = 0.9628). The region of interest (ROI) was the whole area of each detection zone, Figure S3: Design illustrating the multi-zone patterned paper with 24 circular zones for the detection of H2S in the 96-well microplate format (2D cell culture).

Author Contributions

Conceptualization, G.-J.L.; methodology, J.-H.K., Y.-J.A. and Y.-J.L.; validation, Y.-J.L. and G.-J.L.; formal analysis, J.-H.K., M.K. and Y.-J.A.; investigation, J.-H.K., Y.-J.L. and G.-J.L.; writing—original draft preparation, J.-H.K. and G.-J.L.; writing—review and editing, Y.-J.L. and G.-J.L.; visualization, G.-J.L.; supervision, G.-J.L.; project administration, G.-J.L.; funding acquisition, G.-J.L. All authors have read and agreed to the published version of the manuscript.

Funding

This research was supported by the Korea Medical Device Development Fund grant funded by the Korea government (the Ministry of Science and ICT, the Ministry of Trade, Industry and Energy, the Ministry of Health & Welfare, the Ministry of Food and Drug Safety) [Project Number: KMDF_PR_20200901_0023, 1711137928].

Institutional Review Board Statement

Not applicable.

Informed Consent Statement

Not applicable.

Data Availability Statement

Not applicable.

Conflicts of Interest

The authors declare no conflict of interest.

References

  1. Rawla, P. Epidemiology of Prostate Cancer. World J. Oncol. 2019, 10, 63–89. [Google Scholar] [CrossRef] [PubMed] [Green Version]
  2. Zhao, K.; Li, S.; Wu, L.; Lai, C.; Yang, G. Hydrogen sulfide represses androgen receptor transactivation by targeting at the second zinc finger module. J. Biol. Chem. 2014, 289, 20824–20835. [Google Scholar] [CrossRef] [Green Version]
  3. Duan, F.; Li, Y.; Chen, L.; Zhou, X.; Chen, J.; Chen, H.; Li, R. Sulfur inhibits the growth of androgen-independent prostate cancer in vivo. Oncol. Lett. 2015, 9, 437–441. [Google Scholar] [CrossRef] [Green Version]
  4. Giovinazzo, D.; Bursac, B.; Sbodio, J.I.; Nalluru, S.; Vignane, T.; Snowman, A.M.; Albacarys, L.M.; Sedlak, T.W.; Torregrossa, R.; Whiteman, M.; et al. Hydrogen sulfide is neuroprotective in Alzheimer’s disease by sulfhydrating GSK3β and inhibiting Tau hyperphosphorylation. Proc. Natl. Acad. Sci. USA 2021, 118, e2017225118. [Google Scholar] [CrossRef]
  5. Yang, G.; Wu, L.; Jiang, B.; Yang, W.; Qi, J.; Cao, K.; Meng, Q.; Mustafa, A.K.; Mu, W.; Zhang, S.; et al. H2S as a physiologic vasorelaxant: Hypertension in mice with deletion of cystathionine γ-Lyase. Science 2008, 322, 587–590. [Google Scholar] [CrossRef] [PubMed] [Green Version]
  6. Cao, X.; Cao, L.; Ding, L.; Bian, J.S. A new hope for a devastating disease: Hydrogen sulfide in Parkinson's disease. Mol. Neurobiol. 2018, 55, 3789–3799. [Google Scholar] [CrossRef] [PubMed]
  7. Szabo, C. Roles of hydrogen sulfide in the pathogenesis of diabetes mellitus and its complications. Antioxid. Redox Signal. 2012, 17, 68–80. [Google Scholar] [CrossRef] [PubMed]
  8. Hellmich, M.R.; Szabo, C. Hydrogen sulfide and cancer. Handb. Exp. Pharmacol. 2015, 230, 233–241. [Google Scholar]
  9. Youness, R.A.; Gad, A.Z.; Sanber, K.; Ahn, Y.J.; Lee, G.J.; Khallaf, E.; Hafez, H.M.; Motaal, A.A.; Ahmed, N.; Gad, M.Z. Targeting hydrogen sulphide signaling in breast cancer. J. Adv. Res. 2021, 27, 177–190. [Google Scholar] [CrossRef]
  10. Li, M.; Liu, Y.; Deng, Y.; Pan, L.; Fu, H.; Han, X.; Li, Y.; Shi, H.; Wang, T. Therapeutic potential of endogenous hydrogen sulfide inhibition in breast cancer (Review). Oncol. Rep. 2021, 45, 68. [Google Scholar] [CrossRef]
  11. Wallace, J.L.; Ferraz, J.G.; Muscara, M.N. Hydrogen sulfide: An endogenous mediator of resolution of inflammation and injury. Antioxid. Redox Signal. 2012, 17, 58–67. [Google Scholar] [CrossRef]
  12. Sonke, E.; Verrydt, M.; Postenka, C.O.; Pardhan, S.; Willie, C.J.; Mazzola, C.R.; Hammers, M.D.; Pluth, M.D.; Lobb, I.; Power, N.E.; et al. Inhibition of endogenous hydrogen sulfide production in clear-cell renal cell carcinoma cell lines and xenografts restricts their growth, survival and angiogenic potential. Nitric Oxide 2015, 49, 26–39. [Google Scholar] [CrossRef] [Green Version]
  13. Oláh, G.; Módis, K.; Törö, G.; Hellmich, M.R.; Szczesny, B.; Szabo, C. Role of endogenous and exogenous nitric oxide, carbon monoxide and hydrogen sulfide in HCT116 colon cancer cell proliferation. Biochem. Pharmacol. 2018, 149, 186–204. [Google Scholar] [CrossRef] [PubMed]
  14. Liu, M.; Wu, L.; Montaut, S.; Yang, G. Hydrogen sulfide signaling axis as a target for prostate cancer therapeutics. Prostate Cancer 2016, 2016, 8108549. [Google Scholar] [CrossRef] [PubMed] [Green Version]
  15. Szabo, C. Gasotransmitters in cancer: From pathophysiology to experimental therapy. Nat. Rev. Drug Discov. 2016, 15, 185–203. [Google Scholar] [CrossRef] [Green Version]
  16. Kartha, R.V.; Zhou, J.; Hovde, L.B.; Cheung, B.W.Y.; Schröder, H. Enhanced detection of hydrogen sulfide generated in cell culture using an agar trap method. Anal. Biochem. 2012, 423, 102–108. [Google Scholar] [CrossRef] [PubMed]
  17. Li, D.W.; Qu, L.L.; Hu, K.; Long, Y.T.; Tian, H. Monitoring of endogenous hydrogen sulfide in living cells using surface-enhanced Raman scattering. Angew. Chem.-Int. Edit. 2015, 54, 12758–12761. [Google Scholar] [CrossRef]
  18. An, B.; Zhang, H.; Peng, J.; Zhu, W.; Wei, N.; Zhang, Y. A highly sensitive ratiometric fluorescent probe for imaging endogenous hydrogen sulfide in cells. New J. Chem. 2020, 44, 20253–20258. [Google Scholar] [CrossRef]
  19. Lee, J.; Lee, Y.J.; Ahn, Y.J.; Choi, S.; Lee, G.J. A simple and facile paper-based colorimetric assay for detection of free hydrogen sulfide in prostate cancer cells. Sens. Actuator B-Chem. 2018, 256, 828–834. [Google Scholar] [CrossRef]
  20. Imamura, Y.; Mukohara, T.; Shimono, Y.; Funakoshi, Y.; Chayahara, N.; Toyoda, M.; Kiyota, N.; Takao, S.; Kono, S.; Nakatsura, T.; et al. Comparison of 2D- and 3D-culture models as drug-testing platforms in breast cancer. Oncol. Rep. 2015, 33, 1837–1843. [Google Scholar] [CrossRef] [Green Version]
  21. Breslin, F.S.; O’Driscoll, L. Three-dimensional cell culture: The missing link in drug discovery. Drug Discov. Today 2013, 18, 240–249. [Google Scholar] [CrossRef]
  22. Lovitt, C.J.; Shelper, T.B.; Avery, V.M. Advanced cell culture techniques for cancer drug discovery. Biology 2014, 3, 345–367. [Google Scholar] [CrossRef] [PubMed] [Green Version]
  23. Riedl, A.; Schlederer, M.; Pudelko, K.; Stadler, M.; Walter, S.; Unterleuthner, D.; Unger, C.; Kramer, N.; Hengstschläger, M.; Kenner, L.; et al. Comparison of cancer cells in 2D vs 3D culture reveals differences in AKT–mTOR–S6K signaling and drug responses. J. Cell Sci. 2017, 130, 203–218. [Google Scholar]
  24. Derda, R.; Laromaine, A.; Mammoto, A.; Tang, S.K.Y.; Mammoto, T.; Ingber, D.E.; Whitesides, G.M. Paper-supported 3D cell culture for tissue-based bioassays. Proc. Natl. Acad. Sci. USA 2009, 106, 18457–18462. [Google Scholar] [CrossRef] [Green Version]
  25. Ng, K.; Gao, B.; Yong, K.W.; Li, Y.; Shi, M.; Zhao, X.; Li, Z.; Zhang, X.; Pingguan-Murphy, B.; Yang, H.; et al. Paper-based cell culture platform and its emerging biomedical applications. Mat. Today 2017, 20, 32–44. [Google Scholar] [CrossRef]
  26. Cramer, S.M.; Larson, T.S.; Lockett, M.R. Tissue papers: Leveraging paper-based microfluidics for the next generation of 3D tissue models. Anal. Chem. 2019, 91, 10916–10926. [Google Scholar] [CrossRef] [Green Version]
  27. Pupinyo, N.; Chatatikun, M.; Chiabchalard, A.; Laiwattanapaisal, W. In situ paper-based 3D cell culture for rapid screening of the anti-melanogenic activity. Analyst 2019, 144, 290–298. [Google Scholar] [CrossRef]
  28. Derda, R.; Tang, S.K.Y.; Laromaine, A.; Mosadegh, B.; Hong, E.; Mwangi, M.; Mammoto, A.; Ingber, D.E.; Whitesides, G.M. Multizone paper platform for 3D cell cultures. PLoS ONE 2011, 6, e18940. [Google Scholar] [CrossRef] [PubMed] [Green Version]
  29. Lei, K.F.; Chang, C.H.; Chen, M.J. Paper/PMMA hybrid 3D cell culture microfluidic platform for the study of cellular crosstalk. ACS Appl. Mater. Interfaces 2017, 9, 13092–13101. [Google Scholar] [CrossRef]
  30. Martinez, A.W.; Phillips, S.T.; Whitesides, G.M.; Carrilho, E. Diagnostics for the developing world: Microfluidic paper-based analytical devices. Anal. Chem. 2010, 82, 3–10. [Google Scholar] [CrossRef]
  31. Ferreira, F.T.S.M.; Mesquita, R.B.R.; Rangel, A.O.S.S. Novel microfluidic paper-based analytical devices (μPADs) for the determination of nitrate and nitrite in human saliva. Talanta 2020, 219, 121183. [Google Scholar] [CrossRef] [PubMed]
  32. Charbaji, A.; Heidari-Bafroui, H.; Anagnostopoulos, C.; Faghri, M. A new paper-based microfluidic device for improved detection of nitrate in water. Sensors 2021, 21, 102. [Google Scholar] [CrossRef] [PubMed]
  33. Roslev, P.; King, G.M. Application of a tetrazolium salt with a water-soluble formazan as an indicator of viability in respiring bacteria. Appl. Environ. Microbiol. 1993, 59, 2891–2896. [Google Scholar] [CrossRef] [PubMed] [Green Version]
  34. Charbaji, A.; Smith, W.; Anagnostopoulos, C.; Faghri, M. Zinculose: A new fibrous material with embedded zinc particles. Eng. Sci. Technol. Int. J. 2021, 24, 571–578. [Google Scholar] [CrossRef]
  35. Langhans, S.A. Three-dimensional in vitro cell culture models in drug discovery and drug repositioning. Front. Pharmacol. 2018, 9, 6. [Google Scholar] [CrossRef] [PubMed]
  36. Lei, K.F.; Huang, C.H.; Tsang, N.M. Impedimetric quantification of cells encapsulated in hydrogel cultured in a paper-based microchamber. Talanta 2016, 147, 628–633. [Google Scholar] [CrossRef]
  37. Enmon, R.M.; O'Connor, K.C.; Song, H.; Lacks, D.J.; Schwartz, D.K. Aggregation kinetics of well and poorly differentiated human prostate cancer cells. Biotechnol. Bioeng. 2002, 80, 580–588. [Google Scholar] [CrossRef]
  38. Taverniers, I.; De Loose, M.; Van Bockstaele, E. Trends in quality in the analytical laboratory. II. analytical method validation and quality assurance. Trac-Trends Anal. Chem. 2004, 23, 535–552. [Google Scholar] [CrossRef]
  39. Tesan, T.; Gustavsson, H.; Welen, K.; Damber, J.E. Differential expression ofangiopoietin-2 and vascular endothelial growth factor inandrogen-independent prostate cancer models. BJU Int. 2008, 102, 1034–1039. [Google Scholar] [CrossRef]
  40. Menschikowski, M.; Hagelgans, A.; Gussakovsky, E.; Kostka, H.; Paley, E.L.; Siegert, G. Differential expression of secretory phospholipases A2 in normal and malignant prostate cell lines: Regulation by cytokines, cell signaling pathways, and epigenetic mechanisms. Neoplasia 2008, 10, 279–286. [Google Scholar] [CrossRef] [Green Version]
  41. Singh, S.; Padovani, D.; Leslie, R.A.; Chiku, T.; Banerjee, R. Relative contributions of cystathionine β-synthase and γ-cystathionase to H2S biogenesis via alternative trans-sulfuration reactions. J. Biol. Chem. 2009, 284, 22457–22466. [Google Scholar] [CrossRef] [PubMed] [Green Version]
  42. Prabhudesai, S.; Koceja, C.; Dey, A.; Eisa-Beygi, S.; Leigh, N.R.; Bhattacharya, R.; Mukherjee, P.; Ramchandran, R. Cystathionine β-synthase is necessary for axis development in vivo. Front. Cell Dev. Biol. 2018, 6, 14. [Google Scholar] [CrossRef] [PubMed] [Green Version]
Figure 1. Schematic illustration of the fabrication process and experimental design of the paper-integrated analytical device containing H2S-sensing paper and 3D cell culture paper for in situ cultivation and detection of H2S from live cancer cells.
Chemosensors 10 00027 g001
Figure 2. Characterization of the paper-based 3D cell culture platform. (A) Correlation between WST color intensity (255-blue channel intensity) and number of LNCaP cells (0, 5.0 × 10³, 1.0 × 10⁴, and 3.0 × 10⁴ cells/zone) seeded onto the cell culture paper. The evaluation was carried out in three detection zones of three different papers (n = 3). The error bars represent standard deviations (SD). (B) Proliferation of LNCaP cells cultured on the cell culture paper assessed using the WST assay. Initially, 3.0 × 10⁴ cells/zone were seeded and cultured for 72 h. The proliferation of LNCaP cells was quantified at 24, 48, and 72 h using the change in blue channel intensity of WST. The evaluation was carried out in nine detection zones of three different papers (n = 9). The error bars represent SD. (C) Representative fluorescence images of LIVE/DEAD™ staining of LNCaP cells cultured on the paper for 24, 48, or 72 h. The scale bar represents 100 μm. (D) Representative image of immunofluorescence staining for PSA (green) in LNCaP cells after 72 h of culture on the paper. The scale bar represents 20 μm.
Chemosensors 10 00027 g002
Figure 3. Evaluation of LNCaP cells cultured within the paper-integrated analytical device. (A) Correlation between cell proliferation and culture duration. Initially, 3.0 × 10⁴ cells were seeded and cultured for 72 h. The proliferation of LNCaP cells was quantified at 24, 48, and 72 h using the change in blue channel intensity of WST. The evaluation was carried out in nine detection zones of three different papers (n = 9). The error bars represent standard deviations. (B) Representative fluorescence images of LIVE/DEAD™ staining of LNCaP cells cultured within the paper-integrated analytical device for 72 h. The scale bar represents 100 μm. (C) Representative immunofluorescence image staining for PSA (green) in LNCaP cells after 72 h of culture within the paper-integrated analytical device. The scale bar represents 20 μm.
Chemosensors 10 00027 g003
Figure 4. (A) Calibration plot of change in blue channel intensity of the H2S-sensing paper versus concentration of H2S in phosphate-buffered saline at room temperature under ambient conditions (n = 5). The quantitative analysis of endogenous H2S production in two live prostate cancer cell lines (B) LNCaP and (C) PC-3 cells was performed using the paper-integrated analytical device. The effects of cell number (2.5 × 10⁴, 5.0 × 10⁴, or 1.0 × 10⁵ cells/zone) and incubation with L-cysteine (Cys, 5 mM) and L-homocysteine (H-Cys, 1 mM) were assessed after 72 h. The error bars represent standard deviations.
Chemosensors 10 00027 g004
Figure 5. (A) Effect of duration of incubation (24, 48, or 72 h) with L-cysteine (Cys, 5 mM) on endogenous H2S production and (B) evaluation of cell viability of LNCaP cells (1.0 × 10⁵ cells/zone) after culturing within the paper-integrated analytical device. The viability of LNCaP cells was quantified by the change in blue channel intensity of WST. Effects of Cys concentration (0, 0.2, 1.0, and 5.0 mM) on H2S release from (C) 3D-cultured LNCaP cells (1.0 × 10⁵ cells/zone) in the paper-integrated analytical device and (D) 2D-cultured LNCaP cells (1.0 × 10⁵ cells/well) in a 96-well microplate for 72 h, respectively. The error bars represent standard deviations (SD).
Chemosensors 10 00027 g005
Publisher’s Note: MDPI stays neutral with regard to jurisdictional claims in published maps and institutional affiliations.

