
Silver-Coated Gold Nanorods as Optical Probes for the Sensitive Detection of Ascorbic Acid in Tablets

1
Key Laboratory of Luminescence Analysis and Molecular Sensing (Southwest University), Ministry of Education, College of Pharmaceutical Sciences, Southwest University, Chongqing 400715, China
2
Department of Biological and Chemical Engineering, Chongqing University of Education, Chongqing 400067, China
*
Authors to whom correspondence should be addressed.
Chemosensors 2022, 10(12), 543; https://0-doi-org.brum.beds.ac.uk/10.3390/chemosensors10120543
Submission received: 6 November 2022
/
Revised: 9 December 2022
/
Accepted: 13 December 2022
/
Published: 18 December 2022
(This article belongs to the Special Issue Application of Luminescent Materials for Sensing)
Abstract
:Ascorbic acid (AA) has been widely used to improve human health since it was first found, such as resisting scurvy, enhancing immunity, and preventing arteriosclerosis. Moreover, it plays a very important role in the anti-oxidation process in the human body. Therefore, it is of great significance to develop sensitive and accurate detection methods. In this work, silver-coated gold nanorods (Au@Ag NRs) acted as the optical probe, which could be etched with hydroxyl radicals (·OH) from the Fenton reaction between H2O2 and Fe2+, leading to the blue shift of longitudinal localized surface plasmon resonance absorption. However, as a free radical scavenger, AA was able to inhibit the Fenton reaction, resulting in a red shift of plasmon resonance absorption. Based on the change in longitudinal plasma resonance absorption of silver-coated gold nanorods, a linear relationship between the maximum longitudinal absorption wavelength and the concentration of AA was established in the range of 2.5–17.5 μM with a limit of detection (LOD) of 0.48 μM and a limit of quantitation (LOQ) of 1.61 μM, which was feasible to detect AA in tablets.
1. Introduction
Ascorbic acid (AA), also known as vitamin C (Vc), is widely found in natural products such as fruits and vegetables [1]. As early as Columbus’s sailing days, AA was used to improve the health of the crews. In addition, AA can also be used as a nutritional additive and an antioxidant in many foods [2], which is advantageous to improve human health and immunity, etc. Moreover, it can be used in wheat flour to improve the nutritional and organoleptic properties of bread [3]. Therefore, it is very meaningful to determine AA.
By now, abundant methods of AA detection have been widely developed. For example, traditional iodometric titration [4] has been employed in pharmacopoeias. In recent years, modern technical methods have been proposed, such as light scattering [5], colorimetry [6,7], fluorimetry [8], electrochemistry [9,10], and chemiluminescence [11]. Among them, absorption spectrometry has attracted widespread concern owing to its low cost, easy operation, and flexible probes [12].
As an excellent optical probe, gold nanorods (Au NRs) present the longitudinal localized surface plasmon resonances in the range of 500–1000 nm by adjusting their morphology, size, and structure [13], which have found wide application in the fields of biosensing [14], chemical reaction monitoring [15], and cancer treatment due to their adjustable properties and good biocompatibility. What is more, bimetallic core−shell nanostructures have attracted growing attention owing to their unique properties and great potential, which are different from those of monometallic counterparts and alloys [16]. Usually, gold nanorods can easily form bimetallic silver-coated gold nanorods by the deposition of a silver layer on the surface of gold nanorods due to the similar lattice constants [17]; this process has shown promising potential in simple and sensitive assays in biosensing [18,19] based on the shift of longitudinal localized surface plasmon resonances [20].
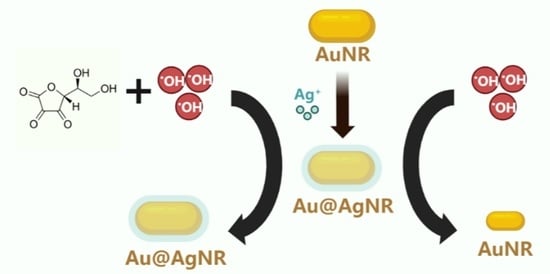
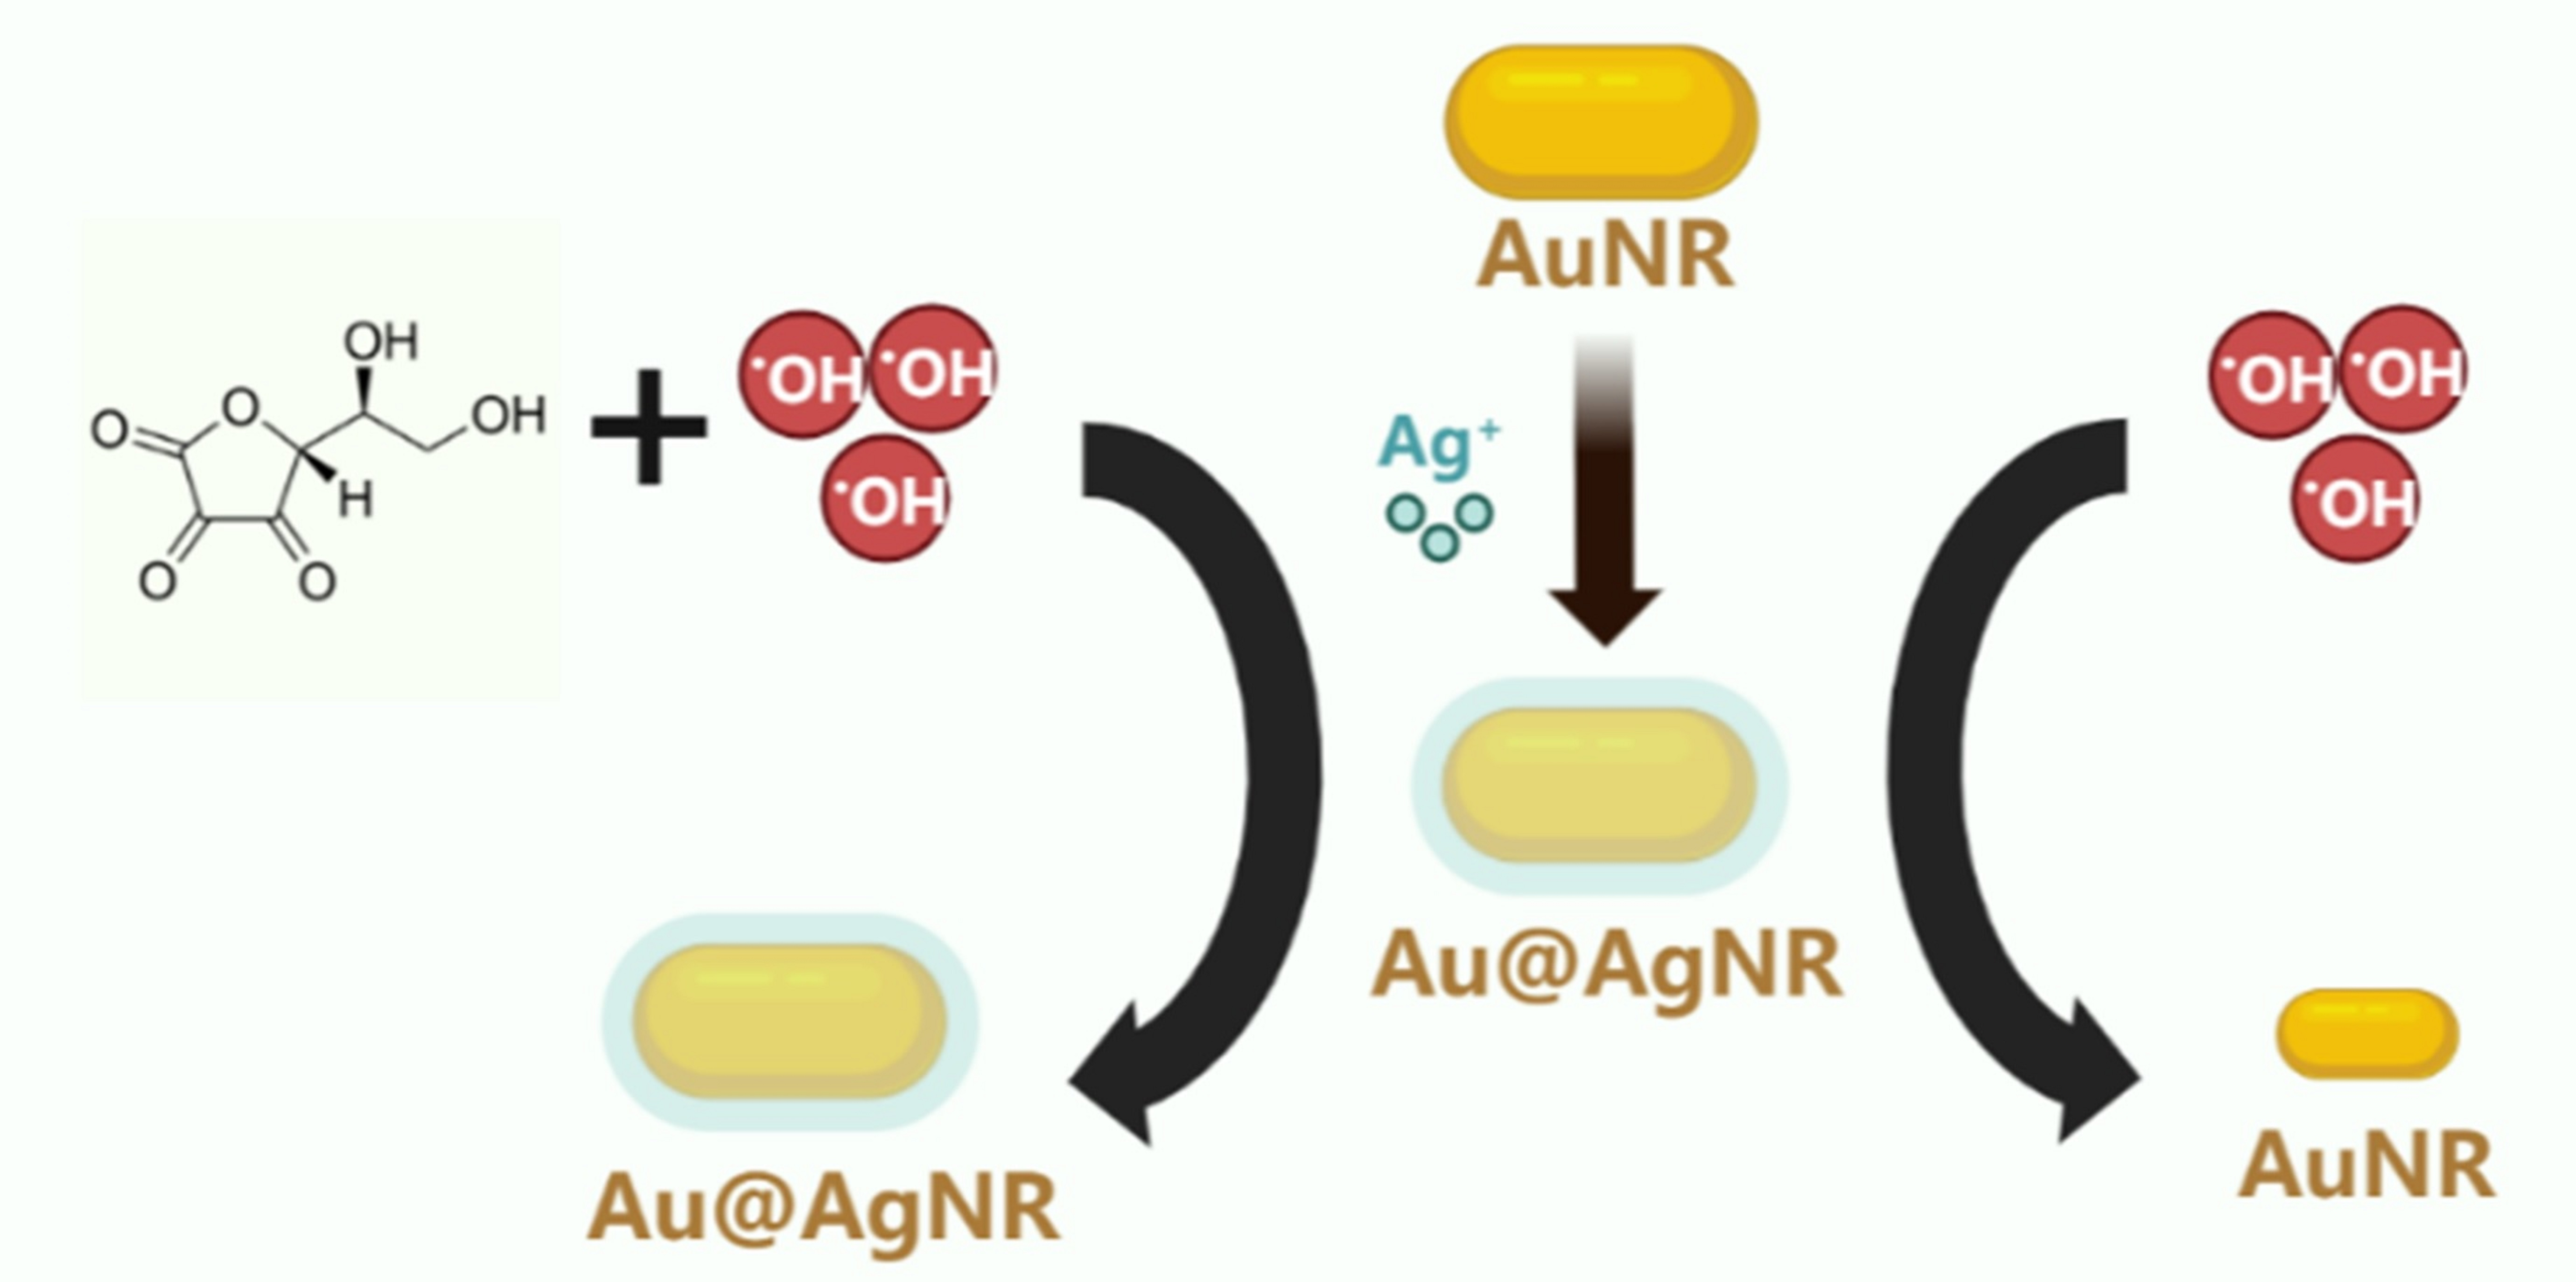
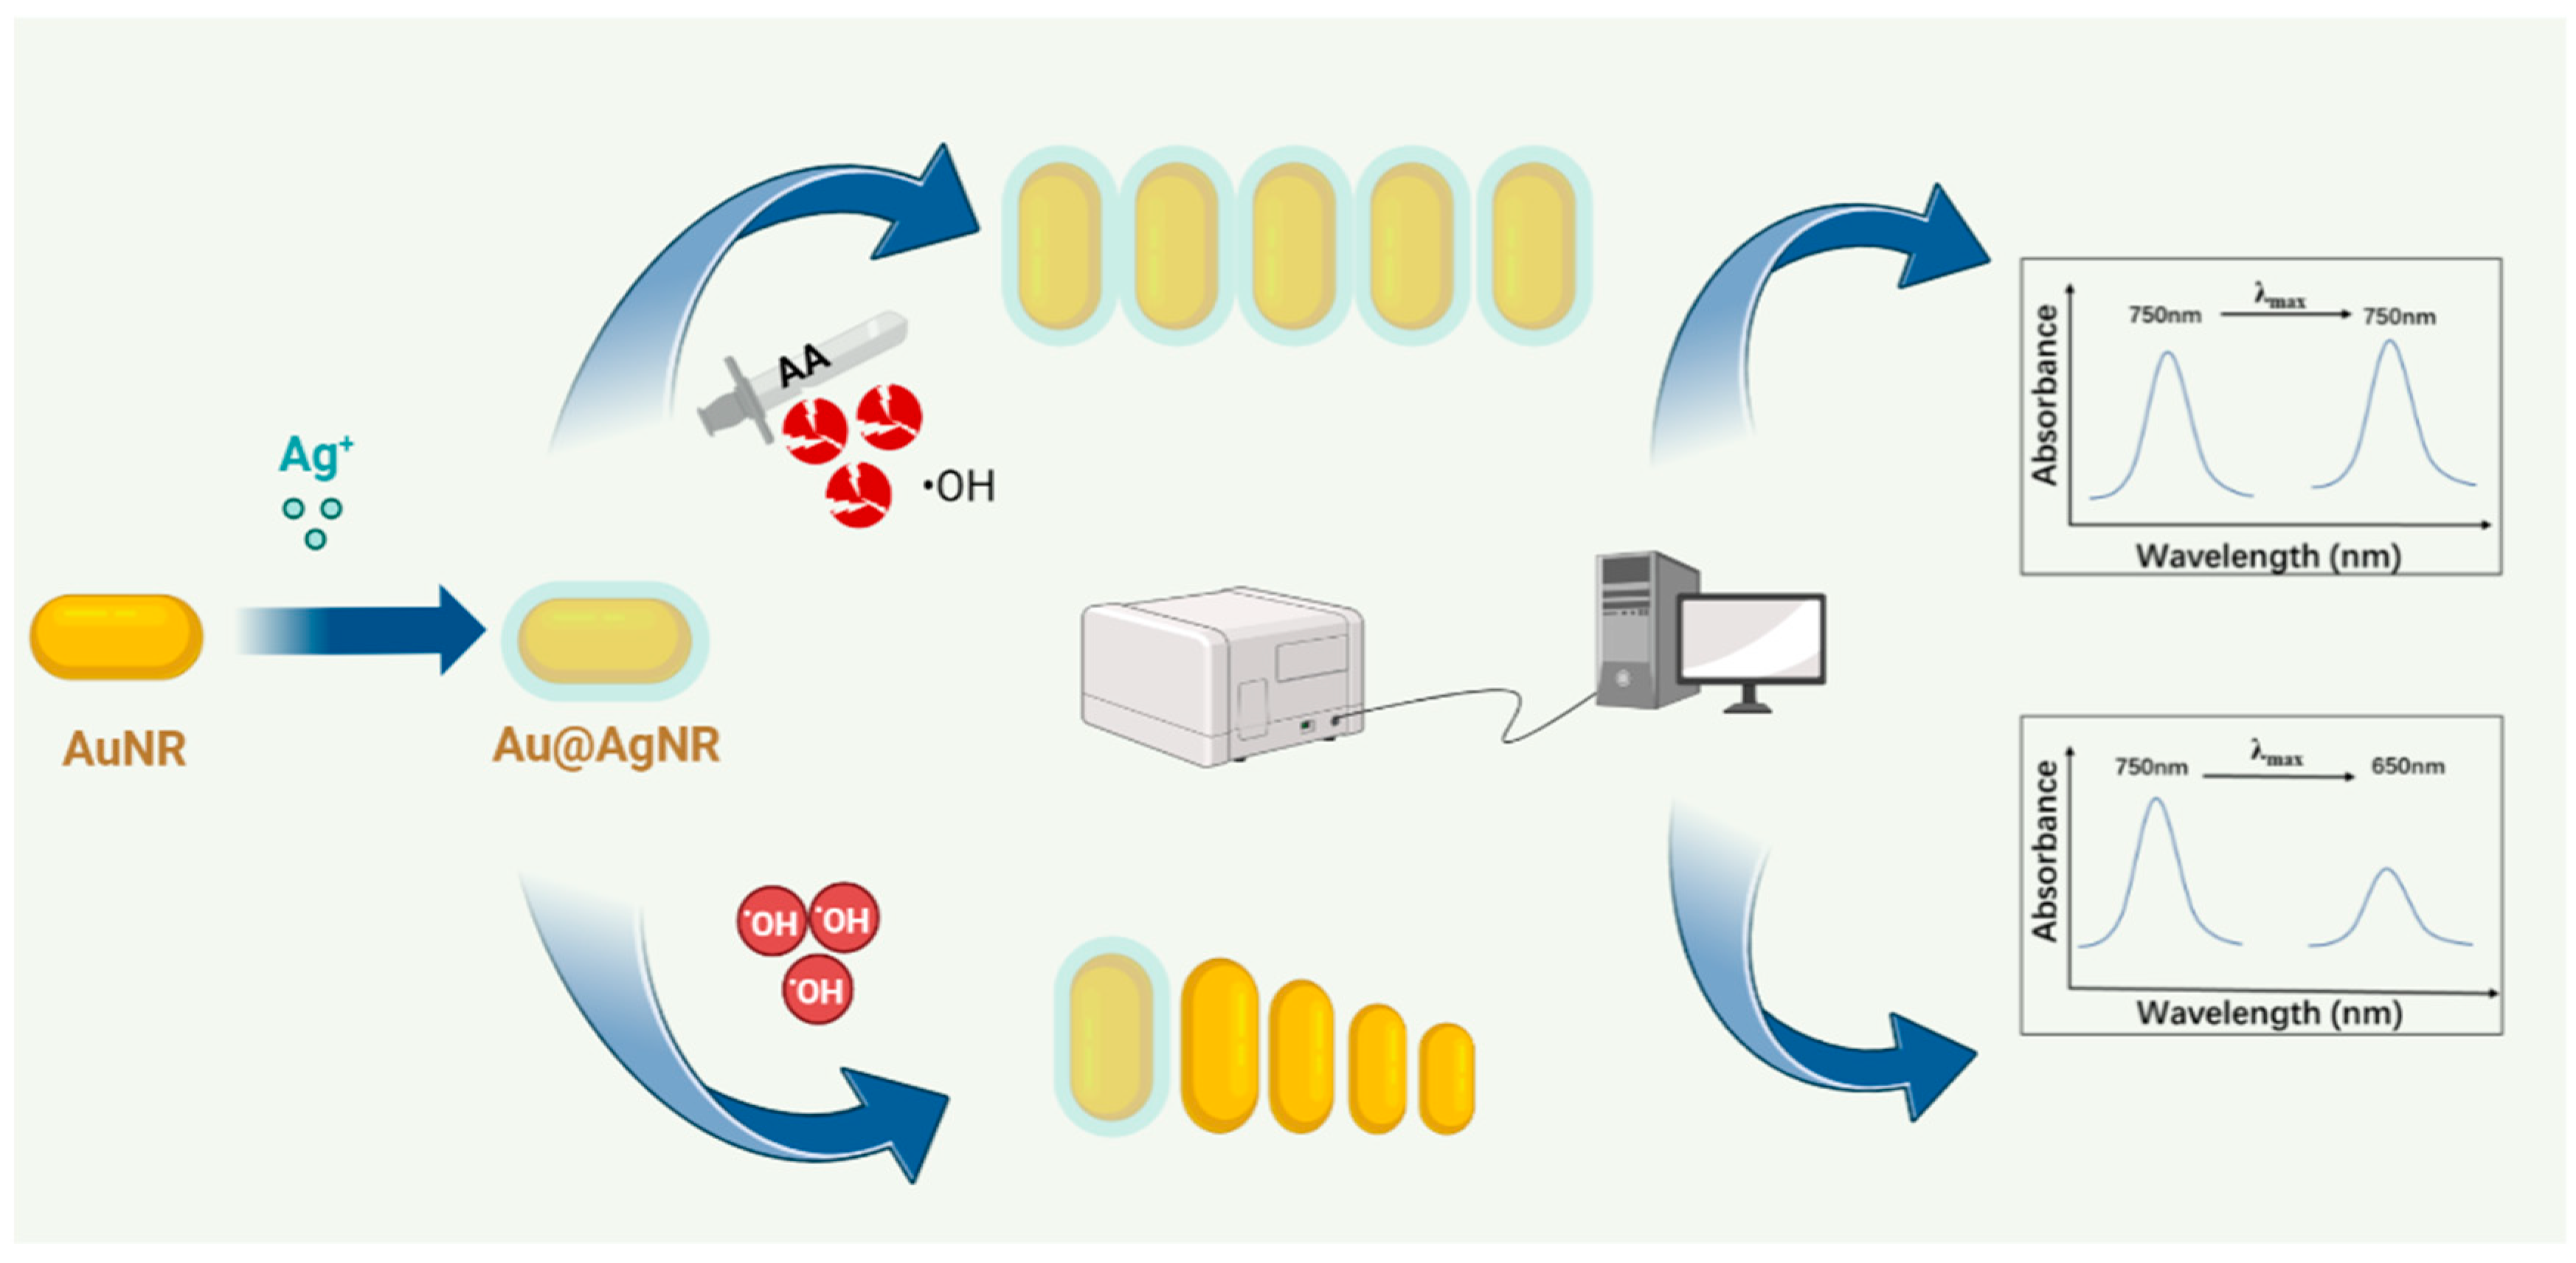
Based on the above characteristics, a highly sensitive and selective detection of AA was achieved with silver-coated gold nanorods as optical probes (Scheme 1). Under the optimal conditions, the silver atoms on the gold nanorods’ surface were etched by hydroxyl radicals generated by the Fenton reaction of H2O2 and Fe2+, leading to a lower aspect ratio of silver-coated gold nanorods, which resulted in the blue shift of the longitudinal localized surface plasmon resonance. However, the introduction of AA could inhibit the etching of hydroxyl radicals due to the reducibility of AA, which could induce a higher aspect ratio of silver-coated gold nanorods, leading to the red shift of the longitudinal localized surface plasmon resonance. Based on the linear relationship between the longitudinal localized surface plasmon resonance and the AA concentration, an accurate and highly selective method was established. It was further used to detect AA tablets from different companies, which agreed well with the result detected by iodometry in Pharmacopeia 2020 and with labeled quality.
2. Materials and Methods
2.1. Apparatus
The absorption spectra were obtained from a UV-3600 UV-visible near-infrared spectrophotometer (Shimadzu, Kyoto, Japan), and the nanorods images were observed by an S-4800 scanning electron microscope (SEM, Hitachi, Tokyo, Japan). A DF-101S collector thermostatic heating magnetic stirrer (Shanghai Lichen Bangxi Instrument Technology Co., Ltd., Shanghai, China) was used to control the reaction temperature, and an L420 desktop high-speed centrifuge (Hunan Xiangyi Laboratory Instrument Development Co., Ltd., Changsha, China) was used to purify nanorods.
2.2. Materials
Ascorbic acid (L-AA) was obtained from Zhiyuan Chemical Reagent Co., Ltd. (Tianjin, China). NaOH, 30% H2O2, AgNO3, HAuCl4, NaBH4, and sodium oleate (NaOL) were commercially purchased from Chuangdong Chemical Company (Chongqing, China). L-argnine (L-Arg), L-lysine (L-Lys), L-tryptophane (Trp), L-phenylalanine (L-Phe), L-threonine (L-Thr), citric acid (CA), tartaric acid (TA), sodium dodecyl sulfate (SDS), sodium dodecyl benzene sulfonate (SDBS), cetyltrimethylammonium bromide (CTAB), and polyvinyl pyrrolidone (PVP) were supplied by Aladdin Biochemical Technology Co., Ltd. (Shanghai, China). AA tablets from three companies (Huazhong Pharmaceutical Co., Ltd., Wuhan, China, Lot: 20211037; Northeast Pharmaceutical Co., Ltd., Shenyang, China, Lot: 5211209; and South China Pharmaceutical Group Co., Ltd., Guangzhou, China. Lot: 211103) were detected as real samples.
2.3. Preparation of Gold Nanorods
Gold nanorods were prepared by a seed-mediated method [21,22], which followed two steps: (1) The synthesis of the seed solution: 5 mL of 0.5 mM HAuCl4 and 5 mL of 0.2 M CTAB were mixed well and followed by the introduction of 1 mL of 6 mM NaBH4 to the mixture. Then, the seed solution was obtained after stirring at 1200 rpm for 2 min in 30 °C water bath. (2) The preparation of growth solution: 1.4 g of CTAB and 0.2468 g NaOL were dissolved in 50 mL of distilled water at 50 °C. Then, the mixture was cooled to about 30 °C, followed by the addition of 4.8 mL of 4 mM AgNO3. After standing for 15 min, 50 mL of 1 mM HAuCl4 was added into the mixture, which was further stirred at 700 rpm for 90 min. Afterwards, 0.3 mL of concentrated HCl was added and then stirred at 400 rpm for 15 min. After that, 0.25 mL of 64 mM of L-AA was added and vigorously stirred for 30 s, and 80 μL of seed solution was immediately injected and mixed well in a 30 °C water bath for more than 12 h to obtain gold nanorods.
2.4. Synthesis of Silver-Coated Gold Nanorods
Silver-coated gold nanorods were synthetized by the chemical deposition of the silver layer on the gold nanorods’ surface. In total, 10 mL of as-prepared gold nanorod solution and 20 mL of PVP solution (1% wt) were mixed in a 50 mL tube and further mixed with 5 mL of 1 mM AgNO3 solution. After that, 1 mL of 0.1 M L-AA solution and 2 mL of 0.1 M NaOH solution were added to the mixture. After stirring in a 25 °C water bath for 10 min, the absorption spectrum was scanned by a UV-3600 UV-Vis spectrophotometer.
2.5. The Inhibition of Chemical Etching Reaction by Ascorbic Acid
Under the most favorable conditions, 0.1 M HCl, 0.25 mM Fe2+, and 450 μM H2O2 were mixed with AA at different concentrations (0 μM, 2.5 μM, 5 μM, 7.5 μM, 10 μM, 15 μM, and 17.5 μM) and further reacted with 50 μL of silver-coated gold nanorod solution, followed by dilution to 500 μL with distilled water and incubation in a 45 °C water bath for 25 min. Subsequently, the absorption spectra were scanned by a UV-3600 UV-Vis spectrophotometer.
2.6. Detection of Ascorbic Acid in Tablets
The real sample pretreatment was carried out according to the provisions in the Pharmacopoeia of the People’s Republic of China (2020). In total, 20 pieces of Vc tablets available from each company were finely weighed and then ground, dissolved with 10 mL of acetic acid (0.1 M), and diluted to 100 mL with distilled water. After that, the solution was filtered with filter paper and stored at 4 °C for further detection.
The detection by standard method: In accordance with the method in Pharmacopoeia 2020, 50 mL of the above AA solution was mixed with 1 mL of starch indicator solution, which was immediately titrated with 0.05 M of iodine titration solution until the mixture turned to blue, suggesting the titration endpoint.
The detection by the proposed method: The above AA tablet solution was diluted by 100 times, and then 50 μL of the diluted AA tablet solution was mixed with 0.1 M HCl, 0.25 mM Fe2+, and 450 μM H2O2. Afterwards, the mixture was reacted with 50 μL of silver-coated gold nanorod solution, which was diluted to 500 μL with distilled water and incubated at 45 °C for 25 min, followed by scanning absorption with a UV-3600 UV-Vis spectrophotometer.
3. Results and Discussion
3.1. Working Principles and Spectral Characteristics
In this work, gold nanorods acted as the initial optical probe, which was then coated by a silver layer of to obtain the silver-coated gold nanorod probe. Previous studies have shown that hydroxyl radicals produced by the Fenton reaction have a strong effect on the etching of gold nanorods [23]. The main etching mechanism is that hydroxyl radicals possess strong oxidation ability, which can oxidize and etch the atoms on the surface of the nanorod. In addition, the silver layer on the gold core is more easily oxidized than gold atoms, so silver-coated gold nanorods could present a more sensitive maximum absorption peak shift [18,20,23]. Thus, silver-coated gold nanorods were etched with the hydroxyl radicals generated by the Fenton reaction between H2O2 and Fe2+ under acidic conditions, resulting in a lower aspect ratio of silver-coated gold nanorods, which was accompanied by the blue shift of the longitudinal localized surface plasmon resonance (λmax). However, when AA was introduced to the etching system, the generation of the hydroxyl radical and the etching reaction were inhibited, leading to less of a blue shift of λmax (Scheme 1).
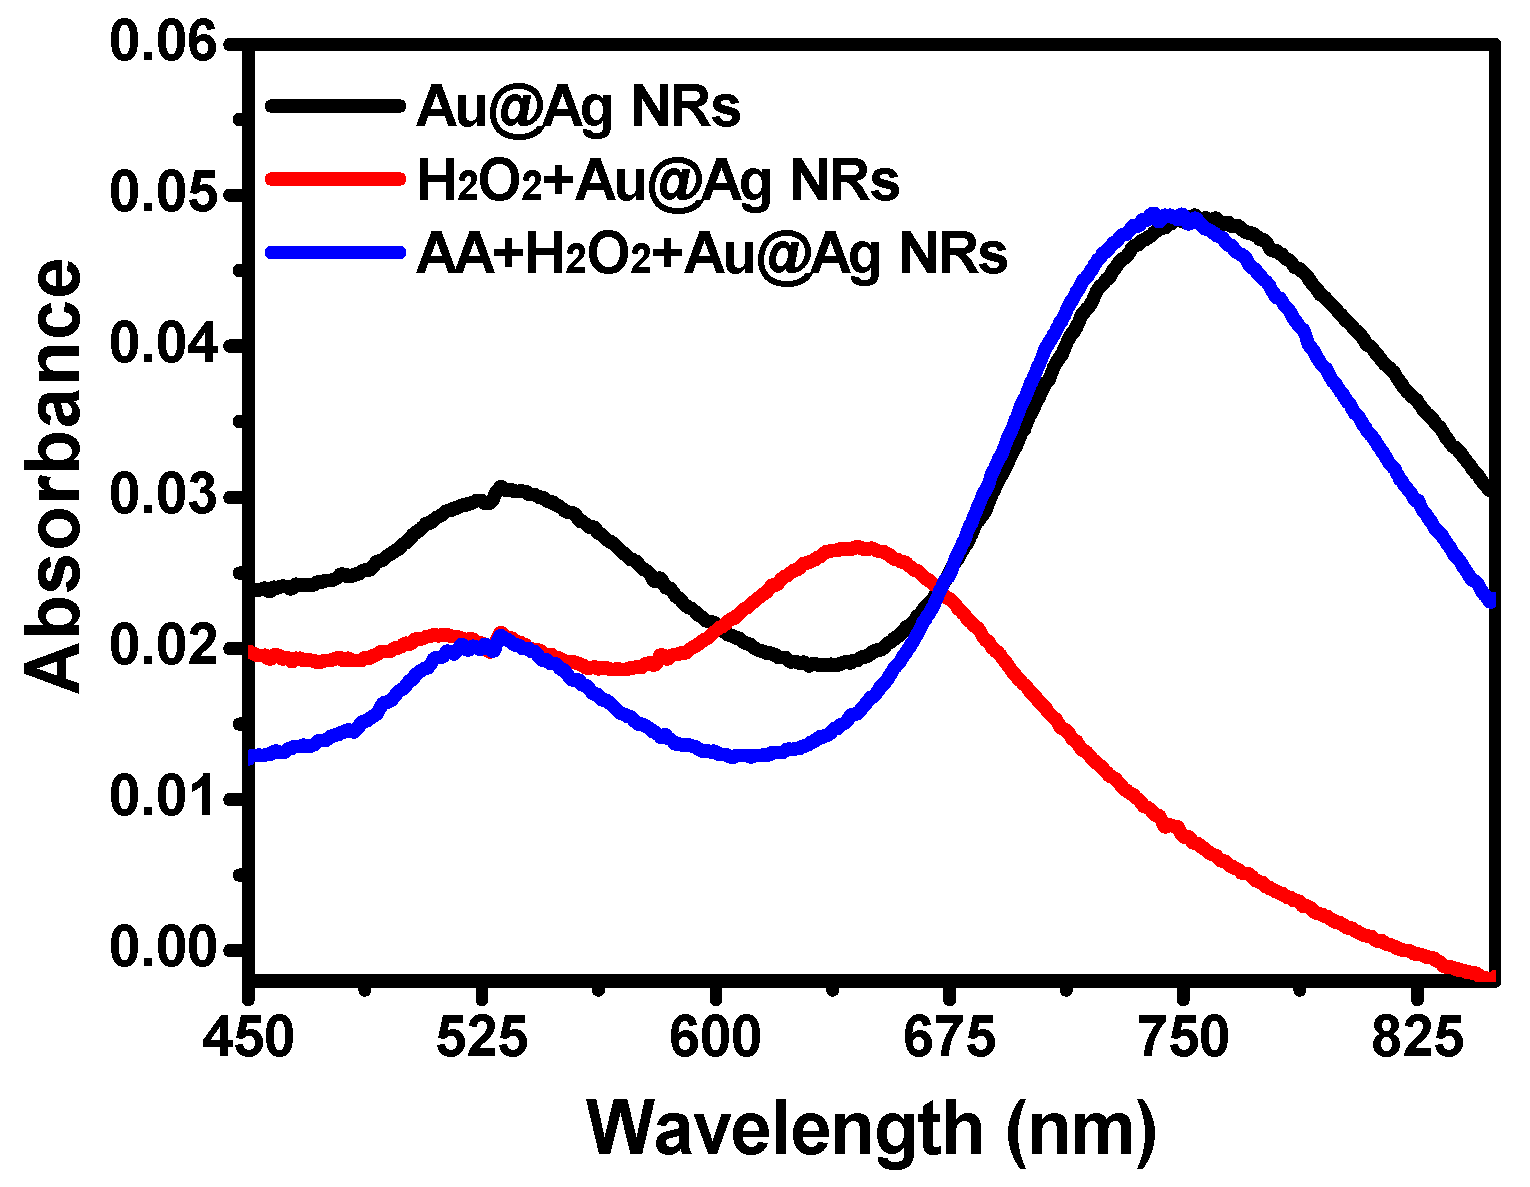
In brief, silver-coated gold nanorods presented characteristic absorption at 750 nm (Figure 1). However, the introduction of H2O2 led to a significant blue shift of λmax from 750 nm to 650 nm, while AA was capable of recovering the blue shift, indicating that the etching of silver-coated gold nanorods by H2O2 was inhibition by AA. Based on the shift of λmax, a highly sensitive and selective method of AA detection can be established.
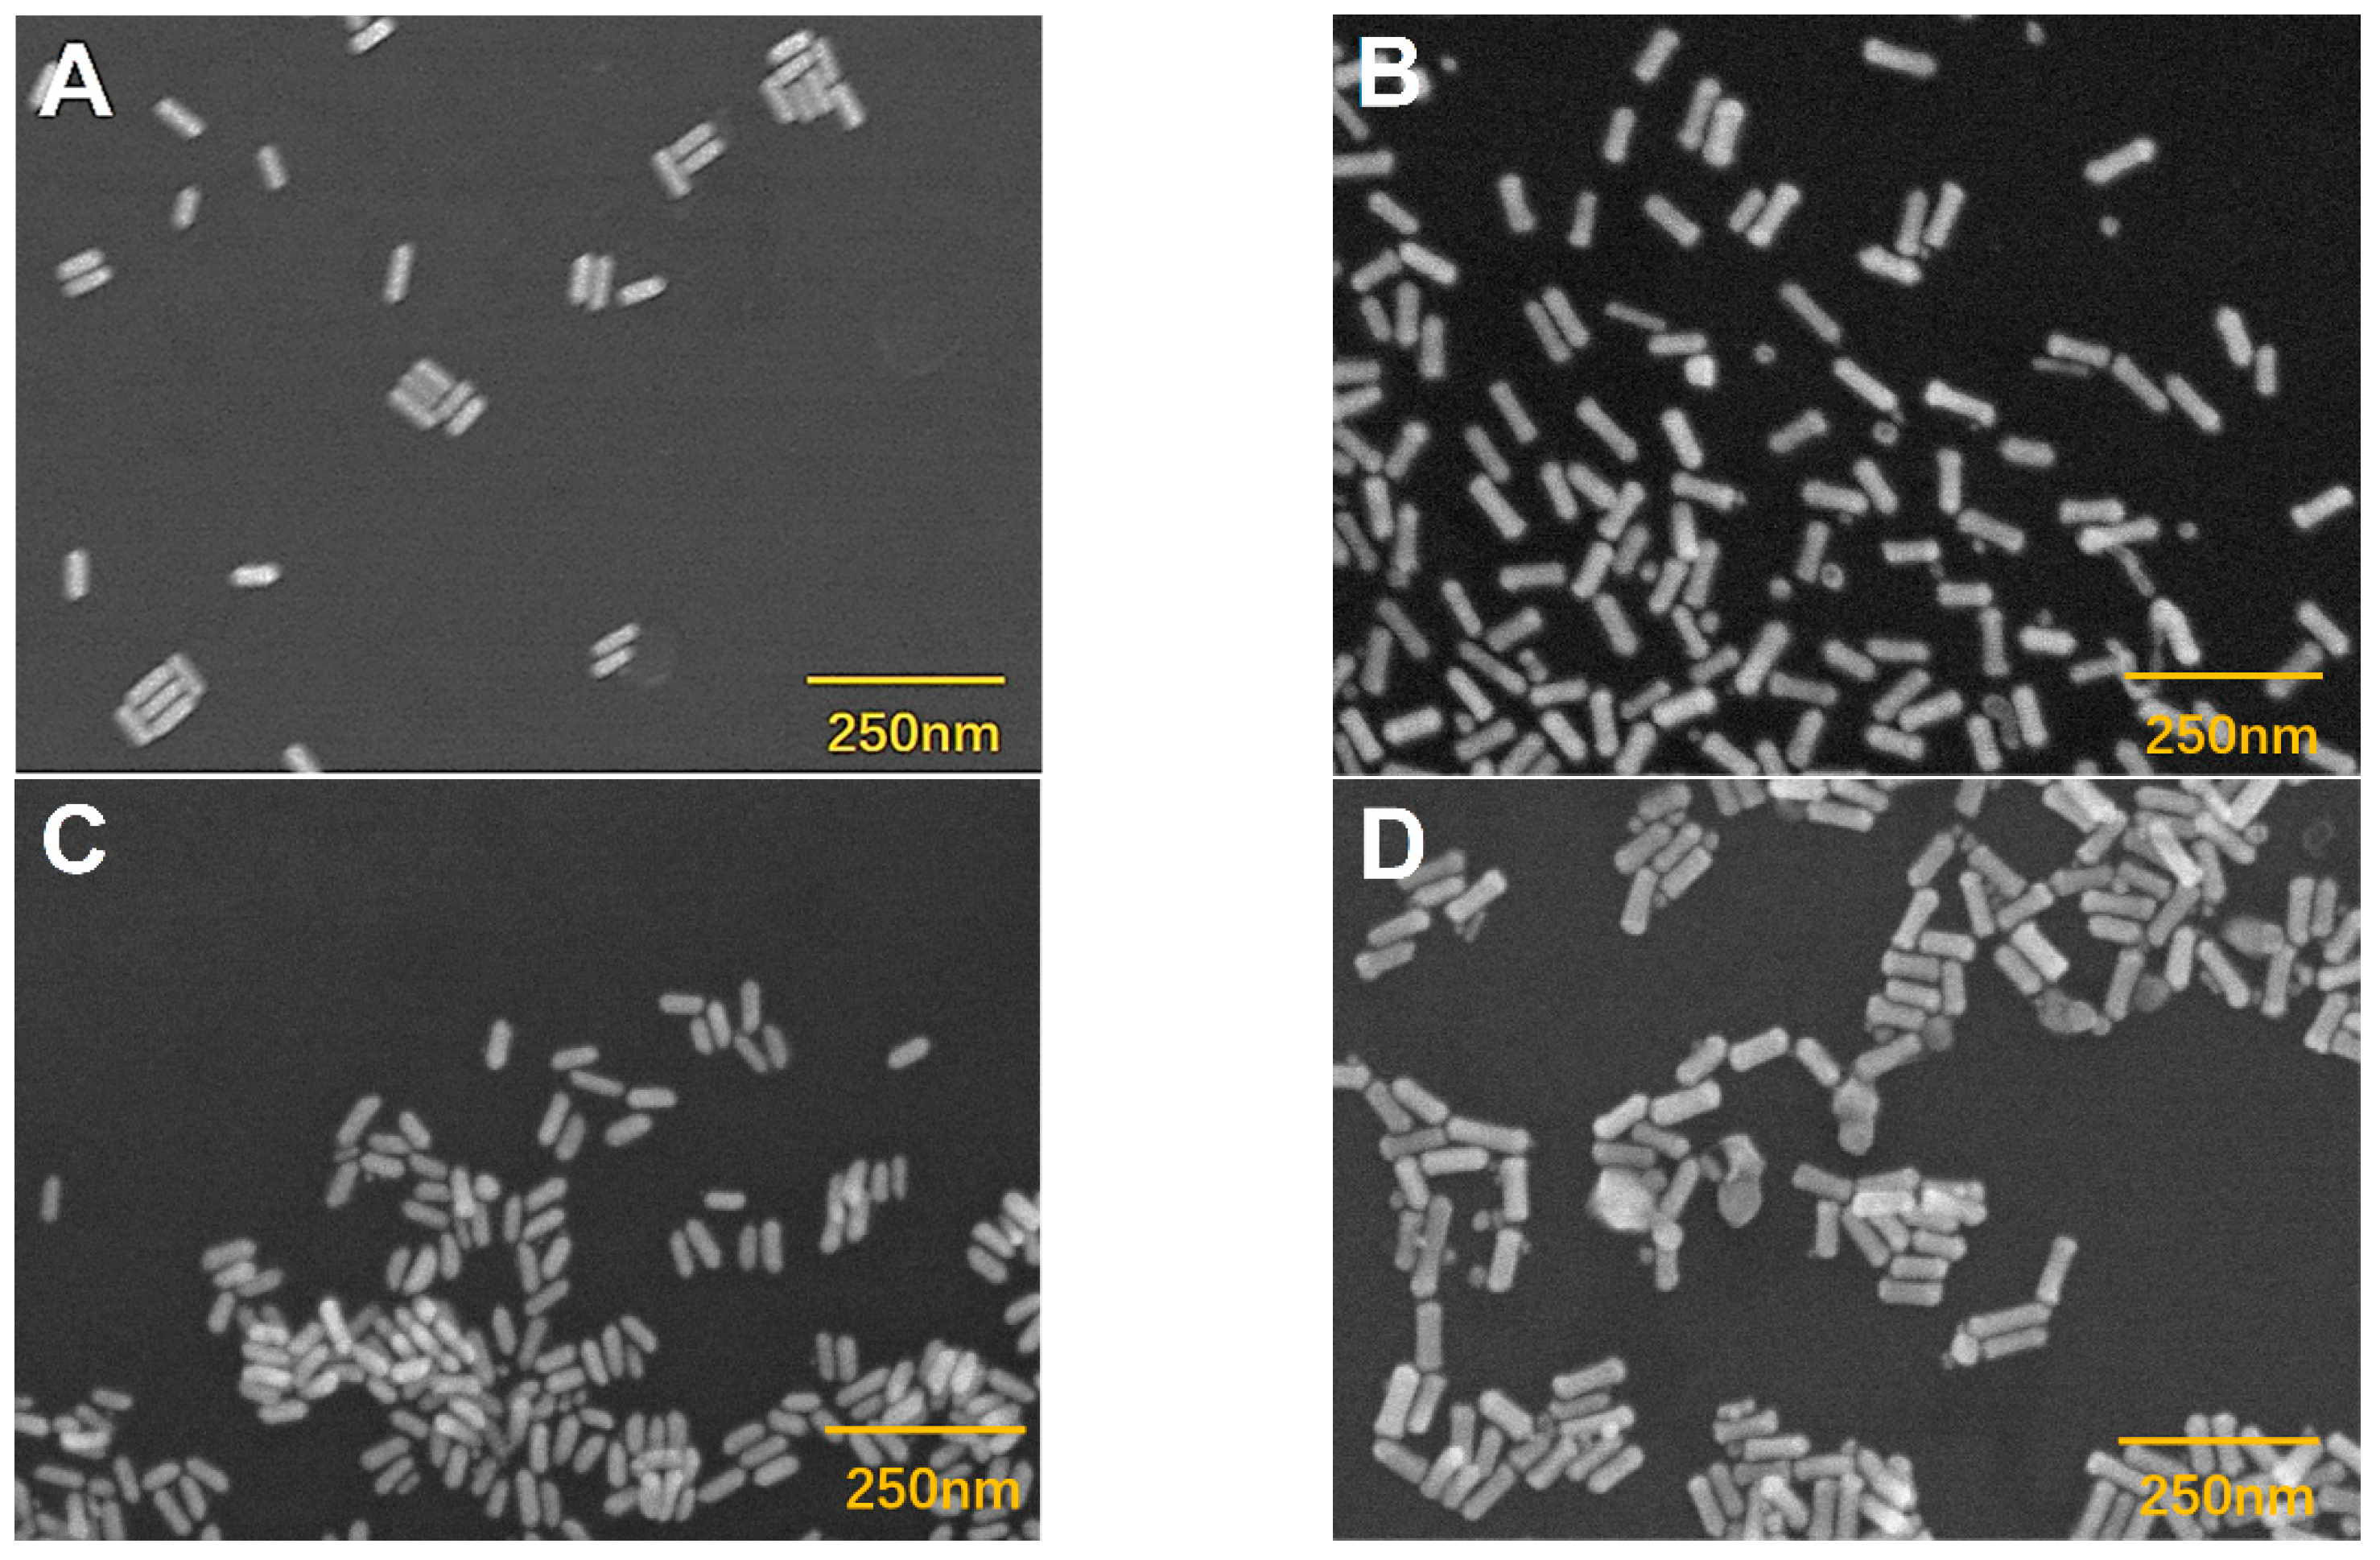
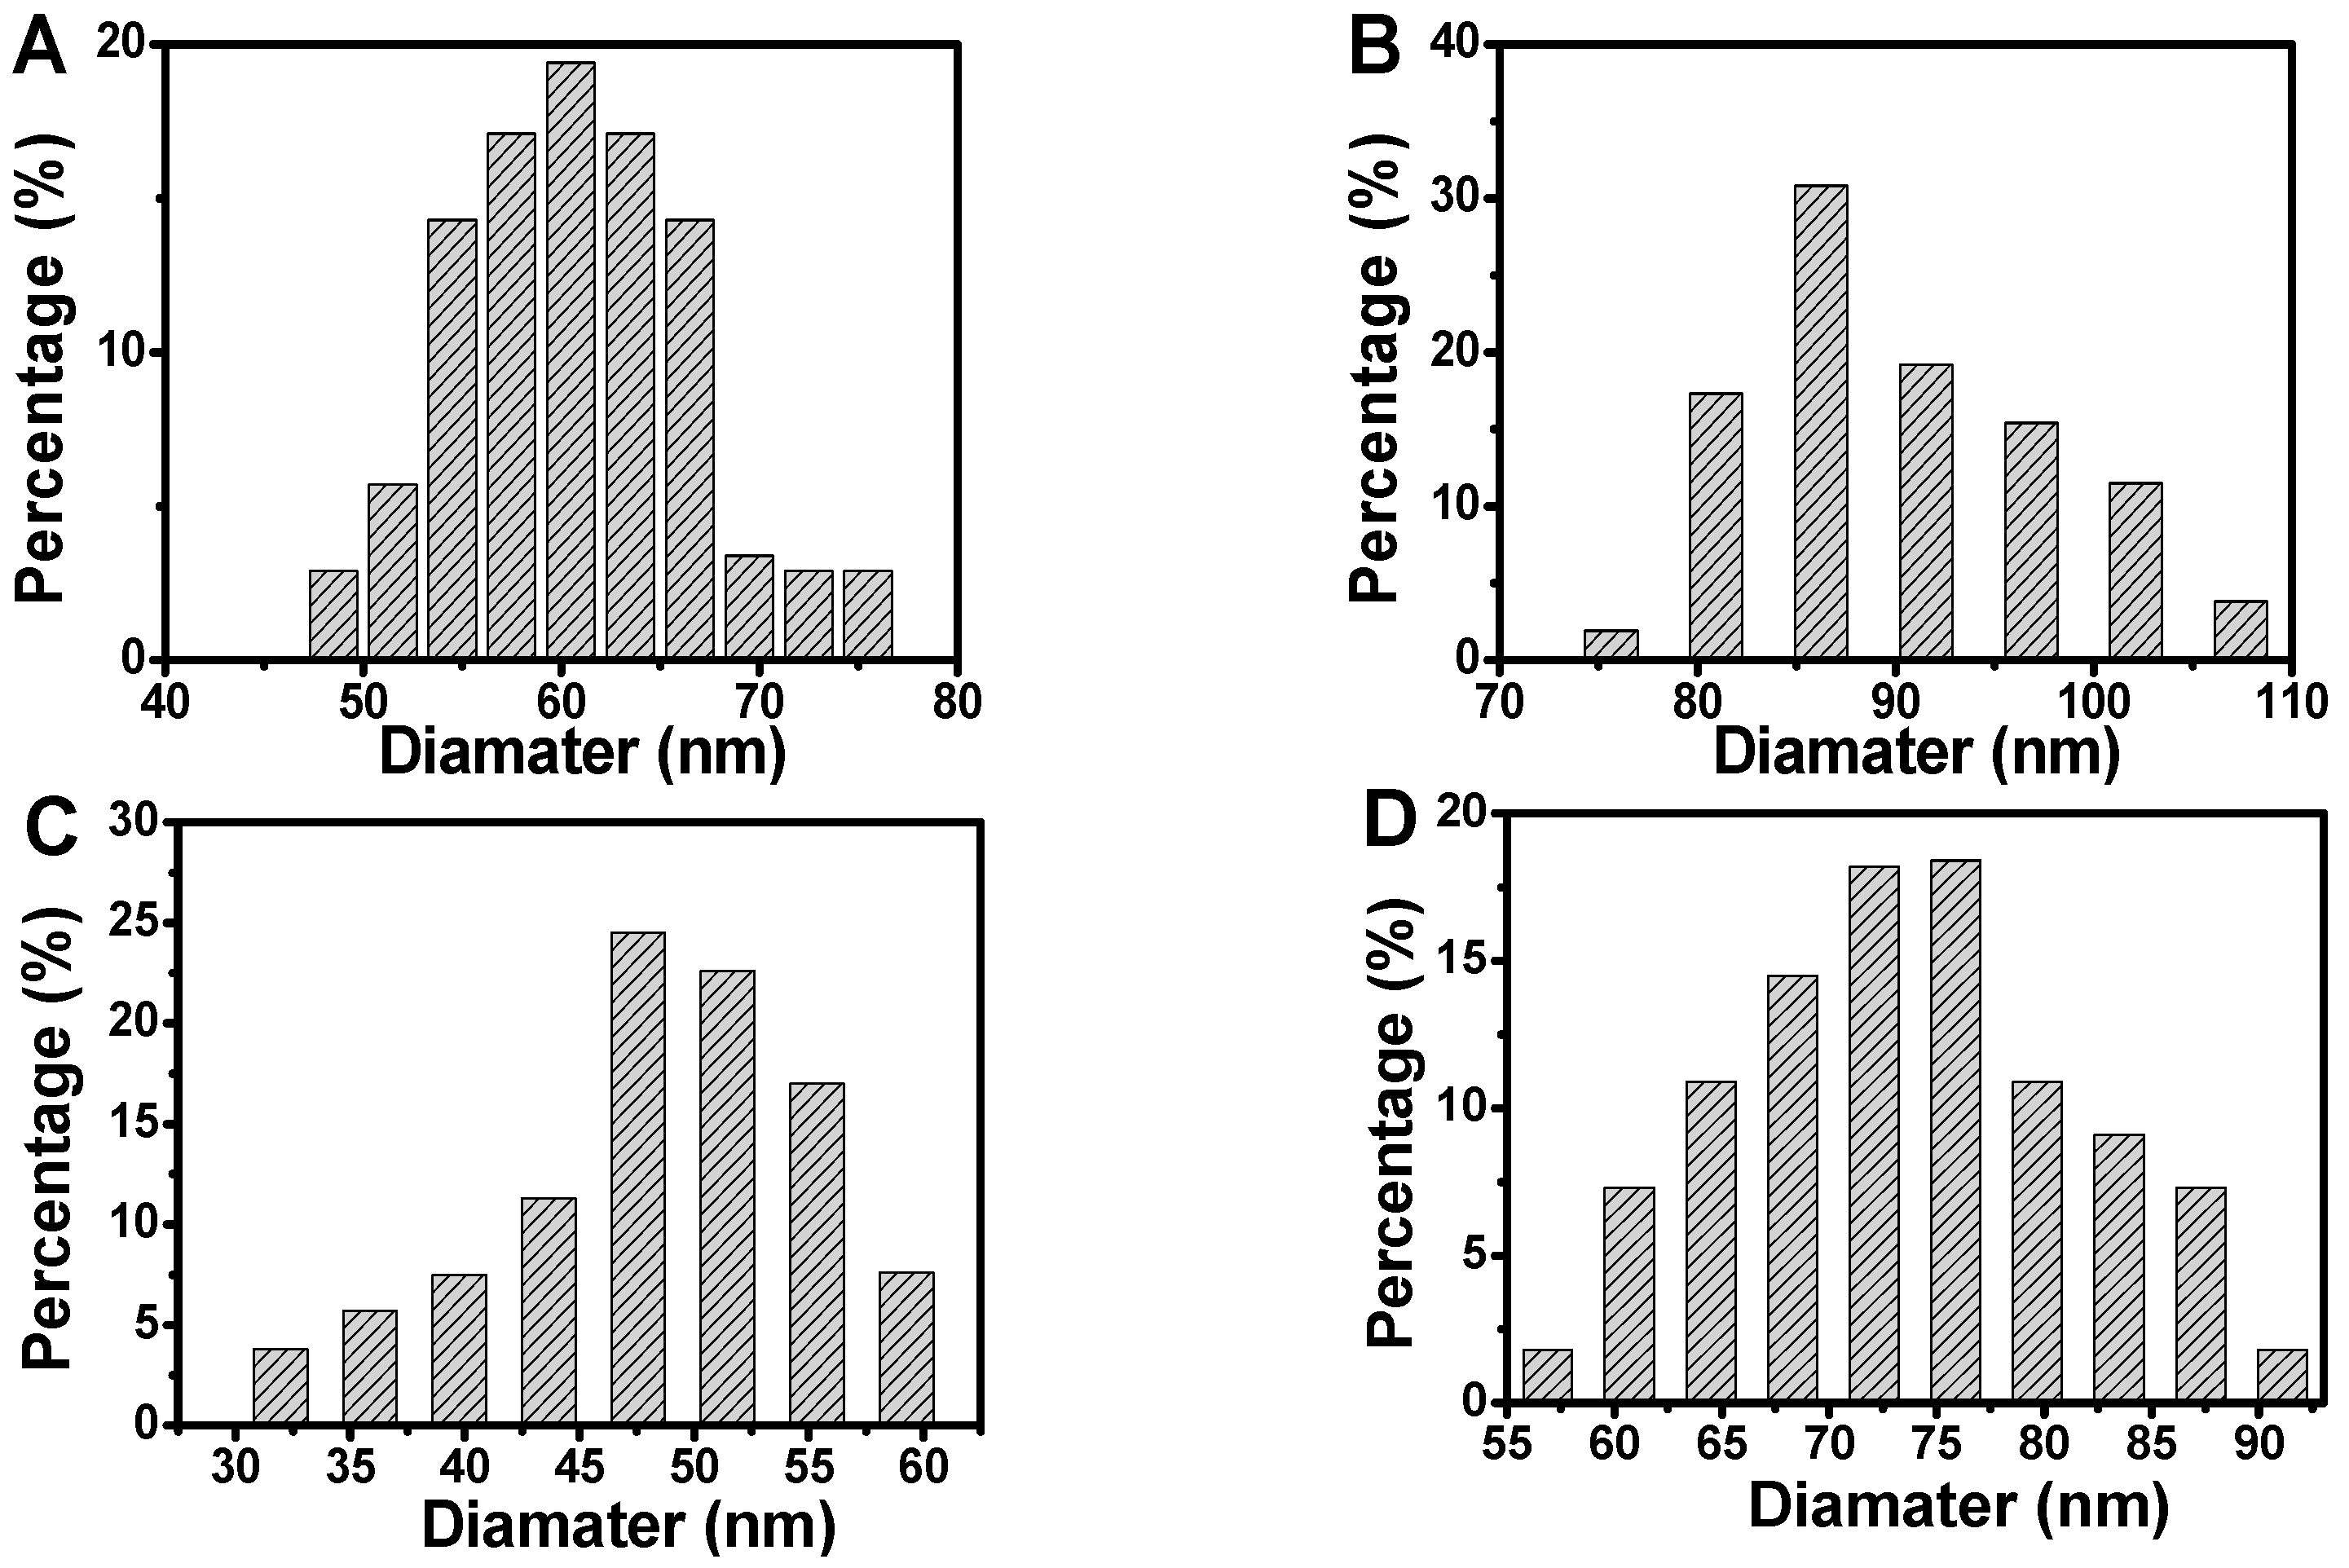
In addition, scanning electron microscopic images were used to confirm the etching of silver-coated gold nanorods (Figure 2 and Figure 3). The original gold nanorods were about 61 nm (Figure 2A and Figure 3A). However, the size of silver-coated gold nanorods was increased to about 90 nm in length, which were presented with a small number of silver nanoparticles (Figure 2B and Figure 3B). When etched with hydroxyl radicals (·OH) from the Fenton reaction between H2O2 and Fe2+, the size of the silver-coated gold nanorods was significantly decreased to about 49 nm (Figure 2C and Figure 3C), suggesting the effective etching of silver-coated gold nanorods by ·OH, which led to a remarkable blue shift of λmax. However, when the etching was suppressed by AA, the particle size of the silver-coated gold nanorods was restored (Figure 2D and Figure 3D), resulting in an obvious red-shift of λmax.
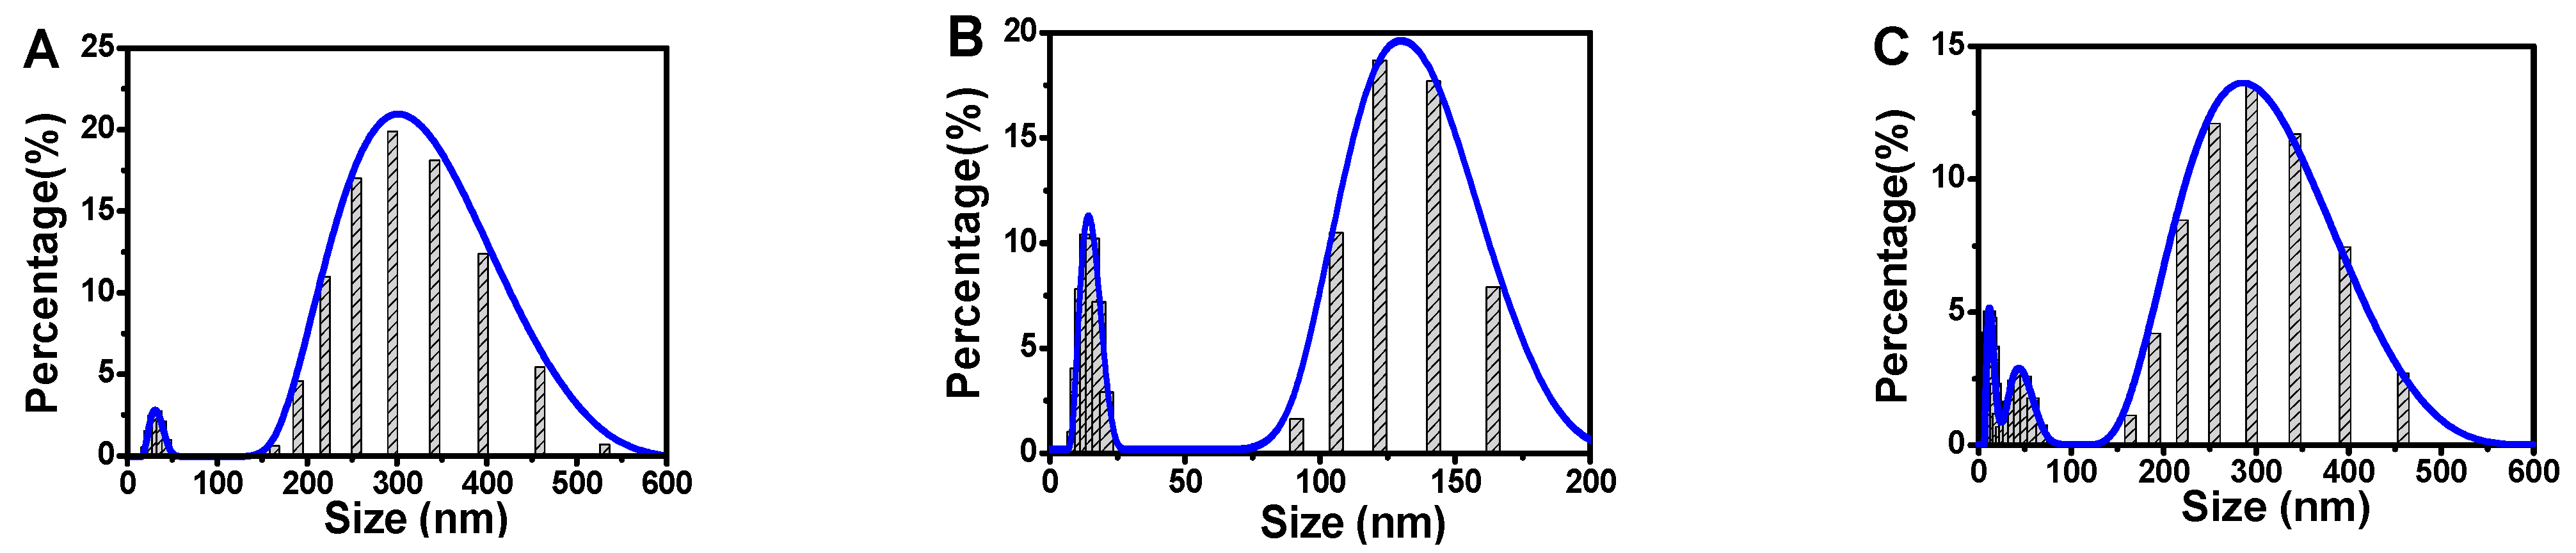
To further confirm the size change of silver-coated gold nanorods in the sensing process, the dynamic light scattering (DLS) particle size distribution was checked (Figure 4).The silver-coated gold nanorods were about 300 nm in length (Figure 4A), while the etched silver-coated gold nanorods were only about 125 nm (Figure 4B). For the same reasoning with SEM, the size of nanoparticles reverted to a similar size (about 300 nm) to the original silver-coated gold nanorods (Figure 4C), which proved the etching process. Herein, the DLS sizes were greater than the sizes obtained from SEM image because the size obtained from DLS was the hydrated particle size including molecules around particles.
3.2. Optimization of Reaction Conditions
3.2.1. Optimization of Silver-Coated Gold nanorod Concentration
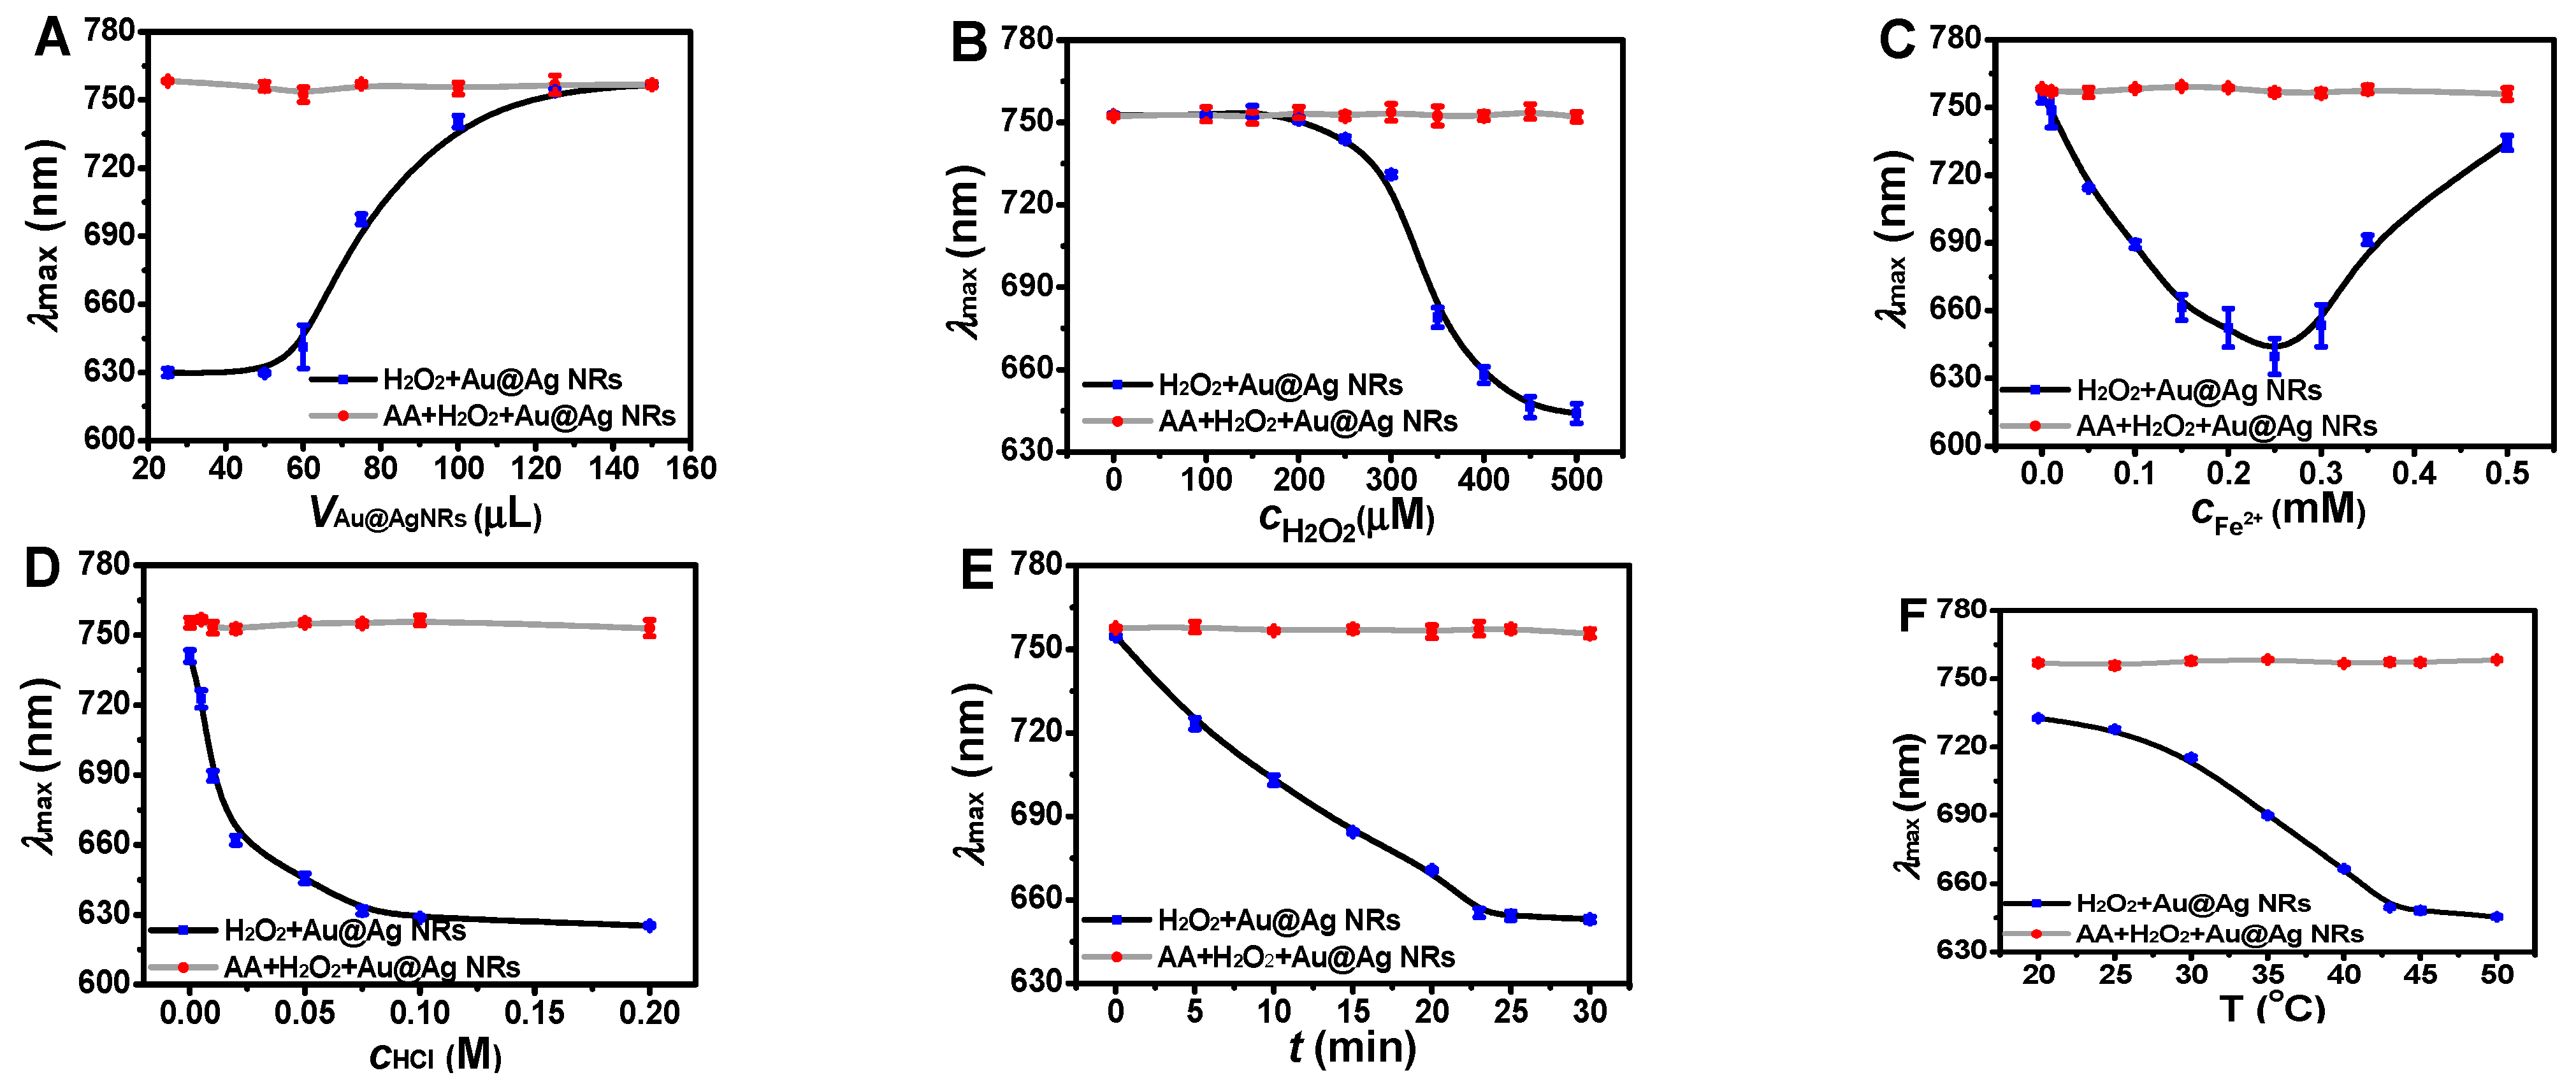
In this etching system, the higher concentration of silver-coated gold nanorods could lead to there being more nanoparticles in solution. In this case, it would be more difficult for them to be completely etched by ·OH. As shown in Figure 5A, when the volume of the silver-coated gold nanorod solution was decreased sequentially from 150 μL to 25 μL, the maximum absorption wavelength was gradually shifted to a shorter wavelength, suggesting the chemical etching of silver-coated gold nanorods. However, when the volume was decreased to less than 25 μL, the absorption spectrum was too weak to detect. To balance this issue, 50 μL of silver-coated gold nanorod solution was chosen to obtain an obvious absorption and a relatively complete etching. Furthermore, the introduction of AA could enable the full restoration of λmax.
3.2.2. Optimization of H2O2 Concentration
H2O2 concentration was optimized due to the fact that H2O2 was related to the production of ·OH [24,25] to etch silver-coated gold nanorods (Figure 5B). As the concentration of H2O2 was gradually increased, λmax was subsequently enhanced. When the concentration reached 400–500 μM, the maximum absorption wavelength tended to stable. Then, 450 μM H2O2 was chosen for further work.
3.2.3. Optimization of Fe2+ Concentration
Fe2+ is essential in the Fenton reaction [26], which is closely related to the etching of silver-coated gold nanorods. The maximum absorption was firstly shifted to a shorter wavelength and then to a longer wavelength as the Fe2+ concentration increased (Figure 5C), similarly to the previous report [26]. Additionally, when Fe2+ concentration was set at 0.25 mM, the maximum absorption wavelength change could be obtained, which was employed for further working conditions.
3.2.4. Optimization of Reaction Acidity
The etching effect of H2O2 on silver-coated gold nanorods is greatly affected by acidity, which is related with the hydrolysis of Fe2+ and the produced Fe3+ (Figure 5D), that is, if the concentration of HCl is too low, Fe2+ is easy to form Fe(OH)2, and Fe(OH)3 is unfavorable to yield ·OH to etch silver-coated gold nanorods. Furthermore, the Fe3+ produced by the Fenton reaction also has a synergistic oxidation ability, so it is important to control the appropriate acidity [27]. As the concentration of HCl was increased from 0 to 0.1 M, the maximum longitudinal absorption of the silver-coated gold nanorods was gradually shifted to a shorter wavelength, suggesting the effective etching of silver-coated gold nanorods. When HCl concentration was higher than 0.1 M, the maximum longitudinal absorption wavelength was kept stable. Thus, the concentration of HCl was set at 0.1 M.
3.2.5. Reaction Time Optimization
The chemical etching of silver-coated gold nanorods was highly dependent on the reaction time (Figure 5E), and the etching degree became greater with the prolonging of reaction time [28], which reached the stable state within 25 min. This result was similar to the time-dependent absorption scanning of silver-coated gold nanorods at three-minute intervals (Figure S1). Then, the etching reaction was performed for 25 min at 45 °C to obtain the effective wavelength shift.
3.2.6. Reaction Temperature Optimization
The etching of silver-coated gold nanorods by ·OH is susceptible to temperature. On the one hand, the elevated temperatures enhanced the formation of radical ·OH [29]; on the other hand, H2O2 is easy to decompose at a higher temperature [30]. As the reaction temperature increased, the blue shift of the longitudinal absorption wavelength was enhanced, which reached the stable state at 45 °C (Figure 5F). Therefore, 45 °C was chosen as the optimal reaction temperature.
3.3. The Sensitivity towards Ascorbic Acid Detection
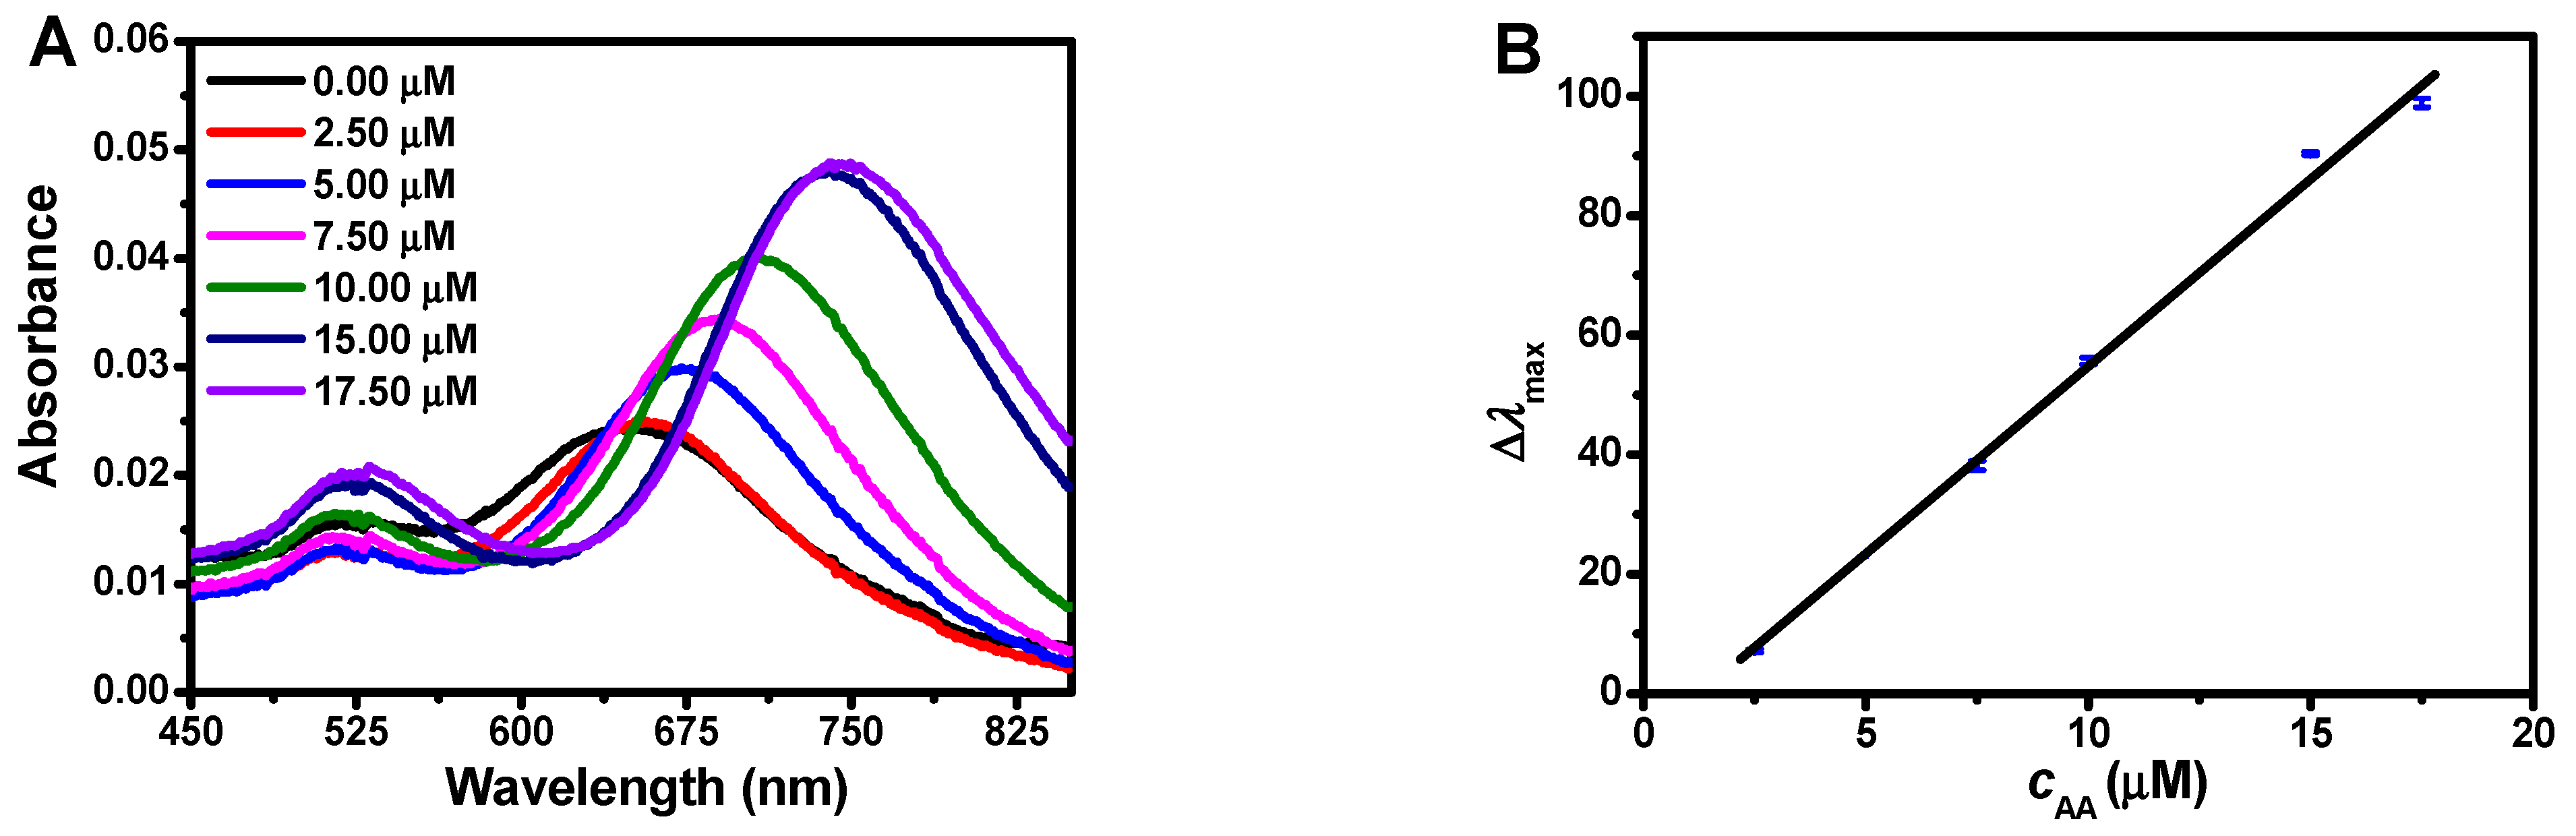
Under the optimal conditions, the ·OH radical could etch silver-coated gold nanorods, leading to a remarkable blue shift of λmax. However, as a scavenger, AA could remove the ·OH radical, resulting in an obvious restoration of λmax. With the increasing concentration of AA, the change of λmax (Δλmax) turned greater. Based on Δλmax, the sensitive detection of AA could be developed, which could be expressed as Δλmax= −9.957 + 6.592c (c, μM) in the range of 2.5–17.5 μM with the correlation coefficient of R2 = 0.9947 (Figure 6).
In addition, to obtain the detection limits of this proposed assay, eleven sets of blank groups were determined (Table S1). According to the formula, the limit of detection (OD) was 0.48 μM (3σ/k) and the limit of quality (LOQ) was 1.61 μM (10σ/k), where σ was the relative standard deviation of the signal measured in 11 sets of blank group and k was the slope of the standard curve. Compared with other detection methods [31,32,33,34], the LOD and LOQ of the proposed method reached a considerably sensitive level.
3.4. The Specificity of the Proposed Method
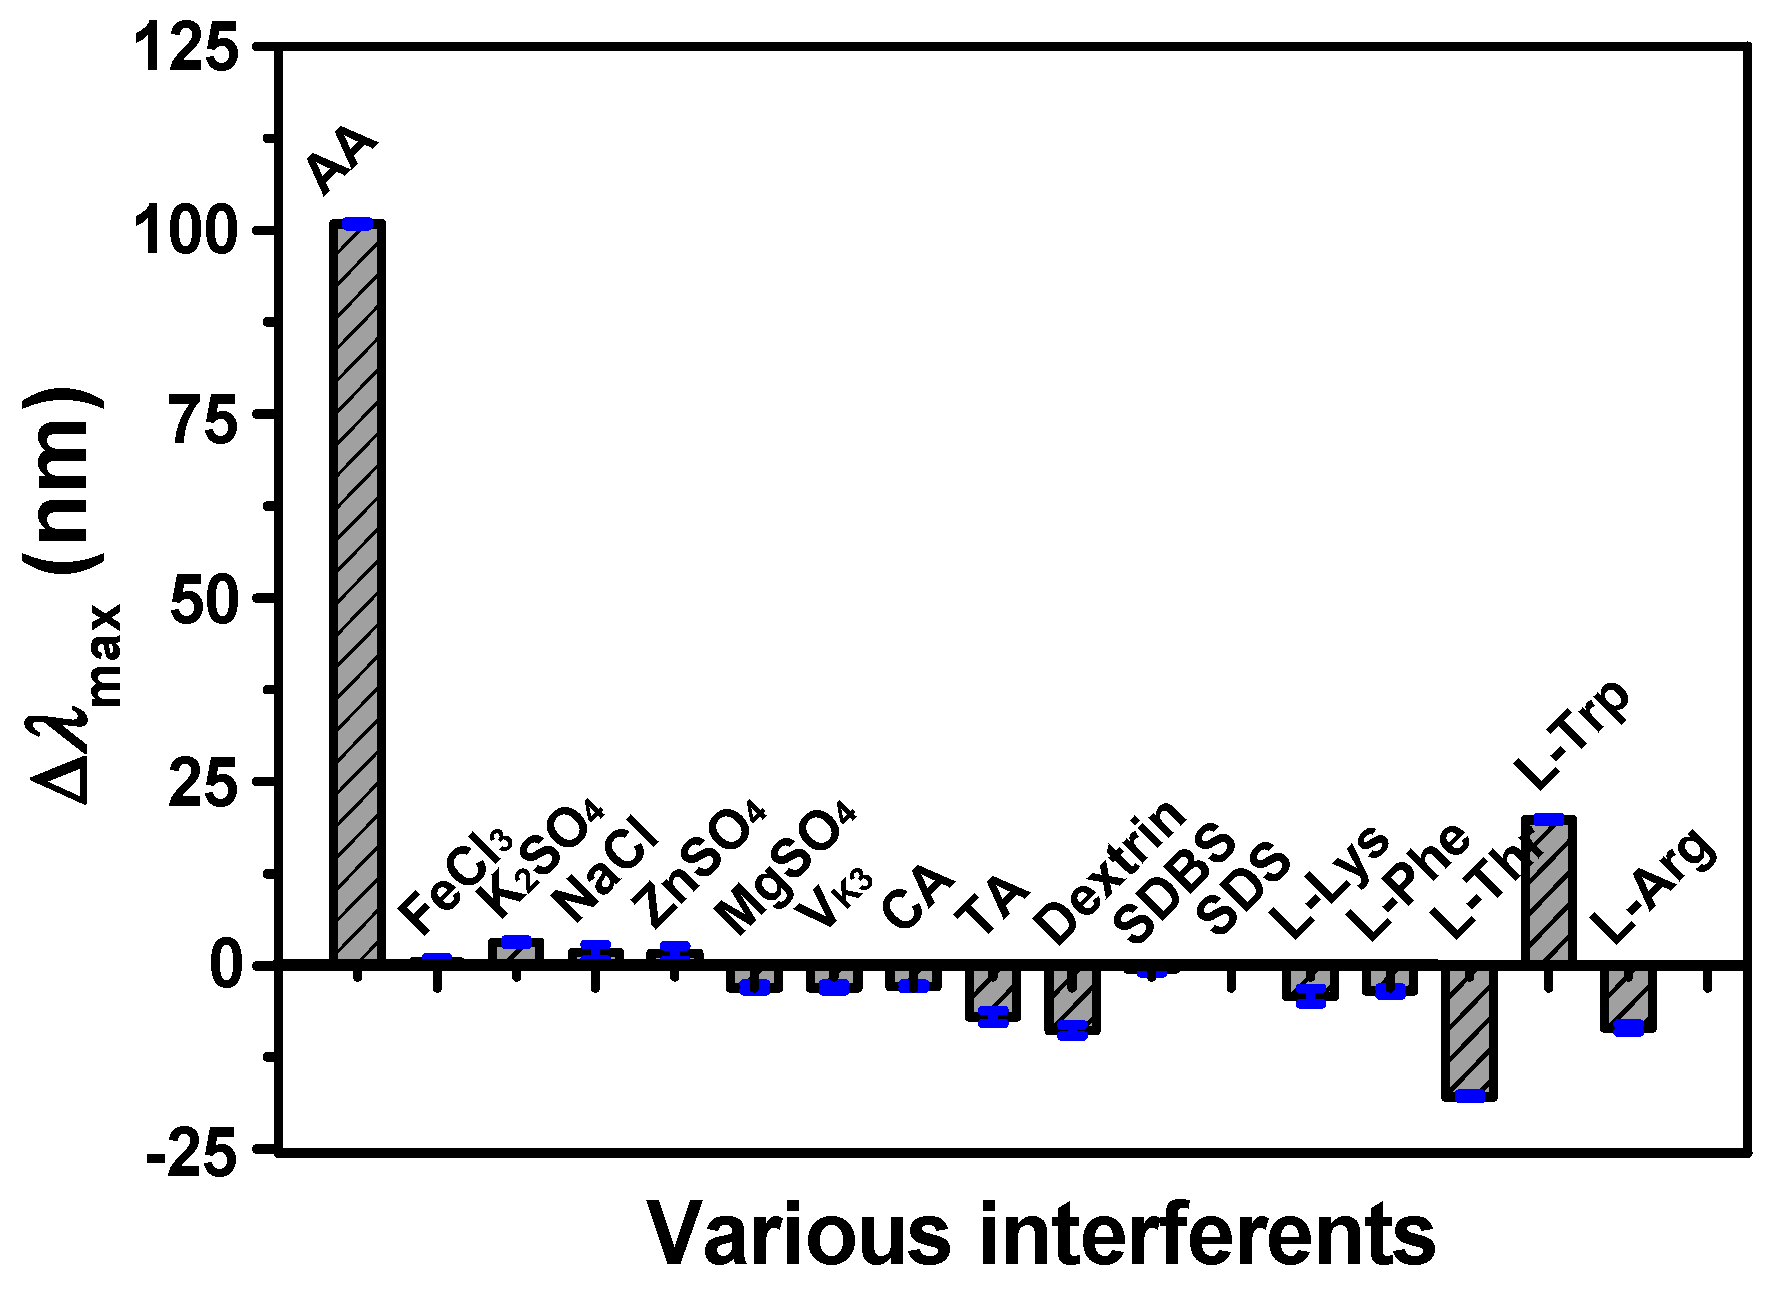
The specificity is an important issue to evaluate the proposed method, which was tested under optimal conditions. Some reactive species such as biomolecules and electrolytes were taken into consideration to examine the specificity of the proposed method of AA detection. The Δλmax responses of different interfering species to silver-coated gold nanorods were assessed, including L-Arg, L-Lys, L-Trp, L-Phe, L-Thr, NaCl, MgSO4, ZnSO4, K2SO4, and so on (Figure 7). Compared with other interfering species, the response of AA was more remarkable even though the concentrations of other interfering species were five times higher than AA, suggesting that silver-coated gold nanorods were highly selective toward AA due to the strong reluctivity of AA to eliminate the OH radical.
3.5. The Practicability of the Proposed Method in Detection of Ascorbic Acid in Tablets
In order to ensure the universality of the proposed method, commercially available Vc tablets from three companies were functionalized as real samples, which were detected by pharmacopoeia prescribed iodoemetry (Table S2) and the proposed method (Table S3), respectively, supplying the consistent results with the labeled content. That is, all of them were highly accurate.
4. Conclusions
In summary, silver-coated gold nanorods were acted as an optical probe to develop the highly sensitive and selective detection of AA in tablets based on the chemical etching by ·OH produced by the Fenton reaction between H2O2 and Fe2+, leading to a lower aspect ratio and a blue shift of λmax. However, as a free radical scavenger, AA was capable of removing ·OH to inhibit the chemical etching of silver-coated gold nanorods, resulting in a higher aspect ratio and a red shift of λmax. This proposed assay offered a simple platform for AA analysis, which was capable of detecting AA in tablets and offered similar results to the iodometry and labeled content, suggesting high accuracy. Furthermore, when silver-coated gold nanorods acted as probes to detect AA, their high stability and easy preparation enabled good performance, including a wide detection range and high sensitivity. Compared with traditional chemical methods, this proposed method supplied high accuracy, which is coincident with the standard pharmacopoeia method. It is expected that the bimetallic silver-coated gold nanorod probe is convenient to adjust the optical characteristic and can find wider applications in the field of biosensing or bioimaging.
Supplementary Materials
The following supporting information can be downloaded at https://0-www-mdpi-com.brum.beds.ac.uk/article/10.3390/chemosensors10120543/s1, Figure S1 Time-dependent etching; Table S1. 11 sets λmax of blank samples; Table S2. Real sample test results detected by iodometry; and Table S3. Real sample test results detected by the proposed method.
Author Contributions
Conceptualization, S.W.; data curation, S.W.; formal analysis, R.C.; funding acquisition, J.W.; investigation, S.W.; methodology, S.W. and M.H.; project administration, J.G. and J.W.; software, R.C.; supervision, J.W.; validation, S.W. and J.G.; visualization, S.W. and R.C.; writing—original draft, S.W.; and writing—review and editing, J.G and J.W. All authors have read and agreed to the published version of the manuscript..
Funding
We appreciate the financial support from the National Natural Science Foundation of China (No. 2217040113), the Natural Science Foundation of Chongqing (cstc2019jcyj-msxmX0279), and the Graduate Education and Teaching Reform Research Project of Chongqing (No. yjg223038).
Institutional Review Board Statement
Not applicable.
Informed Consent Statement
Not applicable.
Data Availability Statement
Not applicable.
Acknowledgments
The authors would like to thank the Ministry of Education Key Laboratory of Luminescence Analysis and Molecular Sensing (Southwest University) for supporting this research.
Conflicts of Interest
The authors declare no conflict of interest.
References
- Kathiravan, S.; Sundaram, E.; Paulraj, B.A.; Johnson, P.M.; Huang, S.T.; Mani, V.; Vasantha, V.S. Simple and Selective Optical Biosensor Using Ultrasonicator Synthesis of 5-((Anthracen-9-Ylmethylene) Amino)-2,3-Dihydrophthalazine-1,4-Dione for Direct Detection of Ascorbic Acid in Vegetables and Fruits. Food Chem. 2020, 332, 127150. [Google Scholar] [CrossRef] [PubMed]
- Njus, D.; Kelley, P.M.; Tu, Y.J.; Schlegel, H.B. Ascorbic Acid: The Chemistry Underlying Its Antioxidant Properties. Free Radical Biol. Med. 2020, 159, 37–43. [Google Scholar] [CrossRef] [PubMed]
- Kamoto, R.J.; Kasapila, W.; Ng’ong’ola-Manani, T.A. Use of Fungal Alpha Amylase and Ascorbic Acid in the Optimisation of Grain Amaranth-Wheat Flour Blended Bread. Food Nutr. Res. 2018, 62, 1341. [Google Scholar] [CrossRef] [PubMed] [Green Version]
- Verdini, R.A.; Lagier, C.M. Voltammetric Iodometric Titration of Ascorbic Acid with Dead-Stop End-Point Detection in Fresh Vegetables and Fruit Samples. J. Agric. Food Chem. 2000, 48, 2812–2817. [Google Scholar] [CrossRef] [PubMed]
- Zhu, L.N.; Cheng, R.; Kang, K.W.; Chen, M.Y.; Zhan, T.; Wang, J. Size-Dependent Light Scattering of Coooh Nanoflakes for Convenient and Sensitive Detection of Alkaline Phosphatase in Human Serum. Luminescence 2021, 36, 1317–1326. [Google Scholar] [CrossRef]
- Liu, C.; Pang, Q.W.; Wu, T.; Qi, W.J.; Fu, W.S.; Wang, Y. A Rapid Visual Detection of Ascorbic Acid through Morphology Transformation of Silver Triangular Nanoplates. J. Anal. Test. 2021, 5, 210–216. [Google Scholar] [CrossRef]
- Chen, C.X.; Zhang, C.H.; Ni, P.J.; Jiang, Y.Y.; Wang, B.; Lu, Y.Z. “Light-on” Colorimetric Assay for Ascorbic Acid Detection Via Boosting the Peroxidase-Like Activity of Fe-MIL-88. J. Anal. Test. 2022, 6, 67–75. [Google Scholar] [CrossRef]
- Tian, Y.L.; Ji, Y.Y.; Zou, X.; Chen, Q.M.; Zhang, S.L.; Gong, Z.J. N, P Co-Doped Carbon Dots as Multifunctional Fluorescence Nano-Sensor for Sensitive and Selective Detection of Cr(VI) and Ascorbic Acid. J. Anal. Test. 2022, 6, 335–345. [Google Scholar] [CrossRef]
- Zhao, Z.Z.; Han, D.F.; Xiao, R.; Wang, T.Q.; Liang, Z.S.; Wu, Z.F.; Han, F.J.; Han, D.X.; Ma, Y.M.; Niu, L. An Enzyme-Free Photoelectrochemical Sensor Platform for Ascorbic Acid Detection in Human Urine. Chemosensors 2022, 10, 247. [Google Scholar] [CrossRef]
- Tortolini, C.; Tasca, F.; Venneri, M.A.; Marchese, C.; Antiochia, R. Gold Nanoparticles/Carbon Nanotubes and Gold Nanoporous as Novel Electrochemical Platforms for L-Ascorbic Acid Detection: Comparative Performance and Application. Chemosensors 2021, 9, 229. [Google Scholar] [CrossRef]
- Chen, H.J.; Wang, Q.; Shen, Q.P.; Liu, X.; Li, W.; Nie, Z.; Yao, S.Z. Nitrogen Doped Graphene Quantum Dots Based Long-Persistent Chemiluminescence System for Ascorbic Acid Imaging. Biosens. Bioelectron. 2017, 91, 878–884. [Google Scholar] [CrossRef] [PubMed]
- Samper, I.C.; Mcmahon, C.J.; Schenkel, M.S.; Clark, K.M.; Khamcharoen, W.; Anderson, L.; Terry, J.S.; Gallichotte, E.N.; Ebel, G.D.; Geiss, B.J. Electrochemical Immunoassay for the Detection of SARS-CoV-2 Nucleocapsid Protein in Nasopharyngeal Samples. Anal. Chem. 2022, 94, 15155–15161. [Google Scholar] [CrossRef] [PubMed]
- He, Z.; Zhang, L.; Peng, G.; Wang, G.; Liang, X. Chemical Redox-Modulated Etching of Plasmonic Nanoparticles for Nitrite Detection: Comparison among Gold Nanosphere, Nanorod, and Nanotriangle. J. Anal. Test. 2021, 5, 350–359. [Google Scholar] [CrossRef]
- Liu, J.J.; Yan, H.H.; Zhang, Q.; Gao, P.F.; Li, C.M.; Liang, G.L.; Huang, C.Z.; Wang, J. High-Resolution Vertical Polarization Excited Dark-Field Microscopic Imaging of Anisotropic Gold Nanorods for the Sensitive Detection and Spatial Imaging of Intracellular MicroRNA-21. Anal. Chem. 2020, 92, 13118–13125. [Google Scholar] [CrossRef] [PubMed]
- Zhang, H.Z.; Li, R.; Gao, P.F.; Wang, N.; Lei, G.; Huang, C.Z.; Wang, J. Real-Time Dark-Field Light Scattering Imaging to Monitor the Coupling Reaction with Gold Nanorods as Optical Probe. Nanoscale 2017, 9, 3568–3575. [Google Scholar] [CrossRef]
- Gao, Z.; Deng, K.; Wang, X.D.; Miro, M.; Tang, D. High-Resolution Colorimetric Assay for Rapid Visual Readout of Phosphatase Activity Based on Gold/Silver Core/Shell Nanorod. ACS Appl. Mater. Interfaces 2014, 6, 18243–18250. [Google Scholar] [CrossRef]
- Shankar, S.S.; Rai, A.; Ahmad, A.; Sastry, M. Rapid Synthesis of Au, Ag, and Bimetallic Au Core-Ag Shell Nanoparticles Using Neem (Azadirachta Indica) Leaf Broth. J. Colloid Interface Sci. 2004, 275, 496–502. [Google Scholar] [CrossRef]
- Gu, Y.; Song, J.; Li, M.-X.; Zhang, T.-T.; Zhao, W.; Xu, J.-J.; Liu, M.; Chen, H.-Y. Ultrasensitive MicroRNA Assay via Surface Plasmon Resonance Responses of Au@Ag Nanorods Etching. Anal. Chem. 2017, 89, 10585–10591. [Google Scholar] [CrossRef]
- Cai, Z.X.; Chen, Y.Z.; Meteku, B.E.; Zheng, Q.W.; Li, F.M.; Zhang, M.S.; Zeng, J.B.; Chen, X. Cu2+-Assisted Synthesis of Au@Agl Core/Shell Nanorods via In Situ Oxidation of Iodide: A Strategy for Colorimetric Iodide Sensing. J. Anal. Test. 2022, 2022, 6, 374–381. [Google Scholar]
- Zhao, Y.; Gao, X.-Y.; Wang, H.; Wang, J.; Zhou, J.; Zhao, W.; Xu, J.-J.; Chen, H.-Y. Ultrasensitive Detection of MicroRNA via a Au@Ag Nanosnowman. Anal. Chem. 2019, 91, 15988–15992. [Google Scholar] [CrossRef]
- Cheng, R.; Zhu, F.; Huang, M.; Zhang, Q.; Yan, H.H.; Zhao, X.H.; Luo, F.K.; Li, C.M.; Liu, H.; Liang, G.L.; et al. “Hepatitis Virus Indicator”--The Simultaneous Detection of Hepatitis B and Hepatitis C Viruses Based on the Automatic Particle Enumeration. Biosens. Bioelectron. 2022, 202, 114001. [Google Scholar] [CrossRef] [PubMed]
- Gole, A.; Murphy, C.J. Seed-Mediated Synthesis of Gold Nanorods: Role of the Size and Nature of the Seed. Chem. Mater. 2004, 16, 3633–3640. [Google Scholar] [CrossRef]
- Zhang, Q.; Yan, H.H.; Ru, C.; Zhu, F.; Zou, H.Y.; Gao, P.F.; Huang, C.Z.; Wang, J. Plasmonic Biosensor for the Highly Sensitive Detection of MicroRNA-21 Via the Chemical Etching of Gold Nanorods under a Dark-Field Microscope. Biosens. Bioelectron. 2022, 201, 113942. [Google Scholar] [CrossRef] [PubMed]
- Liu, X.; Zhang, S.; Tan, P.; Zhou, J.; Huang, Y.; Nie, Z.; Yao, S. A Plasmonic Blood Glucose Monitor Based on Enzymatic Etching of Gold Nanorods. Chem. Commun. 2013, 49, 1856–1858. [Google Scholar] [CrossRef] [PubMed]
- Zeng, R.; Gong, H.; Li, Y.; Li, Y.; Lin, W.; Tang, D.; Knopp, D. CRISPR-Cas12a-Derived Photoelectrochemical Biosensor for Point-Of-Care Diagnosis of Nucleic Acid. Anal. Chem. 2022, 94, 7442–7448. [Google Scholar] [CrossRef] [PubMed]
- Wang, H.; Zhou, T.; Li, W.; Wang, Z.; Liu, Y.; Wang, F.; Wang, X.; Zhang, G.; Zhang, Z. Homocytosine-Templated Gold Nanoclusters as a Label-Free Fluorescent Probe: Ferrous Ions and Glucose Detection Based on Fenton and Enzyme-Fenton Reaction. Colloids Surface A 2021, 628, 127229. [Google Scholar] [CrossRef]
- Lai, W.; Wei, Q.; Zhuang, J.; Lu, M.; Tang, D. Fenton Reaction-Based Colorimetric Immunoassay for Sensitive Detection of Brevetoxin B. Biosens. Bioelectron. 2016, 80, 249–256. [Google Scholar] [CrossRef] [Green Version]
- Liu, J.J.; Yan, H.H.; Yuan, D.; Zhang, Q.; Li, C.M.; Huang, C.Z.; Wang, J. The Synergistic Effect Enhanced Chemical Etching of Gold Nanorods for the Rapid and Sensitive Detection of Biomarks. Talanta 2020, 219, 121203. [Google Scholar] [CrossRef]
- Lee, C.; Yoon, J. Temperature Dependence of Hydroxyl Radical Formation in the hv/Fe3+/H2O2 and Fe3+/H2O2 Systems. Chemosphere 2004, 56, 923–934. [Google Scholar] [CrossRef]
- Mao, Z.Y.; Zhu, L.N.; Gao, J.; Liu, J.J.; Wei, Y.H.; Li, X.Y.; Yin, B.C.; Wang, J. A Coooh Nanoflake-Based Light Scattering Probe for the Simple and Selective Detection of Uric Acid in Human Serum. Anal. Methods 2018, 10, 4951–4957. [Google Scholar] [CrossRef]
- Chandra, S.; Singh, V.K.; Yadav, P.K.; Bano, D.; Kumar, V.; Pandey, V.K.; Talat, M.; Hasan, S.H. Mustard Seeds Derived Fluorescent Carbon Quantum Dots and Their Peroxidase-Like Activity for Colorimetric Detection of H2O2 and Ascorbic Acid in a Real Sample. Anal. Chim. Acta 2019, 1054, 145–156. [Google Scholar] [CrossRef] [PubMed]
- Luo, X.; Zhang, W.; Han, Y.; Chen, X.; Zhu, L.; Tang, W.; Wang, J.; Yue, T.; Li, Z. N,S Co-Doped Carbon Dots Based Fluorescent “On-Off-On” Sensor for Determination of Ascorbic Acid in Common Fruits. Food Chem. 2018, 258, 214–221. [Google Scholar] [CrossRef] [PubMed]
- Hu, L.; Deng, L.; Alsaiari, S.; Zhang, D.; Khashab, N.M. “Light-on” Sensing of Antioxidants Using Gold Nanoclusters. Anal. Chem. 2014, 86, 4989–4994. [Google Scholar] [CrossRef] [PubMed]
- Darabdhara, G.; Sharma, B.; Das, M.R.; Boukherroub, R.; Szunerits, S. Cu-Ag Bimetallic Nanoparticles on Reduced Graphene Oxide Nanosheets as Peroxidase Mimic for Glucose and Ascorbic Acid Detection. Sensor. Actuat. B Chem. 2017, 238, 842–851. [Google Scholar] [CrossRef]
Scheme 1.
Schematic of AA detection with silver-coated gold nanorods.

Figure 1.
Absorption spectra of silver-coated gold nanorods in the presence of H2O2 and AA. Conditions: Au@Ag NRs, 50 μL; H2O2, 450 μM; Fe2+; 0.25 mM; HCl, 0.10 M; t, 25 min; T, 45 °C; and AA, 17.5 μM.
Figure 1.
Absorption spectra of silver-coated gold nanorods in the presence of H2O2 and AA. Conditions: Au@Ag NRs, 50 μL; H2O2, 450 μM; Fe2+; 0.25 mM; HCl, 0.10 M; t, 25 min; T, 45 °C; and AA, 17.5 μM.

Figure 2.
Scanning electron microscopic imaging. (A) Gold nanorods; (B) silver-coated gold nanorods; (C) etched silver-coated gold nanorods; and (D) the inhibited etching of silver-coated gold nanorods by AA. Scale bar: 250 nm. Conditions: Au@Ag NRs, 50 μL; H2O2, 450 μM; Fe2+; 0.25 mM; HCl, 0.10 M; t, 25 min; T, 45 °C; and AA, 17.5 μM.

Figure 3.
Longitudinal size distribution change during the synthesis and etching of silver-coated gold nanorods. (A) Gold nanorods; (B) silver-coated gold nanorods; (C) etched silver-coated gold nanorods; and (D) the inhibited etching of silver-coated gold nanorods by AA. Conditions: Au@Ag NRs, 50 μL; H2O2, 450 μM; Fe2+; 0.25 mM; HCl, 0.10 M; t, 25 min; T, 45 °C; and AA, 17.5 μM.

Figure 4.
DLS size distributions change during the synthesis and etching of silver-coated gold nanorods. (A) Silver-coated gold nanorods; (B) etched silver-coated gold nanorods; and (C) the inhibited etching of silver-coated gold nanorods by AA. Conditions: Au@Ag NRs, 50 μL; H2O2, 450 μM; Fe2+; 0.25 mM; HCl, 0.10 M; t, 25 min; T, 45 °C; and AA, 17.5 μM.

Figure 5.
Reaction conditions optimization for AA detection. (A) Silver-coated gold nanorod solution concentration optimization. Conditions: AA, 17.5 μM; H2O2, 450 μM; Fe2+; 0.25 mM; HCl, 0.10 M; t, 25 min; and T, 45 °C. (B) Hydrogen peroxide concentration optimization. Conditions: AA, 17.5 μM; Au@Ag NRs, 50 μL; Fe2+; 0.25 mM; HCl, 0.10 M; t, 25 min; and T, 45 °C. (C) Hydrochloric acid concentration optimization. Conditions: AA, 17.5 μM; Au@Ag NRs, 50 μL; H2O2, 450 μM; Fe2+; 0.25 mM; t, 25 min; and T, 45 °C. (D) Optimization of Fe2+ concentration. Conditions: AA, 17.5 μM; Au@Ag NRs, 50 μL; H2O2, 450 μM; HCl, 0.10 M; t, 25 min; and T, 45 °C. (E) Reaction time optimization. Conditions: AA, 17.5 μM; Au@Ag NRs, 50 μL; H2O2, 450 μM; Fe2+; 0.25 mM; HCl, 0.10 M; and T, 45 °C. (F) Reaction temperature optimization. Conditions: AA, 17.5 μM; Au@Ag NRs, 50 μL; H2O2, 450 μM; Fe2+; 0.25 mM; HCl, 0.10 M; and t, 25 min.

Figure 6.
AA detection based on the red shift of λmax. (A) Spectral variations of silver-coated gold nanorods in the presence of different concentrations of AA (from bottom to top: 0 μM, 2.50 μM, 5.00 μM, 7.50 μM, 10.00 μM, 15.00 μM, 17.5 μM). (B) The standard curve for AA detection. Conditions: Au@Ag NRs, 50 μL; H2O2, 450 μM; Fe2+; 0.25 mM; HCl, 0.10 M; t, 25 min; and T, 45 °C.

Figure 7.
Selectivity of the proposed method for AA detection. Conditions: Au@Ag NRs, 50 μL; H2O2, 450 μM; Fe2+; 0.25 mM; HCl, 0.10 M; t, 25 min; T, 45 °C; AA, 17.5 μM; and other interfering species, 87.5 μΜ.
Figure 7.
Selectivity of the proposed method for AA detection. Conditions: Au@Ag NRs, 50 μL; H2O2, 450 μM; Fe2+; 0.25 mM; HCl, 0.10 M; t, 25 min; T, 45 °C; AA, 17.5 μM; and other interfering species, 87.5 μΜ.

Publisher’s Note: MDPI stays neutral with regard to jurisdictional claims in published maps and institutional affiliations. |
© 2022 by the authors. Licensee MDPI, Basel, Switzerland. This article is an open access article distributed under the terms and conditions of the Creative Commons Attribution (CC BY) license (https://creativecommons.org/licenses/by/4.0/).
Share and Cite
MDPI and ACS Style
Wen, S.; Huang, M.; Cheng, R.; Gao, J.; Wang, J. Silver-Coated Gold Nanorods as Optical Probes for the Sensitive Detection of Ascorbic Acid in Tablets. Chemosensors 2022, 10, 543. https://0-doi-org.brum.beds.ac.uk/10.3390/chemosensors10120543
AMA Style
Wen S, Huang M, Cheng R, Gao J, Wang J. Silver-Coated Gold Nanorods as Optical Probes for the Sensitive Detection of Ascorbic Acid in Tablets. Chemosensors. 2022; 10(12):543. https://0-doi-org.brum.beds.ac.uk/10.3390/chemosensors10120543
Chicago/Turabian StyleWen, Shuai, Min Huang, Ru Cheng, Jie Gao, and Jian Wang. 2022. "Silver-Coated Gold Nanorods as Optical Probes for the Sensitive Detection of Ascorbic Acid in Tablets" Chemosensors 10, no. 12: 543. https://0-doi-org.brum.beds.ac.uk/10.3390/chemosensors10120543
Note that from the first issue of 2016, this journal uses article numbers instead of page numbers. See further details here.