Article

Rapid Gas-Sensing Detection of Carbon Disulfide by a CdS/SnS Nanocomposite-Based Cataluminescence Sensor

1
Research Center of Engineering and Technology for Smart City of Anhui Province, College of Environment and Energy Engineering, Anhui Jianzhu University, Hefei 230601, China
2
College of Mathematics and Physics, Anhui Jianzhu University, Hefei 230601, China
3
Key Laboratory of Functional Molecular Solids, Ministry of Education, College of Chemistry and Materials Science, Anhui Normal University, Wuhu 241002, China
*
Authors to whom correspondence should be addressed.
Submission received: 30 November 2022 / Revised: 18 December 2022 / Accepted: 20 December 2022 / Published: 22 December 2022
(This article belongs to the Special Issue Application of Luminescent Materials for Sensing)

Abstract

:
A CdS/SnS nanocomposite was prepared using a simple hydrothermal method and used as a sensitive material for the detection of carbon disulfide (CS2) based on cataluminescence (CTL). The samples were characterized by X-ray diffraction (XRD), scanning electron microscopy (SEM), energy-dispersive spectrometry (EDS) and X-ray photoelectron spectroscopy (XPS). The results show that the CdS/SnS nanocomposite sensor has a high sensitivity to CS2 at a relatively low operating temperature (162 °C); the response time is about 3 s, and the recovery time is about 16 s. The modification of CdS effectively enhances the sensitivity of SnS sensors. The CTL intensity shows a good linear relationship at gas concentrations ranging from 6.75 to 168.75 ppm (R2 = 09974), and the limit of detection (LOD) of CS2 reached 0.96 ppm. In addition, the CdS/SnS sensor has excellent selectivity and good stability towards CS2. The mechanism of the sensor is discussed in detail. This research shows that CdS/SnS has great potential for the detection of CS2.

1. Introduction

Carbon disulfide (CS2) is a typical organosulfur compound, which is a colorless and transparent fat-soluble liquid at room temperature and pressure with a spoiled rotten egg smell, and has strong volatility, flammability and explosiveness. The main sources are natural gas, coke oven gas and viscose fiber production exhaust gas [1,2,3]. The emission of CS2 is harmful to human health. It is absorbed by the human body in the form of steam or through the mucous membranes of the eyes and skin and enters the blood. Therefore, long-term human exposure to low concentrations of CS2 may lead to peripheral neuropathy [4,5,6]. CS2 emissions are also extremely harmful to the environment, and once CS2 enters the stratosphere, it is rapidly oxidized into carbon sulfide and sulfur dioxide [7], leading to acid rain and the formation of secondary organic aerosols. Therefore, in order to control the concentration of CS2 below the threshold value, a sensitive, reliable and specific method is needed to monitor the content of CS2 in the environment.
At present, the methods for the determination of CS2 include flame photometric gas chromatography [8], the fluorescence sensor method [9], wavelength modulation spectroscopy [10], the quantum cascade laser method [11] and ultraviolet absorption spectroscopy [12]. Although these methods can accurately detect CS2 gas, there are disadvantages, such as bulky detection instruments, cumbersome processes and the need for professional operation. Gas sensors are characterized by small sizes, simplicity, low cost and easy operation, and they play a vital role in environmental monitoring [13,14,15]. In recent years, CTL sensors have been widely developed and used in the field of VOC monitoring due to advantages such as low cost, small and convenient detection equipment, high sensitivity and excellent stability [16]. At the same time, with the introduction of nanomaterials into the design of CTL sensors, the performance of CTL sensors has been significantly improved due to characteristics such as a large surface area, high activity and the good adsorption of nanomaterials [17]. Another great advantage of CTL sensors is that only the target gas and oxygen are consumed during the sensing process, and the sensing element is not consumed as a catalyst. Because of the many advantages of CTL sensors, they have the ability to monitor analytes for a long time [18,19]. Therefore, CTL sensors are designed for CS2 gas detection.
As a carbon-group element (IVA) (MX; M = Sn, Ge; X = S, Se), SnS has a large absorption coefficient (≈105 cm−1), is low-cost and non-toxic and has an appropriate band gap (1.0–1.35 eV) [20,21,22,23,24,25,26]. SnS nanomaterials have inherent disadvantages, such as a small modulation depth. In recent years, element doping has been an effective method for enhancing the gas sensitivity of gas sensors, as it can control the grain size, band structure and surface state of the sensing material. Previous studies have shown that heterogeneous structures exhibit unique electrical and optical properties [27,28,29]. According to previous studies, the CdS/SnS heterostructure shows remarkable performance in all aspects [30]. For example, Chang et al. used the excellent properties of the CdS/SnS heterojunction to develop detectors with excellent performance [28]. Considering this, the application of CdS/SnS nanocomposites to CTL sensors may have a good performance. At present, no relevant reports on the application of CdS/SnS nanocomposites to CTL sensors could be found.
Herein, SnS and CdS/SnS composites were prepared by using a hydrothermal method. The CTL characteristics of SnS and CdS/SnS composites were compared, and the possible mechanism of the enhanced CTL performance of CdS/SnS composite sensors was explored based on influencing factors, namely, the temperature, concentration and carrier gas velocity. The results show that the material and CS2 can produce a strong CTL phenomenon, and this work shows that the CdS/SnS nanojunction may be a new CTL-sensitive material, which provides a promising method for the development of high-performance CTL CS2 sensors.

2. Experimental Procedures

2.1. Test Reagents

Stannous chloride (SnCl2·2H2O, 98.0%, Shanghai Sinopharm Chemical Reagent Co., Ltd., Shanghai, China); Absolute ethanol (C2H6O, 99.5%, Zhengzhou Yibang Industrial Co., Ltd., Zhengzhou, China); Thiourea (CH4N2S, 99.0%, Shanghai Rinen Technology Development Co., Ltd., Shanghai, China); Cadmium acetate (C4H6CdO4·2H2O, 99.9%, Tianjin Photofusion Chemical Reagent Co., Ltd., Tianjin, China); and Anhydrous glycol (C2H6O2, 99.99%, Shanghai Sinopharm Chemical Reagent Co., Ltd., Shanghai, China).

2.2. Main Analytical Instruments

BPCL faint luminescence measuring instrument (Guangzhou Microlight Technology Co., Ltd., Guangzhou, China); X-ray diffractometer (Panalytical, Almelo, The Netherlands); scanning electron microscope (ZEISS, Jena, German); energy-dispersive spectrometer (ZEISS, German company); and X-ray photoelectron spectrometer (Thermo Fisher Scientific, Waltham, MA, USA).

2.3. Preparation of Nanocomposites

CdS/SnS nanocomposites were prepared using a hydrothermal method. First, 0.36 g of thiourea was added to a solution obtained by mixing 0.54 g of SnCl2 with 60 ml of absolute ethanol. The reaction mixture was transferred to a 100 mL Teflon-lined stainless-steel reactor, which was placed in a constant-temperature heating box and heated at 180 °C for 12 h. Then, the samples were collected, washed alternately with deionized water and absolute ethanol and dried in a constant-temperature heating box at 70 °C for 8 h. Next, 0.46 g of cadmium acetate and 0.16 g of thiourea were added to a solution obtained by mixing 0.3 g of SnS powder with 50 ml of deionized water and stirred at 70 °C for 30 min. The sample was centrifuged and washed. Finally, it was dried in a constant-temperature heating box and ground to obtain black CdS/SnS powder.

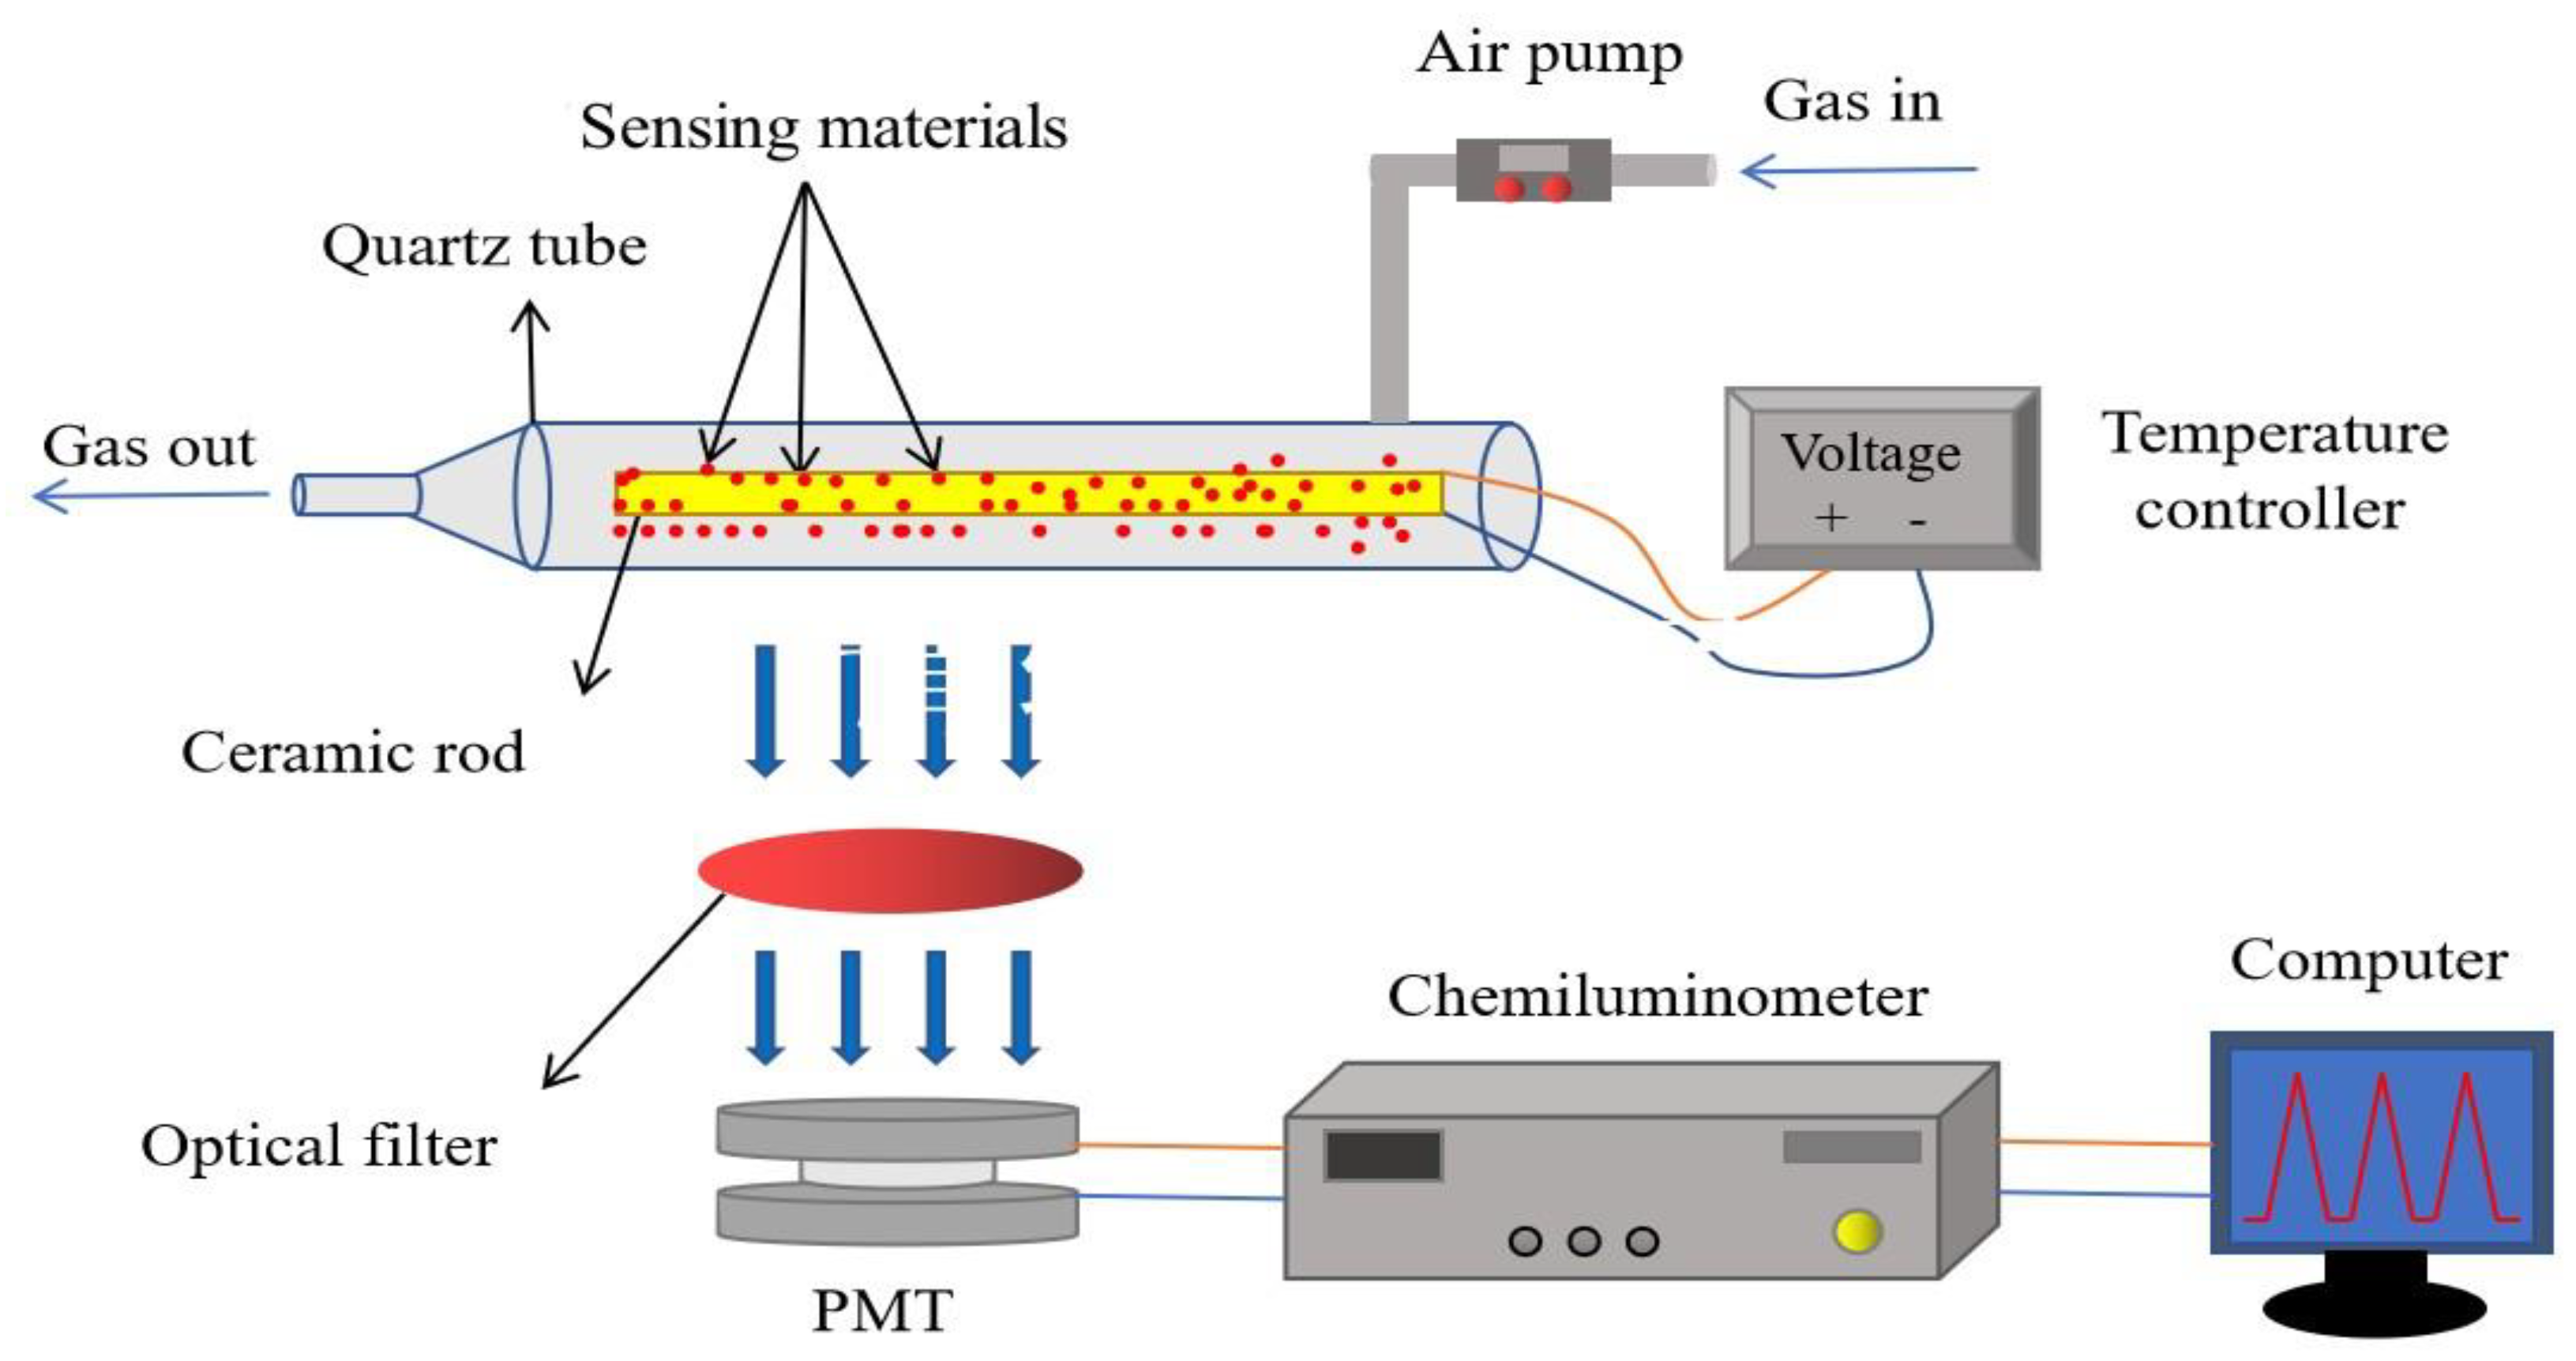
2.4. CTL Device and Detection Method

The system diagram of the ultra-weak chemiluminescent instrument (BPCL-1, Guangzhou Micro Light Technology Co., Ltd., Guangzhou, China) is shown in Figure 1. The system is divided into three parts: (I) reaction chamber: the chamber is composed of a ceramic heating rod coated with CdS/SnS nanocomposites and a quartz tube with a gas inlet and outlet, and the gas to be measured enters the quartz tube from the air inlet and reacts when in contact with the material; (II) temperature and flow rate control device: the temperature control system increases the surface temperature of the heating rod, and the air pump controls the carrier air velocity; (III) photoelectric detection and data processing system: the system consists of the BPCL-1 ultra-weak luminescence analyzer and the computer used to catalyze the luminescent signal. The concentration of the detection gas is calculated by the following formula [31]:
C = V i × p 0 V c × p a
where C, Vi, Vc, P0 and Pa are the concentration of the target gas, the volume of the injected gas, the volume of the chamber, the equilibrium vapor pressure at room temperature and standard atmospheric pressure, respectively.

3. Results and Discussion

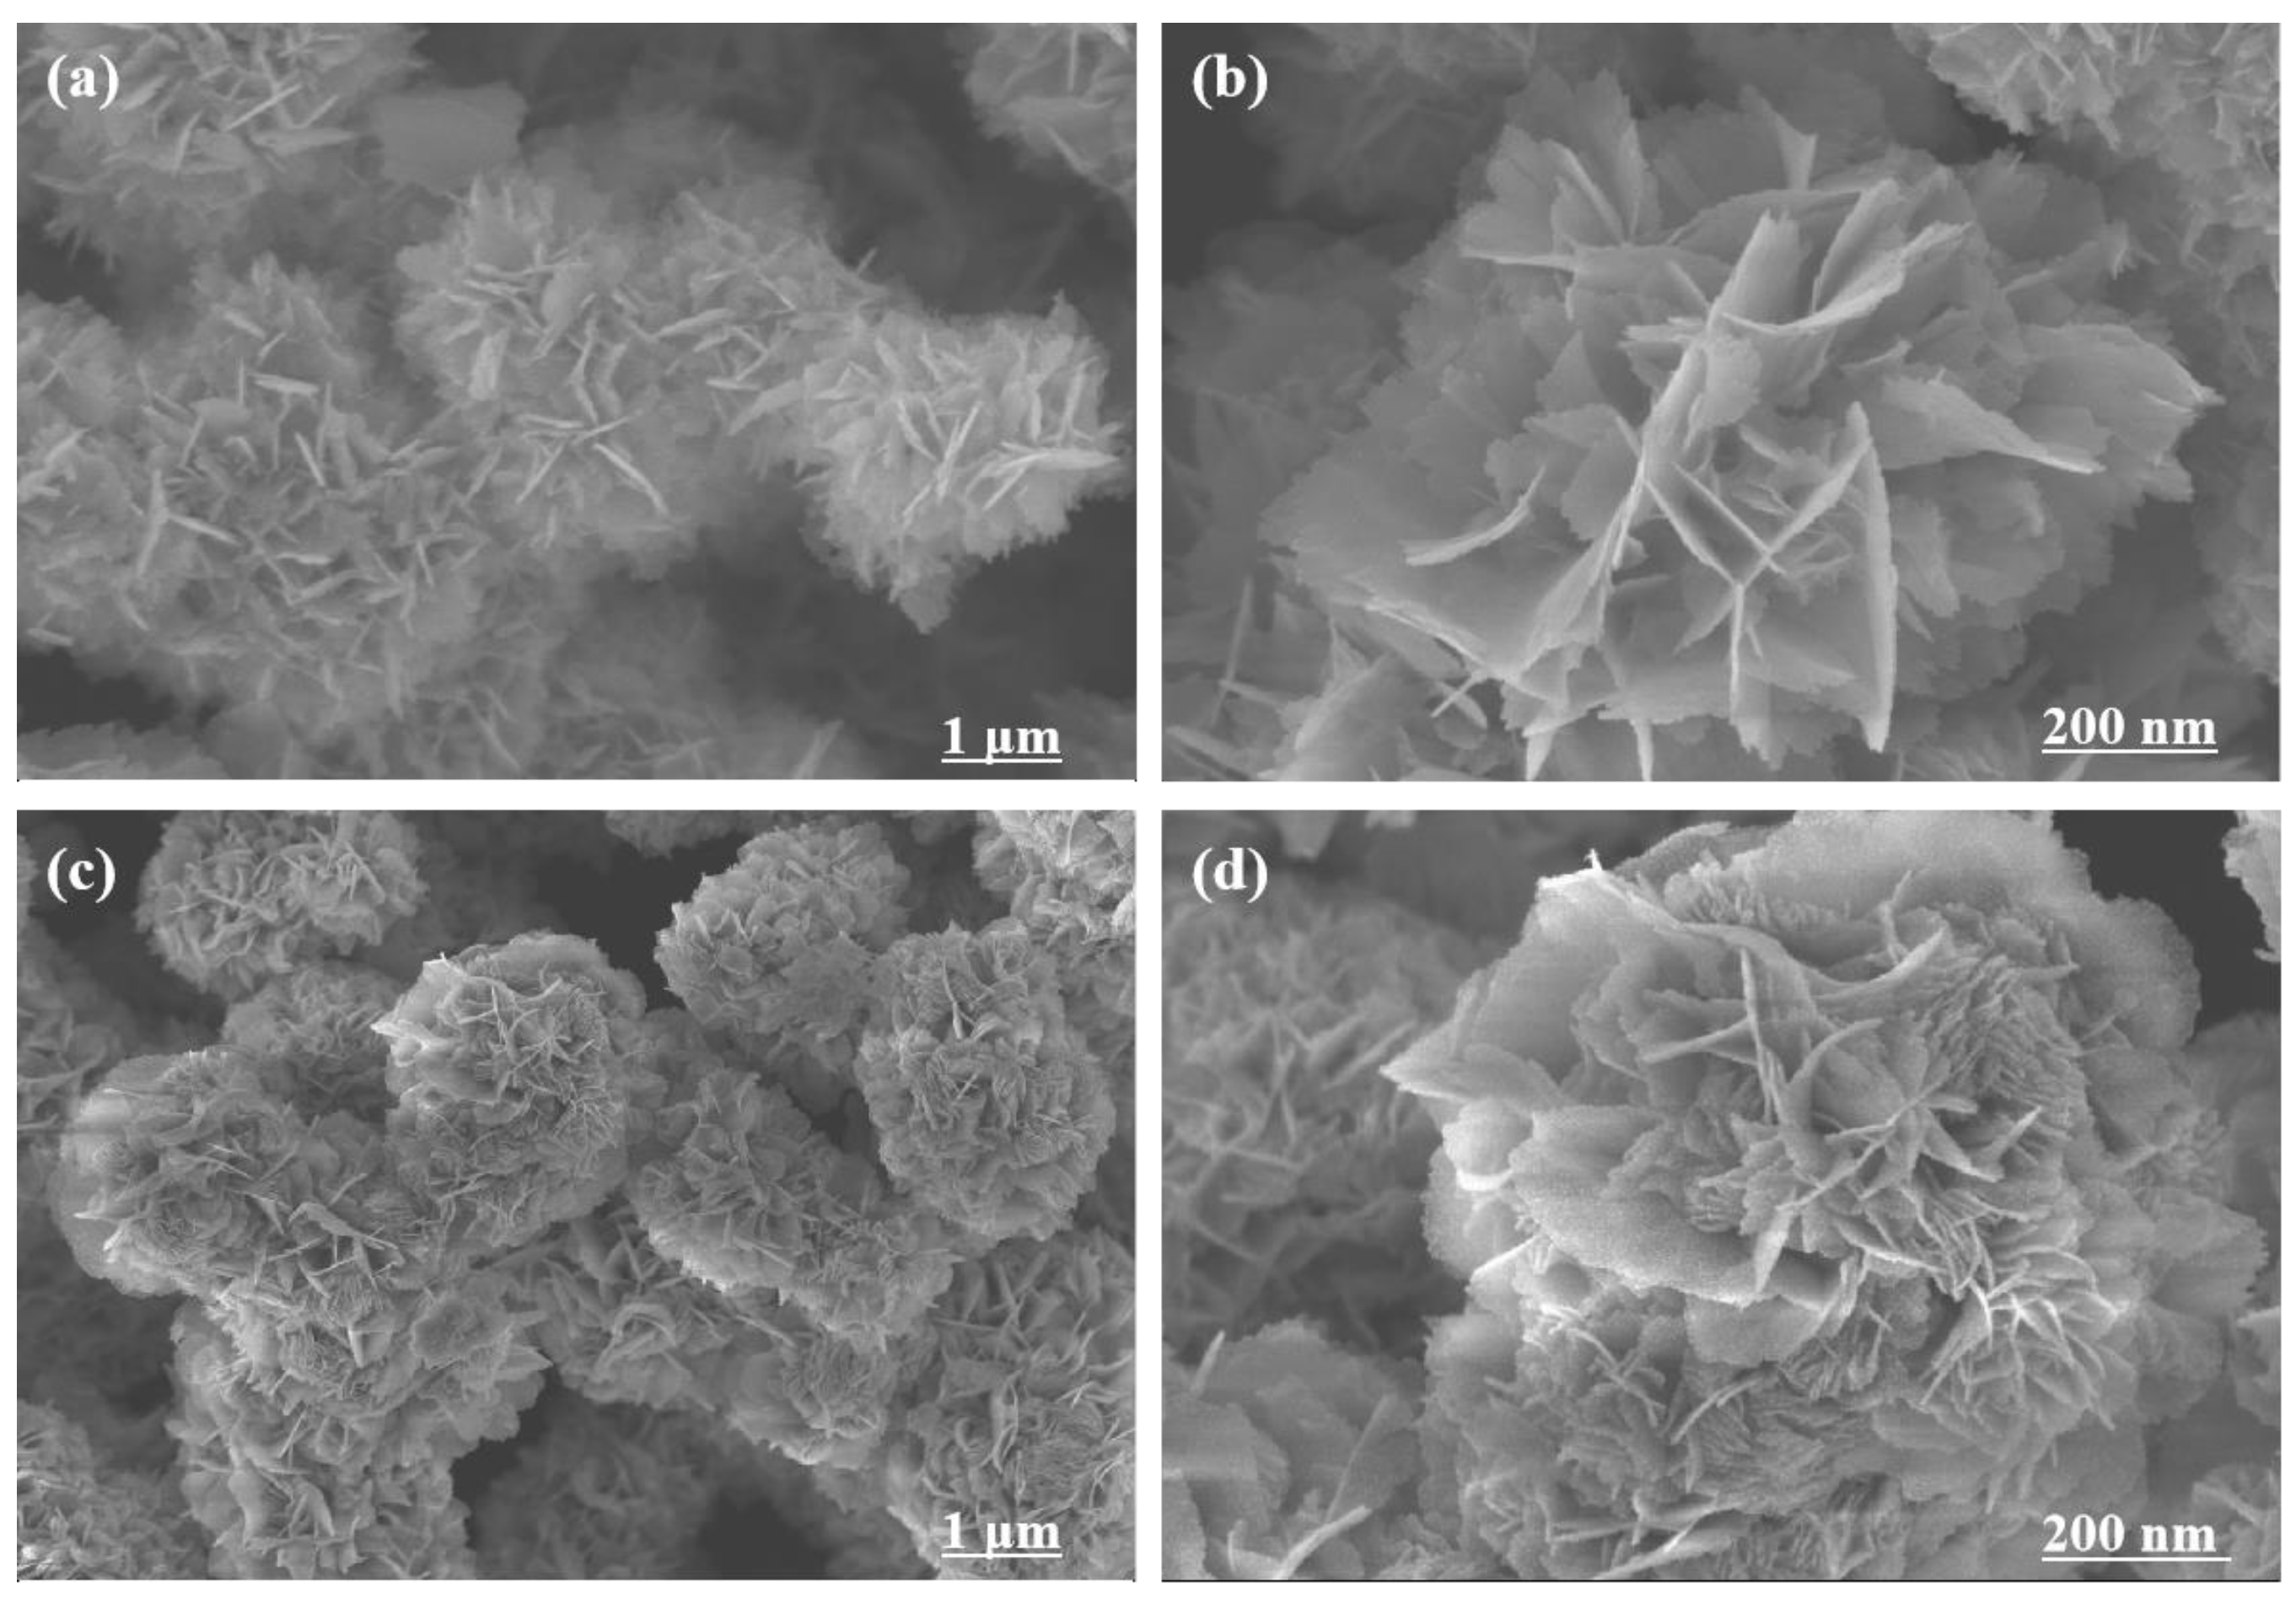
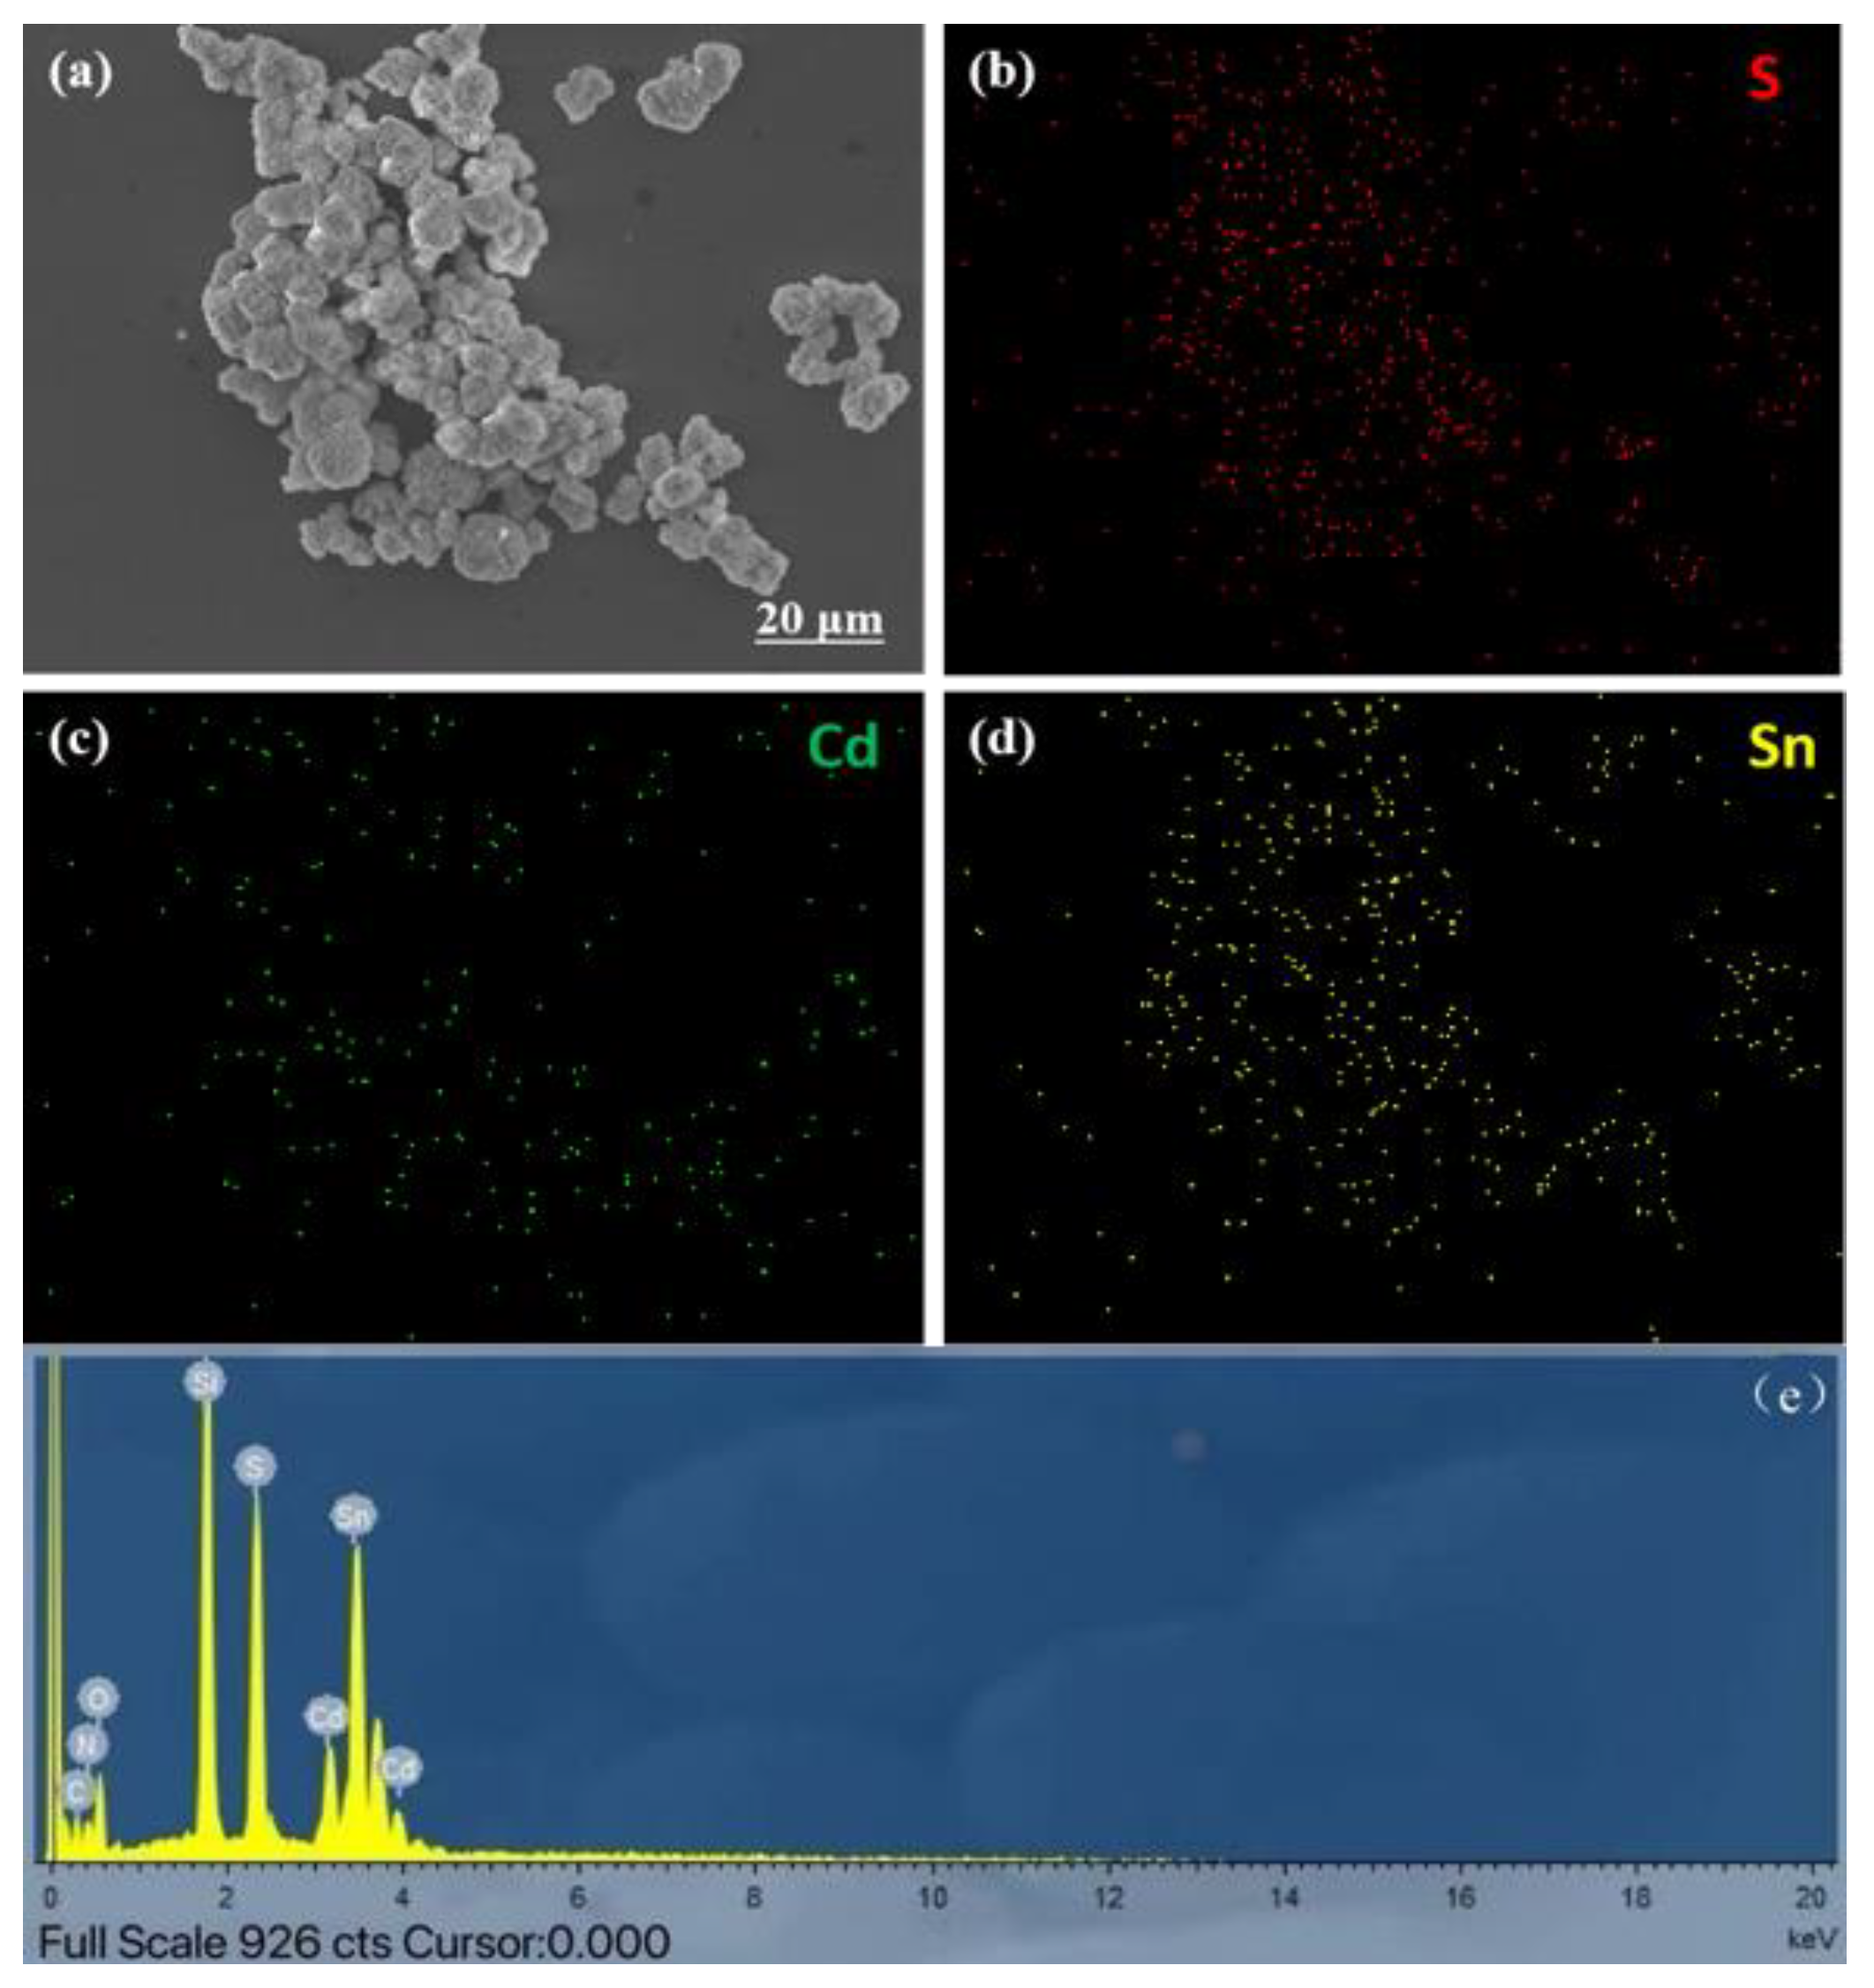
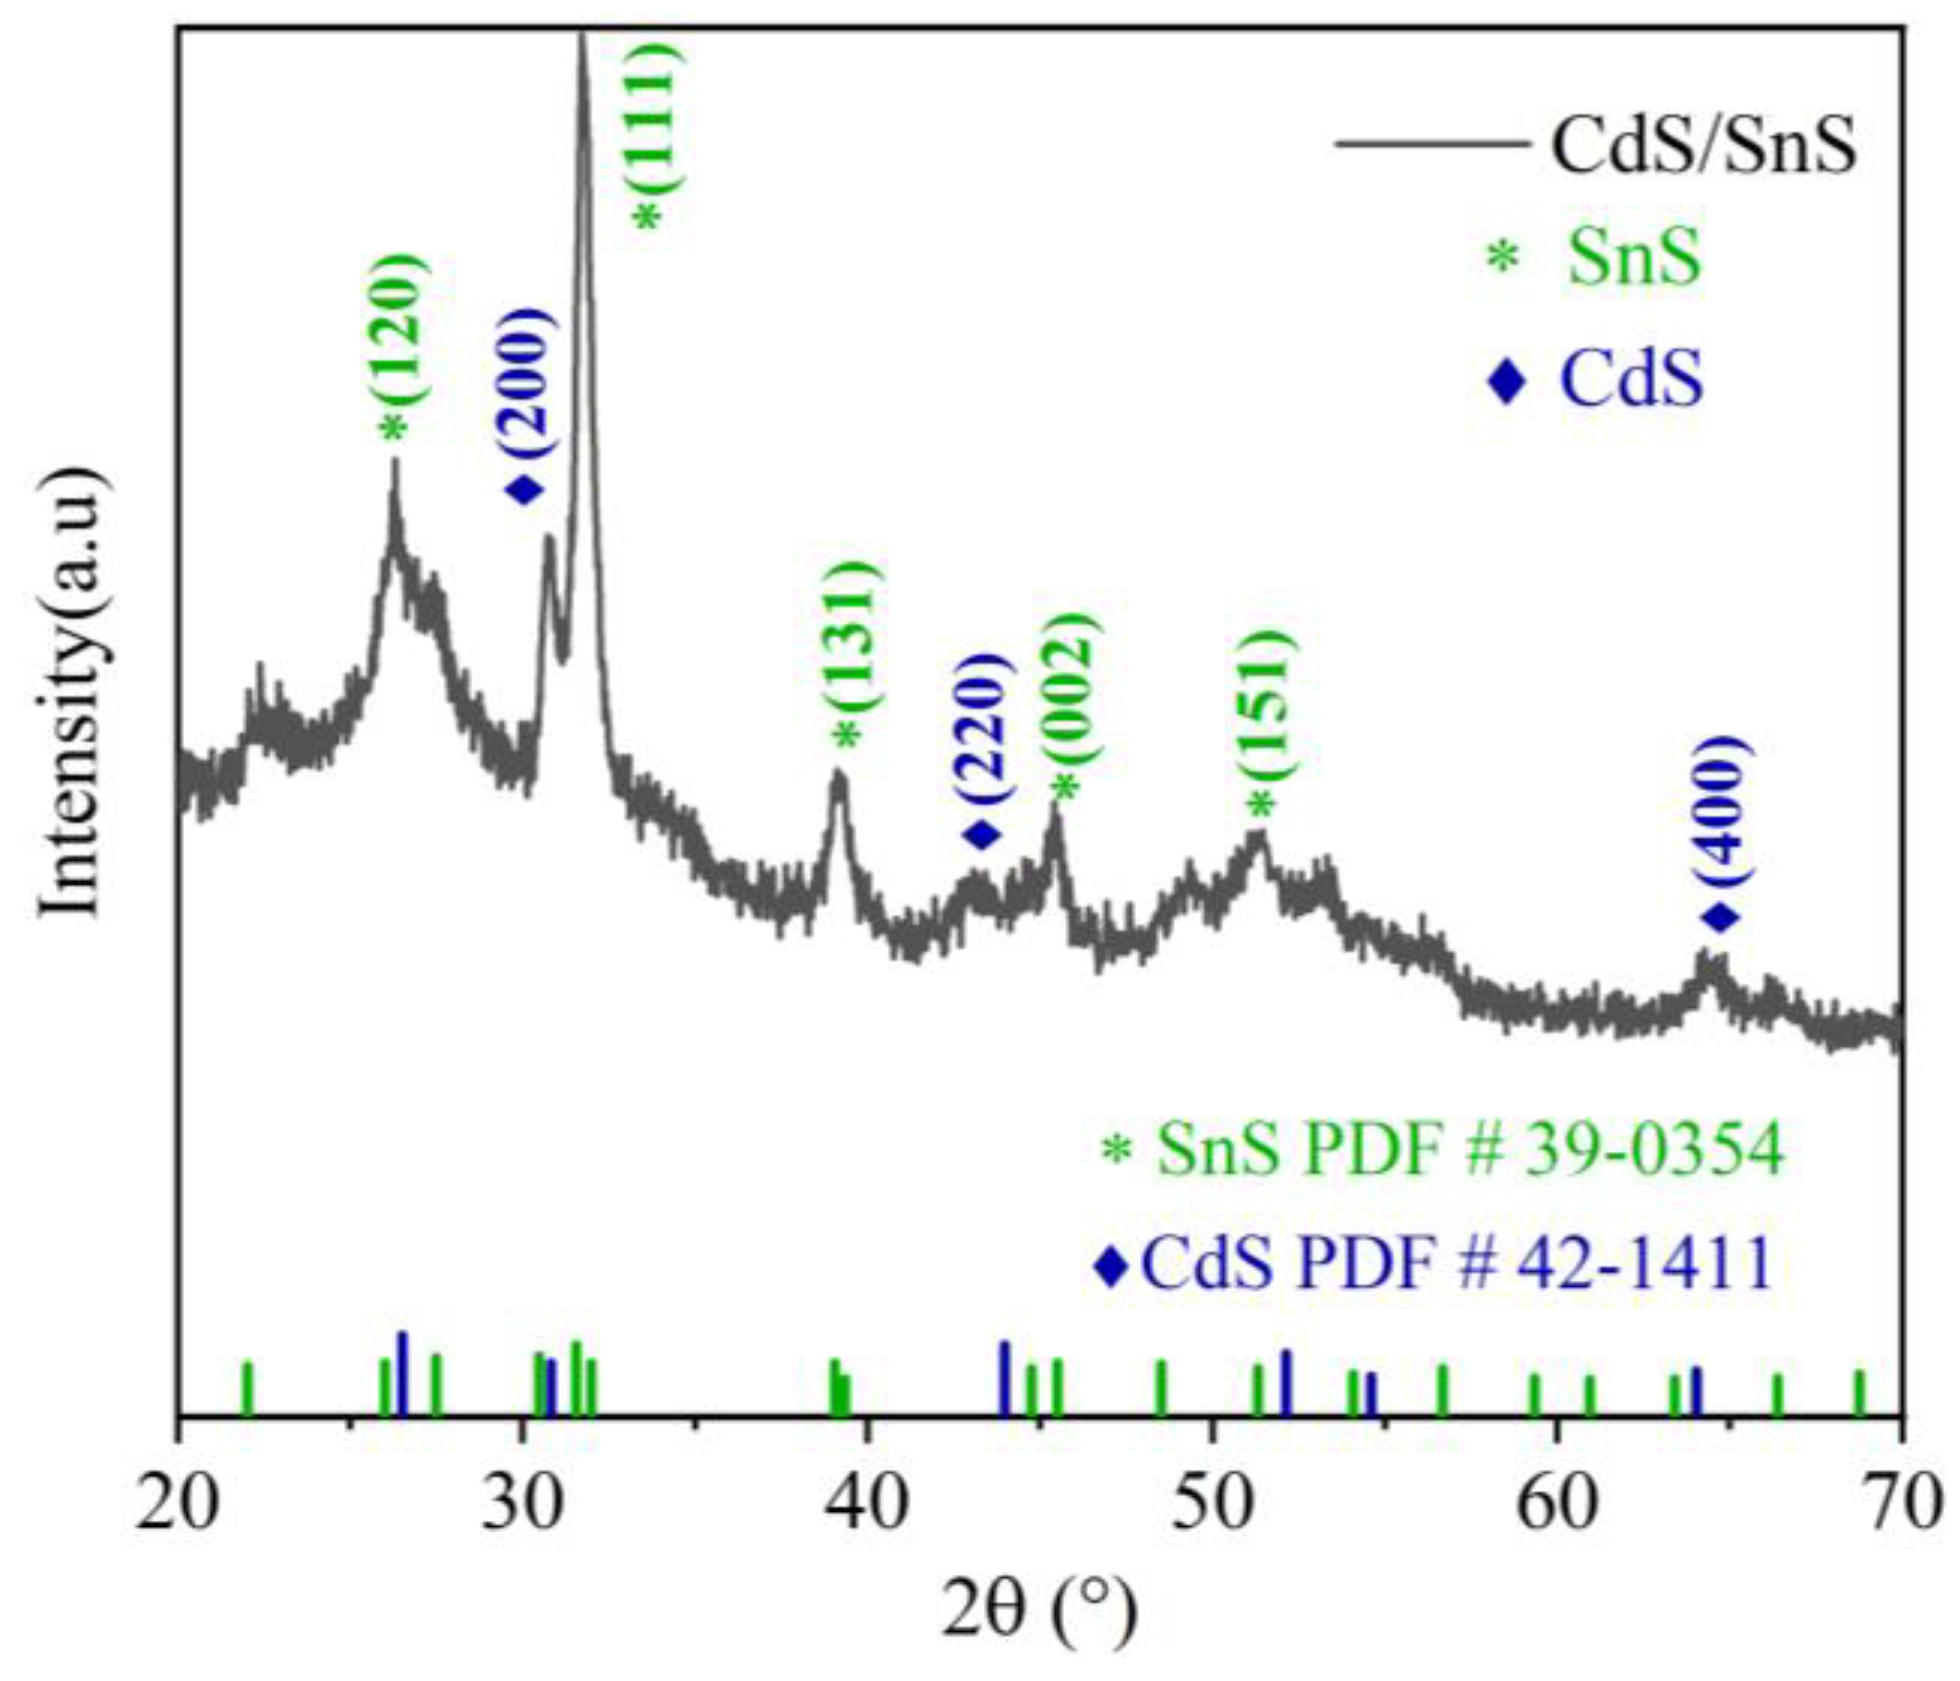
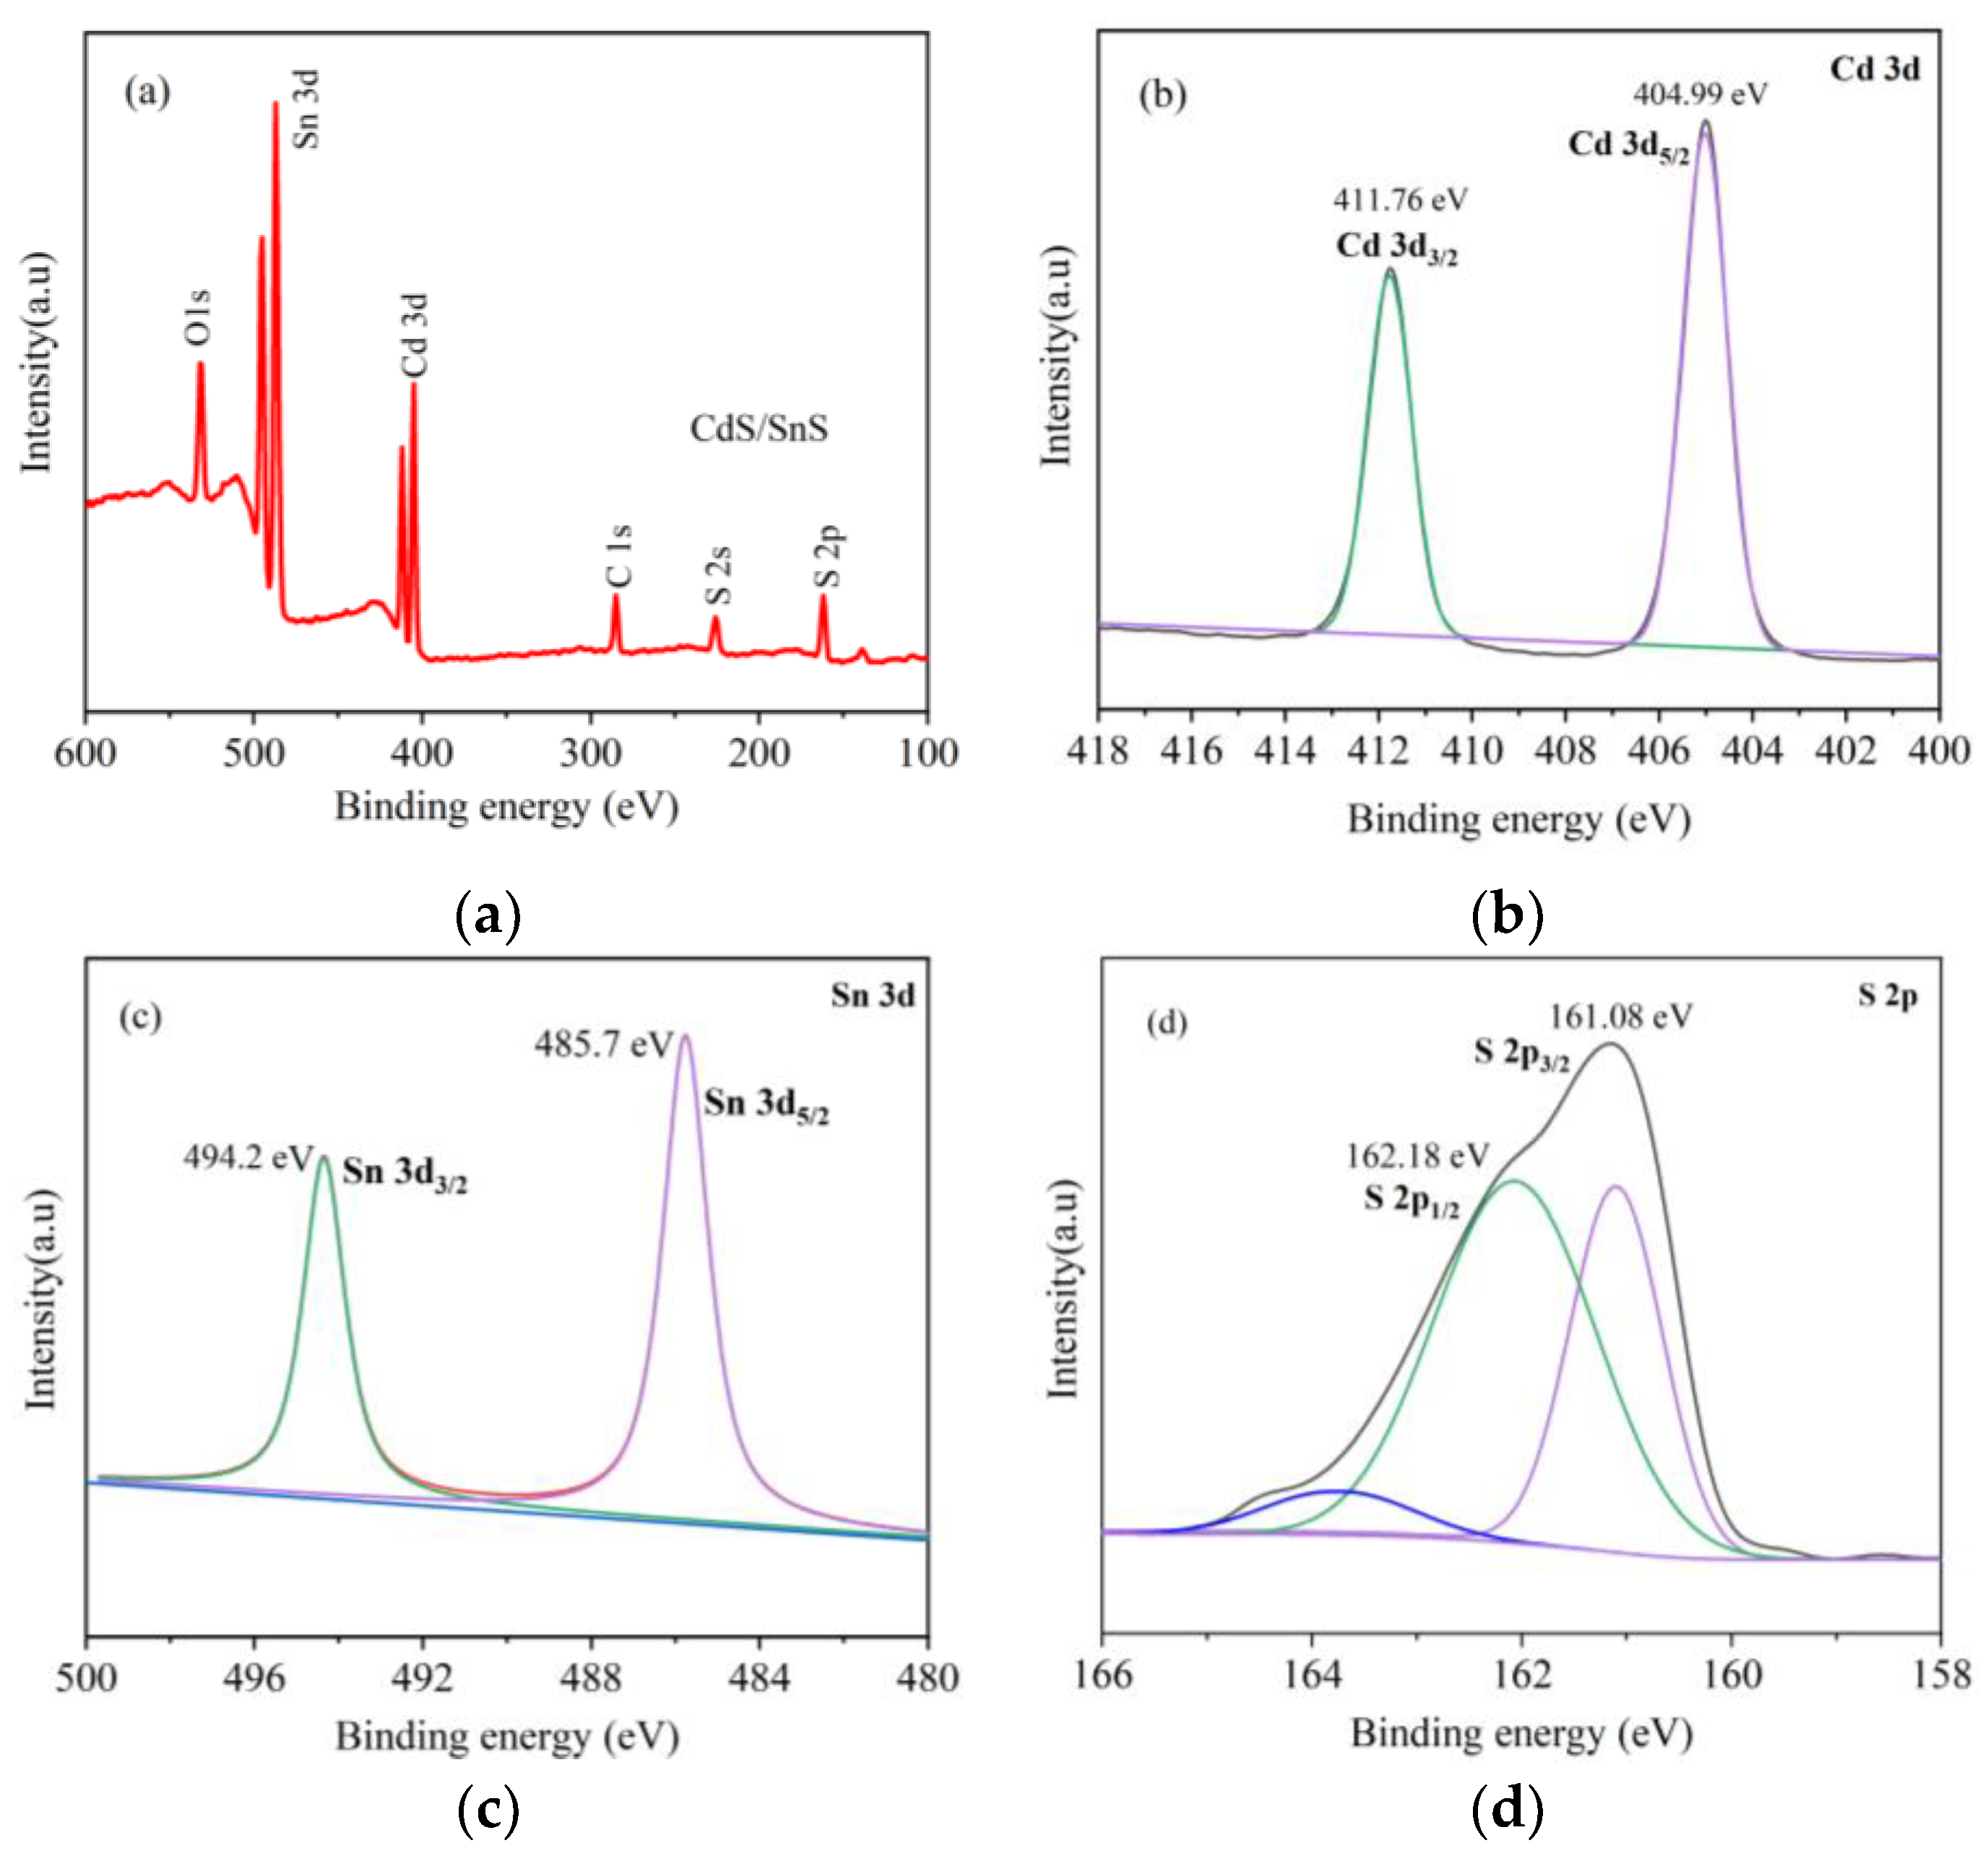
3.1. Material Characterization

The SEM images of SnS nanoflowers are shown in Figure 2a,b. SnS has a microstructure similar to a nanoflower, a regular morphology and a uniform distribution, and a large number of nanoparticles are stacked into nanospheres. Figure 2b shows its enlarged image, and the flower-like leaves are composed of ultra-thin nanosheet structures with clear and smooth surfaces. This composite has a large particle size. The size is large, and the synapses of the flower-like leaf structure on the surface are obvious, which can increase the contact area between the material and the gas, which is conducive to the adsorption and diffusion of gas. Figure 2c,d show images of CdS/SnS. Compared with the SEM of SnS, it is found that there are more agglomerated particles on the surfaces of the SnS nanoflowers. The particle size of the composite becomes smaller, the structure becomes denser, and the number of external nanosheets increases. In addition, the coated structure of the new composite helps to increase the specific surface area of the material that contacts the gas, provides more active sites for the adsorption and diffusion of the gas in the reaction, and also helps to improve the response and recovery times of the sensor.
EDS elemental mapping, EDS spectra (Figure 3) and the elemental content table (Table 1) show that S, Sn and Cd are characteristic elements with relatively uniform distributions, which once again shows the successful synthesis of CdS/SnS composites.
The X-ray diffraction (XRD) pattern for CdS/SnS is shown in Figure 4. According to the standard cards (PDF# 39-0354 and PDF# 42-1411), all diffraction peaks can be attributed to SnS and CdS, indicating the successful synthesis of CdS/SnS composites. The diffraction peaks at 2θ = 26.0°, 31.5°, 39.0°, 45.5° and 51.3° are attributed to the (120), (111), (131), (002) and (151) crystal faces of SnS, respectively, and the diffraction peaks at 2θ = 30.8°, 43.9° and 64.0° are attributed to the (200), (220) and (400) crystal faces of CdS, respectively. No diffraction peaks of other impurities were observed, which further indicates that CdS/SnS has a high purity.
The elemental composition and electronic states of CdS/SnS nanocomposites were analyzed by XPS. As shown in Figure 5, the complete spectrum of XPS clearly shows the presence of Sn, Cd and S in the composite, indicating significant changes in the electronic states of these three elements, as well as minor peaks due to O and C changes due to adsorption on the surface of the material. Figure 5b–d show the high-resolution XPS spectra of Cd 3d, Sn 3d and S 2p of CdS/SnS nanocomposite structures, respectively. The characteristic peaks of the Cd 3d spectrum are observed at 404.99 eV and 411.76 eV, corresponding to Cd 3d5/2 and Cd 3d3/2, respectively. The two peaks at 485.7 eV and 494.2 eV are attributed to Sn 3d5/2 and Sn 3d3/2, respectively, and the two characteristic peaks shown in the Cd 3d and Sn 3d spectra are located at two different orbitals, 5/2 and 3/2, respectively; the proportions are different, indicating that they are associated with the Cd2+ and Sn2+ states in CdS and SnS [32,33]. According to the periodic law of Cd and Sn, both of them have highly volatile electrons that form the divalent states Cd2+ and Sn2+. However, because the cationic oxidation of Sn is stronger than that of Cd, SnS is mainly used as a catalyst in the whole CTL process, and the incorporation of Cd metal elements promotes the absorption of O2 on the surface of the material, which greatly improves the CTL performance of the composite material; the spectral characteristic peaks of the two elements are similar, and the peak crack at 8.5 eV can also confirm the formation of SnS [34]. Figure 5d shows the high-resolution spectrum of S 2p, which is divided into three asymmetric peaks; the peaks at 161.08 eV and 162.18 eV are S 2p3/2 and S 2p1/2, respectively, with an energy interval of 1 eV and a peak-intensity ratio of 1.2:1, indicating a change in the valence state of S.

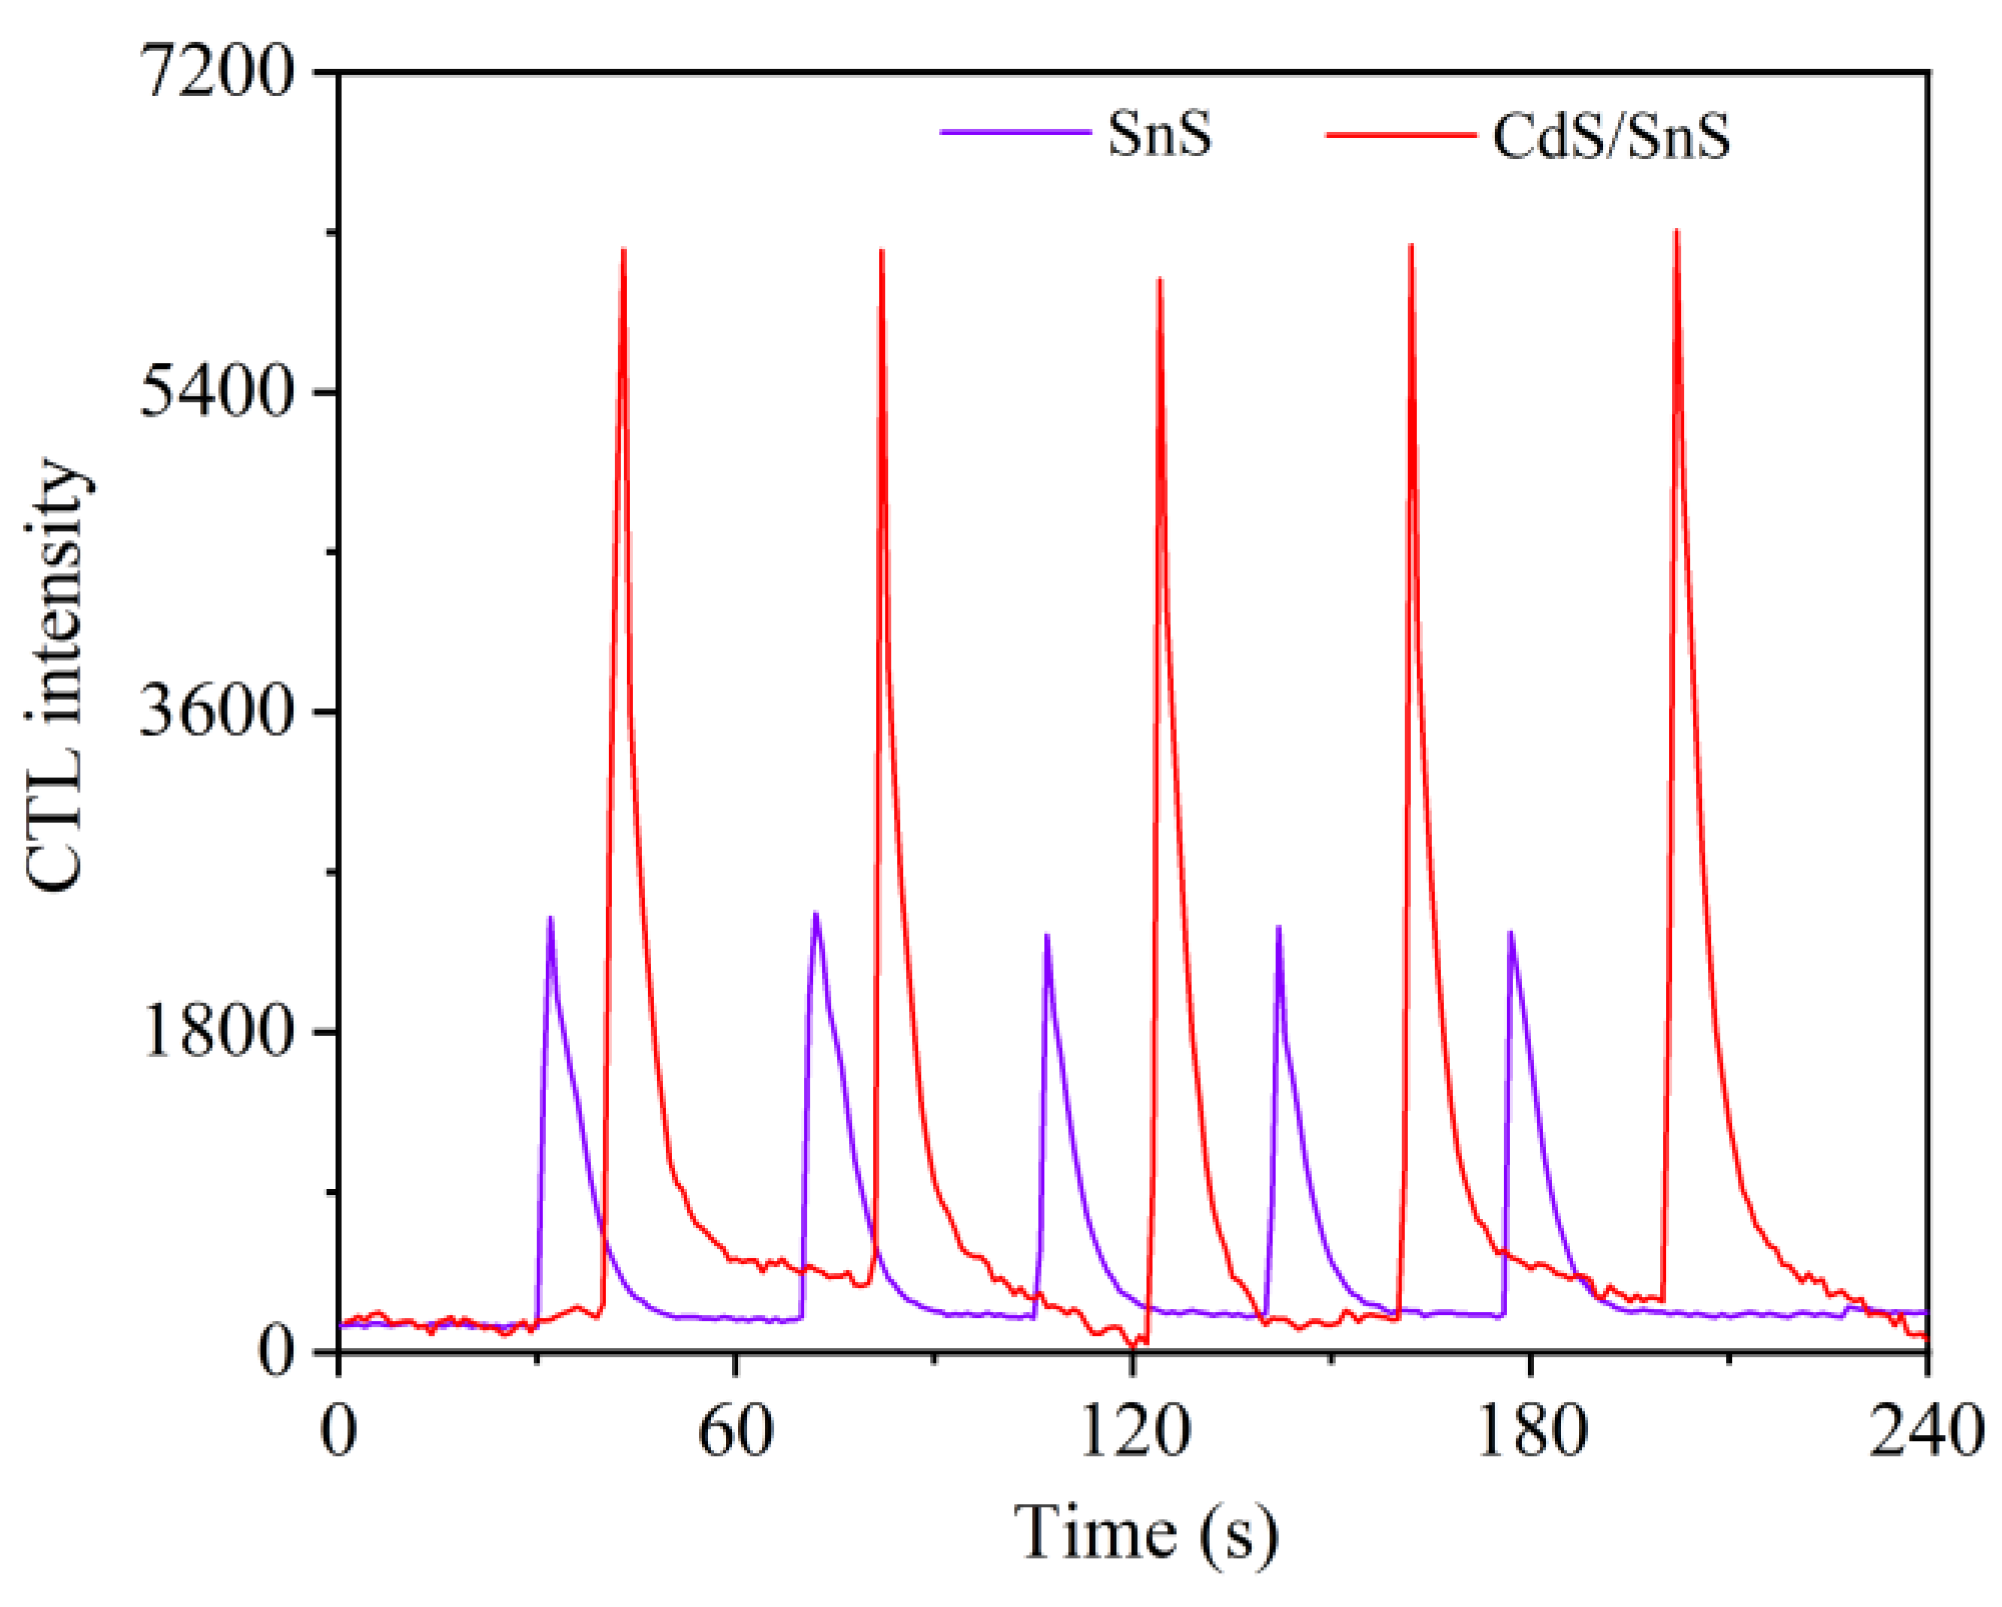
3.2. Effect of CdS Modification on SnS CTL Performance

The CTL performance is shown in Figure 6. Both sensitive materials have the highest peaks of luminous intensity within 3 seconds of CS2 introduction, indicating that the two materials have a fast response to CS2. The signal intensity of CTL on CS2 when CdS/SnS was used as a sensitive material was significantly higher than that when using SnS as a material. The composite exhibits a strong CTL reaction to CS2. It is shown that compared with pure SnS materials, CdS/SnS nanocomposites exhibit excellent CTL properties. The introduction of cadmium ions increases the cation content on the surface of the material, and the oxygen vacancy gradually increases in order to balance the charge to offset the electrical deviation of the material due to the increase in cadmium ion content. Studies have shown that the higher the content of oxygen molecules adsorbed on the surface of the material, the more oxygen vacancies on the surface of the material [35]. The addition of CdS can effectively enhance the signal intensity of the CTL method of pure SnS materials to detect CS2, and subsequent research on the sensitive characteristics of CS2 was carried out with CdS/SnS nanocomposites as sensitive materials.

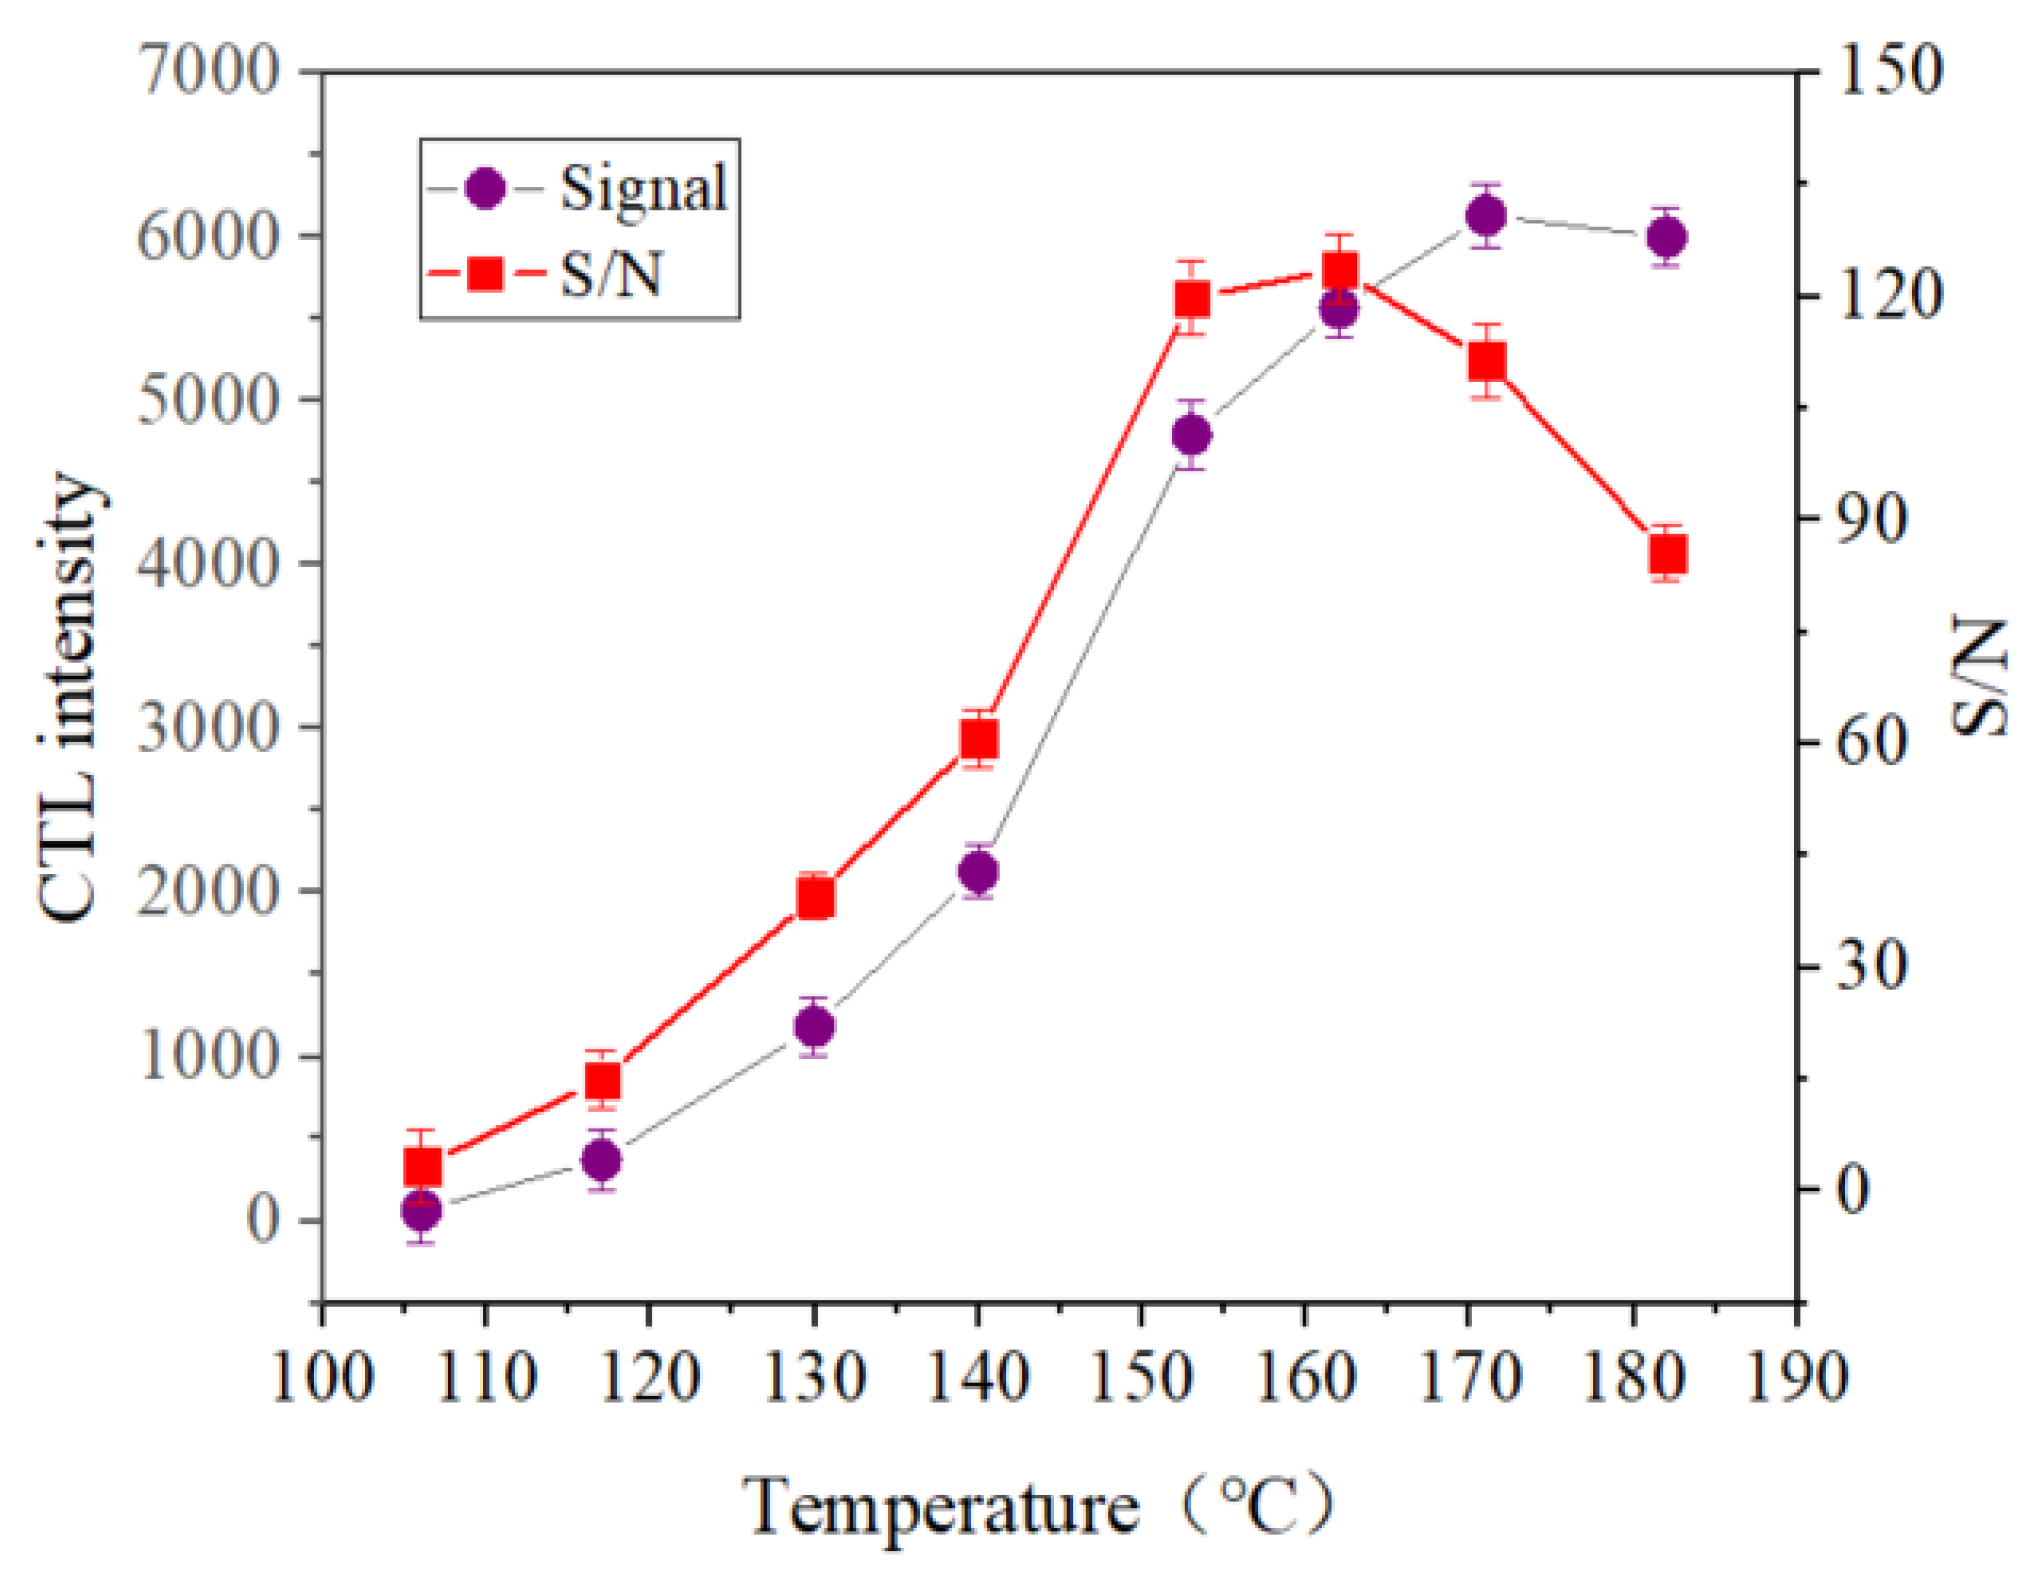
3.3. Effect of Working Temperature on CTL Intensity

Figure 7 was obtained under the following conditions: the flow rate was 280 mL/min, the gas concentration was 33.75 ppm, and the CTL intensity of CS2 increased with increasing temperature; the reason for choosing these conditions is that CS2 has a greater reaction conversion on CdS/SnS at higher temperatures. In the BPCL-1 experimental device, a photomultiplier tube was used to convert optical signals into electrical signals as output. Increasing the operating environment temperature of the photomultiplier tube will lead to an increase in hot-electron emission and the dark current, which will increase the noise of the sensor and directly affect the signal-to-noise ratio (S/N). When studying temperature-influenced factors, we took the S/N as an important research parameter. Considering the influence of the signal-to-noise ratio, the sensor does not achieve the best performance with a continuous increase in temperature [36]. When the temperature exceeds 162 °C, the S/N value decreases significantly with an increase in noise, and the signal strength of the sensor also decreases. Atomic ions have much higher activity at elevated temperatures, and the response of nanocomposites is very weak when the temperature is below the peak of the temperature polyline. However, when the temperature rises and is higher than the peak value, the signal strength of the sensor will also decrease, which may be due to the low operating temperature, the insufficient atomic ion activity of the reactant, and the relatively low response signal of the sensor. On the other hand, the higher the desorption rate of the target gas on the surface of the material, the greater the surface of the material that has not yet fully reacted, resulting in a decrease in the reaction performance [37]. The experiment finally selected a test temperature of 162 °C for further study. Reaction temperatures have always been an important factor limiting the range of use of CTL; many CTL sensors need to work at high temperatures, and researchers have been exploring sensitive materials that can enable CTL detection at lower temperatures. Compared with previous studies, the CS2 sensor based on the CdS/SnS nanocomposite has a lower operating temperature, so it is more conducive to expanding the potential of the sensor for practical applications.

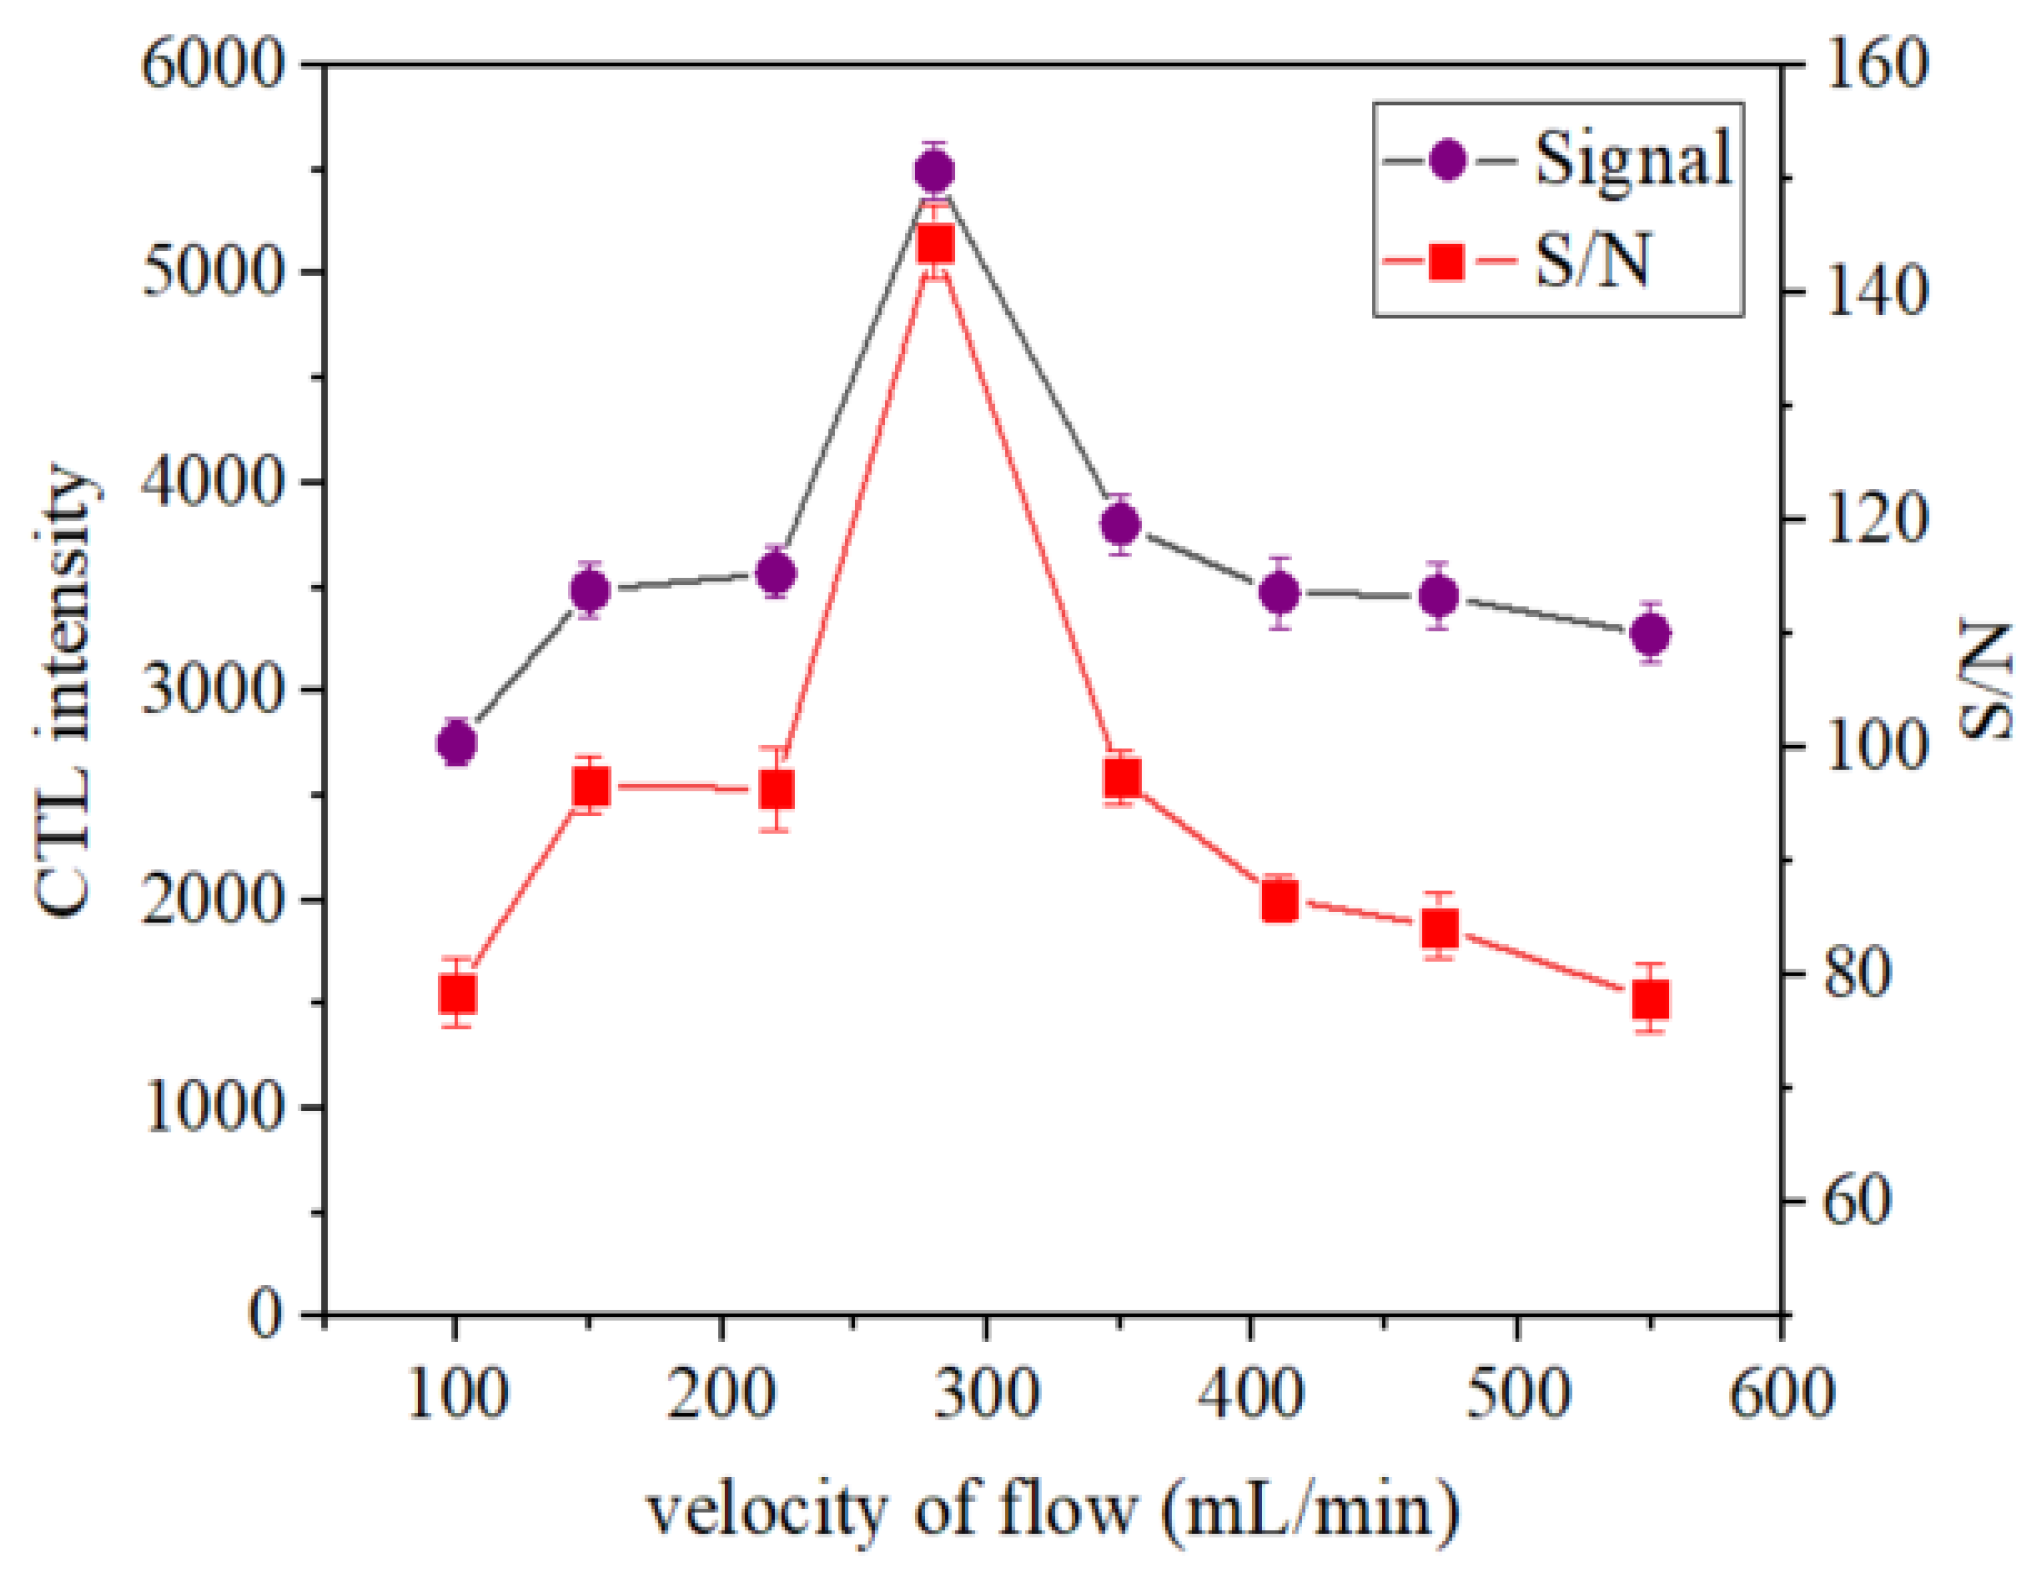
3.4. Effect of Carrier Air Velocity on CTL Intensity

As an important parameter, the flow rate also has an important impact on the CTL process. Figure 8 displays the effect of different carrier gas flow velocities in the range of 100–550 mL/min on the CTL performance, and it can be observed that the CTL reaction signal and S/N increase with the increase in the flow rate in a certain range (100–280 mL/min), and the CTL signal reaches a maximum value at 280 mL/min. When the carrier gas velocity is faster than 280 mL/min, due to the insufficient reaction time between the CS2 vapor and the sensor, the CS2 cannot be fully oxidized by oxygen. The CTL signal and S/N are reduced. Therefore, we selected a carrier air velocity of 280 mL/min for further study.

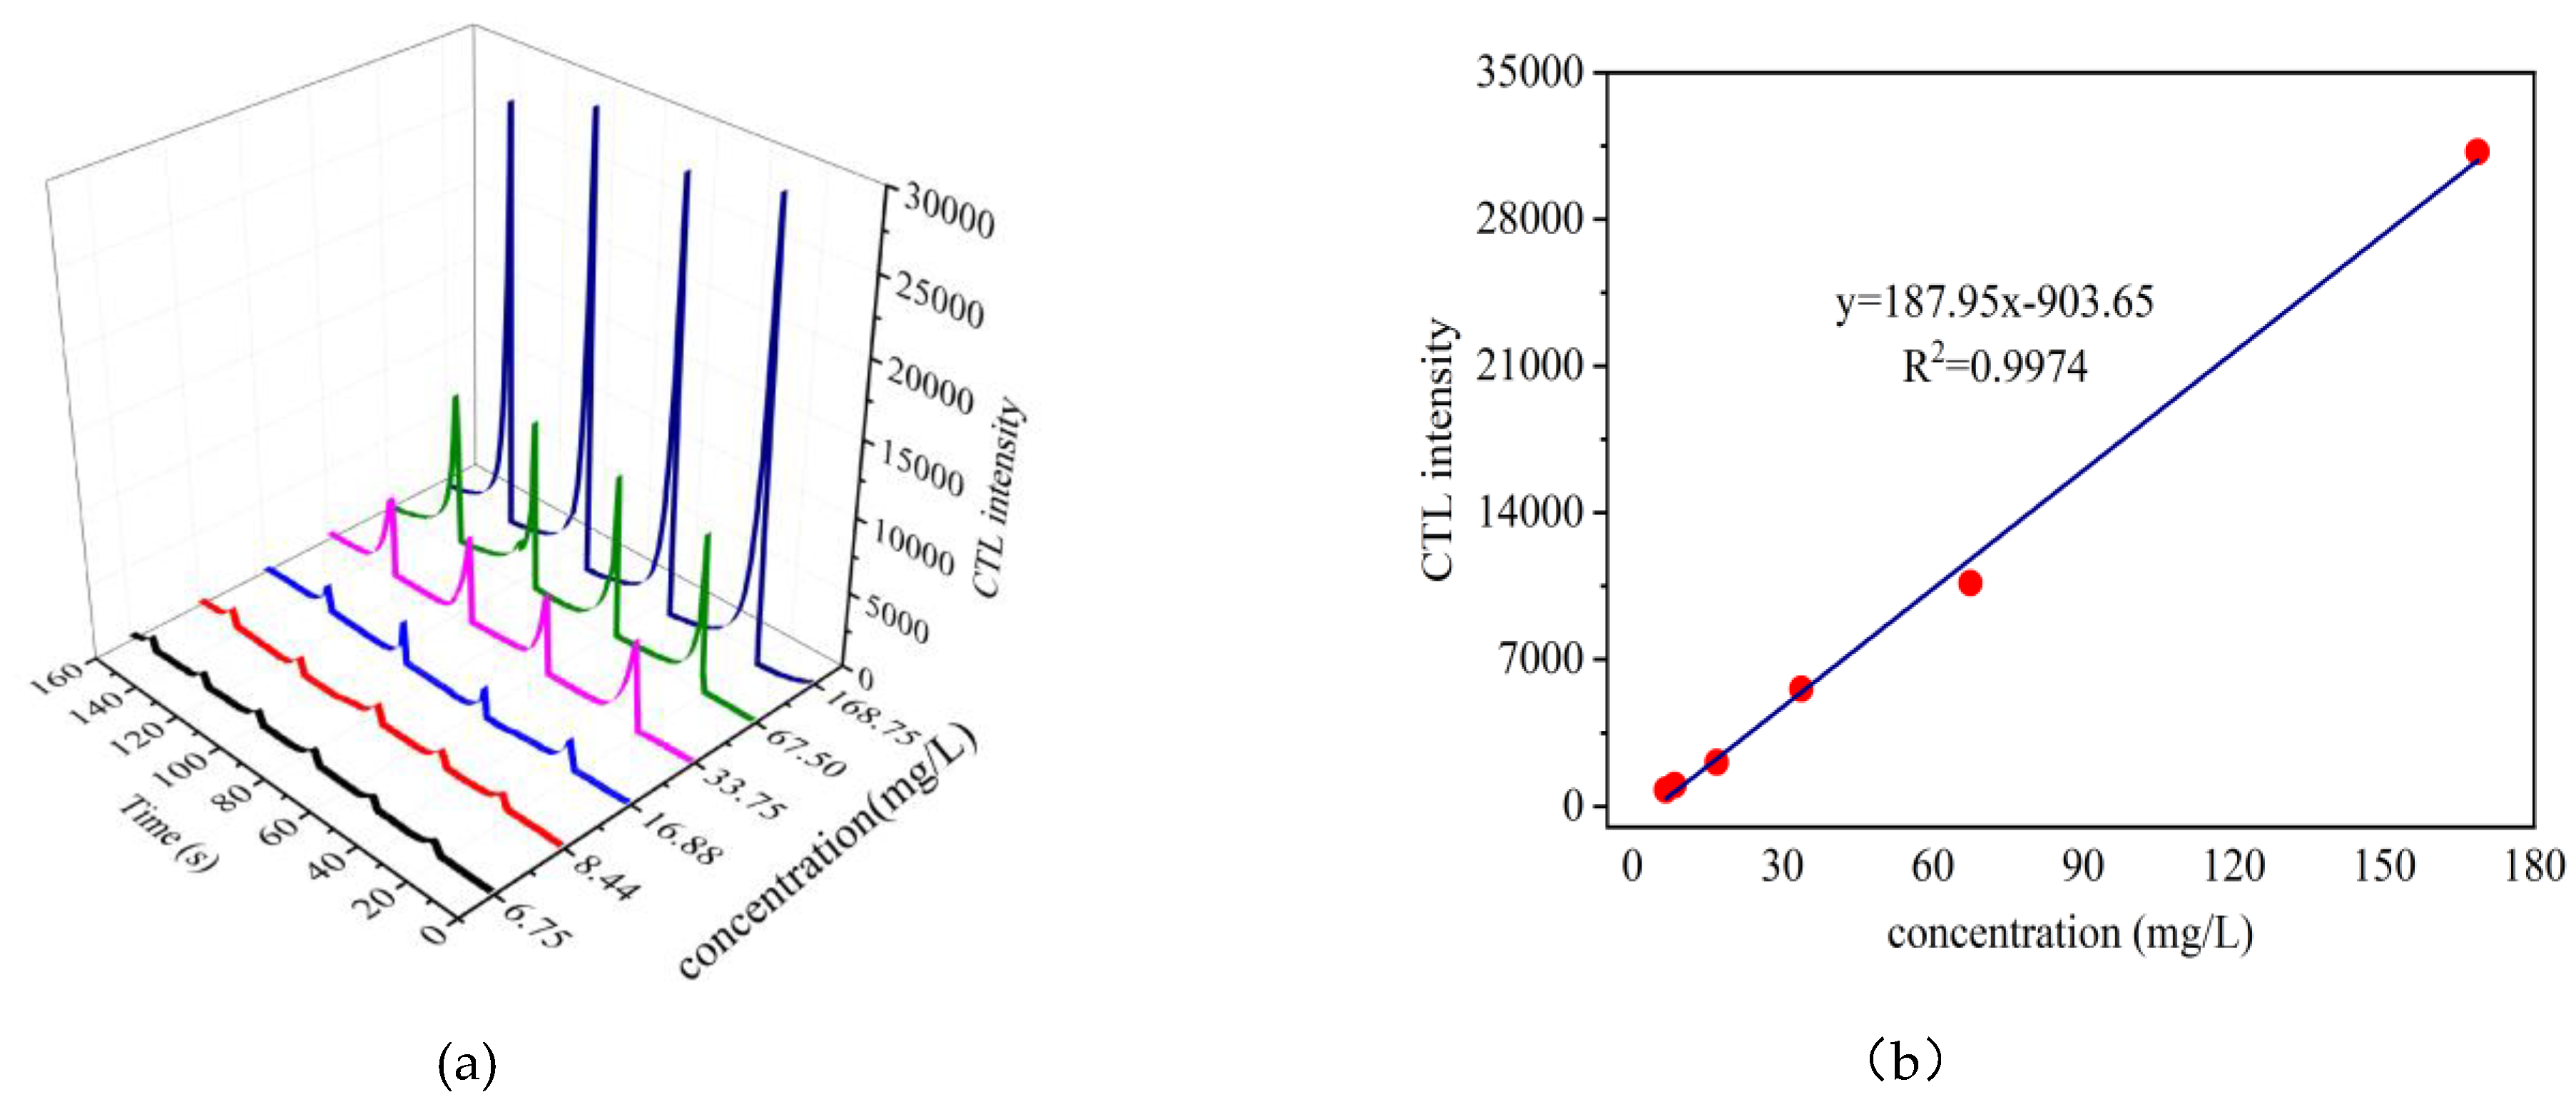
3.5. The Correspondence between the CTL Intensity and the Concentration of the Analyte

Under optimal conditions, the correspondence between the signal strength and the CS2 concentration of the CTL sensor based on CdS/SnS composites in the CS2 concentration range of 6.75~168.75 ppm was studied. Different concentrations of the compound vapor react with nanocomposites so that the sensor obtains different responses, because the equilibrium process of the CTL reaction is different at different concentrations. There is a dynamic equilibrium between the adsorption and desorption of gases on the surface of the sensing material. When the concentration of the compound vapor is low, the equilibrium process of the reaction takes a long time. Therefore, this stage of adsorption plays a leading role in the entire gas detection process. Conversely, when the concentration reaches a higher level, the reaction quickly reaches equilibrium, and then gas desorption dominates the sensor’s detection process [38]. Figure 9a shows the CTL signal produced by different concentrations of CS2. The intensity of the CTL signal increases significantly as the concentration increases. Figure 9b shows the correspondence between the CTL intensity and the concentration of CS2. It can be seen that the CTL intensity and the concentration of CS2 show a good linear relationship; the linear regression equation is y = 187.95x − 903.65 (R2 = 0.9974), where y is the average CTL intensity with CS2 on the surface of the two-dimensional nanocomposite after four parallel experiments, x is the CS2 concentration, and R is the correlation coefficient. The LOD is calculated according to the following formula, and the value is 0.96 ppm (S/N = 3).
D = 3 N × Q I
where Q is the minimum intake air concentration within the detection range; N is the noise corresponding to the minimum intake concentration within the detection range; and I is the signal response value corresponding to the minimum intake air concentration within the detection range.

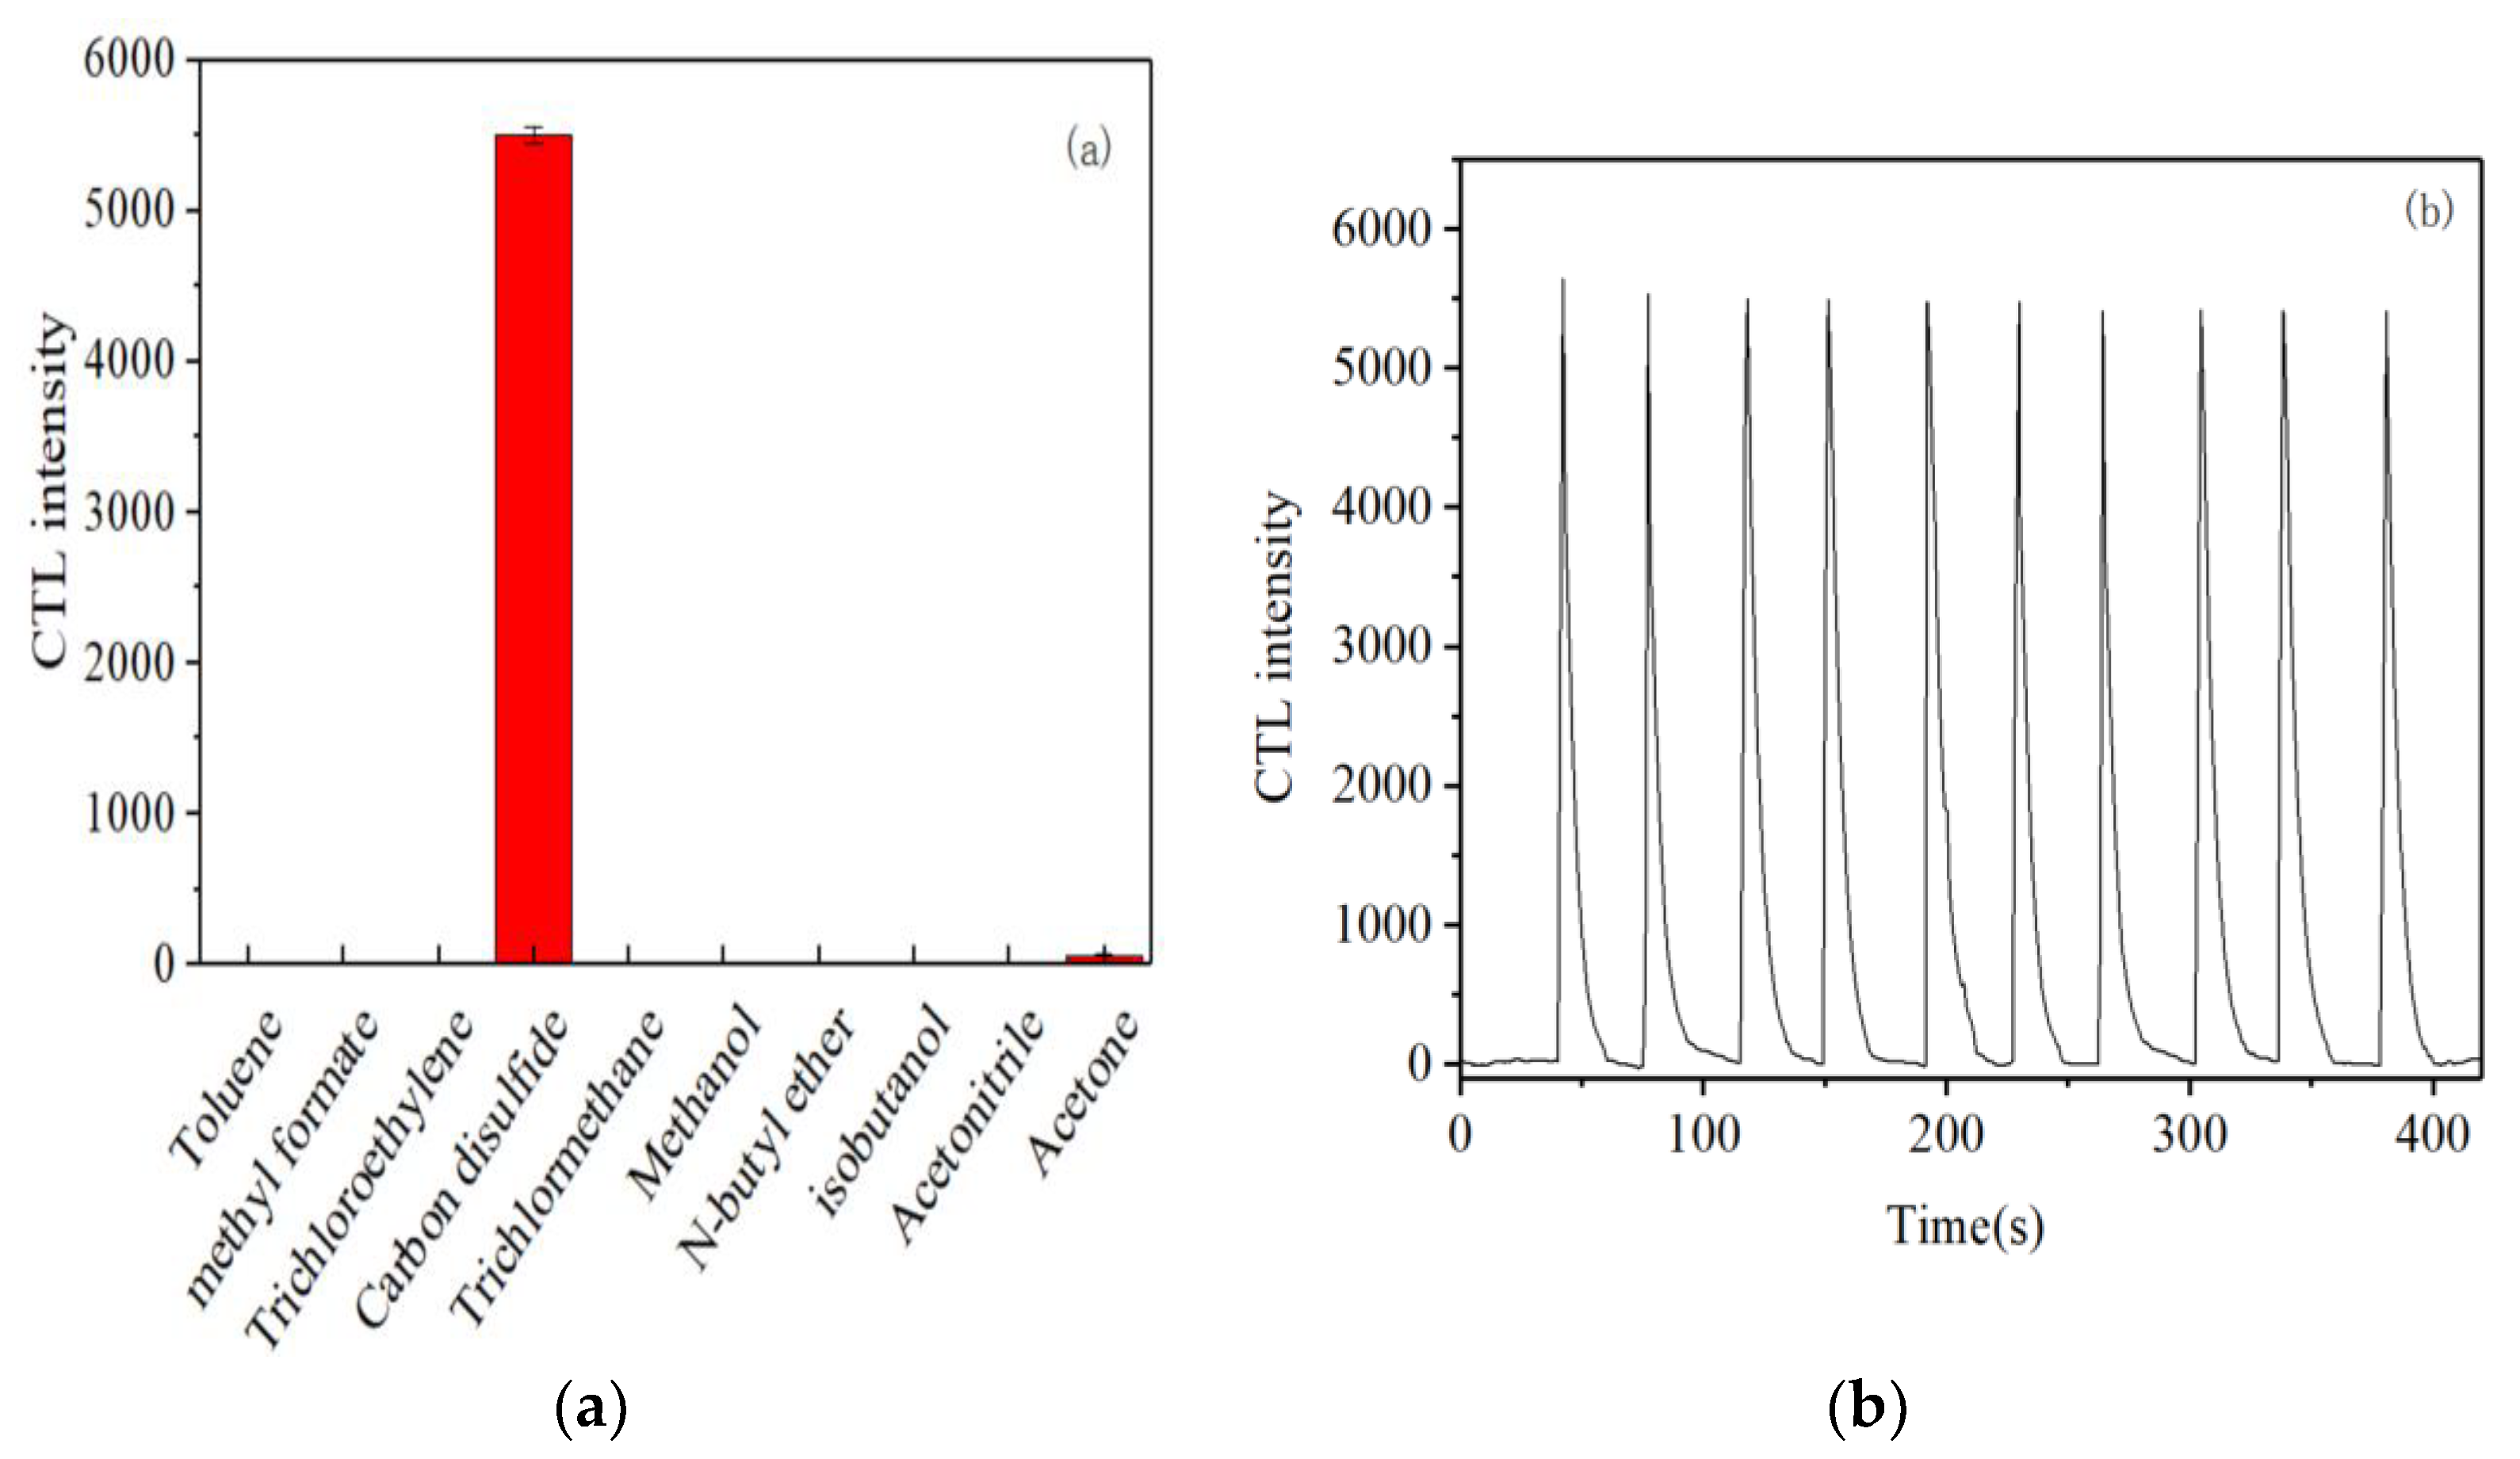
3.6. Selectivity and Lifetime of the Sensor

In addition to high stability and good reproducibility, excellent selectivity is also critical for sensors, especially when applied to actual inspections. Therefore, under optimal operating conditions, the selectivity of CdS/SnS sensing for CS2 can be studied using a series of possible interfering substances. The selectivity test was carried out under the same experimental conditions, as shown in Figure 10a. It can be observed that toluene, methylformate, trichloroethylene, propylene oxide, methanol, n-butyl ether, isobutyl alcohol and acetonitrile do not interfere with the sensor. The acetone signal strength is only 1% of that of CS2. Based on the above analysis, it is shown that the sensor detects CS2 with high selectivity.
In addition to excellent selectivity, the service life is also critical to the sensor. In order to test the life of the CdS/SnS sensor, the sensor was allowed to work for 8 h a day for two weeks. CS2 vapor was continuously introduced into the reaction chamber, and the CTL intensity was measured every 2 h. The CTL intensity remained almost unchanged for two weeks under high-intensity long-term operation; 10 sets of representative data were taken, and the results are shown in Figure 10b. The CTL signal intensity change is small, the repeatability is better, the relative standard deviation (RSD = 4.82%) of the 10 measurements is less than 5%, and the results show that the CTL sensor has good stability and a long service life in detecting CS2.

3.7. Mechanism Discussion

According to the commonly accepted mechanism of the CTL reaction [39], oxygen flows through the surface of the catalyst along with the carrier gas; excited intermediates are formed during the catalytic oxidation of CS2 and the surface of the sensitive material, and luminescence can be detected when these excited intermediates fall to the ground state. Based on a comprehensive study of multiple gas sensitivity tests, the possible mechanism of CS2 CTL is speculated.
For CTL gas-sensitive sensors, the CTL reaction that occurs on the surface of the solid catalytic sensing material can be divided into three steps: (1) the adsorption process, (2) the reaction process and (3) the desorption process. The first is the adsorption stage, in which O 2 molecules enter the reaction chamber with the carrier gas, adsorb on the surface of the sensing material and extract free electrons from the conduction band of the material to form chemically adsorbed oxygen species ( O 2 , O and O 2 ), where O is considered to be the main reaction that is produced and plays a key role. As a representative n-type semiconductor gas-sensing material, SnS more readily exchanges lattice oxygen with oxygen in the air, improving the conversion efficiency of oxygen ions. The conversion process of oxygen ions is as follows [40,41]:
O 2   ( gas )     O 2   ( ads )
O 2   ( ads )   +   e     O 2   ( ads )
O 2   ( ads )   +   e     2 O   ( ads )
O   ( ads )   +   e     O 2   ( ads )
The more oxygen vacancies on the surface of the material, the higher the adsorbed oxygen content on the surface of the material. Oxygen vacancies are conducive to the working effect of CTL sensors, which can improve the type and content of oxygen adsorbed on the surface. When Cd2+ ions are present in the material, oxygen vacancies are bound to occur in order to maintain their electrical neutrality. Oxygen vacancies are an excellent adsorption site, which can increase the adsorbed oxygen content on the surface and accelerate the migration rate of oxygen. Oxygen atoms are important participants in the electron exchange between sensing materials and gas molecules, so the increase in the type and content of adsorbed oxygen plays a crucial role in improving the performance of CTL sensors [42].
Element doping is now considered to be a method that can effectively enhance the CTL gas-sensing performance. With the increase in the Cd element doping ratio, more O 2 molecules will be adsorbed on the surface of the composite, more electrons ( e ) will be captured from the conduction band (EC) of the sensing material, and the conversion efficiency of electrons will increase. At the same time, O 2 molecules are also used to convert the target gas into SO 2 later, and the CTL phenomenon is formed by the state change of the product [43].
The most direct principle of CTL is the luminescence phenomenon produced when the excited state products produced during the catalytic oxidation reaction return to the ground state. In the catalytic oxidation of CS2, CS2 gas molecules are adsorbed on the surface of CdS/SnS composites and further react with the adsorbed O ions to form excited CS2 ( SO 2 *), and the excited SO 2 * molecules then return to the basic state and emit light. Therefore, in this experiment, the possible reaction process of CS2 is:
C S 2   ( gds )   C S 2   ( ads )
C S 2   ( ads )   C S 4 + + S 4
C S 4 + + 4 O   C O 2 + S O 2
S O 2 *     S O 2 + hv

4. Conclusions

A CdS/SnS composite was prepared, and the cataluminescence properties were investigated. The optimal reaction conditions are determined to be 162 °C and 280 mL/min. Under the optimized experimental conditions, different concentrations of carbon disulfide gas are introduced into the reaction chamber, and in the range of 6.75–168.75 ppm, the cataluminescence intensity is proportional to the concentration of the gas to be measured, with a linear regression equation of y = 187.95x − 903.65 (R2 = 0.9974, n = 6), along with a low detection limit of 0.96 ppm. The selectivity and stability of the sensor were studied, and the selectivity study shows that the sensor has high selectivity for carbon disulfide and can be used for the detection of carbon disulfide. The relative standard deviation (RSD = 4.82%) measured continuously in the stability experiment is less than 5%. The as-prepared nanocomposites working with carbon disulfide could produce a strong cataluminescence phenomenon, which shows that CdS/SnS nanojunctions may be a new cataluminescence-sensitive material, which provides a promising method for the development of high-performance low-temperature cataluminescence carbon disulfide detectors.

Author Contributions

Conceptualization, B.S. and J.L.; methodology, B.S., G.S., Z.T., P.Z., Y.G., S.Z. and J.L.; validation, B.S., Z.T., P.Z., Y.G. and J.L.; formal analysis, G.S., Z.T., P.Z. and Y.G.; investigation, G.S., Z.T., P.Z., Y.G. and S.Z.; writing—original draft, B.S., G.S. and S.Z.; writing—review and editing, B.S., S.Z. and J.L.; project administration, S.Z.; funding acquisition, B.S. and J.L. All authors have read and agreed to the published version of the manuscript.

Funding

This work was supported by the Project of National Key Research and Development Program (2019YFC0408503), the Natural Science Research Project of the Higher Education Institutions of Anhui Province (KJ2021A0616 and KJ2020A0468), the National Natural Science Foundation of China (52103104 and 61873003), the Natural Science Foundation of Anhui Province (1908085QE241), the first batch of natural science projects supported by surplus funds in 2021 of Anhui Jianzhu University (JZ202129 and JZ202134) and the Scientific Research Start up Foundation for Introduction of Talent, Anhui Jianzhu University (2016QD113).

Institutional Review Board Statement

Not applicable.

Informed Consent Statement

Not applicable.

Data Availability Statement

Not applicable.

Conflicts of Interest

The authors declare no conflict of interest.

References

  1. Colin, R.; Stewart, A.R.; West, J.; Williams, B.P.; Graham, J.H. The Low-temperature Hydrolysis of Carbonyl Sulfide and Carbon Disulfide: A Review. Catal. Today 2000, 59, 443–464. [Google Scholar]
  2. Wrońska-Nofer, T.; Nofer, J.-R.; Stetkiewicz, J.; Wierzbicka, M.; Bolinska, H.; Fobker, M.; Schulte, H.; Assmann, G.; von Eckardstein, A. Evidence for Oxidative Stress at Elevated Plasma Thiol Levels in Chronic Exposure to Carbon Disulfide (CS2) and Coronary Heart Disease. Nutr. Metab. Cardiovasc. Dis. 2007, 17, 546–553. [Google Scholar] [CrossRef]
  3. Xia, G.; Zhou, X.; Hu, J.; Sun, Z.; Yao, J.; Chen, D.; Wang, J. Study on Carbon Disulfide in Waste Gas from Viscose Fiber Production by Liquid Absorption Method. Text. Res. 2021, 5, 52–54. [Google Scholar]
  4. Beauchamp, R.O.; James, S.B.; James, A.P.; Craig, J.B.; Leon, G.; Michael, J.M. A Critical Review of the Literature on Carbon Disulfide Toxicity. Crit. Rev. Toxicol. 1983, 11, 169–278. [Google Scholar] [PubMed]
  5. Graham, D.G.; Amarnath, V.; Valentine, W.M.; Pyle, S.J.; Anthony, D.C. Pathogenetic Studies of Hexane and Carbon Disulfide Neurotoxicity. Crit. Rev. Toxicol. 1995, 25, 91–112. [Google Scholar] [CrossRef] [PubMed]
  6. Chung, C.; Youn, K.; Kim, K.; Park, K. Carbon Disulfide Exposure Estimate and Prevalence of Chronic Diseases after Carbon Disulfide Poisoning-related Occupational Diseases. Ann. Occup. Environ. Med. 2017, 29, 52. [Google Scholar] [CrossRef] [Green Version]
  7. Clark, P.; Dowling, N.I.; Huang, M. Conversion of CS2 and COS over Alumina and Titania Under Claus Process Conditions: Reaction with H2O and SO2. Appl. Catal. B Environ. 2001, 31, 107–112. [Google Scholar] [CrossRef]
  8. Kataoka, H.; Imamura, Y.; Tanaka, H.; Makit, M. Determination of Trace Thiophene and Carbon Disulfide in Benzene by Flame Photometric Gas Chromatography. Chin. J. Anal. Chem. 1975, 6, 31–35. [Google Scholar]
  9. Tang, Y.; Chen, J.; Wu, H.; Yu, J.; Jia, J.; Xu, W.; Fu, Y.; He, Q.; Cao, H.; Cheng, J. Fluorescent Detection of Carbon Disulfide by a Highly Emissive and Robust Isoreticular Series of Zr-Based Luminescent Metal Organic Frameworks (LMOFs). Chemistry 2021, 3, 327–337. [Google Scholar]
  10. Du, Z.; Li, J.; Cao, X.; Gao, H.; Ma, Y. High-sensitive Carbon Disulfide Sensor using Wavelength Modulation Spectroscopy in the Mid-infrared Fingerprint Region. Sens. Actuators B Chem. 2017, 247, 384–391. [Google Scholar] [CrossRef]
  11. Johannes, P.W.; Moser, H.; Lendl, B. Compact Quantum Cascade Laser Based Quartz-enhanced Photoacoustic Spectroscopy Sensor System for Detection of Carbon Disulfide. Opt. Express 2016, 24, 6559–6571. [Google Scholar]
  12. Wang, L. Study on the Detection Method of Carbon Disulfide Based on Ultraviolet Absorption Spectroscopy. Ph.D. Thesis, Harbin Institute of Technology, Harbin, China, 2019. [Google Scholar]
  13. Tan, W.; Tan, J.; Fan, L.; Yu, Z.; Qian, J.; Huang, X. Fe2O3-loaded NiO Nanosheets for Fast Response/recovery and High Response Gas Sensor. Sens. Actuators B Chem. 2018, 256, 282–293. [Google Scholar] [CrossRef]
  14. Ali, F.I.M.; Awwad, F.; Greish, Y.E.; Abu-Hani, A.F.S.; Mahmoud, S.T. Fabrication of Low Temperature and Fast Response H2S Gas Sensor Based on Organic-metal Oxide Hybrid Nanocomposite Membrane. Org. Electron. 2020, 76, 105486–105494. [Google Scholar] [CrossRef]
  15. Sajin, K.; Cui, L.; Murray, E.; Mainardi, D. Kinetics of Nitric Oxide and Oxygen Gases on Porous Y-Stabilized ZrO2-Based Sensors. Molecules 2013, 18, 9901–9918. [Google Scholar]
  16. Zhang, R.; Wang, D.; Wu, Y.; Hu, Y.; Chen, J.; He, J.; Wang, J. A Cataluminescence Sensor Based on NiO Nanoparticles for Sensitive Detection of Acetaldehyde. Molecules 2020, 25, 1097. [Google Scholar] [CrossRef] [Green Version]
  17. Zhu, Y.; Shi, J.; Zhang, Z.; Zhang, C.; Zhang, X. Development of a Gas Sensor Utilizing Chemiluminescence on Nanosized Titanium Dioxide. Anal. Chem. 2002, 74, 120–124. [Google Scholar] [CrossRef]
  18. Hu, J.; Zhang, L.; Lv, Y. Recent Advances in Cataluminescence Gas Sensor: Materials and Methodologies. Appl. Spectrosc. Rev. 2019, 54, 306–324. [Google Scholar] [CrossRef]
  19. Wang, S.; Yuan, Z.; Zhang, L.; Lin, Y.; Lu, C. Recent Advances in Cataluminescence-based Optical Sensing Systems. Analyst 2017, 142, 1415–1428. [Google Scholar] [CrossRef]
  20. Gupta, Y.; Chhaya, R.; Arun, P. Mitigating Reasons for the Poor Performance of n-CdS/p-SnS Solar Cells. Glob. Chall. 2018, 2, 1800017. [Google Scholar] [CrossRef]
  21. Gedi, S.; Reddy, V.R.M.; Pejjai, B.; Jeon, C.W.; Park, C.; Reddy, R.K.T. SnS Thin Film Solar Cells With Zn[1−x]MgxO Buffer Layers. Appl. Phys. Lett. 2013, 102, 193901. [Google Scholar]
  22. Vera, S.; Jaramillo, R.; Katy, H.; Rupak, C.; Riley, E.B.; Jeremy, R.P.; Lee, Y.S.; Sun, L.; Alexander, P.; Park, H.H.; et al. 3.88% Efficient Tin Sulfide Solar Cells using Congruent Thermal Evaporation. Adv. Mater. 2014, 26, 7488–7492. [Google Scholar]
  23. Prasert, S.; Sun, L.; Lee, S.W.; Park, H.H.; Kim, S.B.; Yang, C.; Roy, G.G. Overcoming Efficiency Limitations of SnS-Based Solar Cells. Adv. Energy Mater. 2014, 4, 1400496. [Google Scholar]
  24. Reddy, K.T.R.; Reddy, N.K.; Miles, R.W. Photovoltaic Properties of SnS Based Solar Cells. Sol. Energy 2006, 90, 3041–3046. [Google Scholar]
  25. Feng, J.; Li, X.; Zhu, G.; Wang, Q. Emerging High-Performance SnS/CdS Nanoflowers Heterojunction for Ultrafast Photonics. ACS Appl. Mater. 2020, 12, 43098–43105. [Google Scholar] [CrossRef] [PubMed]
  26. Arulanantham, A.M.S.; Valanarasu, S.; Kathalingam, A.; Shkir, M.; Kim, H.S. Influence of Substrate Temperature on the SnS Absorber Thin Films and SnS/CdS Heterostructure Prepared Through Aerosol Assisted Nebulizer Spray Pyrolysis. Mater. Res. Express 2019, 6, 026412. [Google Scholar] [CrossRef]
  27. Chang, Y.; Wang, J.; Wu, F.; Tian, W.; Zhai, W. Structural Design and Pyroelectric Property of SnS/CdS Heterojunctions Contrived for Low-Temperature Visible Photodetectors. Adv. Funct. Mater. 2020, 30, 2001450. [Google Scholar] [CrossRef]
  28. Liu, Y.; Wang, F.; Wang, X.; Wang, X.; Flahaut, E.; Liu, X.; Li, Y.; Wang, X.; Xu, Y.; Shi, Y.; et al. Planar Carbon Nanotube-graphene Hybrid Films for High-performance Broadband Photodetectors. Nat. Commun. 2015, 6, 8589–8596. [Google Scholar] [CrossRef] [Green Version]
  29. Lim, D.; Suh, H.; Mahesh, S.; Song, G.Y.; Cho, J.Y.; Kim, J.H.; Jang, J.H.; Jeon, C.W.; Cho, A.; Ahn, S.; et al. Kinetically Controlled Growth of Phase-Pure SnS Absorbers for Thin Film Solar Cells: Achieving Efficiency Near 3% with Long-Term Stability Using an SnS/CdS Heterojunction. Adv. Energy Mater. 2018, 8, 1702605. [Google Scholar] [CrossRef]
  30. Ai, J.; Lei, Y.; Yang, S.; Lai, C.; Xu, Q. SnS Nanoparticles Anchored on Ti3C2 Nanosheets Matrix via Electrostatic Attraction Method as Novel Anode for Lithium Ion Batteries. Chem. Eng. 2019, 357, 150–158. [Google Scholar] [CrossRef]
  31. Wang, H.; Shi, X.; Liu, F.; Duan, T.; Sun, B. Non-Invasive Rapid Detection of Lung Cancer Biomarker Toluene with a Cataluminescence Sensor Based on the Two-Dimensional Nanocomposite Pt/Ti3C2Tx-CNT. Chemosensors 2022, 10, 333. [Google Scholar] [CrossRef]
  32. Zhang, Y.; Guo, B.; Hu, L.; Xu, Q.; Li, Y.; Liu, D.; Xu, M. Synthesis of SnS Nanoparticle-Modified MXene (Ti3C2Tx) Composites for Enhanced Sodium Storage. J. Alloy. Compd. 2018, 732, 448–453. [Google Scholar] [CrossRef]
  33. Fan, S.; Yang, H.; Qian, J.; Rahman, M.M.; Ajayan, P.M.; Sun, D. Free-standing SnS/carbonized Cellulose Film as Durable Anode for Lithium-ion Batteries. Carbohydr. Polym. 2020, 255, 117–400. [Google Scholar]
  34. Faruk, B. Tin Sulfide (SnS) Thin-film Solar Cells Deposited by Organic Chemical Vapor Sulfurization Based on CdS and High Transmittance Cd (S,O) n-type Layers with the Superstrate Device Structure. MRS Commun. 2020, 10, 660–666. [Google Scholar]
  35. Qin, W.; Yuan, Z.; Shen, Y.; Zhang, R.; Meng, F. Phosphorus-doped Porous Perovskite LaFe1−xPxO3−δ Nanosheets with Rich Surface Oxygen Vacancies for ppb Level Acetone Sensing at Low Temperature. Chem. Eng. J. 2022, 431, 134–280. [Google Scholar] [CrossRef]
  36. Anfimov, N.; Fedoseev, D.; Rybnikov, A.; Selyunin, A.; Sokolov, S.; Sotnikov, A. Study of Silicon Photomultiplier Performance at Different Temperatures. Nucl. Instrum. Methods Phys. Res. Sect. A Accel. Spectrometers Detect. Assoc. Equip. 2021, 997, 165162. [Google Scholar] [CrossRef]
  37. Meng, F.; Zhang, J.; Zhu, H.; Yuan, Z.; Liu, C.; Qin, W.; Ding, M. MoS2 -Templated Porous Hollow MoO3 Microspheres for Highly Selective Ammonia Sensing via a Lewis Acid-Base Interaction. IEEE Trans. Ind. Electron. 2022, 69, 960–970. [Google Scholar] [CrossRef]
  38. Zheng, H.; Chang, Y.; Zhao, Y.; Li, M.; Wang, C.; Sun, Y.; Liu, J. One-Step Synthesis of Au/SnO2/RGO Nanocomposites and Their VOC Sensing Properties. IEEE Trans. Nanotechnol. 2018, 17, 212–219. [Google Scholar]
  39. Zhou, K.; Ji, X.; Zhang, N.; Zhang, X. On-line Monitoring of Formaldehyde in Air by Cataluminescence-based Gas Sensor. Sens. Actuators B Chem. 2006, 119, 392–397. [Google Scholar] [CrossRef]
  40. Meng, F.; Li, X.; Yuan, Z.; Lei, Y.; Qi, T.; Li, J. Ppb-Level Xylene Gas Sensors Based on Co3O4 Nanoparticle-Coated Reduced Graphene Oxide (rGO) Nanosheets Operating at Low Temperature. IEEE Trans. Instrum. Meas. 2021, 70, 1–10. [Google Scholar] [CrossRef]
  41. Qin, W.; Yuan, Z.; Shen, Y.; Zhang, R.; Meng, F. Perovskite-structured LaCoO3 Modified ZnO Gas Sensor and Investigation on its Gas Sensing Mechanism by First Principle. Sens. Actuators B Chem. 2021, 341, 130–150. [Google Scholar] [CrossRef]
  42. Ji, H.; Qin, W.; Yuan, Z.; Meng, F. Qualitative and Quantitative Recognition Method of Drug-producing Chemicals Based on SnO2 Gas Sensor with Dynamic Measurement and PCA Weak Separation. Sens. Actuators B Chem. 2021, 348, 130–698. [Google Scholar] [CrossRef]
  43. Li, J.; Hu, J.; Yan, S.; Xue, Y.; Tang, S.; Zhang, L.; Lv, Y. A Novel H2S Cataluminescence Sensor Based on ZnMn2O4 Nanoparticles. Microchem. J. 2022, 172, 106990. [Google Scholar]
Figure 1. Schematic view of the BPCL-1 sensor device.
Chemosensors 11 00010 g001
Figure 2. SEM images of (a,b) SnS and (c,d) CdS/SnS.
Chemosensors 11 00010 g002
Figure 3. (a) SEM image; EDS mapping images of (b) S, (c) Cd and (d) Sn; and (e) EDS spectrum of CdS/SnS.
Chemosensors 11 00010 g003
Figure 4. XRD patterns of pure CdS, SnS and CdS/SnS.
Chemosensors 11 00010 g004
Figure 5. XPS spectra of CdS/SnS: (a) survey spectrum of CdS/SnS, (b) Cd 3d, (c) Sn 3d and (d) S 2p.
Chemosensors 11 00010 g005
Figure 6. Comparison of CTL strength of pure SnS and CdS/SnS (flow rate: 280 mL/min; temperature: 162 °C; concentration: 33.75 ppm).
Chemosensors 11 00010 g006
Figure 7. Effect of working temperature on CTL intensity and S/N (concentration: 33.75 ppm; flow rate: 280 mL/min).
Chemosensors 11 00010 g007
Figure 8. Effect of flow rate on CTL intensity and S/N (concentration: 33.75 ppm; temperature: 162 °C).
Chemosensors 11 00010 g008
Figure 9. (a) The CTL intensity of different concentrations of CS2; (b) the calibration curve for CS2.
Chemosensors 11 00010 g009
Figure 10. (a) CTL response of the sensor to different compounds; (b) results obtained from ten repetitions of CS2 determination (flow rate: 280 mL/min; temperature: 162 °C; concentration: 33.75 ppm).
Chemosensors 11 00010 g010
Table 1. The elemental content of CdS/SnS.
ElementWeight %Atomic %
C0.3416.95
O0.7428.73
S0.7029.75
Cd0.677.23
Sn2.5717.34
Total100
Disclaimer/Publisher’s Note: The statements, opinions and data contained in all publications are solely those of the individual author(s) and contributor(s) and not of MDPI and/or the editor(s). MDPI and/or the editor(s) disclaim responsibility for any injury to people or property resulting from any ideas, methods, instructions or products referred to in the content.

