
Nanostructured Metal Oxide Semiconductors towards Greenhouse Gas Detection


Lince Laboratory, INSTM R.U, Department of Applied Science and Technology, Politecnico di Torino, Corso Duca Degli Abruzzi 24, 10129 Torino, Italy
*
Author to whom correspondence should be addressed.
Chemosensors 2022, 10(2), 57; https://0-doi-org.brum.beds.ac.uk/10.3390/chemosensors10020057
Submission received: 14 December 2021
/
Revised: 22 January 2022
/
Accepted: 25 January 2022
/
Published: 30 January 2022
(This article belongs to the Special Issue Functional Nanomaterials for the Detection of Greenhouse Gases)
Abstract
:Climate change and global warming are two huge current threats due to continuous anthropogenic emissions of greenhouse gases (GHGs) in the Earth’s atmosphere. Accurate measurements and reliable quantifications of GHG emissions in air are thus of primary importance to the study of climate change and for taking mitigation actions. Therefore, the detection of GHGs should be the first step when trying to reduce their concentration in the environment. Throughout recent decades, nanostructured metal oxide semiconductors have been found to be reliable and accurate for the detection of many different toxic gases in air. Thus, the aim of this article is to present a comprehensive review of the development of various metal oxide semiconductors, as well as to discuss their strong and weak points for GHG detection.
1. Introduction
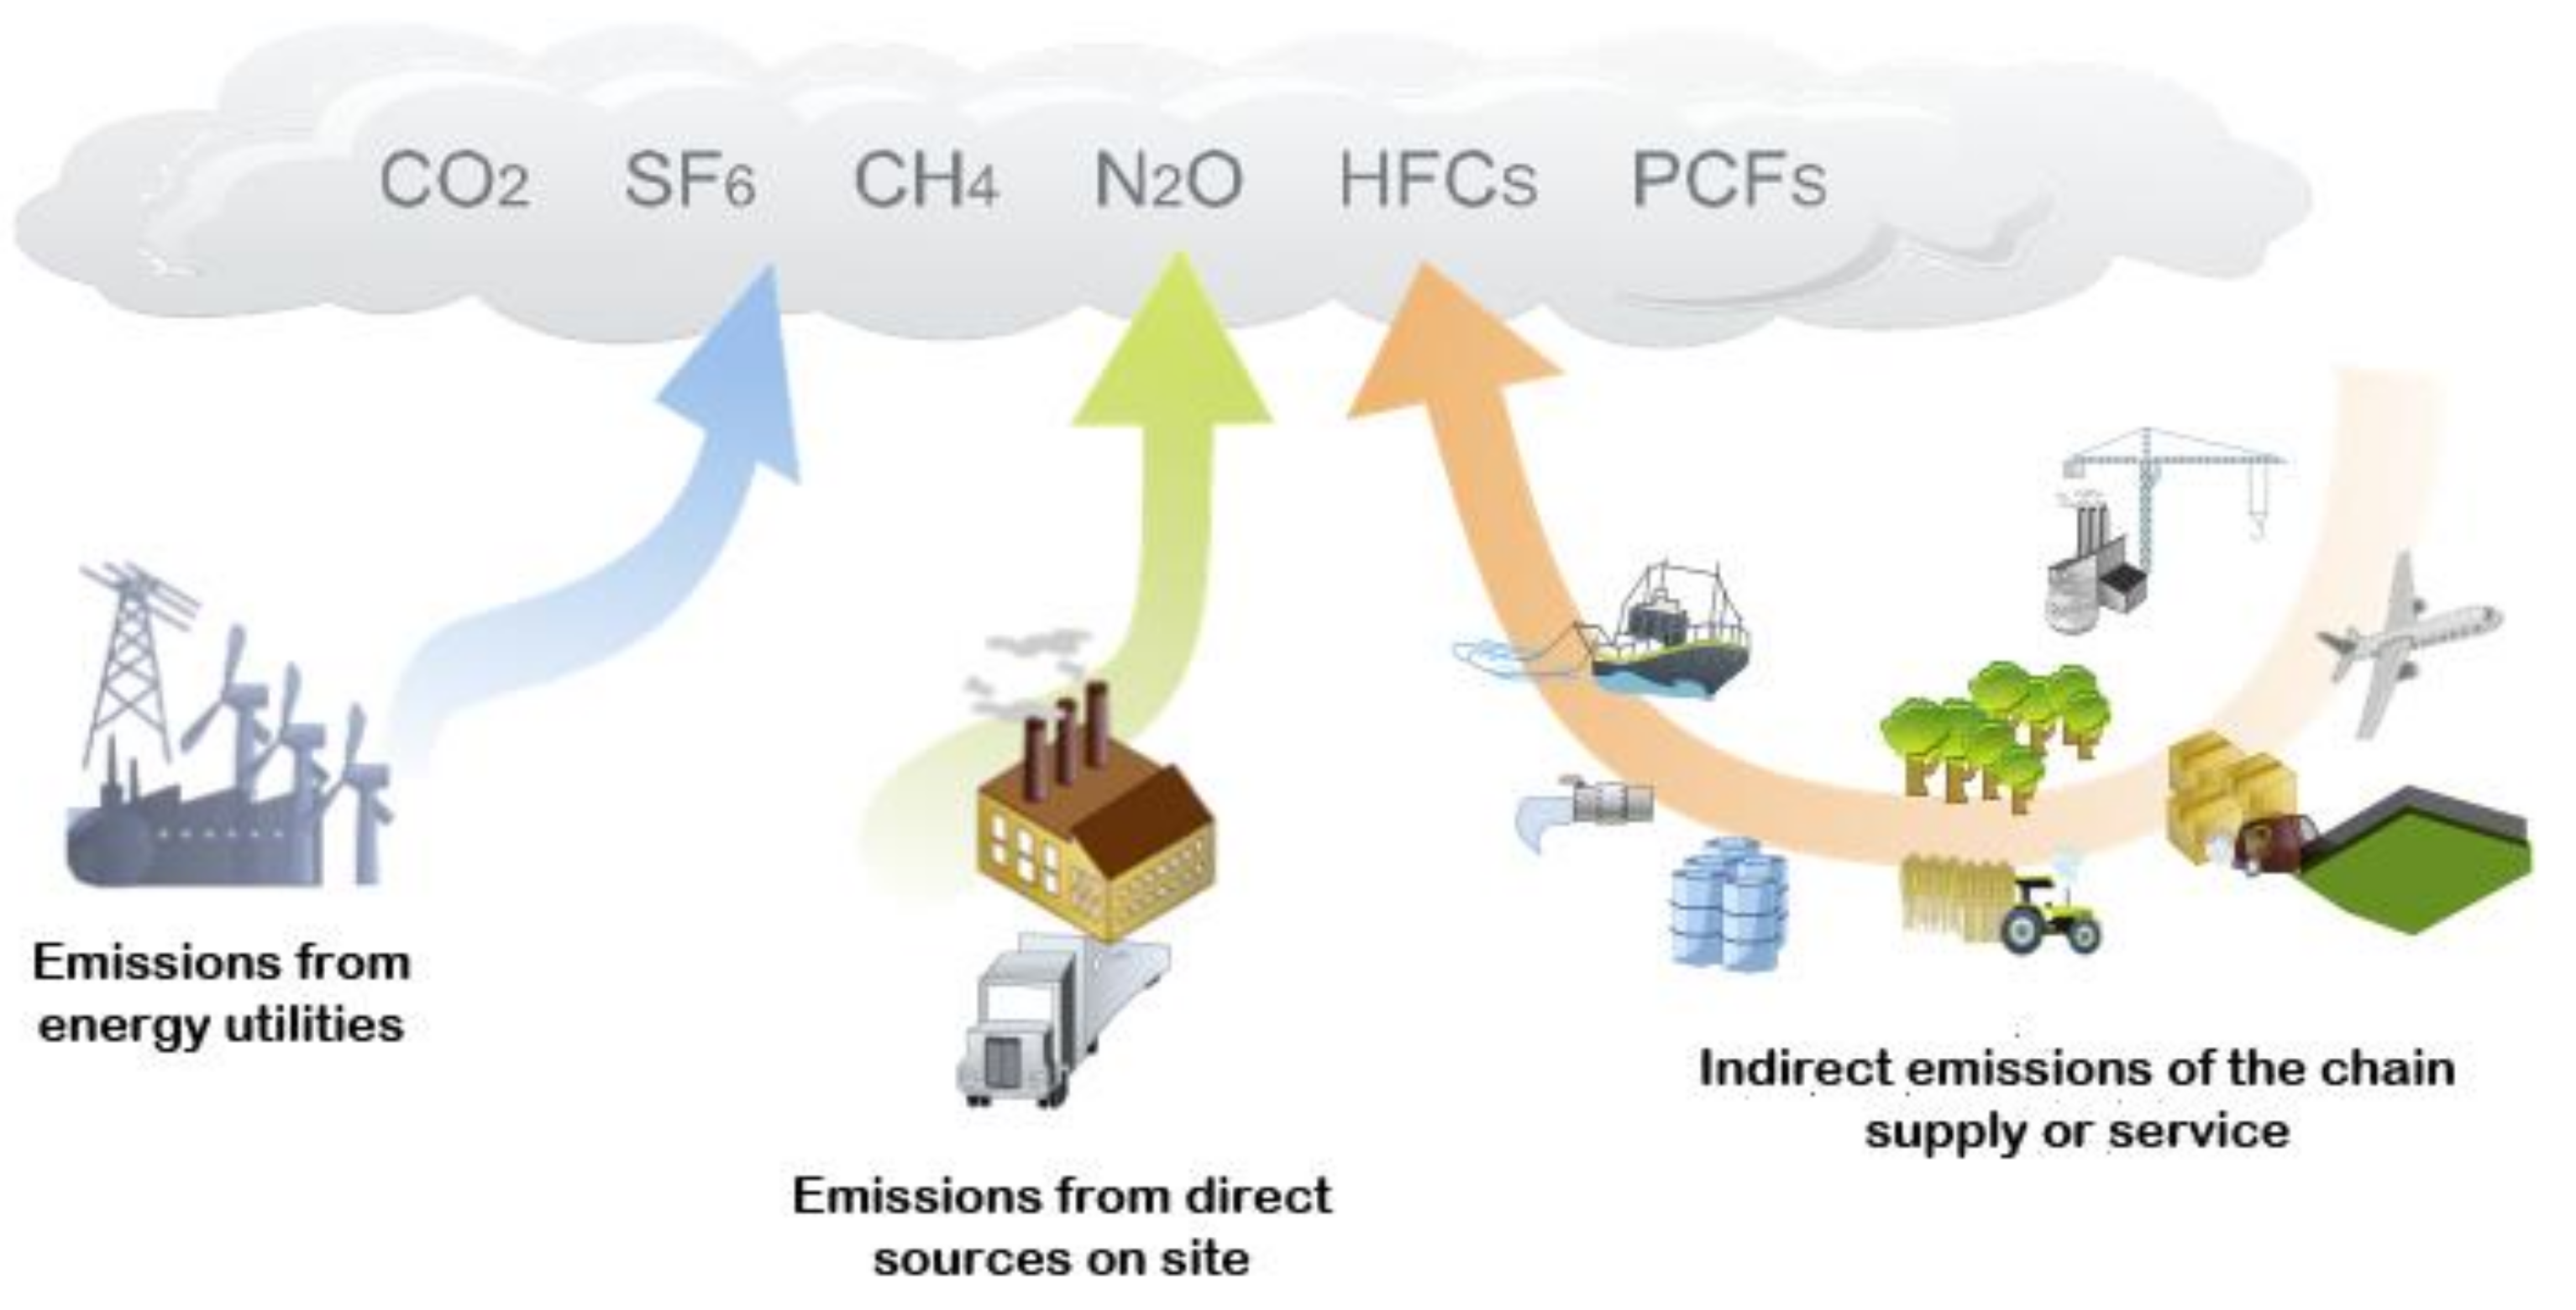
Greenhouse gases (GHG) are compounds that absorb infrared radiation and prohibit it from radiating out into space and subsequently trap the heat in the atmosphere, contributing to global warming. Common GHGs are carbon dioxide (CO2), methane (CH4), nitrous oxide (N2O) and fluorinated gases (F-gases: Hydrochlorofluorocarbons (HFCs), perfluorocarbons (PFCs), sulfur hexafluoride (SF6) and nitrogen trifluoride (NF3)). Figure 1 shows some activities responsible for greenhouse gas emissions into the atmosphere.
The main reasons for the increment in CO2 concentration in the atmosphere are fossil fuel and land-use change by about two-thirds and one-third, respectively [2]. During the first three decades about half of released CO2 is removed, whereas a further 30% is removed over a few centuries and the remainder will stay in the atmosphere for many thousands of years [2].
Methane is the main component of natural gas which has been extensively utilized in domestic and industrial applications as a source of energy. It is emitted by both natural and anthropogenic sources with 40% and 60% proportions, respectively [3]. In comparison with carbon dioxide, CH4 has more potential for global warming, so that any rapid increase in its concentration in the atmosphere would be devastating. Thus, at the recent COP26 (Conference of the Parties in Glasgow), over 100 countries signed up to the Global Methane Pledge to decrease global CH4 emissions by 30% by 2030.
Agriculture, such as soil and management of animal manure, is the main anthropogenic source of N2O. Moreover, it is naturally emitted from a broad range of biological sources that exist in soils and oceans. Nevertheless, the major contributions of N2O are due to fossil fuel combustion, sewage treatment and chemical industrial productions such as nylon [4]. Nitrous oxide has a noticeable effect on climate change, global warming and stratospheric ozone layer depletion. In comparison with carbon dioxide, N2O causes about 300 times atmosphere warming per unit weight, and it can remain in the atmosphere for up to about 114 years [2,5].
Fluorinated gases are synthetic gases used in industrial applications (as substitutes for ozone-depleting substances such as chlorofluorocarbons (CFCs), hydrochlorofluorocarbons (HCFCs), and halons) since they are not harmful to the atmospheric ozone because they do not damage the atmospheric ozone layer. Hydrofluorocarbons (HFCs) are, for example, extensively applied in industrial and commercial refrigeration systems, heat pump equipment and air conditioners. In addition, HFC gases are used as blowing agents for fire extinguishers, solvents, foams and aerosol propellants. Perfluorocarbons (PFCs) find many applications such as cosmetics, as well as in the pharmaceutical, refrigeration and electronic industries. These gases are also by-products of the aluminum smelting process (like CF4, carbon tetrafluoride, PFC-14, which is the most abundant perfluorocarbon in the atmosphere). They can be found in old fire protection systems too [6]. PFCs can also be used as chemical tracer molecules to monitor the movement of supercritical CO2 for carbon capture and sequestration purposes. To this aim, usually, a sample of carbon-based sorbents is collected from either soil gas or the atmosphere and then analyzed in a laboratory [7]. C2F6 (perfluoroethane, PFC-116) is released predominantly during aluminum production and semiconductor manufacturing. Among the PFC group, C3F8 (perfluoropropane, PFC-218) is the least abundant and is released during the production of semiconductors and utilized as a refrigerant as well [8]. In comparison with CO2 gas, F-gases such as SF6 have a significant role in global warming (23,000 times more than CO2). From a climate overview, hydrofluorocarbons are by far the most relevant fluorinated gases with a short atmospheric lifetime. In contrast, PFC gases, including CF4, C2F6 and C3F8, are long lived and they can remain in the atmosphere for about 50,000, 10,000 and 2600 years, respectively.
One of the important GHGs is ozone that is formed and destroyed through the chemical reactions of other pollutants, including volatile organic compounds and NOx [2,9]. Other chemically reactive gases such as sulfur dioxide and carbon monoxide with short atmospheric lifetime are commonly removed by raining or natural oxidation processes, so they have a variable concentration in the air
Table 1 presents some GHGs with their emission percentage in 2019 [10]. As can be seen, the highest and lowest emission percentage of greenhouse gases are attributed to carbon dioxide and CFC11, respectively.
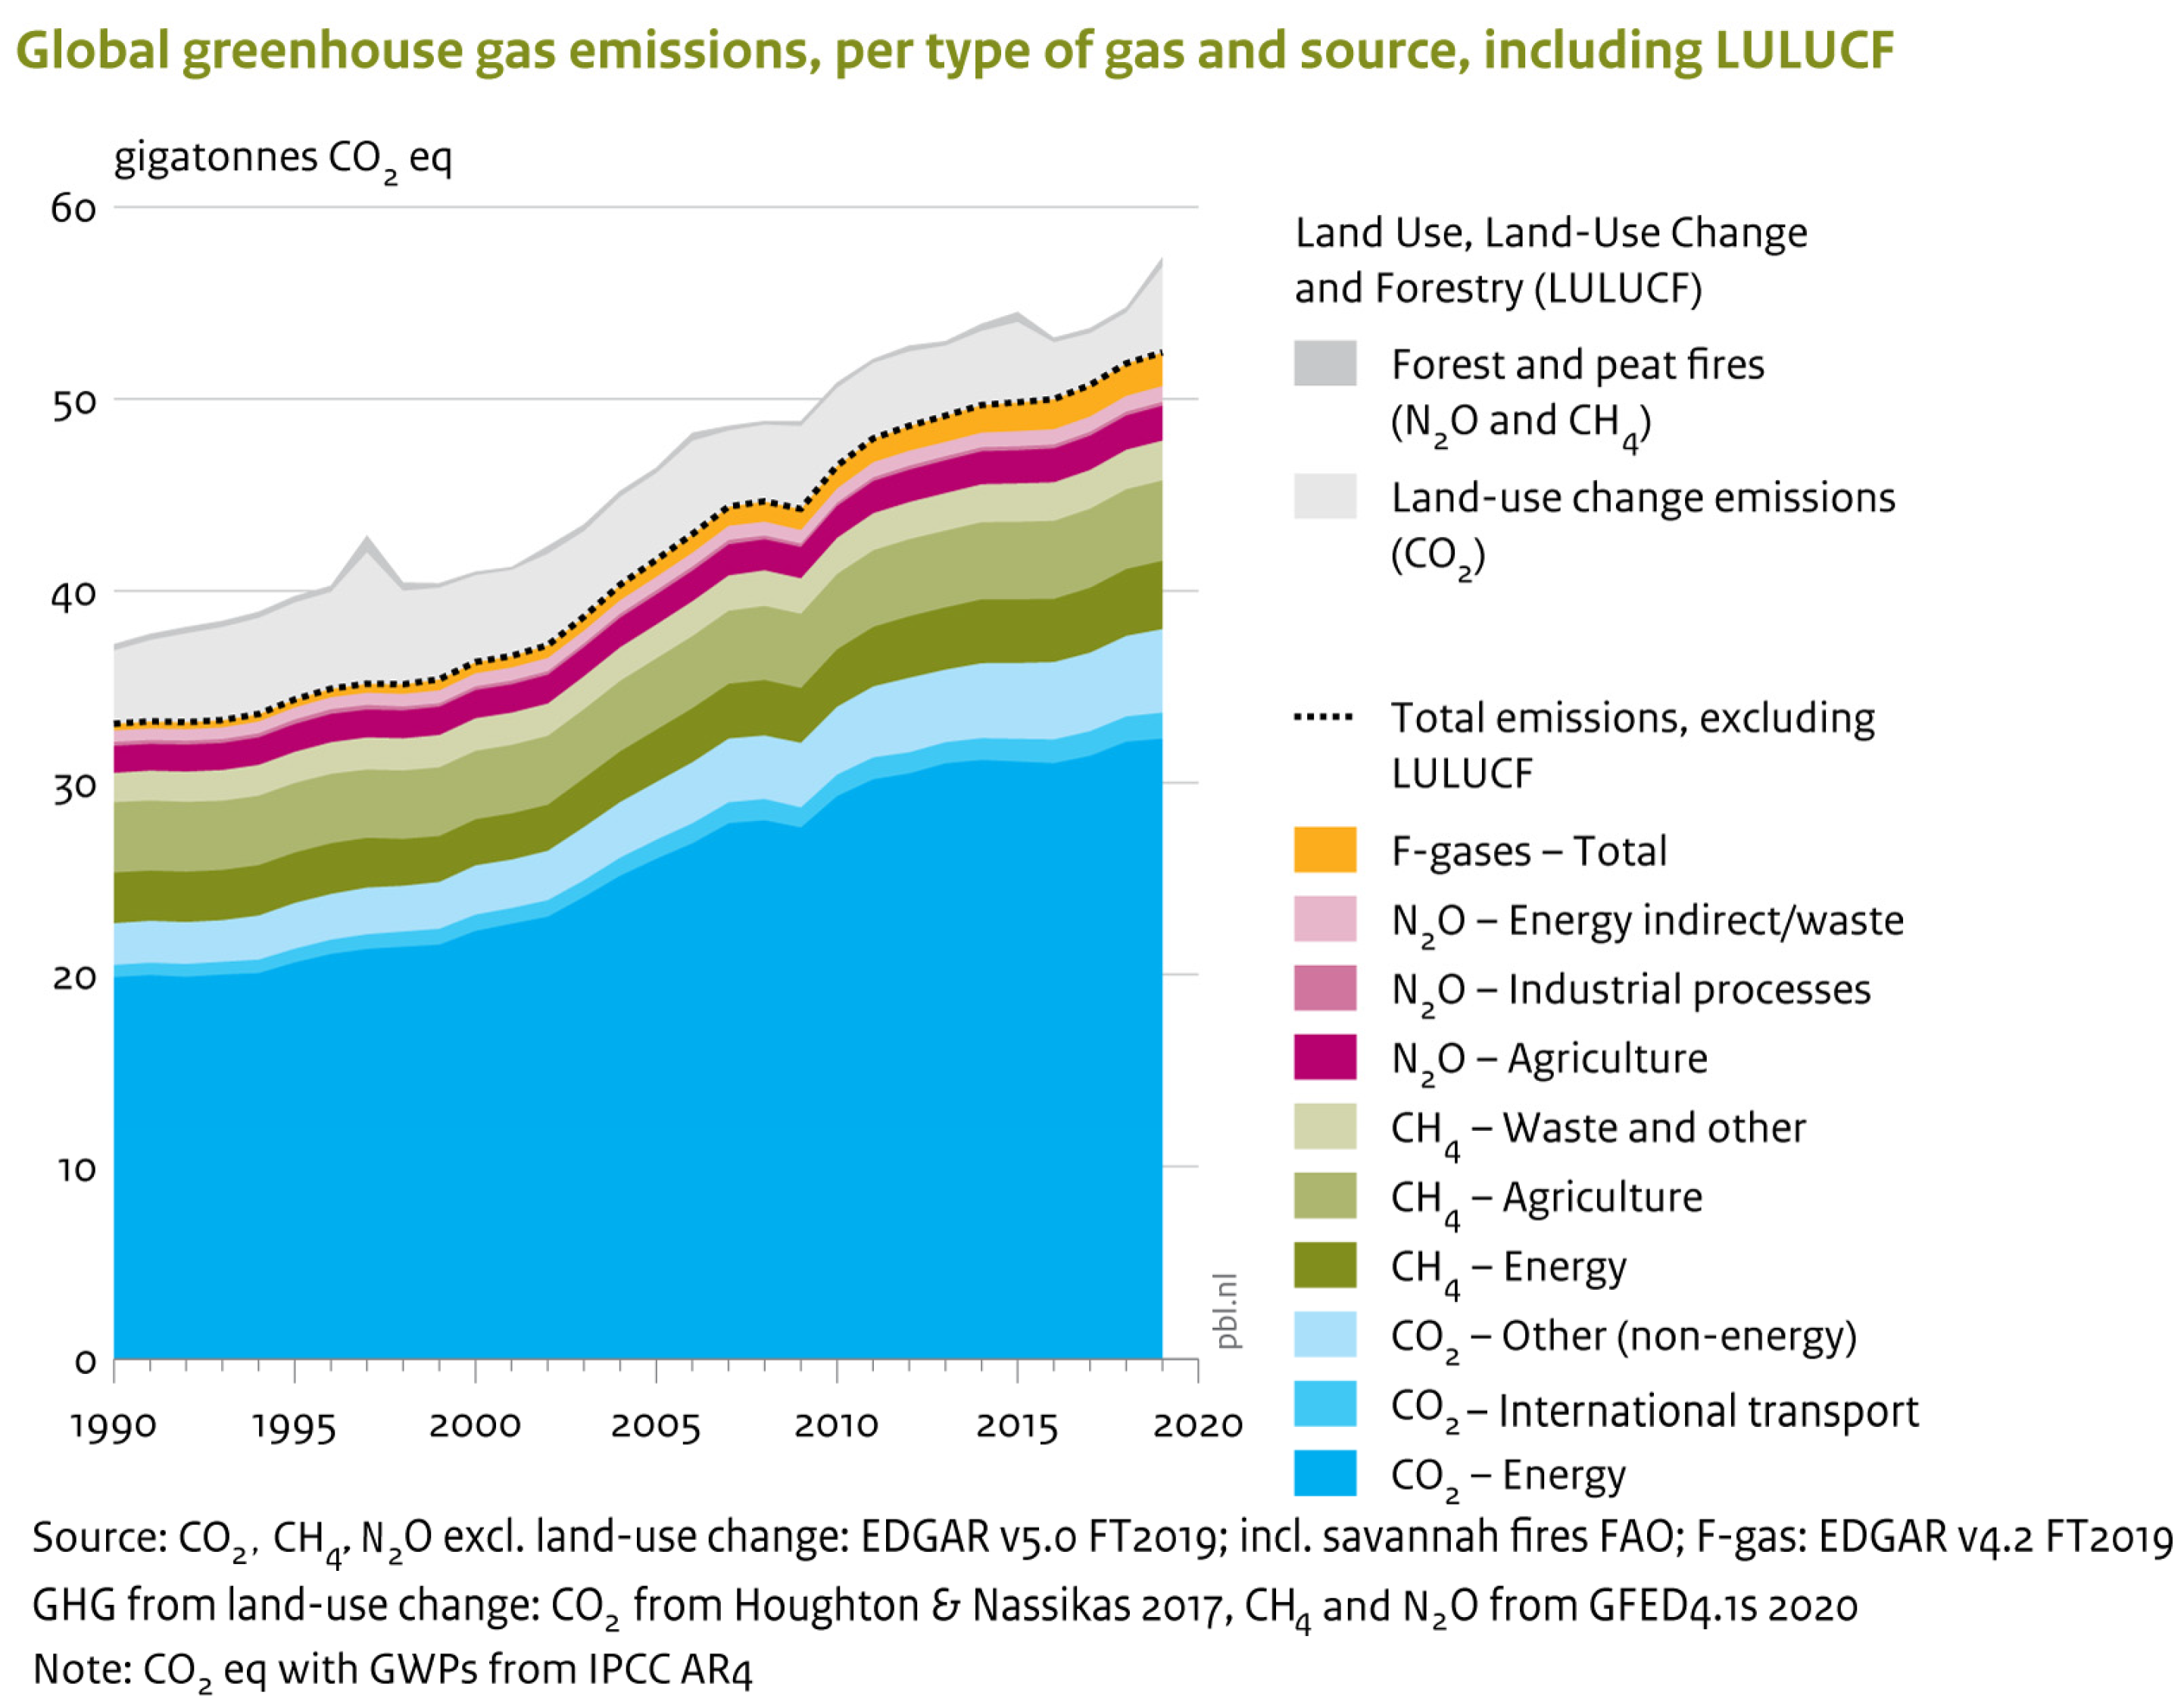
As can be observed in Figure 2, in comparison to 2012, the global emissions of GHGs (excluding land-use change) increased to 52.4 gigatonnes of CO2 equivalent (GtCO2 eq) in 2019 with a rate of 1.1% per year. This was mainly due to the increase in CO2 and CH4 emissions to 0.9% and 1.3%, respectively. Methane and carbon dioxide have an approximate share of 19% and 73%, respectively, and are by far the most prominent greenhouse gases. In addition, in 2019, the emission of F-gases (3% share) and N2O (6% share) have grown by a respective 3.8% and 0.8%. As can be obviously seen in Figure 2, in 2019, the total emission of GHGs (except those from land-use change) had 59% and 44% growth compared to 1990 and 2000, respectively. However, the reported emission growth in 2019 was equal to 1.1%, like the average annual growth rate between 2012 and 2019.
The most significant effects of increasing concentration of greenhouse gases in the Earth’s environment are the following [12,13]:
- Global warming,
- Intense droughts,
- Severe storms,
- Glaciers melting,
- Depletion of the ozone layer, which can occur by emission of CCl4, CFCs and HCFCs,
- Changing the cycle of plant life and rain patterns,
- Rising sea levels and warmer oceans,
- Changing the lives of wildlife species.
For these reasons, already in 1997, the Kyoto Protocol tried to mitigate the emissions of the six main greenhouse gases, namely CO2, N2O, CH4 and F-gases (HFCs, PFCs and SF6). In 2015, the Paris Agreement was adopted because of the irreversible losses and damages caused to nature and society by climate change. Together with increasing pressure on natural resources and land area associated with the loss of species and ecosystems, climate change is a serious threat to the world’s capacity to provide clean water, sufficient food and safe homes. Thus, the goal of the Paris Agreement was to limit the increase in the global average temperature to well below 2 °C (ideally 1.5 °C) above pre-industrial level. To achieve these long-term temperature targets, the parties agreed to reach their peaks of GHGs emissions as soon as possible and then to cut them drastically in the second half of the 21st century. Several countries, including the European Union (EU), have committed to be climate neutral by 2050 or later. These targets mean that a balance between anthropogenic releases and withdrawals by GHG sinks will have to be reached soon [14]. Despite the negative effect of GHGs, such as climate change, global warming, rise of ocean levels and environmental degradation, their presence in the atmosphere is vital to provide a habitable temperature. If the concentration of GHGs in the atmosphere becomes totally zero, the average surface temperature of the Earth would be about −18 °C [15].
In order to verify estimations of global emissions, it is essential to measure the concentration of GHGs in the air. To this aim, innovative, cheap, robust and accurate sensors are needed, and metal oxide (MOX)-based sensors have the potential to fulfil these requirements [13]. A gas sensor is a device for both qualitative and quantitative detection of the volatile substances in the vapor phase. In general, gas sensors are composed of a receptor and a transducer. A semiconductor gas sensor can be considered as a sensor including a semiconductor material which works as a receptor and/or transducer. Semiconductors are divided into two groups of oxides and non-oxides which are commonly based on silicon. Oxide semiconductors can be used as a receptor/transducer, while non-oxide ones cannot work as receptors because of the presence of an insulating layer [16].
Over the past few decades, most studies have focused on developing various types of sensors by applying different sensing materials and transduction stages [17]. In addition, an increasing number of papers investigated metal oxide semiconductor materials as gas sensors in environmental monitoring and in industrial applications due to their advantages such as low cost, easy synthesis methods, simplicity of use, fast recovery speed, non-toxicity, their abundance on earth, easy underlying mechanism, production of small devices, long lifetime and superior performance in detecting a wide range of target gases such as flammable and toxic gases. Of the many studied metal oxides, n-type oxides (like SnO2, In2O3, WO3, ZnO and γ-Fe2O3), as well as p-type oxides (like CuO and Co3O4) showed interesting gas sensing features. However, due to stability issues, when operating at high temperatures, only SnO2, In2O3 and WO3 have been adopted in commercial sensors [16].
The literature on MOX-based sensors has provided evidence that they have excellent sensitivity concerning many greenhouse gases (mainly, CO2, CH4, O3 and N2O) as well as a great response with the variation in the concentration of target gas and working temperature of the device. Nonetheless, MOX-based gas sensors need further improvement in their performances to accurately monitor greenhouse gases [18,19,20]. Hence, the aim of this paper is to overview the latest achievements (in the last decade) in the application of nanostructured metal oxide semiconductor gas sensors for the detection of the main GHGs such as CO2, CH4, N2O and fluorinated gases (F-gases).
2. Sensing Mechanism and Parameters of Gas Sensors
Chemoresistive sensors are generally made of a sensing film deposited on an electrically insulating layer (also called the substrate) provided with electrodes. This device can incorporate a heater, separated from the electrodes by the substrate [21]. The electrodes utilized for the readout of sensor resistance can be applied on one or two-electrode configurations. In a one-electrode configuration, a spiral heater based on noble metals (platinum, palladium and gold) is embedded inside the sintered ceramic bead, whereas in a two-electrode configuration, two electrodes are deposited on top or underneath the sensing material layer. As can be seen in Figure 3a, cylindrical type electrode is composed of a cylindrical alumina substrate with the electrode made of platinum deposited on it or a wire of Pt wound up around it. In this electrode, the sensing layer can be deposited on the platinum film or on the Al2O3 substrate. In disk type electrode (Figure 3b) the sensing material is in the form of a pellet with electrodes deposited on the two sides of the disk. The third electrode type is known as a parallel plate (Figure 3c), which has a planar substrate with a sensing layer. Then, two metal electrodes are deposited on both edges of the active film. Planar-type gas sensors consist of two electrodes that comb parallel to each other. This type of sensor can also be made of a sensing film that is deposited over inter-digitated electrodes (IDE s) as shown in Figure 3d [22].
In the case of metal oxide semiconductor sensors, the sensing mechanism is defined based on reduction-oxidation reactions between the target gas and the oxygen species, which are adsorbed on the surface of the sensing material. Details on sensing models can be found in several books and featured papers [21,23,24,25,26,27]. MOX sensors detect target gases due to reduction-oxidation reactions between the target gas and adsorbed oxygen species on their surface. When n-type metal oxide semiconductor sensors are exposed to a reducing gas atmosphere, like NH3, they decrease the sensor’s electric resistance. On the contrary, the adsorption process increases the surface resistance of the sensor in the presence of an oxidizing gas such as CO2 and ozone. Due to their high electron affinity, oxygen species adsorb on the surface of n-type metal oxide semiconductors and trap free electrons. Electron trapping creates a potential barrier at the grain boundaries which limits the flow of electrons (i.e., there is the creation of a depletion layer or a space charge region). This leads to an increase of the MOX electric resistance. Successively, when the sensor is exposed to a reducing atmosphere, with gases such as NH3, the gas molecules react with active oxygen species and liberate free electrons in the bulk. This reduces the potential barrier height, favors the flow of electrons and reduces the sensor’s electric resistance. In contrast, with oxidizing gases like CO2 and ozone, the adsorption process raises the surface resistance [28]. In p-type metal oxide semiconductor sensors, electron exchanges in the presence of a gas cause a decrease or an increase in electron holes in the valence band when they are exposed to a reducing gas or an oxidizing gas, respectively [27].
The oxygen species on the surface of the MOX can be either physisorbed or chemisorbed in the function of the temperature. Below 150 °C, the molecular form dominates and is physisorbed (Equation (1)), while above this temperature, the ionic species prevail: below 250 °C and above 550 °C (Equations (2) and (3)) [21].
By adsorption of the oxygen molecules on the surface of MOX, the electrons transferred from the sensing material to these molecules. This movement leads to the production of negatively charged oxygen molecules on semiconductors in such a way that causes upward band bending at grain boundaries in the semiconductor (Figure 4).
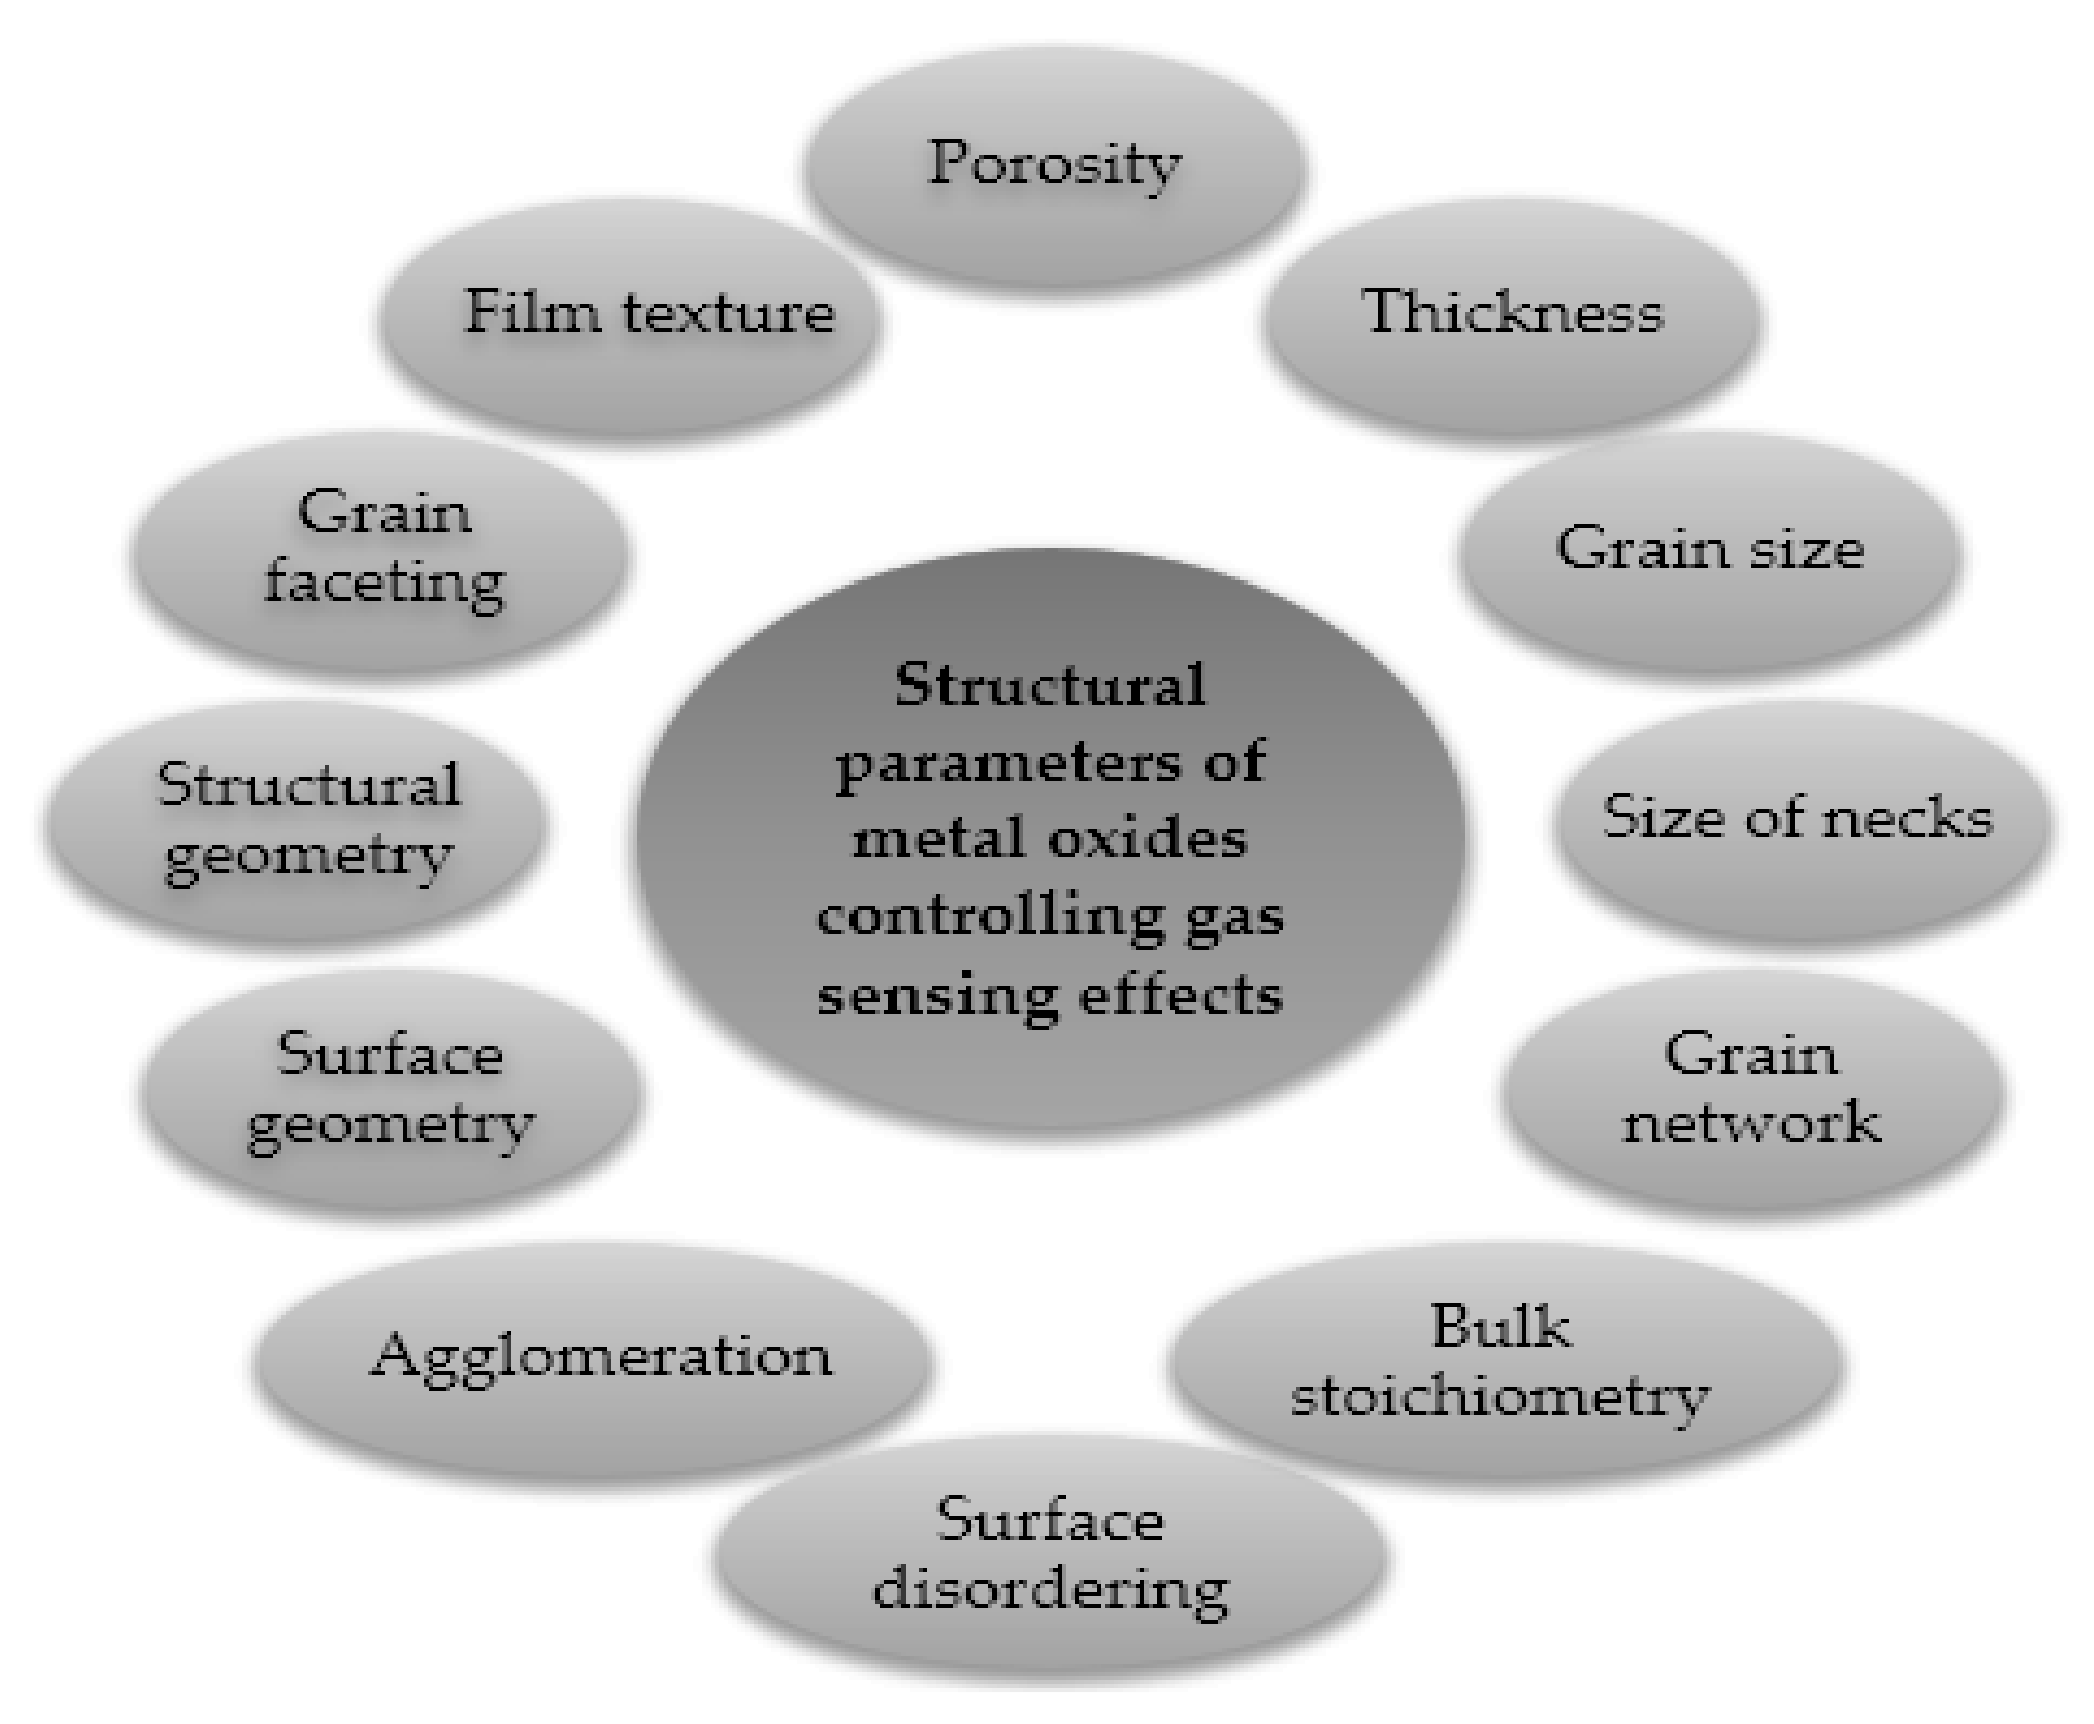
Figure 5 demonstrates the effective factors on the response of MOX gas sensors. To improve the sensor’s performance, such as selectivity (the ability of a sensor to identify the target gas when in the presence of different gases; if the selectivity is low, the sensor response will be due to the contribution of any molecules in contact with it), sensitivity (the capacity to discriminate small changes in the analyte’s concentration over a wide range of gas concentration values) and durability of the sensor, the crystallite size of MOX should be as small as possible (in the nanometer range), as reported by Yamazoe [16]. Furthermore, sensitizers should be finely dispersed, and the thickness of sensing layers should also be optimized [29]. In fact, in large grains containing partly depleted layers, the conduction in the entire grain width is not affected by surface reactions. Thus, the process of conduction occurs in the bulk region more conductive compared to the outer space charge region. When the conduction is parallel to the surface, the sensor presents a limited sensitivity [21]. For thin layers, the thickness of the layer is comparable to λD (the Debye length, a measure of the electronic “crosstalk” between the surface phenomena and the bulk electronic properties [30]), the influence of surface processes is extended to the whole layer (there is no longer a conducting channel and a resistive one), and the conduction is then a function of the concentration of electrons influenced by the surface reactions.
In the case of porous layers, there are three possibilities for the necks between grains, including surface/bulk, grain boundary and flat bands, which are for enough large necks, large grains not sintered together and small grains with small necks, respectively (Figure 4). Moreover, as can be seen in Figure 4, the barrier height (qVS) at the grain boundaries is a function of the density of surface state NS modulated by the previously mentioned oxidation-reduction reactions.
The performance of the sensor depends on various properties, including response and recovery time (the time needed for a sensor to reach a variation of 90% of the total resistance, impedance or capacitance during gas adsorption or desorption, respectively), selectivity, sensitivity, operating temperature (the temperature at which the gas sensor shows the highest response with respect to the target gas) and limit of detection (LOD, the minimum concentration of target gas detected at a known confidence level), etc. [13]. Furthermore, reversibility (the capacity of a sensor to recover its initial resistance, impedance or capacitance value when the atmosphere with the target gas is switched to fresh air), long-term stability, consumption of energy and low dependence on humidity are other significant parameters for gas [32]. Generally, pure metal oxide gas sensors have some disadvantages, including poor selectivity and low sensitivity towards lower concentration of target gas, high consumption of energy and high operating temperature [33].
Any method able to modify on MOX surface, surface stoichiometry (oxygen vacancies are responsible for enhanced performances), work function, the binding energy of atoms, the concentration of carbon contaminants, chemical activity of surface and so on is effective at improving gas sensor performances. However, to this aim, surface modification of metal oxides and semiconductors by catalytically active atoms remains the most used method. An increase of sensitivity and fast surface reactions can occur in the presence of catalysts on the surface of metal oxides and semiconductors [31].
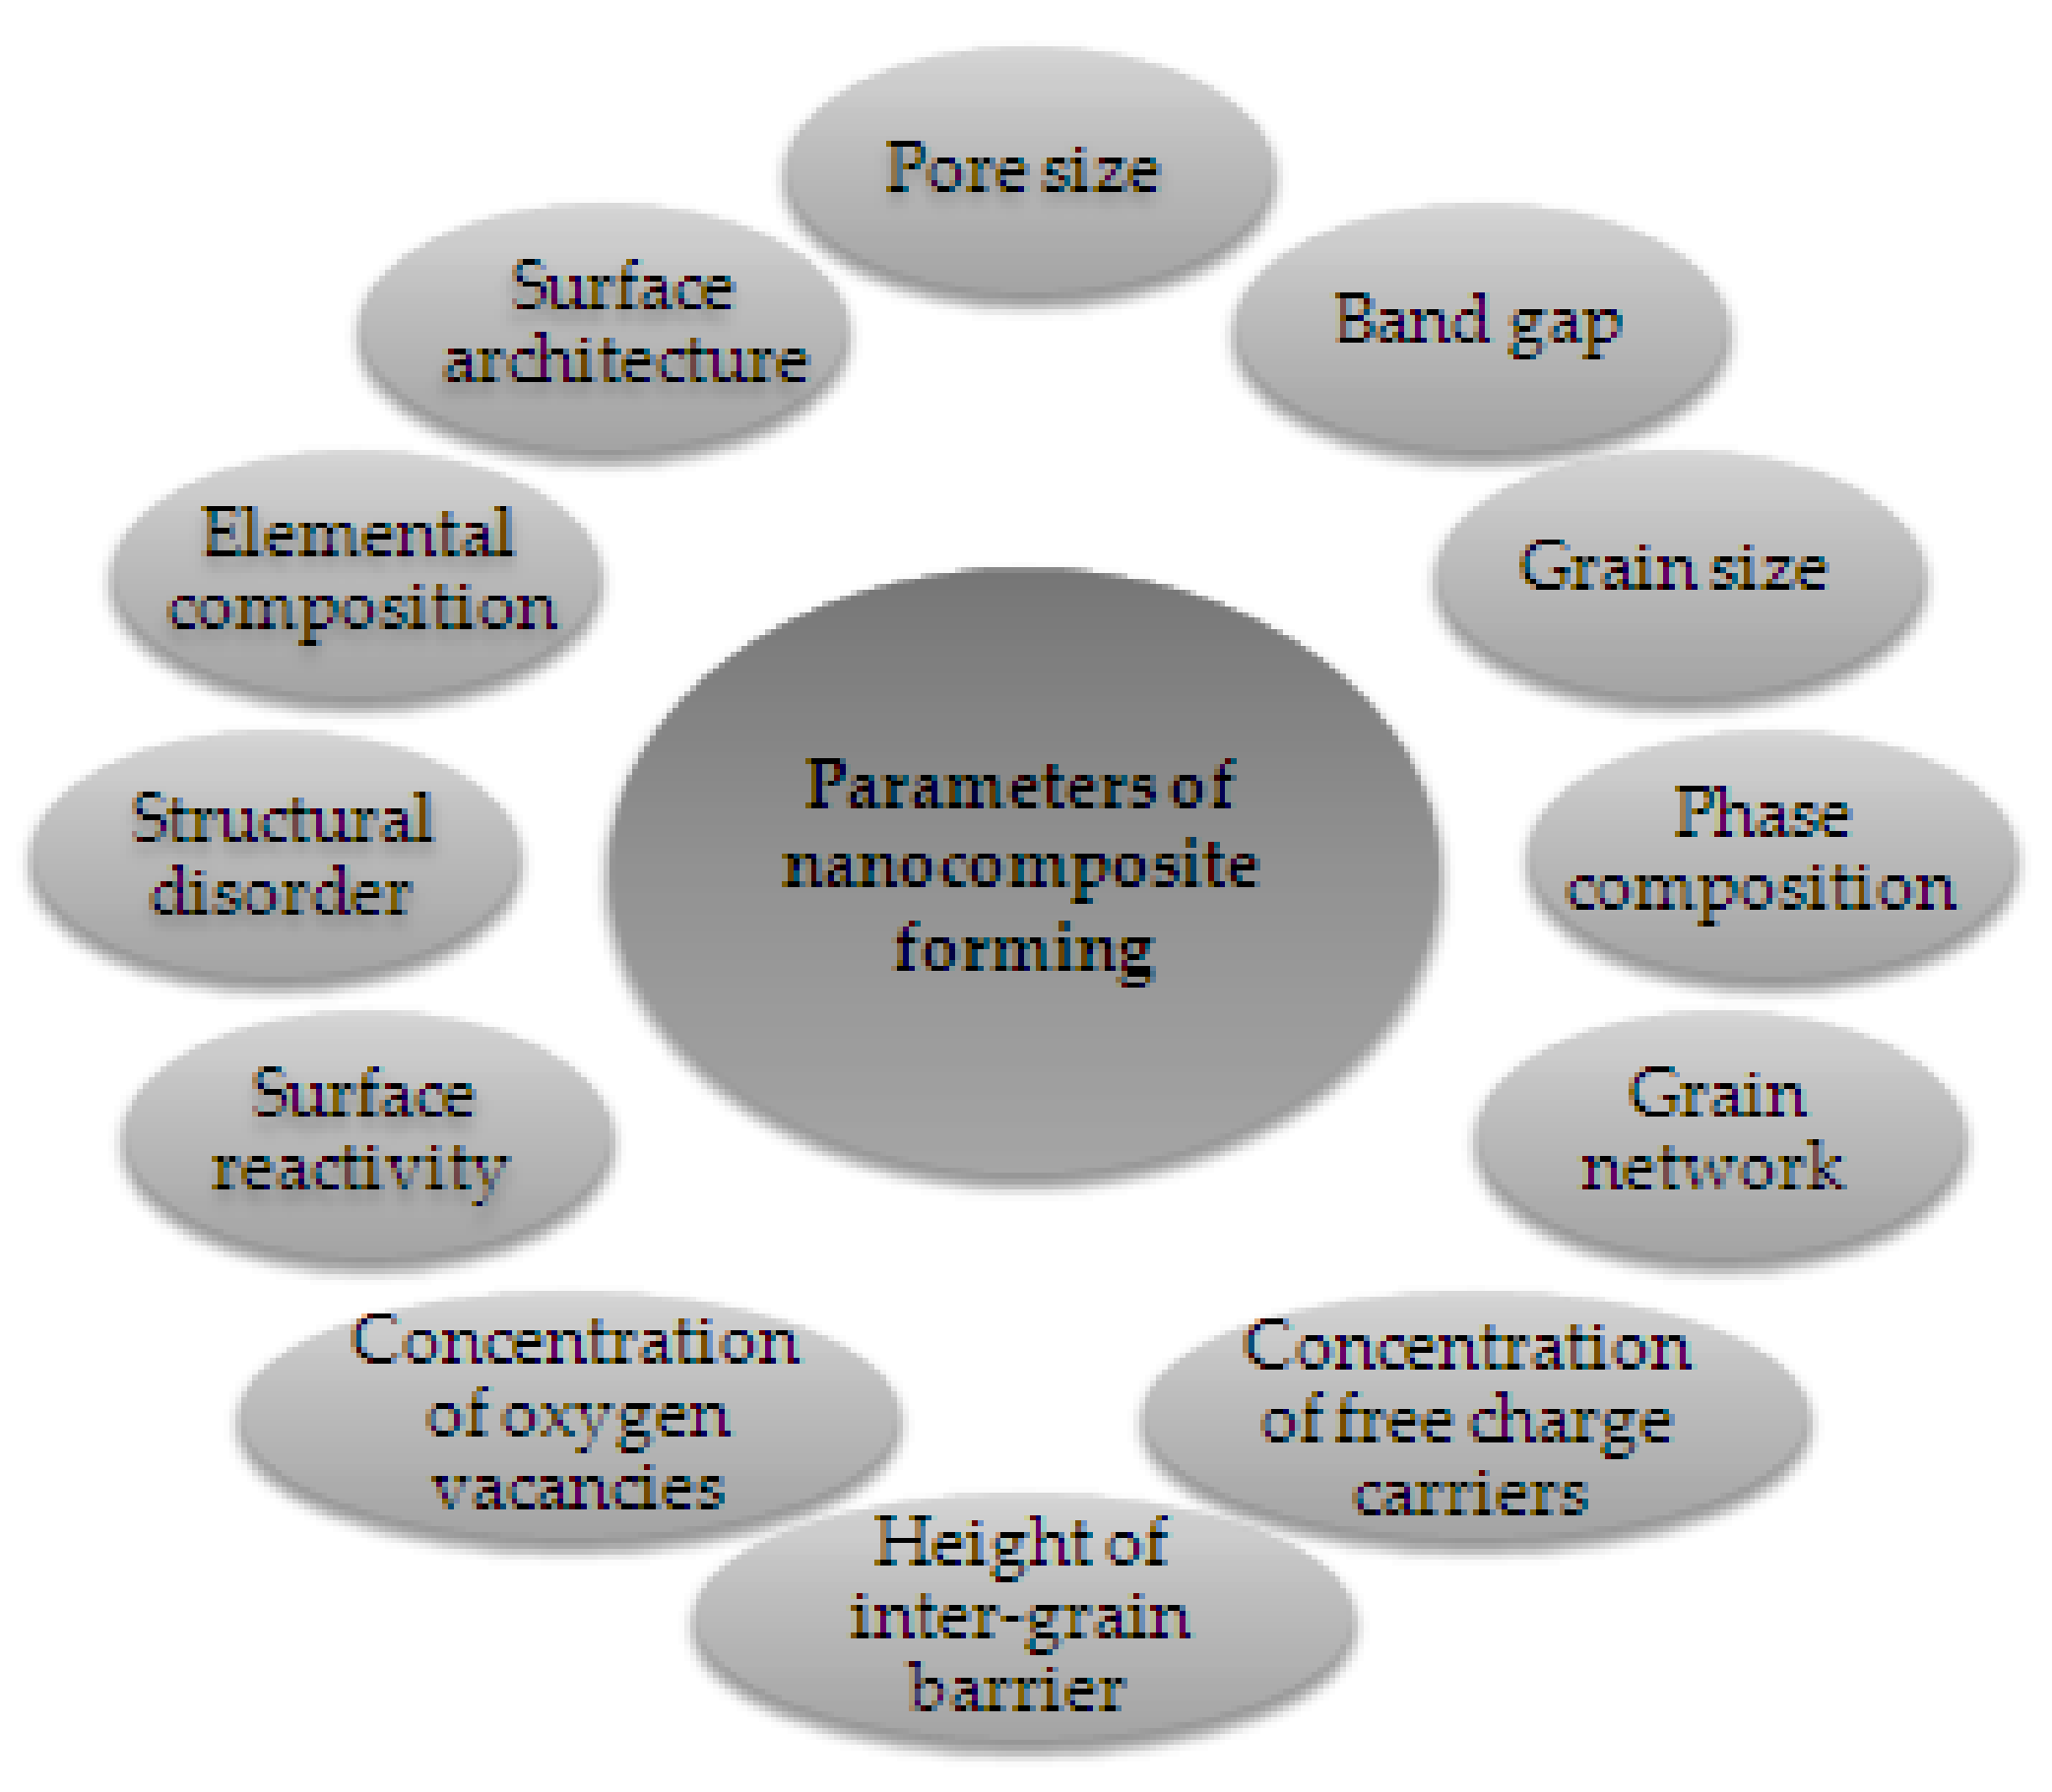
Experimental results on MOX gas sensors showed that the addition of dopants or impurities significantly improved metal oxide semiconductors’ features (Figure 6). The addition of various additives (based on catalytically active metals, non-metals, alkaline earth metals, metalloids, etc.) to the MOX is one of the main techniques to increase the performance of gas sensors and this can be done by bulk doping and surface doping [30]. Table 2 shows some of these additives. In addition, it should be noted that the main doping additives include noble and transition metals [30].
Humidity usually exhibits reducing features, even if the oxidizing effect of water was evidenced by Staerz et al. on the WO3 surface at 300 °C [35]. However, when doping with precious metals, water dissociation is not favored on either metal’s close-packed face, as Rh and Pt are relatively unreactive [36]. Calculations showed that neither H2O bilayers, nor half-dissociated monolayers, are thermodynamically stable on clean Rh(111). On the contrary, impurities such as C atoms provide favorable binding sites for H atoms detached from H2O molecules [37].
Nevertheless, it is almost impossible to synthesize polycrystalline metal oxide films with suitable grain faceting. In 1D sensors, planes and faceting depend on the synthesis parameters that allow a tighter control of the sensor’s performances [31].
Many studies reported that the power consumption and operating temperature of MOX gas sensors have decreased by using nanocomposites and make them suitable for remote monitoring systems [38,39]. Moreover, the utilization of nanocomposites as sensing materials can remarkably improve the selectivity of sensors [40]. By solving the 3 “S” problems of gas sensors (the improvement of sensitivity, selectivity and stability) with metal oxide nanocomposites, these could be successfully applied for the detection of GHGs [34].
Sensor’s resistance changes when in presence of the test gas. The response of n-type and p-type MOSs-base gas sensor can be defined by Equations (4) and (5), respectively:
In Equations (4) and (5), Ra shows the resistance of the gas sensor in the presence of reference gas that is usually air, and Rg is the gas sensor’s resistance when target gas exists [32]. Table 3 shows the resistance changes in the presence or absence of oxidizing/reducing gases in the case of metal oxide semiconductor-based gas sensors. Generally, reducing gases like CO, CH4, H2S, H2, SO2, NH3 and HCHO leads to a decrease or an increase of conductivity in p-type and n-type semiconductors, respectively. Whereas the opposite behavior is reported in the case of oxidizing gases such as N2O, NO, NO2, O3, Cl2 and CO2 for both types of semiconductor sensors [41].
3. Nanostructured Metal Oxide Semiconductor (NMOS)-Based Greenhouse Gas Sensors
3.1. Sensing of Carbon Dioxide (CO2)
Several studies deal with the detection and control of CO2 emission owing to its significant effect on global warming. The global concentration of CO2 in the atmosphere was determined from historical ice core studies and recent air monitoring sites from 1950 to 2021 (Figure 7) [42]. As can be seen, the level of CO2 in the atmosphere was about 310 ppm in 1950 compared to about 416.7 ppm in December 2021 [43], measured at Mauna Loa Observatory in HI, USA. The mean annual absolute increase over the past 10 years was 2.4 ppm/y. This resulted in the evolution of CO2 sensors for monitoring and controlling the levels of CO2 in the atmosphere and indoor air quality [44,45].
Table 4 illustrates a summary of various metal oxide semiconductor-based CO2 gas sensors. The ZnO nanorods of length (1–3 µm) without and with the addition of Ge, Nd and W were synthesized through the mechanochemical combustion method in reference [46]. In this paper, CO2 sensors based on pure ZnO were less sensitive than the metal-doped ZnO ones under the air atmosphere. The authors justified these results based on the temperature that has a significant role in the adsorption of CO2 molecules onto the surface of the ZnO based sensor and its electrical response. They determined the working temperature by measuring the sensitivity of all the doped ZnO samples under a constant concentration of CO2 (1000 ppm). As can be seen in Figure 8, all ZnO specimens show similar behavior with regard to the effect of working temperature. In fact, the response of sensors increased with temperature and concentration of doping. Shohany et al. reported similar results with respect to the temperature [47].
From our experience on pure ZnO sensors for the detection of CO2, this sensing material is very sensitive not only to carbon dioxide but also to water vapor. On ZnO screen-printed sensors made from a commercial powder (Sigma Aldrich, Milan, Italy) and fired at 600 °C for 1 h, a sensor response was already observed from 100 ppm of CO2 under dry air at 200 °C. However, the response was significantly affected when humidity (75% relative humidity at room temperature) was introduced (Figure 9b; 250 ppm of CO2). A drift of the baseline was also evidenced during the measurements and in successive tests: The initial impedance value under dry air continuously increased (Figure 9a,b). To limit interferences with water vapor, an acetone gas sensor based on a core@shell structure ZnO nanowire-zeolite imidazole framework (ZIF) array was proposed by Yao et al. [70]. Both the selectivity and sensitivity to acetone were highly promoted due to the selectivity of zeolite imidazole frameworks which worked as sieve membranes. Subsequently, ZnO nanowires of various sizes were grown on a zinc oxide seeded sapphire substrate, followed by a hydrophobic and catalytic ZIF-CoZn coating. These authors found that thin ZnO (5 nm)-ZIF-CoZn nanowires had a better response toward 100 ppm acetone at 260 °C. In addition, the sensor response in the range from 10 to 90 RH% was almost constant. Such kinds of structures can also be investigated for the detection of GHGs in the air.
Molybdenum and tungsten oxide nanostructured thin film-based gas sensors (Mo1 − xWxO3, x = in the range of 0.6–1) were produced by Mohamed A. Basyooni et al. through reactive RF magnetron co-sputtering at 400 °C to detect carbon dioxide at room temperature [71]. Their results showed fast responses from 6.53 to 12.25 s and recovery times from 0.06 to 4.02 s for the detection of CO2 in the presence of UV light (365 nm) activation.
In recent years, there has been an increasing amount of literature on the synthesis of porous LaFeO3-SnO2 nanocomposites, Au-La2O3-doped SnO2 nanofibers and LaFeO3 microspheres by using various chemical methods in the presence of metals or metal oxides to increase the response of these sensors towards CO2. Zhang et al. described the synthesis of the LaFe2O3/SnO2 porous film-based sensor by mixing method and reported low response time (less than 20 s) at 250 °C [65]. The 5 wt% La2O3-SnO2 nanofibrous was obtained by using the electrospinning process. The results showed significant improvement in the response towards many types of gases, particularly carbon dioxide [58]. Copper oxide has also attracted more attention as a sensing material for CO2 detection with various structures such as nanocomposite, nanostructure, thick film and thin film [72,73,74]. Semiconducting pure and Gd doped CeO2 nanostructure were prepared by co-precipitation method for detection of CO2 in the range of 200–400 °C. According to the results, Gd-doped CeO2 gas sensor showed maximum sensitivity at 250 °C, good stability and low operating temperature as well as a limit of detection of 800 ppm CO2, while maximum response for pure CeO2 was reported to be above 400 °C.
3.2. Sensing of Methane (CH4)
Methane is the simplest hydrocarbon, explosive, odorless and colorless gas, but it is known as a highly flammable GHG. Moreover, it can be considered as a significant constituent of natural gas such as compressed natural gas (CNG) and liquified natural gas (LNG), which are used as fuel for vehicles as well as in the generation of heat and electricity production. According to the report of the World Meteorological Organization [75], the increase of CH4 emissions from 2018 to 2019 (+11 ppb, part per billion) was negligibly lower than that reported between 2017 to 2018, although it was higher than the average during the last 10 years (+8 ppb/y). However, methane concentration in air is 262% higher with respect to the levels in 1750 when human activities started disrupting Earth’s natural equilibrium. It reached 1889 ± 2 ppb in 2020. Thus, the detection of methane is essential due to the safety concern, although its detection is very difficult owing to the non-polarity and high enthalpy of the C-H bonds. Much of the current literature on MOX-based sensors pays particular attention to CH4 detection [76].
Several authors have studied the use of various SnO2 sensors for detecting CH4. Pt-doped SnO2 nanofibers (100–150 nm) were obtained by using the electrospinning method [77]. The results showed a response time of 4.48 s at 350 °C towards CH4 in the presence of 20 mol% of Pt. Bunpang et al. [78] measured a response time of 3.9 s at 350 °C towards 1 vol% CH4 for 0.5 wt% Cr-doped SnO2 nanoparticles. In recent years, Lijia Yao et al. synthesized Pd-SnO2 composite nanoporous structure by applying a low-power hydrothermal technique. They found that, in the presence of Pd, the gas sensing performance towards methane significantly increased compared to pure SnO2. As shown in Figure 10, by addition of 2.5 mol% Pd, the sensor showed fast recovery time (5 s), high repeatability, long-term stability and excellent response (17.60) toward 3000 ppm of CH4 at the operating temperature 340 °C [76]. A similar study was also reported for the Pd-SnO2 gas sensor, which was fabricated by the sol-gel method, for the detection of CH4 in the air [79]. Their experimental results exhibited that the addition of palladium causes a remarkable increase in the sensor response to CH4 of about 6–7 times when compared with a pure tin dioxide sensor.
Dongping Xue et al. [80] fabricated SnO2-loaded WO3 nanosheet composites and were able to detect CH4 with a response time of about 1.4 times higher than pure tungsten trioxide at the optimum working temperature of 90 °C. Figure 11 shows the optimal operating temperature towards 500 ppm of CH4. They observed that by raising the operating temperature up to 90 °C, the gas response was enhanced, while by a further increase in temperature, the sensor response decreased. γ-Fe2O3 nanoparticles were prepared using a green method for the detection of CH4 with a concentration of 100 ppm at the operating temperature of 150 °C [81]. The results showed a higher response and selectivity, as well as a short response and recovery time in comparison with euphorbia extracted γ-Fe2O3 nanoparticles. Pt-VOx thin film obtained by the magnetron sputtering technique also showed a high sensing response towards 500 ppm of methane at room temperature [82].
Au-decorated vanadium dioxide nanosheets exhibited a good sensing response in presence of methane concentration in the range from 100 to 500 ppm at room temperature [83]. A gas sensor based on VO2 nanoparticles was prepared by vapor transport method with a sensor response equal to 652 towards 500 ppm CH4 concentration at 150 °C [84]. The cobalt-doped zirconium oxide exhibited a superior recovery time and response time of 27 s and 19 s, respectively, under 100 ppm methane with respect to the pure ZnO sensor [85]. The NiO decorated ZnO porous nanosheets showed high response and long-term stability too at 340 °C towards 1000 ppm of CH4. These results were higher than that of pure ZnO porous nanosheets, due to the larger surface area and interfacial interaction of NiO and ZnO by p–n heterojunction formation [86]. A summary of metal oxide semiconductor-based CH4 gas sensors is reported in Table 5.
3.3. Sensing of Nitrous Oxide Gas
Another important greenhouse gas is nitrous oxide (N2O), which is a colorless gas with a sweet odor. The World Meteorological Organization reported that N2O concentration in air was 333.2 ± 0.1 ppb in 2020 which was 123% more with respect to pre-industrial levels. The increase of N2O from 2018 to 2019 was comparable with the average growth rate over the last decade (+0.99 ppb/y), although the increase of nitrous gases in these years was lower than reported results between 2017 and 2018 [75]. For these reasons, it is very important to develop gas sensor for N2O for the protection of humans’ health and the environment. Nevertheless, there is a relatively small body of literature on the use of metal oxide semiconductor-based sensors towards N2O detection.
Among the MOX-based gas sensors, several researchers reported SnO2 and WO3 for N2O detection. In2O3 based gas sensors provide noticeably sensing properties for the N2O detection too. WO3 nanowire mats and nanoparticle films were obtained by HF-CVD technique (hot filament chemical vapor deposition) and showed a good sensitivity towards N2O in the operating temperature range 100–500 °C [101]. In comparison with nanoparticle films, by increasing the temperature, the mat-like nanowire network provided higher sensitivity with response time and recovery time of 75 s and 360 s, respectively, at about 450 °C; 0.5 wt% Sm2O3-loaded SnO2 nanopowders were produced by the electrochemical route and showed high sensitivity towards 35 ppm of N2O in air. The experimental results highlighted that, by introducing Sm2O3, sensitivity increased up to approximately 1.5 times higher than pure SnO2 [102]. The sensing characteristics of nanowire indium oxide and tungsten trioxide were investigated by Rout et al. [103]. The In2O3 nanowire (~20 nm in diameter) sensor showed a response and recovery time of about 20 s along with a sensor response of 60 in the presence of 10 ppm N2O at 150 °C, whereas WO3 nanowire (5–15 nm in diameter)-based sensors exhibited a sensor response of 20–25 with a response and recovery times of 10 s and 60 s, respectively, under 10 ppm N2O at 250 °C. They reported that the sensitivity of indium oxide and tungsten trioxide nanowires is not affected in the presence of water vapor, up to 90% relative humidity. SrO-doped SnO2 demonstrated higher sensitivity and response time (three times) under 10–300 ppm N2O at 500 °C than pure SnO2 [38]. Table 6 summarizes the reported results in the literature on MOX-based N2O gas sensors.
3.4. Fluorinated Gases (HFCs, PFCs and SF6)
In the 19th century, the levels of methane were stable at 34.1 ± 0.3 ppt (part per trillion), while for both C2F6 and C3F8 gasses, they were below detection limits of 0.002 and 0.01 ppt, respectively. Around 1940, due to the high production of aluminum because of World War II, peaks corresponding to the emission of CF4 and C2F6 were detected. Furthermore, the emissions of PFCs were drastically decreased for CF4 (in 1980) and C2F6 and C3F8 (early to mid-2000s), but they then slowed down and probably stopped recently [8]. Due to their low concentration, these gases can be detected with good accuracy by gas chromatography with electron capture detector (GC/ECD). Figure 12 shows the baseline of fluorinated gas emission from 2005 to 2050. As can be seen, the emissions of F-gases are estimated to increase five times in this period. This increase can be described by a sixfold enhancement in the demand for air conditioners and refrigeration services, especially in developing countries, along with the effect of the replacement of CFCs and HCFCs with HFCs. A growth of 25% is expected for PFC emissions over the same period because of industry development and emission contractions in primary aluminum production. It is expected that SF6 emissions will enhance too (by almost 50%), owing to the increase in emissions from high and medium voltage switches as a result of the increase in electricity consumption and the development of magnesium production [6].
SF6 has been extensively applied in gas-insulated high-voltage switchgear (GIS, a compact metal encapsulated switchgear made of high-voltage components which can be safely operated in confined spaces) [105]. Due to partial discharge fault, sulfur hexafluoride decomposes, resulting in the generation of different low-fluoride sulfides. The reaction of low-fluoride sulfides with H2O and O2 in gas-insulating equipment leads to the production of different decomposition products such as SO2, H2S, SOF2 and SO2F2. In order to assess the operating state and insulation level of GIS, the partial discharge detection and analysis of content and composition of SF6 gas components have significant importance [106]. To this aim, the development of gas sensing equipment able to detect SF6 decomposition products can be considered as a proper way for online monitoring of partial discharge fault in GIS.
Hongcheng Liu et al. [108] produced pure and NiO-decorated ZnO nanoflowers by the hydrothermal process for the detection of SF6 decomposition products (SO2, SO2F2, and SOF2). They reported that, by the addition of NiO, the properties of the ZnO-based sensor clearly increased, such as higher gas response, lower optimal operating temperature and shorter response and recovery time. Table 7 presents a brief summary of reported results on MOX-based sensors for the detection of decomposition products of sulfur hexafluoride.
Au modified (1.2 at%) ZnO nanowires prepared by hydrothermal synthesis showed a high response (79.4) to 5 ppm H2S at room temperature in reference [109] due to the formation of nano-Schottky type barrier junctions at the interface between 5 nm Au particles and ZnO nanorods.
H2S has strong electron-accepting capacities and can be detected by In2O3 nanowire (80 nm in diameter) transistors down to 1 ppm at room temperature with reasonably fast response and recovery times (48 s and 56 s, respectively, when switching the atmosphere from under air to 1 ppm of H2S and vice versa) [110]. Single crystal whiskers and thick films of bipyramids of cubic In2O3 were grown by carbothermal method in reference [111] and showed that the single crystal whiskers were selective and could be used to detect 200 ppb of H2S while bipyramids films could be used in a 10–80 ppm range of hydrogen sulphide at room temperature. The lower detection limit of single crystal whiskers with respect to bipyramid crystals was attributed to a higher presence of singly charged oxygen vacancy defects.
Conductimetric sensors based on a suspended single CuO nanowire were able to sense H2S in dry and humid atmosphere (65 RH%) down to 10 ppb at 325 °C in reference [112]. Suspended nanowires are in a highly favorable configuration because they can be fully immersed in the gas atmosphere. Humidity-induced Debye length modulation was probably small compared to the large nanowire diameter (170 nm) thus, no evident increase or decrease of the resistance was evidenced when testing the sensors either in a dry or humid environment. These results are promising in view of the integration of CuO nanowires on CMOS-fabricated micro-hotplates to achieve miniaturized, low power consumption portable devices.
4. Conclusions and Perspectives
Accurate measurements and reliable quantifications of anthropogenic GHG emissions in air are of primary importance to study climate change and for taking mitigation actions. In this review, the general properties and gas sensing mechanisms of semiconductor metal oxides were first presented. Then, the factors that influence their sensitivity, selectivity and stability were also illustrated. Because of GHG concentration in air, MOX gas sensors have the potential to detect mainly CO2, CH4, N2O and PFC decomposition products in GIS in remote monitoring systems.
In the case of CO2 detection in air, MOX gas sensors already show the sensor response and the LOD compatible with the targeted application from room temperature and up to 400 °C operating temperatures. Their cross-sensitivity needs, however, to be fully evaluated (for example, ZnO sensors can detect almost all the above-cited GHGs (Table 4, Table 5, Table 6 and Table 7)). Humidity strongly interferes when doing measurements in air. The core@shell structure based on ZnO nanowire-zeolite imidazole framework (ZIF) array could be investigated for GHG sensors with an improved selectivity with respect to water vapor.
Direct growth techniques of vertically oriented ZnO nanomaterials on electrode surfaces appear to be interesting manufacturing processes and allow the miniaturization of sensors and their incorporation in remote monitoring systems. The surface functionalization of vertically aligned ZnO nanomaterials with specific metal catalysts, dopants, and other metal oxides is a promising approach for improving sensing response, selectivity and response/recovery time too [123]. However, their ageing behavior has also to be studied: according to our experience in CO2 detection with ZnO screen-printed sensors, the sensor’s response significantly decreases after one year of intermittent operation at 200 °C. Thus, other 1D nanomaterials have to be investigated for the detection of GHGs.
Methane monitoring is also of utmost importance since the COP26 in Glasgow and the Global Methane Pledge signed up to by more than 100 countries. The MOX gas sensors can detect CH4 in the concentration range from 60 to 20,000 ppm in the working temperature range from room temperature to 500 °C (Table 5). However, much effort will be needed to detect methane in air (targeting the 2 ppm current atmospheric concentration). The development of new nanocomposites could be the successful key to target this aim.
Nitrous oxide detection by means of MOX gas sensors is effective in the range 10–300 ppm at 200–500 °C (Table 6). For N2O detection in air, the sensor response and the LOD must be significantly improved too (the target is about 0.3 ppm). Moreover, for this application, significant improvements can be expected from new nanocomposite developments.
Finally, sulfur hexafluoride decomposition products such as SO2, H2S, SOF2 and SO2F2 can be evidenced by means of MOX gas sensors (Table 7). Even if concentrations of 20–100 ppm of these gases can be already detected, these performances could be considered as satisfying because GIS are compact metal encapsulated systems and the measurements are done in a closed environment and not in air. However, conductimetric sensors showed a lower limit of detection with respect to resistive semiconducting metal oxides and allowed the detection of hydrogen sulfide concentrations as low as 10 ppb at 325 °C.
Author Contributions
Both authors contributed equally. All authors have read and agreed to the published version of the manuscript.
Funding
This research received no external funding.
Informed Consent Statement
Not applicable.
Acknowledgments
The Authors thank Elisabetta Di Francia, Daniele Ziegler and Andrea Marchisio for the screen-printed ZnO sensors’ manufacturing and testing.
Conflicts of Interest
The authors declare no conflict of interest.
References
- Villar, J.C.; Hidalgo, S.L.; Penela, A.C.; Meijide, B.G. A New Perspective for Labeling the Carbon Footprint against Climate Change. In Global Warming—Impacts and Future Perspective; Bharat, R.S., Ed.; InTech: Rijeka, Croatia, 2012. [Google Scholar]
- Solomon, S.; Qin, D.; Manning, M.; Chen, Z.; Marquis, M.; Averyt, K.B.; Tignor, M.; Miller, H.L. Climate Change 2007: The Physical Science Basis. Contribution of Working Group I to the Fourth Assessment Report of the Intergovernmental Panel on Climate Change; Cambridge University Press: Cambridge, UK; Cambridge University Press: New York, NY, USA, 2007. [Google Scholar]
- World Meteorological Organization. WMO Greenhouse Gas Bulletin, No. 16; WMO: Geneva, Switzerland, 2020. [Google Scholar]
- Santhanam, K.S.V.; Ahamed, N.N.N. Greenhouse Gas Sensors Fabricated with New Materials for Climatic Usage: A Review. ChemEngineering 2018, 2, 38. [Google Scholar] [CrossRef] [Green Version]
- Stocker, T.F.; Qin, D.; Plattner, G.-K.; Tignor, M.B.M.; Allen, S.K.; Boschung, J.; Nauels, A.; Xia, Y.; Bex, P.M.M.V. Climate Change 2013 The Physical Science Basis: Working Group I Contribution to the Fifth Assessment Report of the Intergovernmental Panel on Climate Change; Cambridge University Press: Cambridge, UK, 2013. [Google Scholar]
- Sonker, R.K.; Sabhajeet, S.R.; Yadav, B.C. TiO2–PANI nanocomposite thin film prepared by spin coating technique working as room temperature CO2 gas sensing. J. Mater. Sci. Mater. Electron. 2016, 27, 11726–11732. [Google Scholar] [CrossRef]
- Rauh, F.; Schwenk, M.; Pejcic, B.; Myers, M.; Ho, K.-B.; Stalker, L.; Mizaikoff, B. A mid-infrared sensor for the determination of perfluorocarbon-based compounds in aquatic systems for geosequestration purposes. Talanta 2014, 130, 527–535. [Google Scholar] [CrossRef]
- Trudinger, C.M.; Fraser, P.J.; Etheridge, D.M.; Sturges, W.T.; Vollmer, M.K.; Rigby, M.; Martinerie, P.; Mühle, J.; Worton, D.R.; Krummel, P.B.; et al. Atmospheric abundance and global emissions of perfluorocarbons CF4, C2F6 and C3F8 since 1800 inferred from ice core, firn, air archive and in situ measurements. Atmos. Chem. Phys. 2016, 16, 11733–11754. [Google Scholar] [CrossRef] [Green Version]
- US Energy Information Administration (EIA). Energy and the Environment Explained Greenhouse Gases; US Energy Information Administration (EIA): Washington, DC, USA, 2021. [Google Scholar]
- Berrou, A.; Raybaut, M.; Godard, A.; Lefebvre, M. High-resolution photoacoustic and direct absorption spectroscopy of main greenhouse gases by use of a pulsed entangled cavity doubly resonant OPO. Appl. Phys. A 2009, 98, 217–230. [Google Scholar] [CrossRef]
- PBL Netherlands Environmental Assessment Agency. Growth of 1.1% in Global Greenhouse Gas Emissions in 2019. Available online: Https://www.pbl.nl/en/news/2020/growth (accessed on 5 December 2021).
- Oertel, C.; Matschullat, J.; Zurba, K.; Zimmermann, F.; Erasmi, S. Greenhouse Gas Emissions from Soils—A Review. Geo-Chem. 2016, 76, 327–352. [Google Scholar] [CrossRef] [Green Version]
- Gautam, Y.K.; Sharma, K.; Tyagi, S.; Ambedkar, A.K.; Chaudhary, M.; Pal Singh, B. Nanostructured Metal Oxide Semicon-ductor-Based Sensors for Greenhouse Gas Detection: Progress and Challenges. R. Soc. Open Sci. 2021, 8, 201324. [Google Scholar] [CrossRef]
- Meld. St. Longship—Carbon Capture and Storage. Available online: https://www.regjeringen.no/en/dokumenter/meld.-st.-33-20192020/id2765361/ (accessed on 5 December 2021).
- Olaniyi, O.A.; Ojekunle, Z.O.; Amujo, B.T. Review of Climate Change and Its Effect on Nigeria Ecosystem. Int. J. Afr. Asian Stud. Open Access Int. J. 2013, 1, 57–65. [Google Scholar]
- Jaaniso, R.; Kiang Tan, O. Semiconductor Gas Sensors; Woodhead Publishing Series in Electronic and Optical Materials; Woodhead Publishing Limited: Oxford, UK, 2013. [Google Scholar]
- Arshak, K.; Moore, E.; Lyons, G.M.; Harris, J.; Clifford, S. A review of gas sensors employed in electronic nose applications. Sens. Rev. 2004, 24, 181–198. [Google Scholar] [CrossRef] [Green Version]
- Shankar, P.; Rayappan, J.B.B. Gas Sensing Mechanism of Metal Oxides: The Role of Ambient Atmosphere, Type of Semicon-ductor and Gases—A Review. Sci. Lett. J. 2015, 4, 126. [Google Scholar]
- Wetchakun, K.; Samerjai, T.; Tamaekong, N.; Liewhiran, C.; Siriwong, C.; Kruefu, V.; Wisitsoraat, A.; Tuantranont, A.; Phanichphant, S. Semiconducting metal oxides as sensors for environmentally hazardous gases. Sens. Actuators B Chem. 2011, 160, 580–591. [Google Scholar] [CrossRef]
- Fine, G.F.; Cavanagh, L.M.; Afonja, A.; Binions, R. Metal Oxide Semi-Conductor Gas Sensors in Environmental Monitoring. Sensors 2010, 10, 5469–5502. [Google Scholar] [CrossRef] [PubMed] [Green Version]
- Barsan, N.; Weimar, U. Conduction Model of Metal Oxide Gas Sensors. J. Electroceram. 2001, 7, 143–167. [Google Scholar] [CrossRef]
- Bapathi, K.S.R.; Pramod, H. Borse Review—Recent Material Advances and Their Mechanistic Approaches for Room Temperature Chemiresistive Gas Sensors. Electrochem. Soc. 2021, 168, 057521. [Google Scholar]
- Tofield, P.T.M.B.C. Solid State Gas Sensors; Adam Hilger: Bristol, UK, 1987. [Google Scholar]
- Sberveglieri, G. Gas Sensors; Kluwer Academic Publishing: Berlin, Germany, 1992. [Google Scholar]
- Azad, A.M.; Akbar, S.A.; Mhaisalkar, S.; Birkefeld, L.D.; Goto, K.S. Solid-State Gas Sensors: A Review. J. Electrochem. Soc. 1992, 139, 3690–3704. [Google Scholar] [CrossRef]
- Barsan, N.; Schweizer-Berberich, M.; Göpel†, W. Fundamental and practical aspects in the design of nanoscaled SnO2 gas sensors: A status report. Anal. Bioanal. Chem. 1999, 365, 287–304. [Google Scholar] [CrossRef]
- Kim, H.J.; Lee, J.H. Highly Sensitive and Selective Gas Sensors Using P-Type Oxide Semiconductors: Overview. Sens. Actuators B Chem. 2014, 192, 607–627. [Google Scholar] [CrossRef]
- Wang, C.; Yin, L.; Zhang, L.; Xiang, D.; Gao, R. Metal Oxide Gas Sensors: Sensitivity and Influencing Factors. Sensors 2010, 10, 2088–2106. [Google Scholar] [CrossRef] [Green Version]
- Yamazoe, N. New approaches for improving semiconductor gas sensors. Sens. Actuators B Chem. 1991, 5, 7–19. [Google Scholar] [CrossRef]
- Korotcenkov, G. New Trends and Technologies. In Handbook of Gas Sensor Materials: Properties, Advantages, and Shortcomings for Applications; Springer: New York, NY, USA, 2014; Volume 2. [Google Scholar]
- Korotcenkov, G. Conventional Approaches. In Handbook of Gas Sensor Materials Properties, Advantages and Shortcomings for Applications; Springer: New York, NY, USA, 2013; Volume 1. [Google Scholar]
- Dey, A. Semiconductor metal oxide gas sensors: A review. Mater. Sci. Eng. B 2018, 229, 206–217. [Google Scholar] [CrossRef]
- Nikolic, M.V.; Milovanovic, V.; Vasiljevic, Z.Z.; Stamenkovic, Z. Semiconductor Gas Sensors: Materials, Technology, Design, and Application. Sensors 2020, 20, 6694. [Google Scholar] [CrossRef] [PubMed]
- Korotcenkov, G.; Cho, B. Metal oxide composites in conductometric gas sensors: Achievements and challenges. Sens. Actuators B Chem. 2017, 244, 182–210. [Google Scholar] [CrossRef]
- Staerz, A.; Berthold, C.; Russ, T.; Wicker, S.; Weimar, U.; Barsan, N. The oxidizing effect of humidity on WO3 based sensors. Sens. Actuators B Chem. 2016, 237, 54–58. [Google Scholar] [CrossRef]
- Glebov, A.; Graham, A.P.; Menzel, A.; Toennies, J.P. Orientational ordering of two-dimensional ice on Pt(111). J. Chem. Phys. 1997, 106, 9382–9385. [Google Scholar] [CrossRef]
- Feibelman, P.J. Reactive Wetting: H2O/Rh(111). Phys. Rev. Lett. 2003, 90, 186103. [Google Scholar] [CrossRef] [PubMed]
- Kanazawa, E.; Sakai, G.; Shimanoe, K.; Kanmura, Y.; Teraoka, Y.; Miura, N.; Yamazoe, N. Metal oxide semiconductor N2O sensor for medical use. Sens. Actuators B Chem. 2001, 77, 72–77. [Google Scholar] [CrossRef]
- Krivetskiy, V.; Ponzoni, A.; Comini, E.; Badalyan, S.; Rumyantseva, M.; Gaskov, A. Selectivity Modification of SnO2-Based Materials for Gas Sensor Arrays. Electroanalysis 2010, 22, 2809–2816. [Google Scholar] [CrossRef]
- Patil, S.J.; Patil, A.V.; Dighavkar, C.G.; Thakare, K.S.; Borase, R.Y.; Nandre, S.J.; Deshpande, N.G.; Ahire, R.R. Semiconductor metal oxide compounds based gas sensors: A literature review. Front. Mater. Sci. 2015, 9, 14–37. [Google Scholar] [CrossRef]
- Basyooni, M.A.; Shaban, M.; El Sayed, A.M. Enhanced Gas Sensing Properties of Spin-coated Na-doped ZnO Nanostructured Films. Sci. Rep. 2017, 7, srep41716. [Google Scholar] [CrossRef] [Green Version]
- Available online: Https://Gml.Noaa.Gov/Webdata/Ccgg/Trends/Co2_data_mlo.Png (accessed on 5 December 2021).
- Available online: Https://Gml.Noaa.Gov/Ccgg/Trends/Mlo.Html (accessed on 5 December 2021).
- Cozzi, L. Energy and Air Pollution, World Energy Outlook Special Report OECD/IEA; International Energy Agency: Paris, France, 2016. [Google Scholar]
- Cole, S.; Ellen, E. New NASA Satellite Maps Show Human Fingerprint on Global Air Quality; National Aeronautical Space Admin-istration (NASA): Washington, DC, USA, 2015. [Google Scholar]
- Çolak, H.; Karaköse, E. Synthesis and Characterization of Different Dopant (Ge, Nd, W)-Doped ZnO Nanorods and Their CO2 Gas Sensing Applications. Sens. Actuators B Chem. 2019, 296, 126629. [Google Scholar] [CrossRef]
- Shohany, B.G.; Motevalizadeh, L.; Abrishami, M.E. Investigation of ZnO thin-film sensing properties for CO2 detection: Effect of Mn doping. J. Theor. Appl. Phys. 2018, 12, 219–225. [Google Scholar] [CrossRef] [Green Version]
- Hunge, Y.M.; Yadav, A.A.; Kulkarni, S.B.; Mathe, V.L. A Multifunctional ZnO Thin Film Based Devices for Photoelectrocat-alytic Degradation of Terephthalic Acid and CO2 Gas Sensing Applications. Sens. Actuators B Chem. 2018, 274, 1–9. [Google Scholar] [CrossRef]
- Habib, M.; Hussain, S.S.; Riaz, S.; Naseem, S. Preparation and Characterization of ZnO Nanowires and their Applications in CO2 Gas Sensors. Mater. Today Proc. 2015, 2, 5714–5719. [Google Scholar] [CrossRef]
- Aboud, A.A.; Al-Kelesh, H.; El Rouby, W.; Farghali, A.; Hamdedein, A.; Khedr, M.H. CO2 responses based on pure and doped CeO2 nano-pellets. J. Mater. Res. Technol. 2018, 7, 14–20. [Google Scholar] [CrossRef]
- Jeong, Y.-J.; Balamurugan, C.; Lee, D.-W. Enhanced CO2 gas-sensing performance of ZnO nanopowder by La loaded during simple hydrothermal method. Sens. Actuators B Chem. 2016, 229, 288–296. [Google Scholar] [CrossRef]
- Dhahri, R.; Hjiri, M.; El Mir, L.; Fazio, E.; Neri, F.; Barreca, F.; Donato, N.; Bonavita, A.; Leonardi, S.G.; Neri, G. ZnO: Ca Nanopowders with Enhanced CO2 Sensing Properties. J. Phys. D. Appl. Phys. 2015, 48, 255503. [Google Scholar] [CrossRef]
- Ghosh, A.; Zhang, C.; Shi, S.; Zhang, H. High temperature CO2 sensing and its cross-sensitivity towards H2 and CO gas using calcium doped ZnO thin film coated langasite SAW sensor. Sens. Actuators B Chem. 2019, 301, 126958. [Google Scholar] [CrossRef]
- Joshi, S.; Ippolito, S.J.; Periasamy, S.; Sabri, Y.M.; Sunkara, M. V Efficient Heterostructures of Ag@ CuO/BaTiO3 for Low-Temperature CO2 Gas Detection: Assessing the Role of Nanointerfaces during Sensing by Operando DRIFTS Technique. ACS Appl. Mater. Interfaces 2017, 9, 27014–27026. [Google Scholar] [CrossRef]
- Abdelmounaïm, C.; Amara, Z.; Maha, A.; Mustapha, D. Effects of molarity on structural, optical, morphological and CO2 gas sensing properties of nanostructured copper oxide films deposited by spray pyrolysis. Mater. Sci. Semicond. Process. 2016, 43, 214–221. [Google Scholar] [CrossRef]
- Deepa, S.; Kumari, K.P.; Thomas, B. Contribution of oxygen-vacancy defect-types in enhanced CO2 sensing of nanoparticulate Zn-doped SnO2 films. Ceram. Int. 2017, 43, 17128–17141. [Google Scholar] [CrossRef]
- Raulkar, K. Study on sensitivity of nano SnO2 -ZnO composites with and without PPy layer for sensing CO2 gas. Mater. Today. Proc. 2019, 15, 604–610. [Google Scholar] [CrossRef]
- Hsu, K.-C.; Fang, T.-H.; Hsiao, Y.-J.; Chan, C.-A. Highly Response CO2 Gas Sensor Based on Au-La2O3 Doped SnO2 Nano-fibers. Mater. Lett. 2020, 261, 127144. [Google Scholar] [CrossRef]
- Xiong, Y.; Zhang, G.; Zhang, S.; Zeng, D.; Xie, C. Tin oxide thick film by doping rare earth for detecting traces of CO2: Operating in oxygen-free atmosphere. Mater. Res. Bull. 2014, 52, 56–64. [Google Scholar] [CrossRef]
- Krishnakumar, T.; Jayaprakash, R.; Prakash, T.; Sathyaraj, D.; Donato, N.; Licoccia, S.; Latino, M.; Stassi, A.; Neri, G. CdO-based nanostructures as novel CO2 gas sensors. Nanotechnology 2011, 22, 325501. [Google Scholar] [CrossRef] [PubMed]
- Rajesh, N.; Kannan, J.; Krishnakumar, T.; Bonavita, A.; Leonardi, S.G.; Neri, G. Microwave irradiated Sn-substituted CdO nanostructures for enhanced CO2 sensing. Ceram. Int. 2015, 41, 14766–14772. [Google Scholar] [CrossRef]
- Prim, A.; Pellicer, E.; Rossinyol, E.; Peiró, F.; Cornet, A.; Morante, J.R. A Novel Mesoporous CaO-Loaded In2O3 Material for CO2 Sensing. Adv. Funct. Mater. 2007, 17, 2957–2963. [Google Scholar] [CrossRef]
- Michel, C.; Martínez-Preciado, A.H.; Rivera-Tello, C.D. CO2 gas sensing response of YPO4 nanobelts produced by a colloidal method. Sens. Actuators B Chem. 2015, 221, 499–506. [Google Scholar] [CrossRef]
- Yadav, A.A.; Lokhande, A.C.; Kim, J.H.; Lokhande, C.D. Highly sensitive CO2 sensor based on microrods-like La2O3 thin film electrode. RSC Adv. 2016, 6, 106074–106080. [Google Scholar] [CrossRef]
- Zhang, W.; Xie, C.; Zhang, G.; Zhang, J.; Zhang, S.; Zeng, D. Porous LaFeO3/SnO2 Nanocomposite Film for CO2 Detection with High Sensitivity. Mater. Chem. Phys. 2017, 186, 228–236. [Google Scholar] [CrossRef]
- Wang, X.; Qin, H.; Sun, L.; Hu, J. CO2 sensing properties and mechanism of nanocrystalline LaFeO3 sensor. Sens. Actuators B Chem. 2013, 188, 965–971. [Google Scholar] [CrossRef]
- Yadav, A.; Lokhande, A.; Kim, J.; Lokhande, C. Improvement in CO2 sensing characteristics using Pd nanoparticles decorated La2O3 thin films. J. Ind. Eng. Chem. 2017, 49, 76–81. [Google Scholar] [CrossRef]
- Mardare, D.; Cornei, N.; Mita, C.; Florea, D.; Stancu, A.; Tiron, V.; Manole, A.; Adomnitei, C. Low temperature TiO2 based gas sensors for CO2. Ceram. Int. 2016, 42, 7353–7359. [Google Scholar] [CrossRef]
- Karaduman, I.; Demir, M.; Yıldız, D.E.; Acar, S. CO2gas detection properties of a TiO2/Al2O3heterostructure under UV light irradiation. Phys. Scr. 2015, 90, 55802. [Google Scholar] [CrossRef]
- Yao, M.-S.; Tang, W.-X.; Wang, G.-E.; Nath, B.; Xu, G. MOF Thin Film-Coated Metal Oxide Nanowire Array: Significantly Improved Chemiresistor Sensor Performance. Adv. Mater. 2016, 28, 5229–5234. [Google Scholar] [CrossRef] [PubMed]
- Basyooni, M.A.; Zaki, S.E.; Ertugrul, S.; Yilmaz, M.; Eker, Y.R. Fast response of CO2 room temperature gas sensor based on Mixed-Valence Phases in Molybdenum and Tungsten Oxide nanostructured thin films. Ceram. Int. 2019, 46, 9839–9853. [Google Scholar] [CrossRef]
- Tanvir, N.B.; Yurchenko, O.; Laubender, E.; Pohle, R.; Sicard, O.V.; Urban, G. Zinc Peroxide Combustion Promoter in Prepa-ration of CuO Layers for Conductometric CO2 Sensing. Sens. Actuators B Chem. 2018, 257, 1027–1034. [Google Scholar] [CrossRef]
- Rudraswamy, S.B.; Bhat, N. Optimization of RF Sputtered Ag-Doped BaTiO3-CuO Mixed Oxide Thin Film as Carbon Dioxide Sensor for Environmental Pollution Monitoring Application. IEEE Sens. J. 2016, 16, 5145–5151. [Google Scholar] [CrossRef]
- Herrán, J.; Fernández-González, O.; Castro-Hurtado, I.; Romero, T.; Mandayo, G.G.; Castaño, E. Photoactivated solid-state gas sensor for carbon dioxide detection at room temperature. Sens. Actuators B Chem. 2010, 149, 368–372. [Google Scholar] [CrossRef]
- Available online: Https://Public.Wmo.Int/En/Media/Press-Release/Carbon-Dioxide-Levels-Continue-Record-Levels-despite-Covid-19-Lockdown (accessed on 5 December 2021).
- Yao, L.; Li, Y.; Ran, Y.; Yang, Y.; Zhao, R.; Su, L.; Kong, Y.; Ma, D.; Chen, Y.; Wang, Y. Construction of novel Pd–SnO2 composite nanoporous structure as a high-response sensor for methane gas. J. Alloy. Compd. 2020, 826, 154063. [Google Scholar] [CrossRef]
- Lu, W.; Ding, D.; Xue, Q.; Du, Y.; Xiong, Y.; Zhang, J.; Pan, X.; Xing, W. Great enhancement of CH4 sensitivity of SnO2 based nanofibers by heterogeneous sensitization and catalytic effect. Sens. Actuators B Chem. 2018, 254, 393–401. [Google Scholar] [CrossRef]
- Bunpang, K.; Wisitsoraat, A.; Tuantranont, A.; Singkammo, S.; Phanichphant, S.; Liewhiran, C. Highly selective and sensitive CH4 gas sensors based on flame-spray-made Cr-doped SnO2 particulate films. Sens. Actuators B Chem. 2019, 291, 177–191. [Google Scholar] [CrossRef]
- Fedorenko, G.; Oleksenko, L.; Maksymovych, N.; Skolyar, G.; Ripko, O. Semiconductor Gas Sensors Based on Pd/SnO2 Nanomaterials for Methane Detection in Air. Nanoscale Res. Lett. 2017, 12, 329. [Google Scholar] [CrossRef] [PubMed] [Green Version]
- Xue, D.; Wang, J.; Wang, Y.; Sun, G.; Cao, J.; Bala, H.; Zhang, Z. Enhanced Methane Sensing Properties of WO3 Nanosheets with Dominant Exposed (200) Facet via Loading of SnO2 Nanoparticles. Nanomaterials 2019, 9, 351. [Google Scholar] [CrossRef] [PubMed] [Green Version]
- Karaduman, I.; Güngör, A.A.; Nadaroğlu, H.; Altundaş, A.; Acar, S. Green synthesis of γ-Fe2O3 nanoparticles for methane gas sensing. J. Mater. Sci. Mater. Electron. 2017, 28, 16094–16105. [Google Scholar] [CrossRef]
- Liang, J.; Liu, J.; Li, W.; Hu, M. Preparation and room temperature methane sensing properties of platinum-decorated vanadium oxide films. Mater. Res. Bull. 2016, 84, 332–339. [Google Scholar] [CrossRef]
- Liang, J.; Li, W.; Liu, J.; Hu, M. Room temperature CH4 sensing properties of Au decorated VO2 nanosheets. Mater. Lett. 2016, 184, 92–95. [Google Scholar] [CrossRef]
- Basu, R.; Reshma, P.; Prasad, A.K.; Dhara, S. Near room temperature CH4 sensing and role of oxidation states for phase pure Wadsley VnO2n+1 nanostructures. Mater. Chem. Phys. 2020, 248, 122901. [Google Scholar] [CrossRef]
- Hu, J.; Gao, F.; Zhao, Z.; Sang, S.; Li, P.; Zhang, W.; Zhou, X.; Chen, Y. Synthesis and characterization of Cobalt-doped ZnO microstructures for methane gas sensing. Appl. Surf. Sci. 2016, 363, 181–188. [Google Scholar] [CrossRef]
- Zhang, S.; Li, Y.; Sun, G.; Zhang, B.; Wang, Y.; Cao, J.; Zhang, Z. Synthesis of NiO-decorated ZnO porous nanosheets with improved CH4 sensing performance. Appl. Surf. Sci. 2019, 497, 143811. [Google Scholar] [CrossRef]
- Tshabalala, Z.; Shingange, K.; Dhonge, B.; Ntwaeaborwa, O.; Mhlongo, G.; Motaung, D. Fabrication of ultra-high sensitive and selective CH4 room temperature gas sensing of TiO2 nanorods: Detailed study on the annealing temperature. Sens. Actuators B Chem. 2016, 238, 402–419. [Google Scholar] [CrossRef]
- Dhivya, P.; Prasad, A.K.; Sridharan, M.; Dhivya, P.; Prasad, A.K.; Sridharan, M. Nanostructured perovskite CdTiO3 films for methane sensing. Sens. Actuators B Chem. 2016, 222, 987–993. [Google Scholar] [CrossRef]
- Li, W.; Liang, J.; Liu, J.; Zhou, L.; Yang, R.; Hu, M. Synthesis and room temperature CH4 gas sensing properties of vanadium dioxide nanorods. Mater. Lett. 2016, 173, 199–202. [Google Scholar] [CrossRef]
- Mounasamy, V.; Mani, G.K.; Ponnusamy, D.; Tsuchiya, K.; Reshma, P.; Prasad, A.K.; Madanagurusamy, S. Investigation on CH4 sensing characteristics of hierarchical V2O5 nanoflowers operated at relatively low temperature using chemiresistive approach. Anal. Chim. Acta 2020, 1106, 148–160. [Google Scholar] [CrossRef]
- Abruzzi, R.C.; Pires, M.J.R.; DeDavid, B.A.; Galli, C.F. Application of SnO2 Nanoparticles and Zeolites in Coal Mine Methane Sensors. Mater. Res. 2019, 22. [Google Scholar] [CrossRef]
- Sedghi, S.M.; Mortazavi, Y.; Khodadadi, A.A. Low temperature CO and CH4 dual selective gas sensor using SnO2 quantum dots prepared by sonochemical method. Sens. Actuators B Chem. 2010, 145, 7–12. [Google Scholar] [CrossRef]
- Yang, L.; Wang, Z.; Zhou, X.; Wu, X.; Han, N.; Chen, Y. Synthesis of Pd-loaded mesoporous SnO2 hollow spheres for highly sensitive and stable methane gas sensors. RSC Adv. 2018, 8, 24268–24275. [Google Scholar] [CrossRef] [Green Version]
- Zhang, S.; Li, Y.; Sun, G.; Zhang, B.; Wang, Y.; Cao, J.; Zhang, Z. Enhanced methane sensing properties of porous NiO nanaosheets by decorating with SnO2. Sens.Actuators B Chem. 2019, 288, 373–382. [Google Scholar] [CrossRef]
- Zhang, D.; Yin, N.; Xia, B. Facile fabrication of ZnO nanocrystalline-modified graphene hybrid nanocomposite toward methane gas sensing application. J. Mater. Sci. Mater. Electron. 2015, 26, 5937–5945. [Google Scholar] [CrossRef]
- Gagaoudakis, E.; Michail, G.; Katerinopoulou, D.; Moschovis, K.; Iliopoulos, E.; Kiriakidis, G.; Binas, V.; Aperathitis, E. Transparent p-type NiO:Al thin films as room temperature hydrogen and methane gas sensors. Mater. Sci. Semicond. Process. 2020, 109, 104922. [Google Scholar] [CrossRef]
- Basu, P.; Bhattacharyya, P.; Saha, N.; Saha, H.; Basu, S. The superior performance of the electrochemically grown ZnO thin films as methane sensor. Sens. Actuators B Chem. 2008, 133, 357–363. [Google Scholar] [CrossRef]
- Chen, T.-P.; Chang, S.-P.; Hung, F.-Y.; Chang, S.-J.; Hu, Z.-S.; Chen, K.-J. Simple Fabrication Process for 2D ZnO Nanowalls and Their Potential Application as a Methane Sensor. Sensors 2013, 13, 3941–3950. [Google Scholar] [CrossRef] [PubMed]
- Aghagoli, Z.; Ardyanian, M. Synthesis and study of the structure, magnetic, optical and methane gas sensing properties of cobalt doped zinc oxide microstructures. J. Mater. Sci. Mater. Electron. 2018, 29, 7130–7141. [Google Scholar] [CrossRef]
- Liu, H.; Peng, T.; Sun, H.; Xie, R.; Ma, G. Room temperature methane sensing properties of α-Fe2−xCuxO3 nanoparticles. RSC Adv. 2017, 7, 11414–11419. [Google Scholar] [CrossRef] [Green Version]
- Deb, B.; Desai, S.; Sumanasekera, G.U.; Sunkara, M.K. Gas sensing behaviour of mat-like networked tungsten oxide nanowire thin films. Nanotechnology 2007, 18. [Google Scholar] [CrossRef] [Green Version]
- Kanazawa, E.; Kugishima, M.; Shimanoe, K.; Kanmura, Y.; Teraoka, Y.; Miura, N.; Yamazoe, N. Mixed-potential type N2O sensor using stabilized zirconia- and SnO2-based sensing electrode. Sens. Actuators B Chem. 2001, 75, 121–124. [Google Scholar] [CrossRef]
- Rout, C.; Ganesh, K.; Govindaraj, A.; Rao, C. Sensors for the nitrogen oxides, NO2, NO and N2O, based on In2O3 and WO3 nanowires. Appl. Phys. A 2006, 85, 241–246. [Google Scholar] [CrossRef]
- Lančok, J.; Santoni, A.; Penza, M.; Loreti, S.; Menicucci, I.; Minarini, C.; Jelinek, M. Tin oxide thin films prepared by laser-assisted metal–organic CVD: Structural and gas sensing properties. Surf. Coat. Technol. 2005, 200, 1057–1060. [Google Scholar] [CrossRef]
- Hitachi Energy. Gas-Insulated Switchgear (GIS). Available online: Https://Www.Hitachienergy.Com/It/It/Offering/Product-and-System/High-Voltage-Switchgear-and-Breakers/Gas-Insulated-Switchgear (accessed on 5 December 2021).
- Purnomoadi, A.; Mor, A.R.; Smit, J. Spacer flashover in Gas Insulated Switchgear (GIS) with humid SF6 under different electrical stresses. Int. J. Electr. Power Energy Syst. 2019, 116, 105559. [Google Scholar] [CrossRef]
- Purohit, P.; Höglund-Isaksson, L. Global emissions of fluorinated greenhouse gases 2005–2050 with abatement potentials and costs. Atmos. Chem. Phys. 2017, 17, 2795–2816. [Google Scholar] [CrossRef] [Green Version]
- Liu, H.; Zhou, Q.; Zhang, Q.; Hong, C.; Xu, L.; Jin, L.; Chen, W. Synthesis, Characterization and Enhanced Sensing Properties of a NiO/ZnO p–n Junctions Sensor for the SF6 Decomposition Byproducts SO2, SO2F2, and SOF2. Sensors 2017, 17, 913. [Google Scholar] [CrossRef] [Green Version]
- Ramgir, N.S.; Sharma, P.K.; Datta, N.; Kaur, M.; Debnath, A.; Aswal, D.; Gupta, S. Room temperature H2S sensor based on Au modified ZnO nanowires. Sens. Actuators B Chem. 2013, 186, 718–726. [Google Scholar] [CrossRef]
- Zeng, Z.; Wang, K.; Zhang, Z.; Chen, J.; Zhou, W. The detection of H2S at room temperature by using individual indium oxide nanowire transistors. Nanotechnology 2008, 20, 045503. [Google Scholar] [CrossRef]
- Kaur, M.; Jain, N.; Sharma, K.; Bhattacharya, S.; Roy, M.; Tyagi, A.; Gupta, S.; Yakhmi, J.V. Room-temperature H2S gas sensing at ppb level by single crystal In2O3 whiskers. Sens. Actuators B Chem 2008, 133, 456–461. [Google Scholar] [CrossRef]
- Steinhauer, S.; Brunet, E.; Maier, T.; Mutinati, G.; Köck, A. Suspended CuO nanowires for ppb level H2S sensing in dry and humid atmosphere. Sens. Actuators B Chem. 2013, 186, 550–556. [Google Scholar] [CrossRef]
- Peng, S.; Wu, G.; Song, W.; Wang, Q. Application of Flower-Like ZnO Nanorods Gas Sensor Detecting Decomposition Products. J. Nanomater. 2013, 2013, 1–7. [Google Scholar] [CrossRef]
- Zhang, X.; Zhang, J.; Jia, Y.; Xiao, P.; Tang, J. TiO2 Nanotube Array Sensor for Detecting the SF6 Decomposition Product SO2. Sensors 2012, 12, 3302–3313. [Google Scholar] [CrossRef] [PubMed]
- Park, S.; Park, S.; Jung, J.; Hong, T.; Lee, S.; Kim, H.W.; Lee, C. H2S gas sensing properties of CuO-functionalized WO3 nanowires. Ceram. Int. 2014, 40, 11051–11056. [Google Scholar] [CrossRef]
- Zhang, X.; Yu, L.; Tie, J.; Dong, X. Gas Sensitivity and Sensing Mechanism Studies on Au-Doped TiO2 Nanotube Arrays for Detecting SF6 Decomposed Components. Sensors 2014, 14, 19517–19532. [Google Scholar] [CrossRef] [Green Version]
- Li, L.; Din, S.U.; Haq, M.U.; Tang, N.; Zhang, M.; Rahman, N.; Zhu, L. Room temperature monitoring of SF6 decomposition byproduct SO2F2 based on TiO2/NiSO4 composite nanofibers. Nanotechnology 2021, 32, 305705. [Google Scholar] [CrossRef]
- Peng, S.; Wu, G.; Song, W. Synthesis, Characteristics and Enhanced Sulfur Dioxide Sensing Properties of Cu-Doped SnO2 Microspheres. Sens. Transducers 2013, 156, 310–316. [Google Scholar]
- Sun, G.-J.; Kheel, H.; Lee, J.K.; Choi, S.; Lee, S.; Lee, C. H2S gas sensing properties of Fe2O3 nanoparticle-decorated NiO nanoplate sensors. Surf. Coat. Technol. 2016, 307, 1088–1095. [Google Scholar] [CrossRef]
- Zhang, X.; Tie, J.; Zhang, J. A Pt-Doped TiO2 Nanotube Arrays Sensor for Detecting SF6 Decomposition Products. Sensors 2013, 13, 14764–14776. [Google Scholar] [CrossRef] [PubMed] [Green Version]
- Lu, Z.; Zhou, Q.; Wang, C.; Wei, Z.; Xu, L.; Gui, Y. Electrospun ZnO–SnO2 Composite Nanofibers and Enhanced Sensing Properties to SF6 Decomposition Byproduct H2S. Front. Chem. 2018, 6, 540. [Google Scholar] [CrossRef] [PubMed] [Green Version]
- Wei, Z.; Zhou, Q.; Zeng, W. Hierarchical WO3–NiO microflower for high sensitivity detection of SF6 decomposition byproduct H2S. Nanotechnology 2020, 31, 215701. [Google Scholar] [CrossRef] [PubMed]
- Ahmad, R.; Majhi, S.M.; Zhang, X.; Swager, T.M.; Salama, K.N. Recent progress and perspectives of gas sensors based on vertically oriented ZnO nanomaterials. Adv. Colloid Interface Sci. 2019, 270, 1–27. [Google Scholar] [CrossRef]
Figure 1.
Sources of main greenhouse gas emission [1]; originally published under Creative Commons Attribution 3.0 Unported (CC BY 3.0) license.
Figure 1.
Sources of main greenhouse gas emission [1]; originally published under Creative Commons Attribution 3.0 Unported (CC BY 3.0) license.

Figure 2.
Emissions of global greenhouse gases based on the type and source of gas. Reprinted with permission from reference [11].
Figure 2.
Emissions of global greenhouse gases based on the type and source of gas. Reprinted with permission from reference [11].

Figure 3.
Various configurations of electrodes being used for chemiresistive gas sensors. (a) Cylindrical; (b) disk-type; (c) planar contacts; (d) inter-digitated electrode. Elaboration from reference [22]. Reprinted with permission under CC license.
Figure 3.
Various configurations of electrodes being used for chemiresistive gas sensors. (a) Cylindrical; (b) disk-type; (c) planar contacts; (d) inter-digitated electrode. Elaboration from reference [22]. Reprinted with permission under CC license.

Figure 4.
Schematic representation of a porous film with different grain size and energy band. (λD: Debye length; xg: Grain size; x0: Depletion layer thickness) Reprinted with permission from reference [21].
Figure 4.
Schematic representation of a porous film with different grain size and energy band. (λD: Debye length; xg: Grain size; x0: Depletion layer thickness) Reprinted with permission from reference [21].

Figure 5.
MOXs features that influence their gas-sensing properties. Elaboration from reference [31].
Figure 5.
MOXs features that influence their gas-sensing properties. Elaboration from reference [31].

Figure 6.
Features influenced by metal oxide–metal oxide nanocomposite formation. Elaboration from reference [34].
Figure 6.
Features influenced by metal oxide–metal oxide nanocomposite formation. Elaboration from reference [34].

Figure 7.
Global concentrations of CO2 in the atmosphere during the period 1960–2021. Elaboration from reference [42]. © Global Monitoring Laboratory (GML) of the National Oceanic and Atmospheric Administration (NOAA).
Figure 7.
Global concentrations of CO2 in the atmosphere during the period 1960–2021. Elaboration from reference [42]. © Global Monitoring Laboratory (GML) of the National Oceanic and Atmospheric Administration (NOAA).

Figure 8.
Variations of CO2 sensor response with respect to temperature for ZnO nanorods based sensors: (a) Ge-doped; (b) Nd-doped; (c) W-doped. Reprinted with permission from reference [46].
Figure 8.
Variations of CO2 sensor response with respect to temperature for ZnO nanorods based sensors: (a) Ge-doped; (b) Nd-doped; (c) W-doped. Reprinted with permission from reference [46].

Figure 9.
Change of the impedance value for a screen-printed ZnO sensor based on a commercial powder at 200 °C: under dry air (a); humid air (75 RH%) and 250 ppm of CO2 (b).
Figure 9.
Change of the impedance value for a screen-printed ZnO sensor based on a commercial powder at 200 °C: under dry air (a); humid air (75 RH%) and 250 ppm of CO2 (b).

Figure 10.
(a) The corresponding exponential correlation between the gas response and gas concentration; (b) stability state towards 3000 ppm of methane at 340 °C based on 2.5 mol% Pd-SnO2 nanoporous composite. Reprinted with permission from reference [76].
Figure 10.
(a) The corresponding exponential correlation between the gas response and gas concentration; (b) stability state towards 3000 ppm of methane at 340 °C based on 2.5 mol% Pd-SnO2 nanoporous composite. Reprinted with permission from reference [76].

Figure 11.
Gas response of pure tungsten trioxide and SnO2-doped WO3 towards 500 ppm of CH4 at various working temperatures. Reprinted with permission from reference [80] under CC license.
Figure 11.
Gas response of pure tungsten trioxide and SnO2-doped WO3 towards 500 ppm of CH4 at various working temperatures. Reprinted with permission from reference [80] under CC license.

Figure 12.
Baseline fluorinated gases (HFCs, PFCs, and SF6) by source sector from 2005 to 2050 [107] under CC license.
Figure 12.
Baseline fluorinated gases (HFCs, PFCs, and SF6) by source sector from 2005 to 2050 [107] under CC license.


Table 1.
Contributions of the most important long-lived greenhouse gases to the increase in global radiative force from the pre-industrial era to 2019 [3].
Table 1.
Contributions of the most important long-lived greenhouse gases to the increase in global radiative force from the pre-industrial era to 2019 [3].
| Greenhouse Gases | Sources/Emission (%) |
|---|---|
| carbon dioxide | deforestation and combustion of fossil fuel/66 |
| methane | wetlands, termites, ruminants, rice agriculture, fossil fuel exploitation, landfills and biomass burning/16 |
| nitrous dioxide | soil and animal manure management, sewage treatment, fossil fuel combustion, and chemical industrial processes/7 |
| CFC12 (dichlorodifluoro methane) | refrigeration systems/5 |
| CFC11 (trichlorofluoro methane) | refrigeration systems/2 |
| other | refrigeration systems, electrical insulator, semiconductors and LCD panels manufacturing, etc./4 |
Table 2.
Influence of bulk doping on gas-sensing characteristics of SnO2 and In2O3 sensors [13].
Table 2.
Influence of bulk doping on gas-sensing characteristics of SnO2 and In2O3 sensors [13].
| Additive | Effect | Nature |
|---|---|---|
| Noble metals (less than 5 wt%) (Pd, Pt, Rh, Ag, Au) | increases response to reducing gases decreases operating temperature decreases response time | catalytic effect change of A/D parameters decrease of O2 dissociation temperature |
| Al2O3, SiO2 | increases sensor response improves thermal stability | decrease of grain size decrease of area of intergrain contact increase of porosity |
| Ag (Ag2O), Cu (Cu2O) | increases response to H2S, SO2 | two-phase system phase transformations during gas detection |
| Fe (Fe2O3) | increases response to alcohols | change of oxidation state |
| Ga (Ga2O3), Zn (ZnO) | increases sensor response | Decrease of grain size Increase of porosity |
| P, B | Improves selectivity | Creation of new phase |
| Ca, K, Rb, Mg | Increases sensor response Improves thermal stability | Decrease of grain size |
| La, Ba, Y, Ce | Improves thermal stability Increases sensor response | Stabilization of grain size (creation of new phase) Decrease of grain size |
| Transition MOXs (<0.5 wt%) (Co, Mn, Sr, Ni) | Increases sensor response Improves selectivity | Catalytic effect Change of electron concentration Change of A/D parameters Change of grain size |
Table 3.
Change of resistance value for MOX-based sensor in the presence of oxidizing/reducing gases.
Table 3.
Change of resistance value for MOX-based sensor in the presence of oxidizing/reducing gases.
| Type of Sensitive Material | Target Gas/Variation of Resistance | Response |
|---|---|---|
| p-type | reducing/increases | |
| oxidizing/decreases | ||
| n-type | reducing/decreases | |
| oxidizing/increases |
Table 4.
Brief summary of metal oxide semiconductor-based CO2 gas sensors.
| Material | Structure/Synthesis Method | Target Gas/ Concentration (ppm) | Operating T (°C) | Response (%) | Ref. |
|---|---|---|---|---|---|
| ZnO | thin film/chemical spray pyrolysis | CO2/400 | 350 | 65 | [48] |
| ZnO | nanowires/sol-gel | CO2/15 | 200 | 1.04 | [49] |
| ZnO | nanostructures films/sol-gel | CO2/50 (sccm) | RT | 1.0 | [41] |
| Na/ZnO | spin-coated | 81.9 | |||
| CeO2 | nano pellets/co-precipitation | CO2/800 | 400 | ~33 | [50] |
| Gd/CeO2 | nano pellets/co-precipitation | CO2/800 | 250 | 45 | |
| W/ZnO | nanorods/mechanochemical combustion | CO2/1000 | 450 | ~98 | [46] |
| La/ZnO | nanopowders/hydrothermal | CO2/5000 | 400 | 65 | [51] |
| Ca/ZnO | nanopowders/sol-gel | CO2/5% | 450 | 113 | [52] |
| Ca/ZnO | thin film/wet chemical | CO2/25,000 | 400 | 32 | [53] |
| CuO/BaTiO3 | BaTiO3 spheroids decorated with CuO microleaves/co-precipitating | CO2/1000 | 140 | 52 | [54] |
| CuO | porous film/pneumatic spray pyrolysis | CO2/100 | RT | 1.04 | [55] |
| Zn/SnO2 | thin films/spray pyrolysis | CO2/500 | 310 | 94.4 | [56] |
| ZnO/SnO2 | nanocomposites/screen printing | CO2/70 | RT | ~0.64 | [57] |
| La2O3/SnO2 | nanofibers/electrospinning | CO2/100 | 300 | 5.1 | [58] |
| Au-La2O3/SnO2 | nanofibers/electrospinning, sputtering | CO2/100 | 300 | 10.1 | |
| La/SnO2 | nanofilm/hydrothermal, impregnation | CO2/500 | 250 | 29.8 | [59] |
| CO2/50 | 5.12 | ||||
| CdO | nanowires/microwave-assisted wet chemical | CO2/5000 | 250 | ~1.5 | [60] |
| CdO | rod-like nanostructure/microwave radiation | CO2/5% | 250 | 3 | [61] |
| Sn/CdO | spherical shaped structures/microwave assisted wet chemical | 15 | |||
| CaO/In2O3 | mesoporous/impregnation | CO2/2000 | 230 | ~1.8 | [62] |
| YPO4 | nanobelts/surfactant-assisted colloidal | CO2/200 | 400 | - | [63] |
| La2O3 | microrods thin films/chemical bath deposition | CO2/350 | 250 | 48 | [64] |
| CO2/100 | 4.8 | ||||
| LaFeO3/SnO2 | nanocomposites porous film/sol-gel, hydrothermal | CO2/4000 | 250 | 2.72 | [65] |
| LaFeO3 | nanocrystalline/sol-gel | CO2/2000 | 300 | 2.19 | [66] |
| Pd/La2O3 | thin-film/spray pyrolysis, ionic layer adsorption and reaction | CO2/500 | 250 | 28 | [67] |
| La2O3 | thin-film/spray pyrolysis | 13 | |||
| Cr/TiO2 | thin-film/RF magnetron sputtering | CO2/10% | 55 | ~9 | [68] |
| Al2O3/TiO2 | heterostructure/ALD | CO2/5 | RT | 30.6 | [69] |
RT = room temperature; ALD = atomic layer deposition.
Table 5.
A brief summary of MOX-based CH4 gas sensors.
| Material | Structure/Synthesis Method | Target Gas/ Concentration (ppm) | Operating T (°C) | Response (%) | Ref. |
|---|---|---|---|---|---|
| TiO2 | nanorods/hydrothermal | CH4/60 | RT | 6028 | [87] |
| CH4/5 | 987 | ||||
| Cd/TiO3 | thin films/magnetron co-sputtering | CH4/500 | 250 | 3.4 | [88] |
| VO2 | nanorods/thermal evaporation | CH4/500 | RT | 35 | [89] |
| V2O5 | nano-flowers/magnetron sputtering | CH4/500 | 100 | 11.2 | [90] |
| nano-rods | 8.9 | ||||
| nano-urchins | 9.1 | ||||
| Au/VO2 | nanosheets/CVD, ion sputtering | CH4/500 | RT | ~70 | [83] |
| SnO2 | nanoparticles/sol-gel | CH4/20,000 | 80 | ~3.5 | [91] |
| SnO2 | quantum dots/sonication assisted precipitation | CH4/5000 | >375 | ~100 | [92] |
| SnO2/WO3 | nanosheets/impregnation | CH4/500 | 90 | ~2 | [80] |
| WO3 | nanosheets/hydrothermal | ~1.5 | |||
| Pd/SnO2 | hollow spheres/adsorption– calcination | CH4/250 | 300 | 4.88 | [93] |
| SnO2 | hollow spheres/progressive inward crystallization routine | 400 | 1.31 | ||
| SnO2/NiO | porousnanosheets/immersion-calcination | CH4/500 | 330 | 15.2 | [94] |
| ZnO/rGO | nanorods, nanosheets/hydrothermal | CH4/100–4000 | 190 | 4.52 | [95] |
| ZnO/NiO | porous nanosheets/hydrothermal, post-treatment | CH4/1000 | 340 | 34.2 | [86] |
| Pd/SnO2 | nanoporous/hydrothermal | CH4/3000 | 340 | 17.6 | [76] |
| NiO/Al | thin films/RF sputtering | CH4/100 | RT | 58 | [96] |
| ZnO | nanoporous/electrochemical deposition | CH4/100 | 220 | ~4.8 | [97] |
| ZnO | nanowalls/thermal evaporation | CH4/100 | 300 | 8.1 | [98] |
| Co/ZnO | nanoparticles/solvothermal | CH4/100 | 140 | 1.05 | [99] |
| α-Fe2O3 | nanoparticles/commercial | CH4/4000 | RT | 1.08 | [100] |
| αFe1.92/Cu0.08O3 | nanoparticles/homogenous co-precipitation | 1.12 |
CDV = chemical vapor transport deposition; RT = room temperature; rGO = reduced graphene oxide; RF = radio frequency.
Table 6.
Summary of MOX-based nitrous oxide gas sensors.
| Material | Structure/Synthesis Method | Target Gas/ Concentration (ppm) | Operating T (°C) | Sensitivity | Ref. |
|---|---|---|---|---|---|
| BaO/SnO2 | co-precipitation | N2O/300 | 500 | 3 | [38] |
| Sm2O3/SnO2 | 3 | ||||
| PbO/SnO2 | 2.5 | ||||
| Gd2O3/SnO2 | 2.7 | ||||
| SrO/SnO2 | co-precipitation | N2O/300 | 450 | 1.66 | |
| 500 | 4.5 | ||||
| In2O3 | nanowires/carbothermal | N2O/10 | 250 | ~5 | [103] |
| WO3 | nanowires/solvothermal | 25 | |||
| ZnO | nanorods/self-assembly of ZnO nanodots | ~5 | |||
| Au/SnOx | films/L-MOCVD | N2O/100 | 210 | 11.5 | [104] |
| SnO2 | N2O/300 | 450 | 1.66 |
L-MOCVD = laser-induced metal–organic chemical vapor deposition; RT = room temperature.
Table 7.
Summary of MOX-based sensor towards SF6 decomposed products.
| Material | Structure/Synthesis Method | Target Gas/ Concentration (ppm) | Operating T (°C) | Response (%) | Ref. |
|---|---|---|---|---|---|
| NiO/ZnO | nanoflowers/hydrothermal | SO2, SOF2, SO2F2/100 | 260 | SO2 (33.35) SOF2 (22.25) SO2F2 (36.67) | [108] |
| Au/ZnO | nanowires/hydrothermal | H2S/1 | RT | 38 | [109] |
| In2O3 | nanowires/chemical vapor deposition | H2S/1 | RT | 30.4 | [110] |
| In2O3 | single crystal whisker/carbothermal method | H2S/200 ppb | RT | 47.9 | [111] |
| CuO | nanowires/resistive heating of Cu wires | H2S/10 ppb | 325 | 40.9 | [112] |
| ZnO | flower-like nanorods/ hydrothermal | SO2, SOF2, SO2F2/10 (μL/L) | (SO2)250 (SOF2 and SO2F2) 300 | SO2 (−33.44) SOF2 (−12.47) SO2F2 (−18.06) | [113] |
| TiO2 | nanotube array/anodic oxidation | SO2, SOF2, SO2F2/50 | 200 | SO2 (−76) SOF2 (−7.8) SO2F2 (−5.5) | [114] |
| CuO/WO3 | nanowires/thermal evaporation followed sputter-deposition, thermal annealing | H2S/100 | 300 | 6.72 | [115] |
| TiO2 | nanotube array/anodic oxidation | SO2, SOF2, SO2F2/50 | 110 | SO2 (−74.6) SOF2 (−7.82) SO2F2 (−5.52) | [116] |
| Au/TiO2 | nanotube array/ deposition-precipitation | SO2, SOF2, SO2F2/50 | 110 | SO2F2 (−19.95) SOF2 (−9.97) SO2 (−8.73) | |
| TiO2/NiSO4 | nanofibers/electrospun, hydrothermal | SO2F2/100 | RT | 189 | [117] |
| SnO2 | microspheres/hydrothermal | SO2/30 | 300 | 43.15 | [118] |
| Cu/SnO2 | microspheres/conventionalindirect heating | 275 | 23.37 | ||
| Fe2O3/NiO | nanoplates/solvothermal | H2S/50 | 200 | 26.48 | [119] |
| Pt/TiO2 | nanotube arrays/pulse electrodeposition | SO2, SOF2, SO2F2/50 | 150 | SO2 (8.38) SOF2 (6.11) SO2F2 (17.91) | [120] |
| ZnO/SnO2 | nanofibers/electrospinning | H2S/50 | 250 | 66.23 | [121] |
| WO3/NiO | nanoflowers/hydrothermal | H2S/20 | 160 | 33.34 | [122] |
Publisher’s Note: MDPI stays neutral with regard to jurisdictional claims in published maps and institutional affiliations. |
© 2022 by the authors. Licensee MDPI, Basel, Switzerland. This article is an open access article distributed under the terms and conditions of the Creative Commons Attribution (CC BY) license (https://creativecommons.org/licenses/by/4.0/).
Share and Cite
MDPI and ACS Style
Dadkhah, M.; Tulliani, J.-M. Nanostructured Metal Oxide Semiconductors towards Greenhouse Gas Detection. Chemosensors 2022, 10, 57. https://0-doi-org.brum.beds.ac.uk/10.3390/chemosensors10020057
AMA Style
Dadkhah M, Tulliani J-M. Nanostructured Metal Oxide Semiconductors towards Greenhouse Gas Detection. Chemosensors. 2022; 10(2):57. https://0-doi-org.brum.beds.ac.uk/10.3390/chemosensors10020057
Chicago/Turabian StyleDadkhah, Mehran, and Jean-Marc Tulliani. 2022. "Nanostructured Metal Oxide Semiconductors towards Greenhouse Gas Detection" Chemosensors 10, no. 2: 57. https://0-doi-org.brum.beds.ac.uk/10.3390/chemosensors10020057
Note that from the first issue of 2016, this journal uses article numbers instead of page numbers. See further details here.