1. Introduction
Adverse drug reactions (ADRs) caused by the human leukocyte antigen (HLA) alleles [
1,
2] have been frequently reported in the literature. More than a dozen prescribed drugs have been listed for HLA alleles and their responsible ADRs [
1]. For instance, allele HLA-B* 58:01 was discovered to be associated with severe allergies from the prescribed drug Allopurinol, a generally prescribed drug for metabolic arthritis [
3]; alleles HLA-B* 15:13 and 15:02 from drug Phenytoin [
4]; and allele HLA-A* 31:01 from drug carbamazepine [
5] for treatments of epilepsy. An early clinical diagnosis of potential alleles before drug medication will be very helpful to avoid ADRs.
Alleles are one or more variant forms from given genes. In the simplest form, an allele is a single nucleotide polymorphism (SNP) variation from a gene. For an instance, allele HLA-A* 31:01 is with an SNP of nucleic acid T variant from A. The current dominating SNP-recognition techniques basically constitute two approaches. The polymerase-chain-reaction-sequencing-based typing (PCR-SBT) directly acquires the desired gene sequences [
6] to straightforwardly investigate the polymorphism; however, this approach requires an instrument analysis and much spot-checking labor on sequences, due to genetic complexity. The polymerase chain reaction with sequence-specific primers (PCR-SSP) is the other common approach, which adopts two forward primers individually, fully matching their corresponding target genes. Since these two primers only have one different spot in order to identify the SNP base, the 3′ end effect at that mismatched SNP base could cause the identification failure [
7]. The primer design is therefore extremely critical for the SNP-recognition performance [
8,
9]. This study demonstrates how to design appropriate forward primers to distinguish the gene model, HLA-A 31:01, from its allele on the membrane-based lateral-flow (MBLF) strips.
The MBLF detection is one of the most important tools used for rapid medical diagnoses and public-health research activities. It has been a popular platform for rapid tests since its first introduction in the late 1980s for pregnancy tests. The MBLF detection offers low cost and operational simplicity for end users. It also allows untrained personnel to operate in an environment where access to laboratory instrumentation is limited or unavailable. The MBLF detection has been widely applied in food safety [
10,
11], personalized medicine [
12], detections of cancer biomarkers [
13,
14,
15], single-stranded nucleic acid [
16], human immunodeficiency virus (HIV) [
17], and plant pathogenic virus [
18]. The current application of MBLF detection to COVID-19 [
19,
20] analytes is another good example.
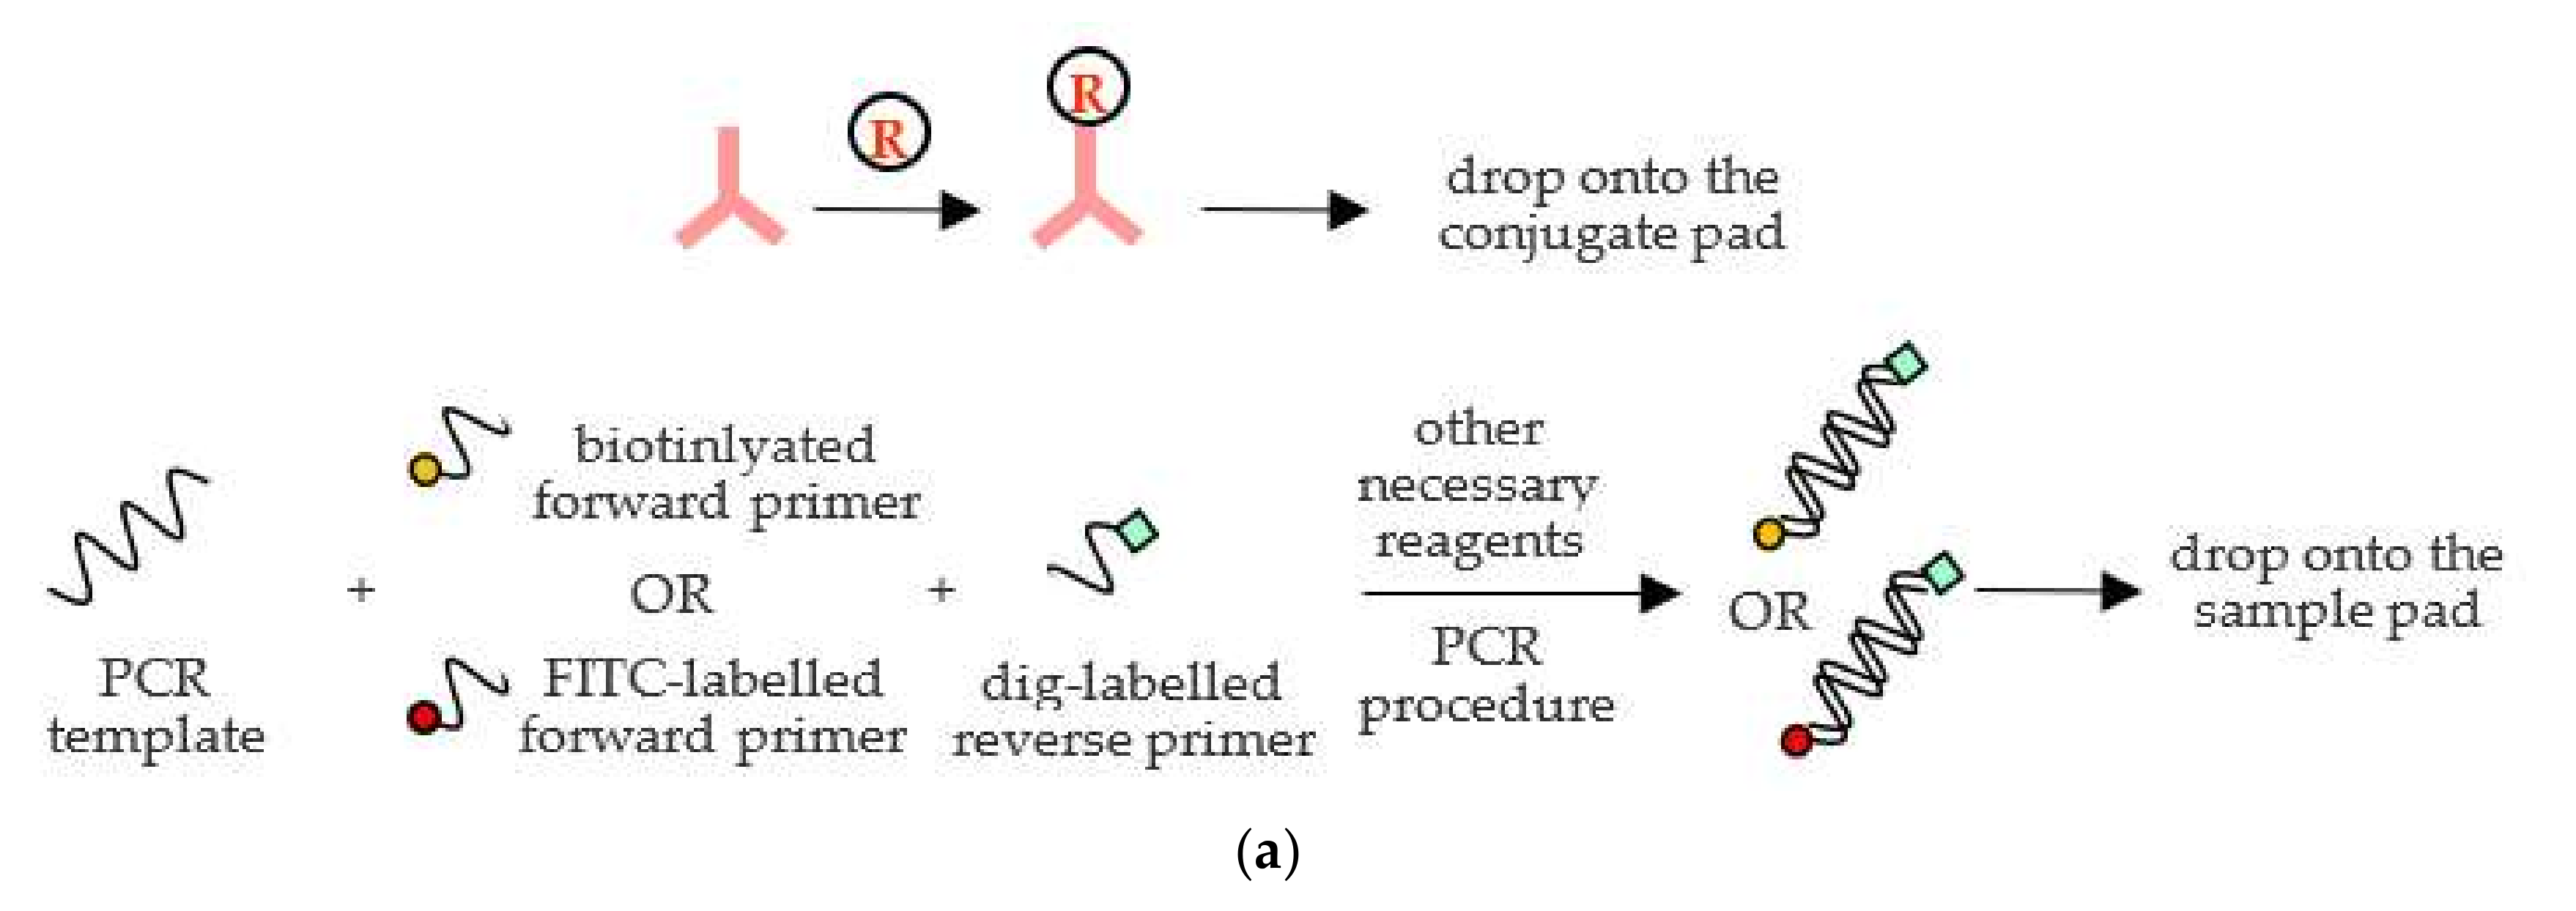
In this study, the genetic model, HLA-A31:01, and its allele amplicons were amplified by the polymerase chain reaction (PCR) and labeled with biotin and FITC, respectively, on their forward primers but share the same ligand—digoxigenin—which is labeled on their identical reverse primer as shown in
Figure 1a. Following the amplification step, the PCR products were dropped onto the sample pad of the MBLF strips for identification, as shown in
Figure 1. When the PCR products flowed onto the neighboring conjugate pad, their digoxigenin ligand was captured by the report antibody, mouse anti-digoxigenin antibody, which was tagged in advance with nano-gold particles for readouts. The capturing complex then continuously flowed onto the porous polymer surface of nitrocellulose membrane (NC) induced by a capillary force. As the complex kept flowing ahead and encountered the multiple test lines, it was captured by the affinitive receptor streptavidin (test line 1), as shown in
Figure 1b, or antibody mouse anti-FITC (test line 2), as shown in
Figure 1c. The color development of nano-gold particles then reported the detection results. In real applications at care points, patients will be diagnosed with their HLA-A 31:01 gene to see if the SNP exists. Positive Test 1 line will tell if patients have a regular gene, while positive Test 2 line will confirm an allele. If none or both lines simultaneously appear as signals, the tests fail. The excessive unbound report antibody will keep flowing till touching the control line. Goat anti-mouse antibody, immobilized on the control line, will then capture the unbound report antibody to validate the tests. The absorbent pad placed at the end of the strips wicked fluid to keep a continuous flow along the strip.
We started the study with nine candidates of forward primers to investigate their PCR amplification performance by electrophoresis. Two primers then were selected to further conduct the identification tests of HLA-A 31:01 from its allele on the MBLF strips.
2. Materials and Methods
2.1. Materials
The gene HLA-A3101 (accession number at gene bank: NM_002116.7) served as the study model. Its PCR templates (173 bp) were with an SNP spot at the 20th nucleic-acid base in either A or its allele T (SNP cluster ID: rs1061235). These two amplicons were synthesized by Genvolution Inc., Taoyuan, Taiwan. Nine PCR forward primers and one reverse primer were designed for this recognition study. Their sequences are listed in
Table 1. The reverse primer and two selected forward primers were later labeled digoxigenin, biotin, and FITC, respectively. All PCR primers were also synthesized by Genvolution Inc., Taoyuan, Taiwan.
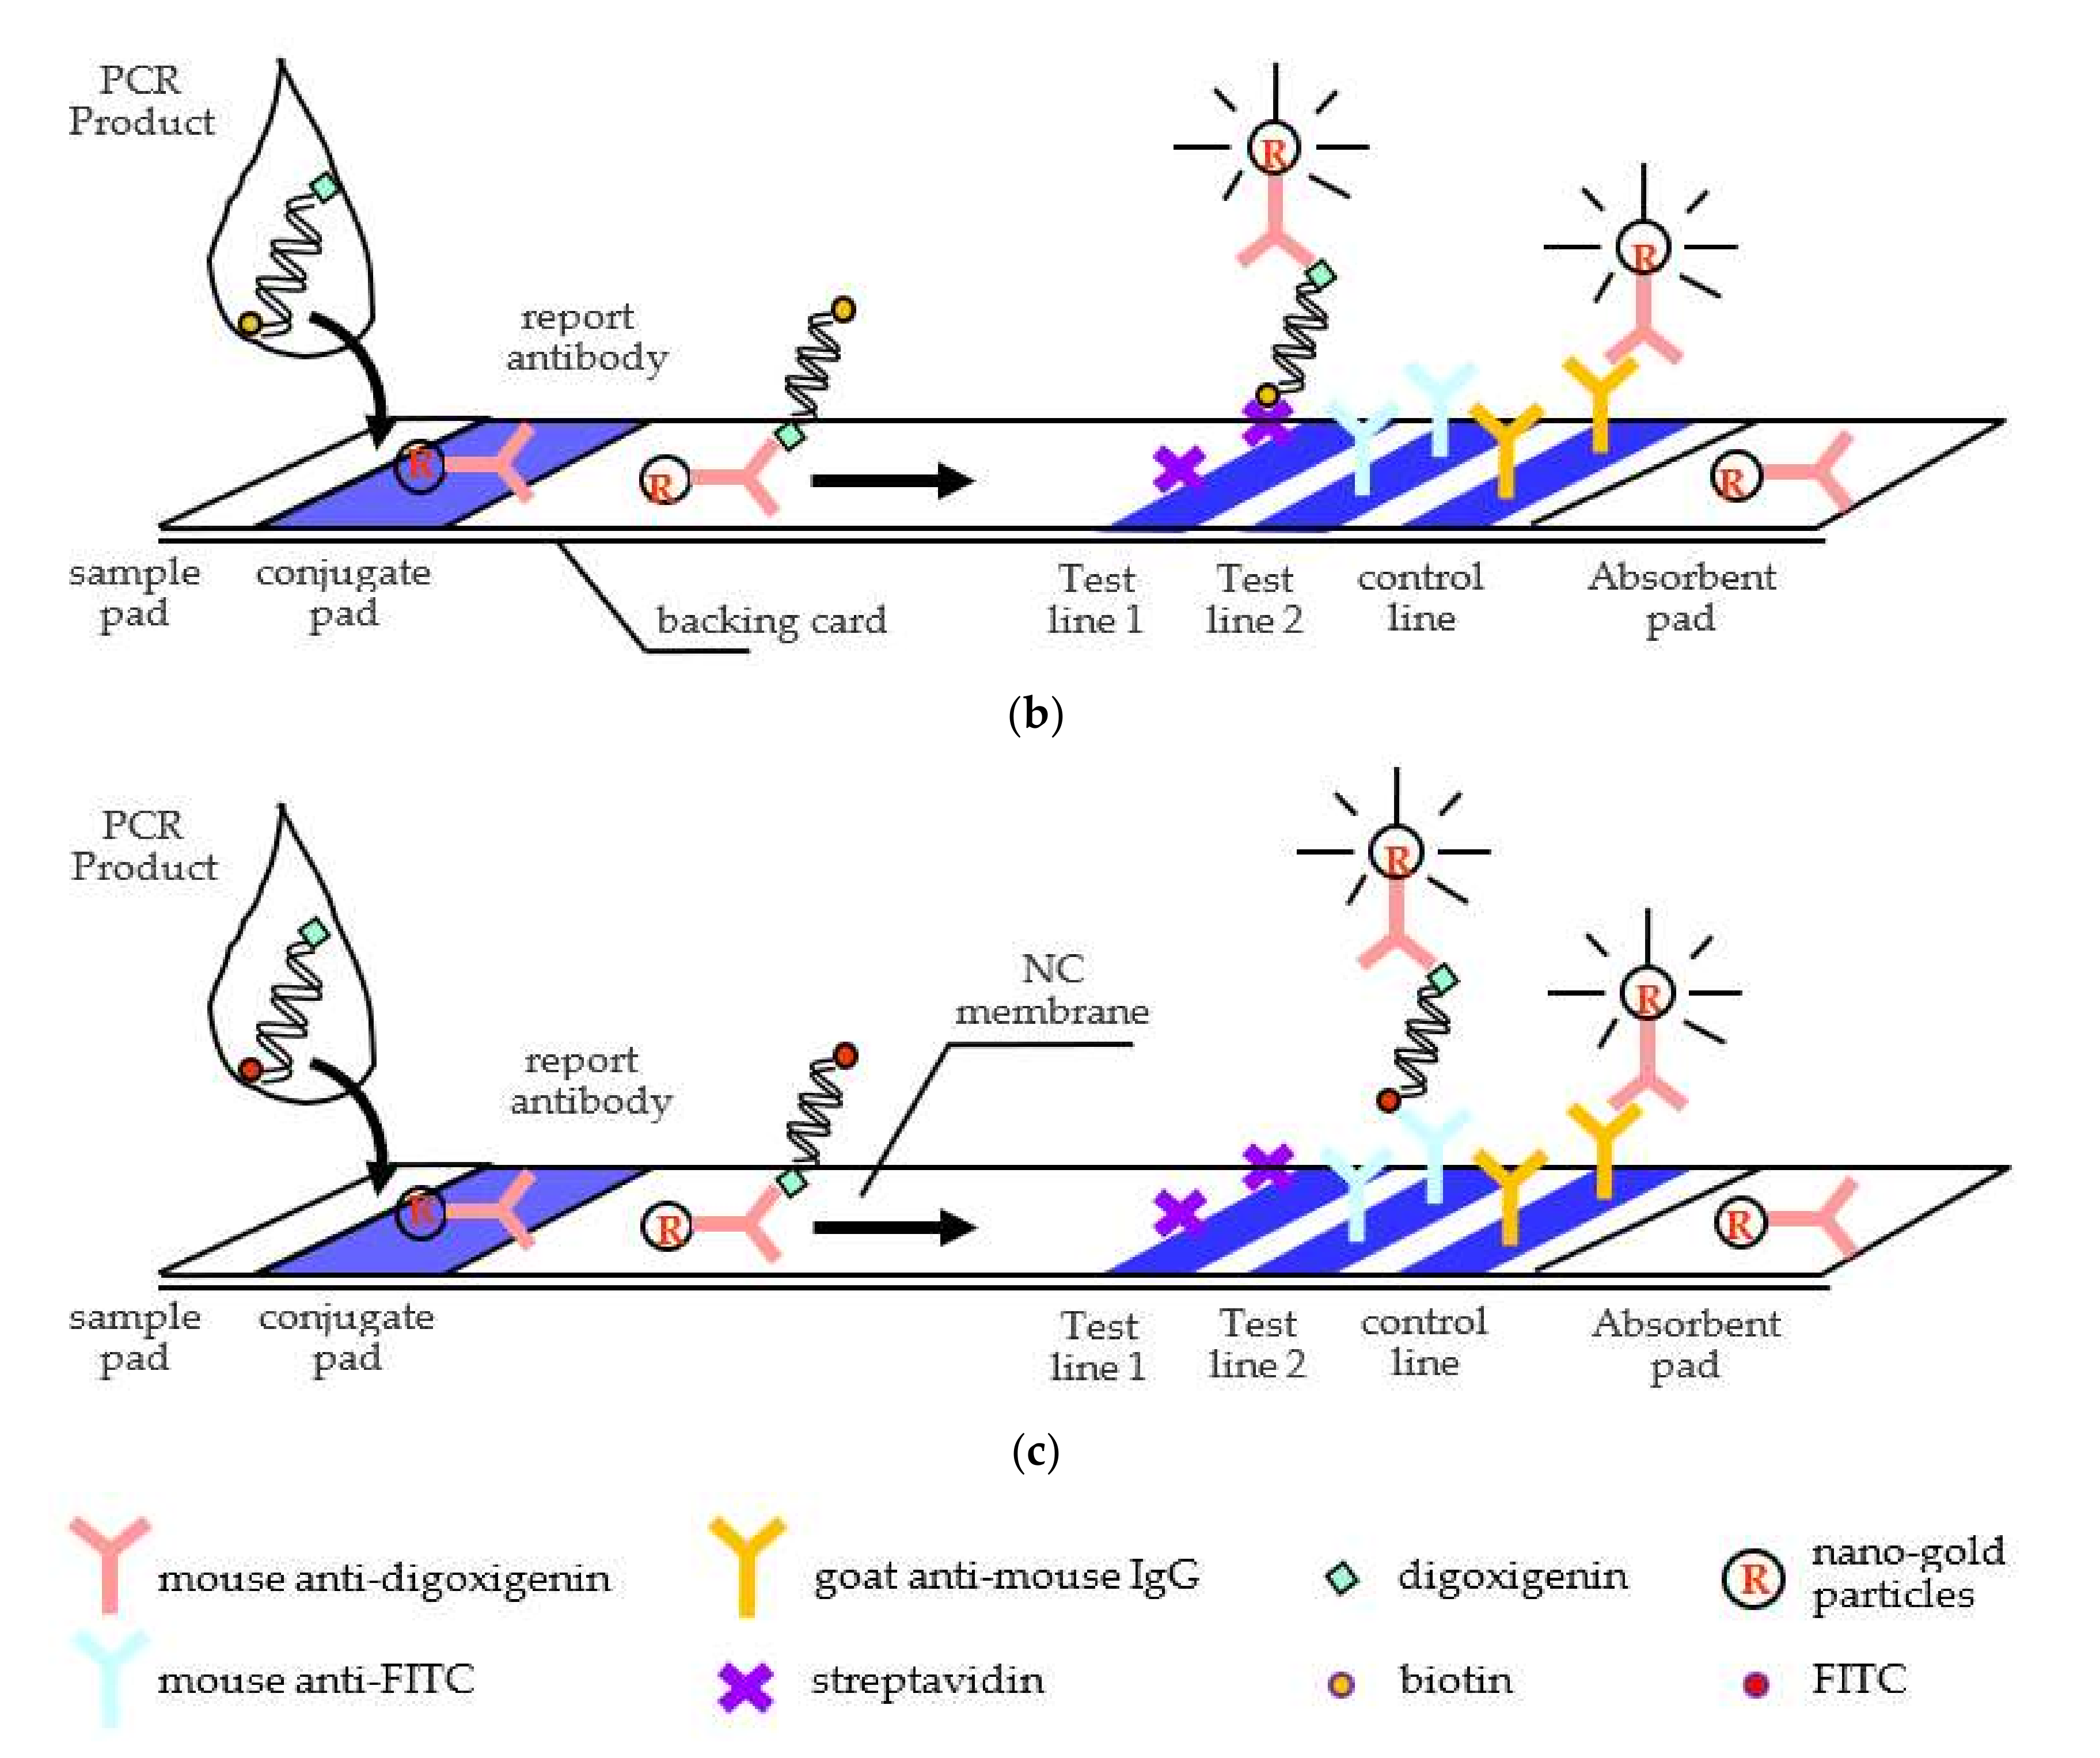
The corresponding matching conditions of the primer design are also shown in
Figure 2. As shown in that schematic, Forward Primer F1 is fully complementary with Template A but mismatched with Template T at the SNP base. Forward Primers F2 to F4 have more and more mismatches with both templates, but all primers are still stick at the end of Template A and loose on Template T. Forward Primers F5 to F7 are similar to Forward Primers F2 to F4, but all primers have the opposite conditions with two templates. Primers 8 and 9 are special designs with a partial match sequence at the second base from the end of Template T but with a mismatch on the other template.
The DNA segment (380 bp) of gene HLB-B5801 (gene bank: AJ420241.2) served as the first negative-control PCR template for tests. Gene HLB-B5801 is known to be responsible for allergic reactions to medicine Allopurinol, which is usually prescribed to cure complications related to metabolic arthritis from hyperuricemia. Another DNA segment (358 bp) that served as another negative-control PCR template was from genetic sequence H5 (gene bank: S68489.2). Gene H5 was the subtype of avian influenza virus, which generally spreads among poultry and birds. The outbreak in 2004 and the later reappearance of H5N1 caused human infections, deaths, and anxiety. Several efforts have been made to detect this fatal pathogen [
21] and cultivate effective vaccines to counter it [
22]. Its genetic sequence was notated as H5(358b) in this study. The DNA segment (252 bp) served as the third negative-control PCR template was Arabidopsis thaliana (gene bank: BT003995.1). Arabidopsis thaliana was the first plant genome to be sequenced and has become a popular model organism in plant biology and genetics [
23,
24]. This partial genetic sequence was notated as pda13015(252b) in this study. The last two genetic targets are suitable as the negative models since they are very different species from human and their genetic sequences have already been well studied. All these three PCR templates were from Purigo Biotech (Taipei, Taiwan).
The immunoreaction performed by the primary antibodies to capture the digoxigenin label was 1.3 mg/mL mouse anti–digoxigenin antibody (Fraction Monoclonal IgG), and capture FITC was 1.2 mg/mL mouse anti–fluorescein antibody (Fraction Monoclonal IgG). The immunoreaction to recognize the previous two antibodies was 0.8 mg/mL goat anti-mouse secondary antibody (AffiniPure IgG). All were purchased from Jackson ImmunoResearch Laboratories (West Grove, PA, USA). Colloidal gold of 40 nm for labelling the mouse anti–digoxigenin report antibody was purchased from Rega Biotech (Taipei, Taiwan).
The 2X SuperRed PCR Master Mix was obtained from Toolsbiotech (Taipei, Taiwan). Streptavidin of 1 mg/mL printed on membrane as the test line to capture the biotinylated PCR product was from Jackson ImmunoResearch Laboratories (West Grove, PA, USA). HealthView Nucleic Acid Stain for staining PCR products was from Genomics (Taipei, Taiwan). The DNA standard ladder (100 bp DNA Ladder H3 RTU) on the electrophoresis gel was purchased from GeneDireX (Taoyuan, Taiwan). The 5X TBE buffer that served as the electrophoresis buffer was from Jetfa Biotech (Taichung, Taiwan). The electrophoresis gel was made of agarose, obtained from Rainbow Biotech (Taipei, Taiwan).
The lateral flow buffer was made from 10X PBS Buffer, Tris-base, sodium chloride, magnesium chloride, and zinc chloride (all from Bio Basic, Markham, ON, Canada); hydrochloric acid and potassium carbonate (both from Sheen Yee, Taoyuan, Taiwan); and Triton-X-100 (Genemark Tech, Atlanta, GA, USA). The MBLF strips were composed of five elements: sample pad, conjugate pad, and adhesive backing card (ARcare9021D), purchased from Prisma Biotech (Taipei, Taiwan); nitrocellulose membrane (Pall VividTM 170) from Rainbow Biotech (Taipei, Taiwan); and absorbent pad (CFSP203000) from Bersing Tech (Hsinchu, Taiwan).
2.2. Instrument
The capturing reagents were printed on membrane by the printer AgitestTMRP–1000 (Rega, Taipei, Taiwan). The MBLF assembly was cut by the cutter JS-101 (Jih Shuenn Electrical Machine, Taichung, Taiwan). The PCR was performed on the machine SimpliAmp (Thermo Fisher Scientific, Waltham, MA, USA). The electrophoresis was performed on instrument MBE-150-PLUS (Scientific Biotech, Taichung, Taiwan). The electrophoresis gel was imaged by GeneFlash (Syngene, Frederick, MD, USA). The gold-labeled antibody was analyzed by instrument NanoDrop 1000 Spectrophotometer (Thermo Fisher Scientific, Waltham, MA, USA). The gold labeling procedure performed centrifugation at low temperature MIKRO 220R (Hettih, Tokyo, Japan). The MBLF strips were saved at the desiccator D-60C (Moisture Buster, Taichung, Taiwan). A HP4800 Scanner scanned the detection signals from the membrane. The quantitative analysis of the signal intensities was carried out by Image-J software (National Institutes of Health).
2.3. Assembly of the MBLF Strips
The MBLF strips were composed of sample pad, conjugate pad, nitrocellulose membrane, absorbent pad, and plastic backing card. To begin the strip assembling, one affixed the nitrocellulose membrane onto the plastic backing card, which was already coated with a thin layer of adhesive material. The test and control lines were then printed on the membrane with corresponding biological reagents, streptavidin and goat anti-mouse antibody, respectively, at about 0.53 μL per strip. Followed by that step, the absorbent pad was stuck onto the backing card at one end of the membrane, with 0.5 cm overlapping. At the other end of membrane, conjugate pad was also stuck, with 0.2 cm overlapping. Finally, the sample pad was stuck next to the conjugate pad, also with 0.2 cm overlapping. This element-to-element overlapping assembling was mainly for conducting continuous capillary flow. The finished assembly was then cut into 75 strips, each 6 cm long and 0.4 cm wide. They were then stored in a 40%RH desiccator for at least one day prior to usage.
2.4. Gold Labelling of the Report Antibody
A mixing tube was added 10 μL of mouse anti-digoxigenin antibody, 400 μL of 40-nm nano-gold particles, and 390 μL of the lateral-flow buffer, which contained 1X PBS, 10 mM Tris base, 0.15 M NaCl, 10 mM MgCl2, 1 mM ZnCl2, 10% BSA, and 0.1% Triton X-100. The mixture was well mixed on a shaking machine for 1.5 h After 10 min of 14,000-rpm centrifuge, the top clear liquid was removed and 20 μL of lateral-flow buffer was added. Next, 4 μL of the gold-labeled antibody solution was dropped on the conjugate pad of each MBLF strip. The performance of the gold labeling was evaluated by UV/VIS.
2.5. The PCR Process
The PCR tube was used to add 1 μL of 10 μM forward primer, 1 μL of 10 μM reverse primer, 1 μL of 1 ng/μL DNA template, 10.5 μL ddH2O, and 12.5 μL of 2X SuperRed PCR Master Mix. The tube was then placed onto the PCR machine with a setting of 25 μL reaction volume, with each cycle 95 °C of denaturation for 30 s, 53 °C of annealing for 30 s, and 72 °C of extension for 1 min, totaling 30 cycles.
The electrophoresis gel was prepared by mixing 1.8 g of agarose powder with 120 mL of 1X TBE buffer. The mixture was then microwaved until the powder was entirely dissolved. The reagent for staining nucleic acid was added into the mixture in 1 μL/20mL TBE. The mixture was then poured into the electrophoresis case, and a comb was inserted for casting for 30 min. After the PCR was complete, the PCR products were added onto the grooves of gel for running electrophoresis for 30 min. The gel was scanned under the UV imaging system.
2.6. Data Acquisition
A typical detection procedure was run by dropping 70 μL of a sample and mixing the lateral-flow buffer with PCR product amplified by a specific forward primer to a certain concentration, onto the sample pad of a MBLF strip. The detection signal was then read by the naked eye in 5 min. The strip was further placed on a HP scanner to acquire an image, whose signal intensity was measured on the test line by software Image-J.
3. Results and Discussion
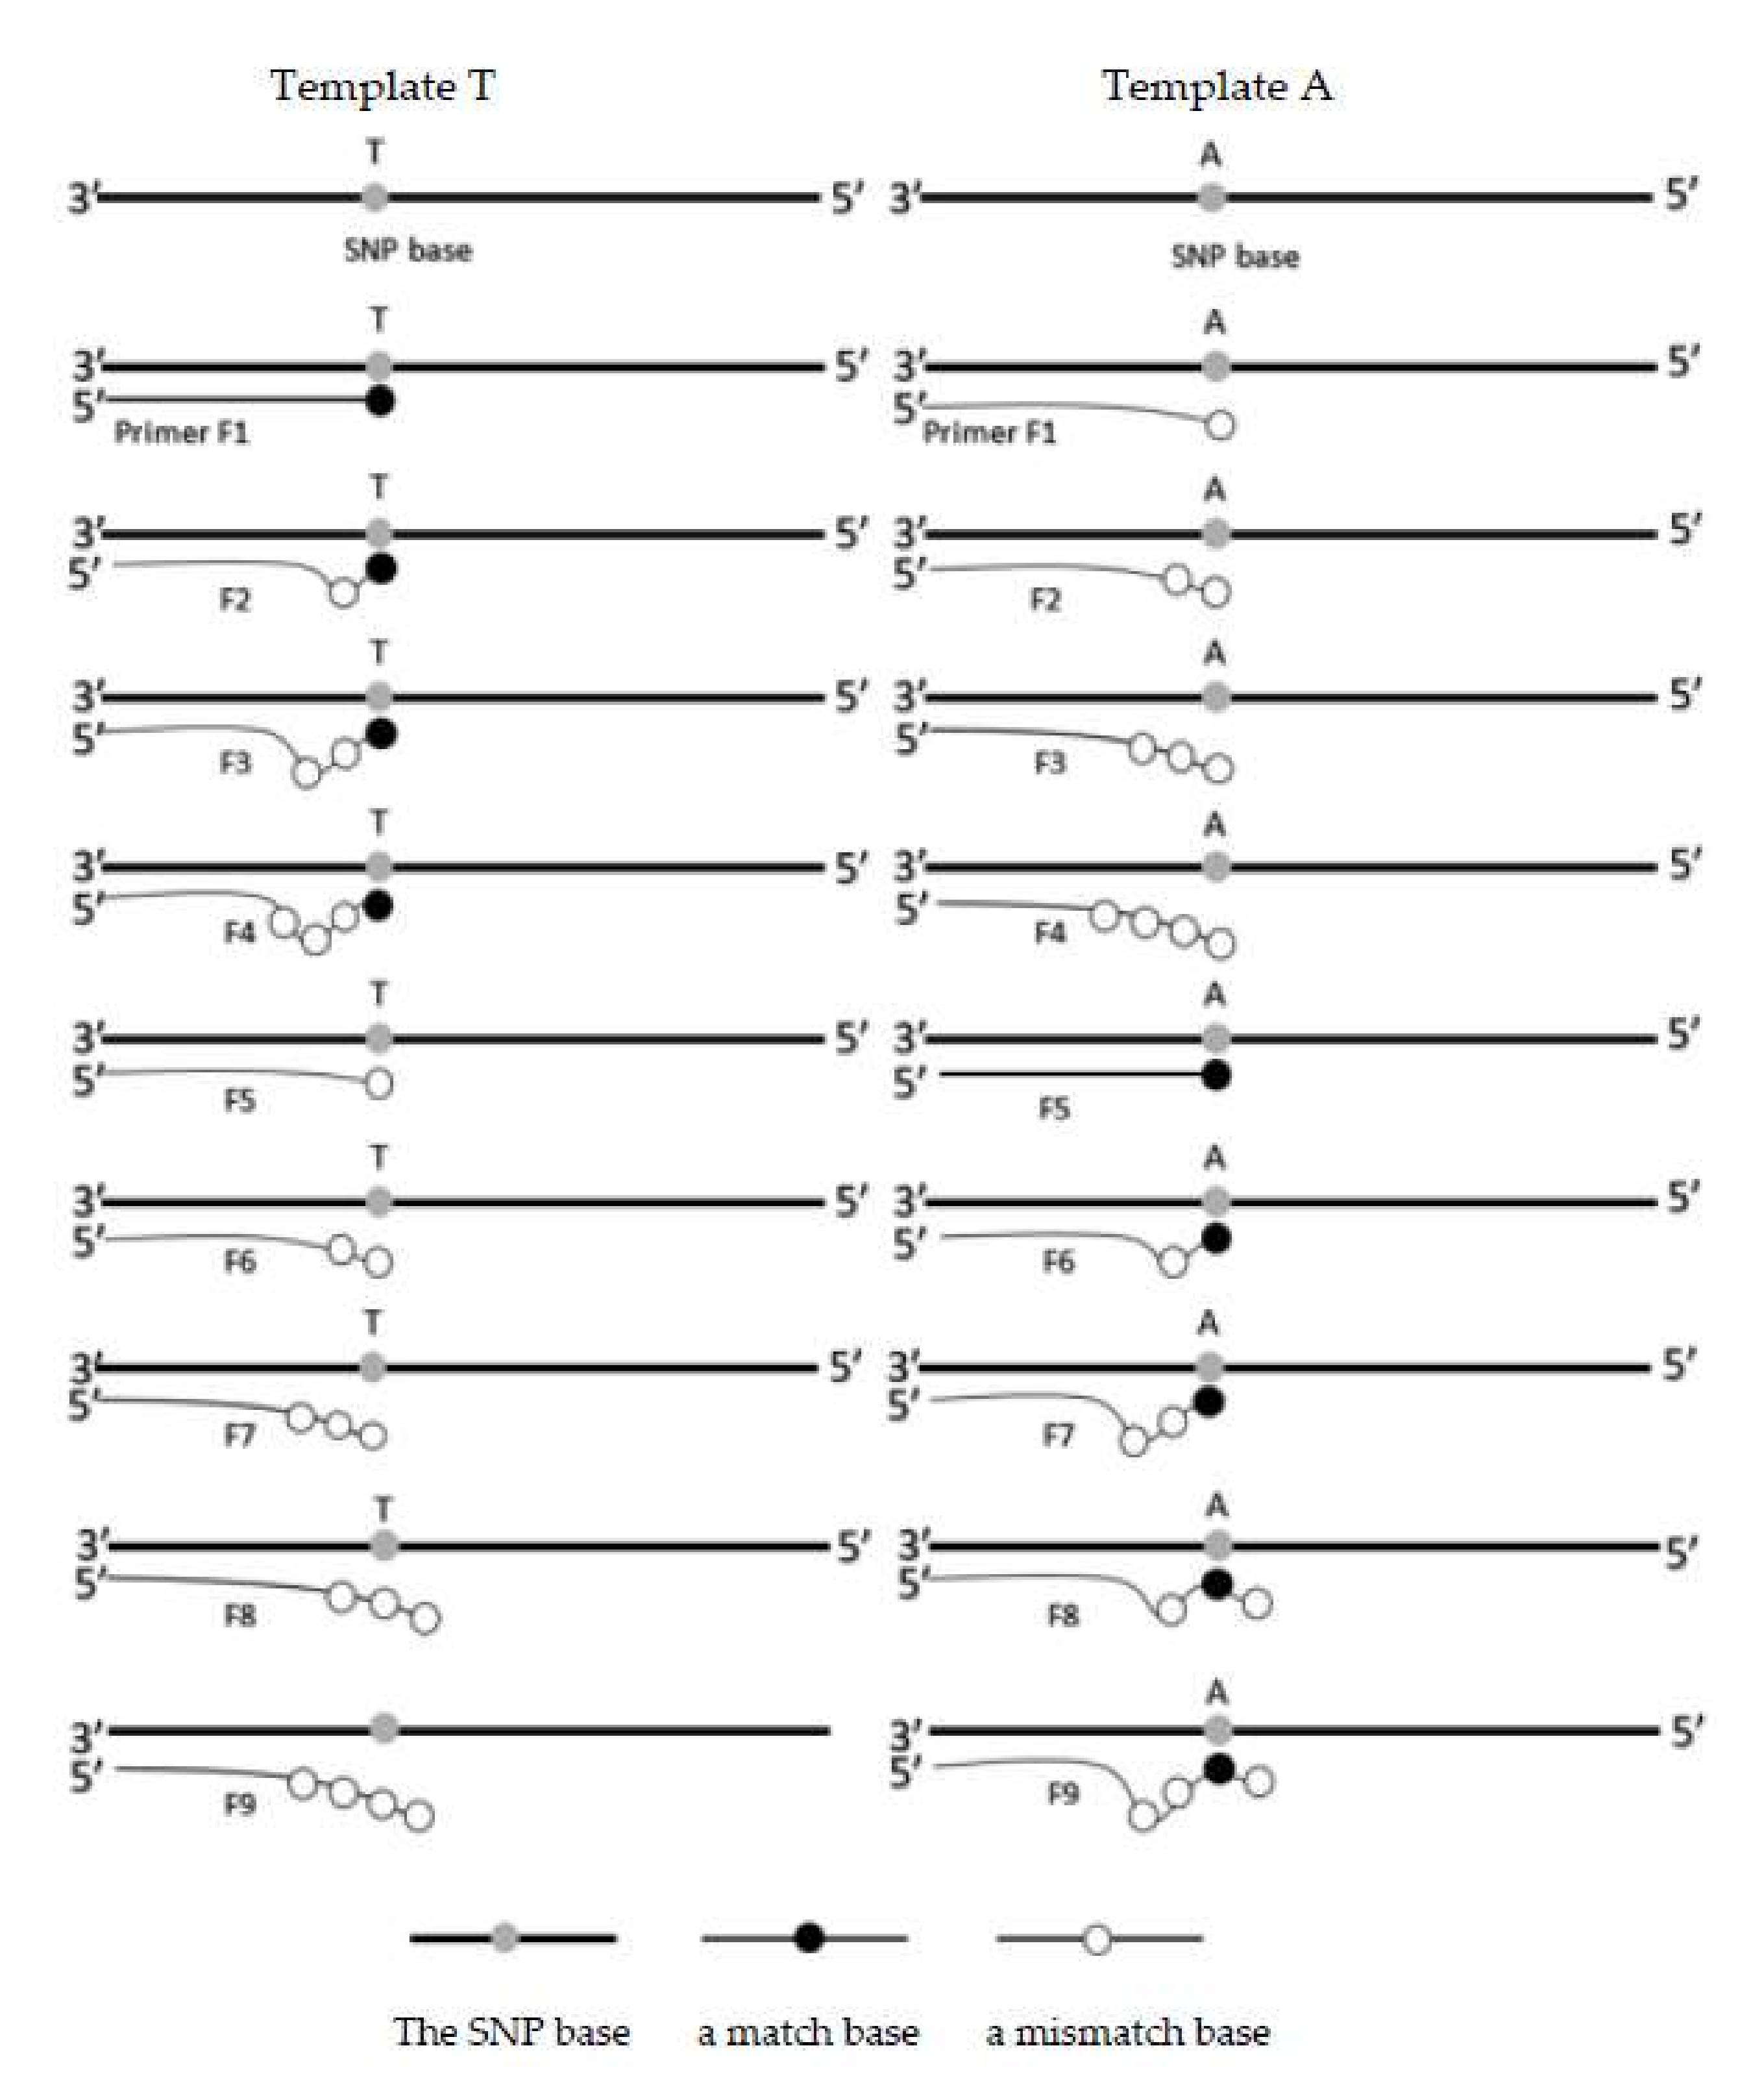
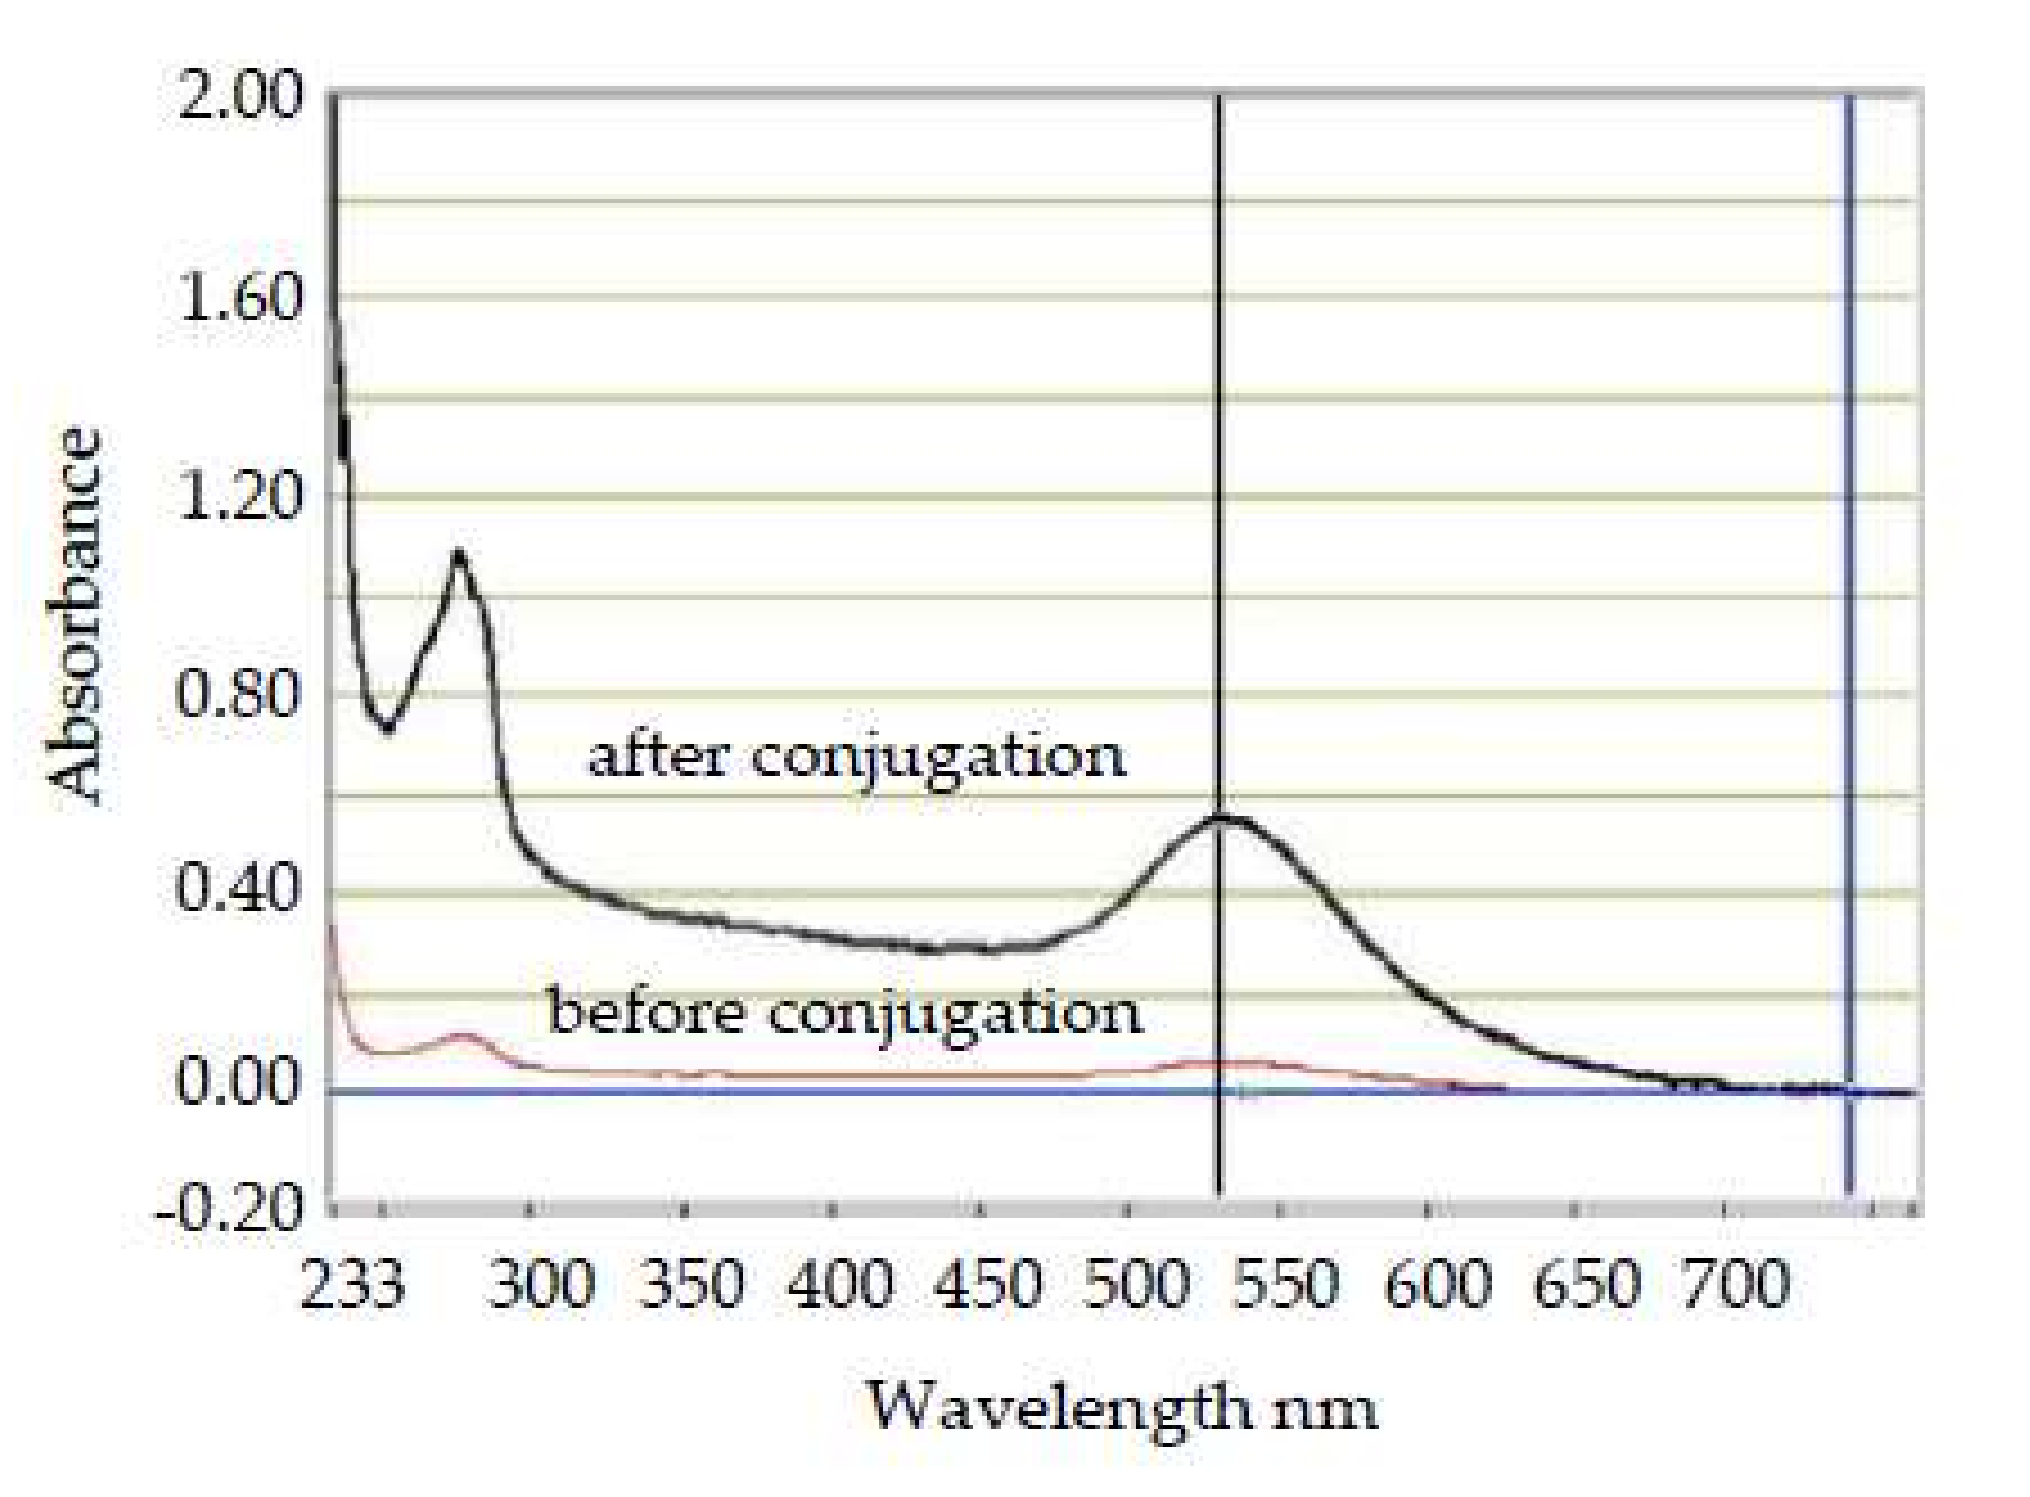
The conjugation of gold on the report antibody was also investigated by the UV-Visible Spectrometer. As shown in
Figure 3, the characteristic peak of the report antibody shifted from 525 to 530 nm, and its peak absorbance increased from 0.002 to 0.554, indicating the nano-gold particles had been successfully conjugated onto the report antibody. A red shift that occurs at a UV-Visible scan further shows an increase in particle size. It does not affect biochemical reactivity, which should be verified later on the MBLF strips.
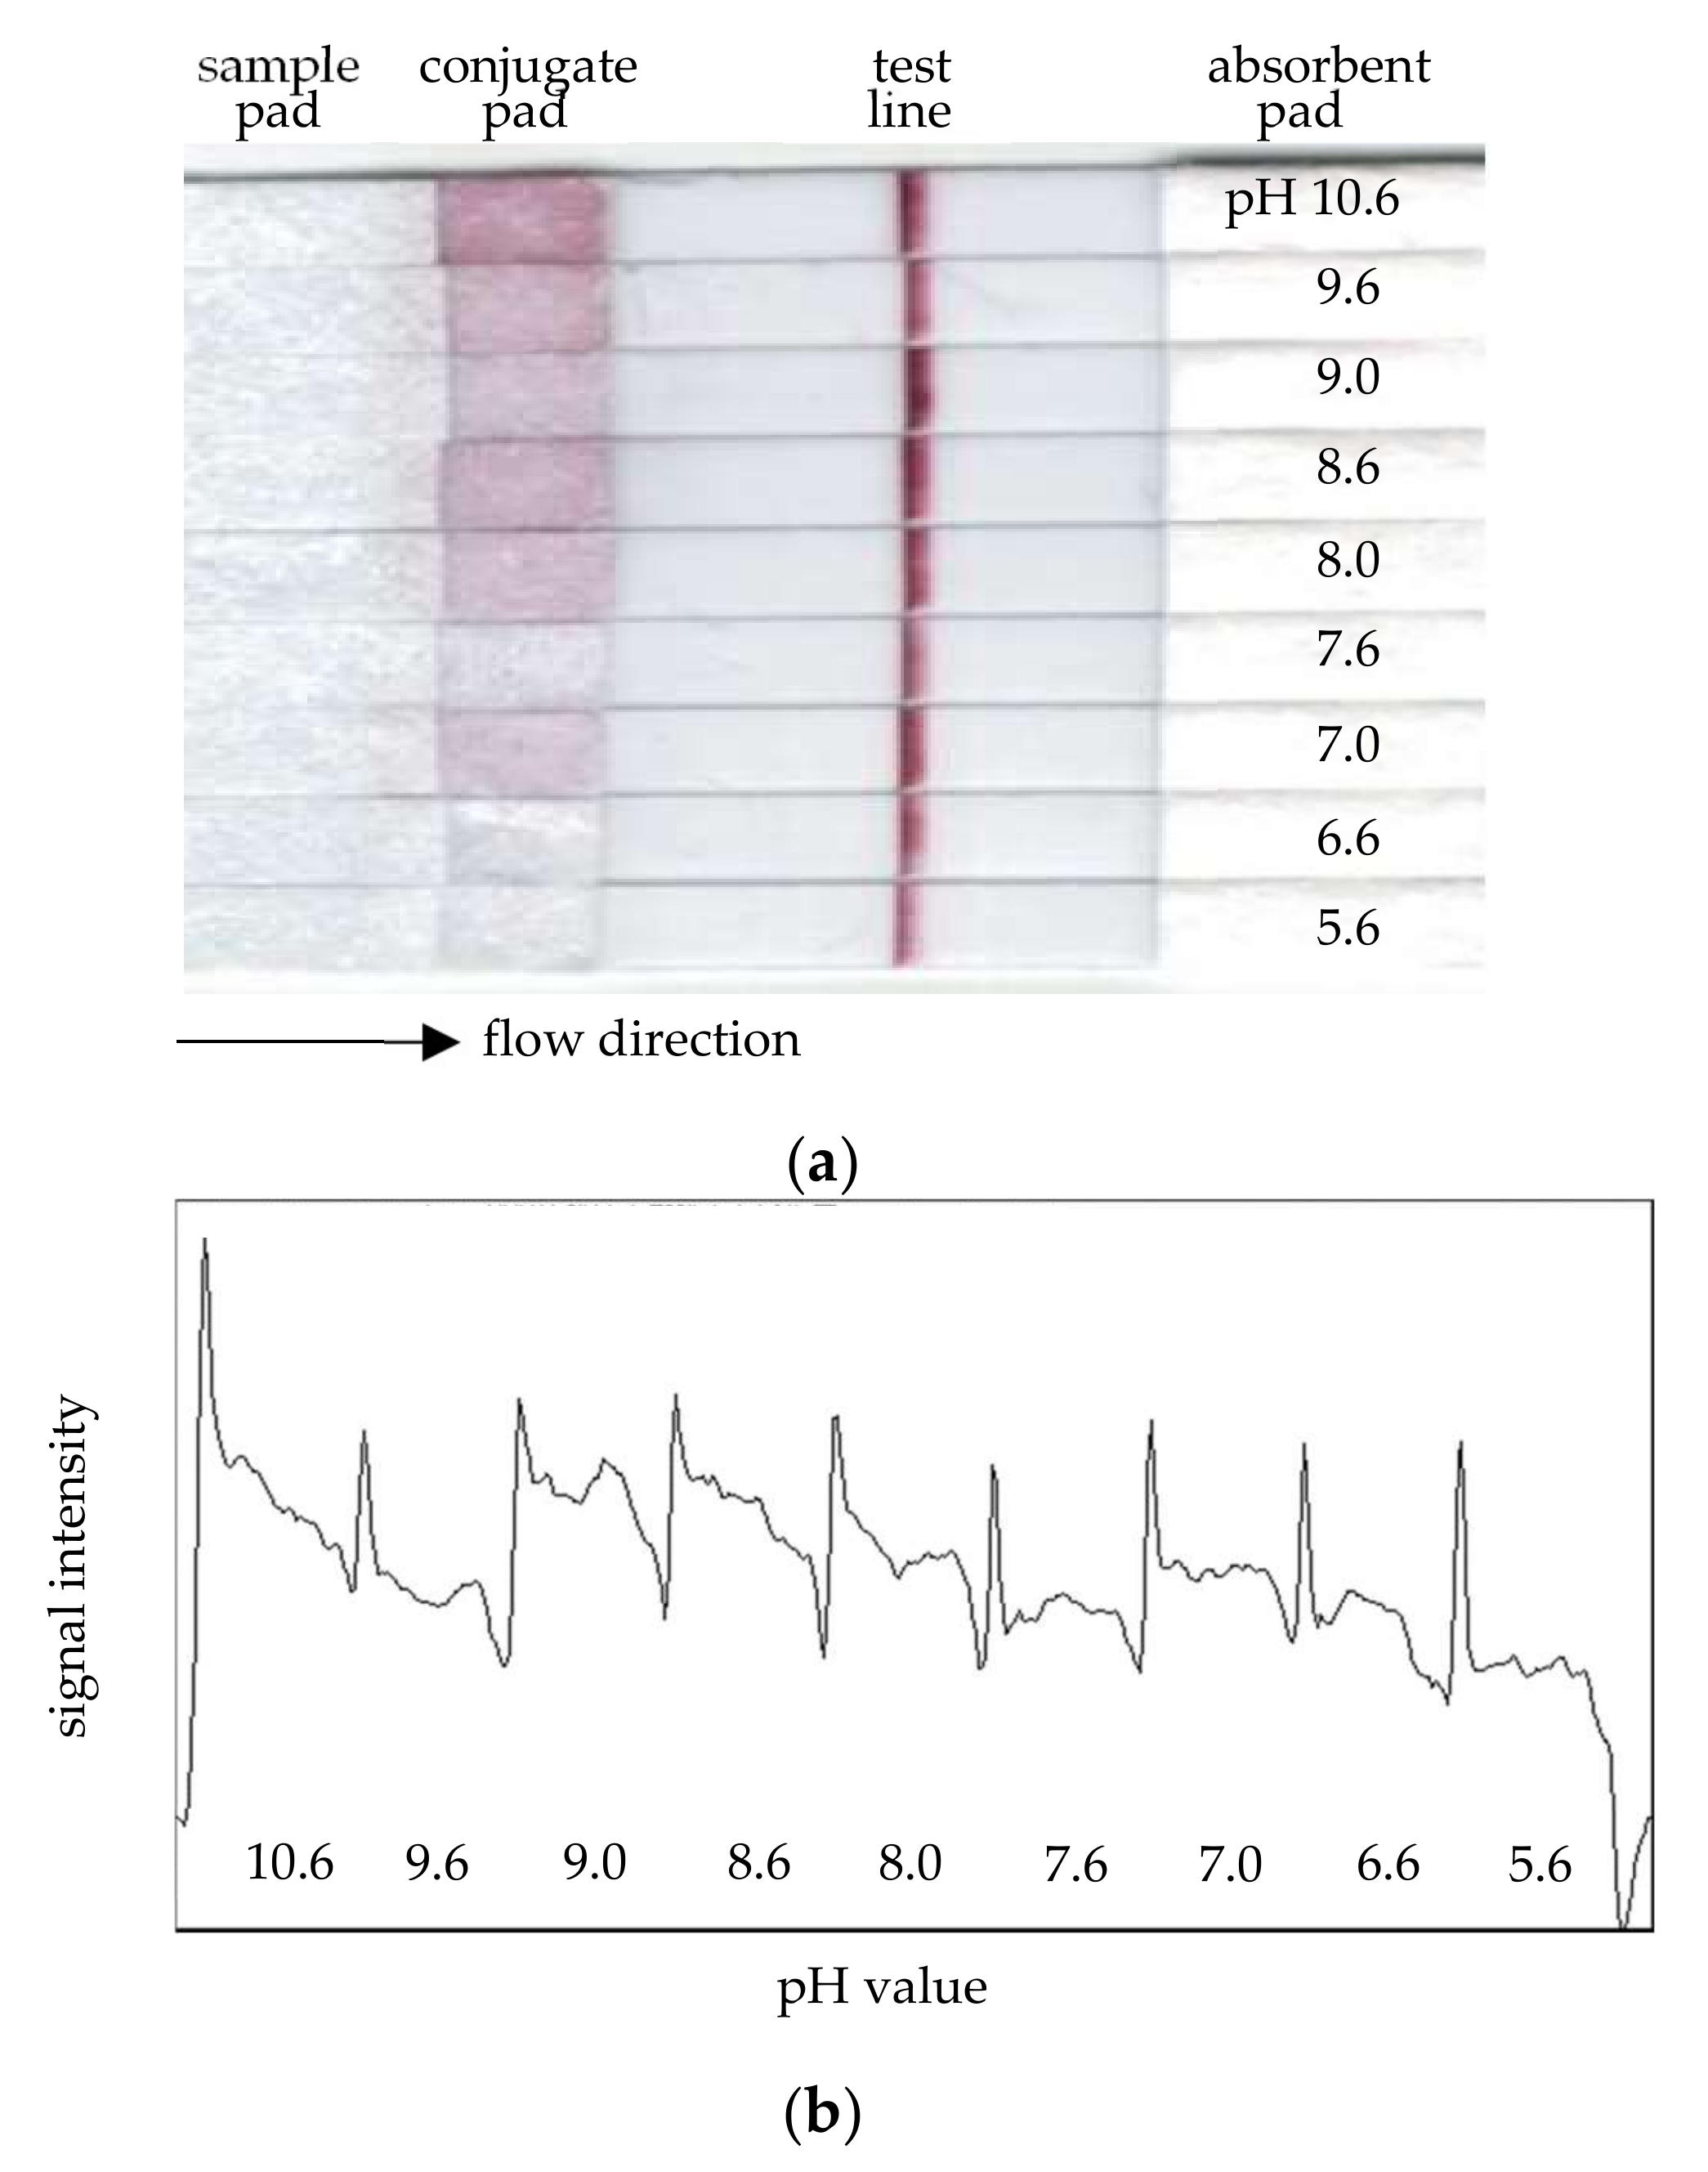
The pH-value optimization of nano-gold conjugation with the report antibody was performed by running a set of MBLF strips for pH values 5.6~10.6. The purpose of this investigation was to find the best conjugation condition of a certain antibody. Different pH values change the antibody’s surface static electric charge but not nano-gold’s surface charge, and the conjugation of the antibody with the nano-gold particles is affected by the charge-to-charge interaction. As shown in
Figure 4a, the signals of the test line received higher intensities as the pH values went higher. At pH 9.0, the signal performed best. While checking the reagent residue on the conjugate pads, the strip with the highest pH value, 10.6, was found to be with a conjugate pad sticking many gold-conjugated antibodies; however, the residual condition seemed acceptable for pH 9.0.
Figure 4b is an Image-J scan across all strips. The uniformity of the signals of test lines were double-checked across each strip. This qualitative measurement confirmed the best signal performance, which had been determined earlier by our eye readout on the strip of pH 9.0. pH 7.0 had the best signal uniformity, but it did not perform well. The signal of pH 10.6 was almost as intense as that of 9.0, but it was not uniform across the strip. From all above information, the nano-gold particles’ mixing with the report antibody at pH 9.0 thus concluded the optimal conjugation condition.
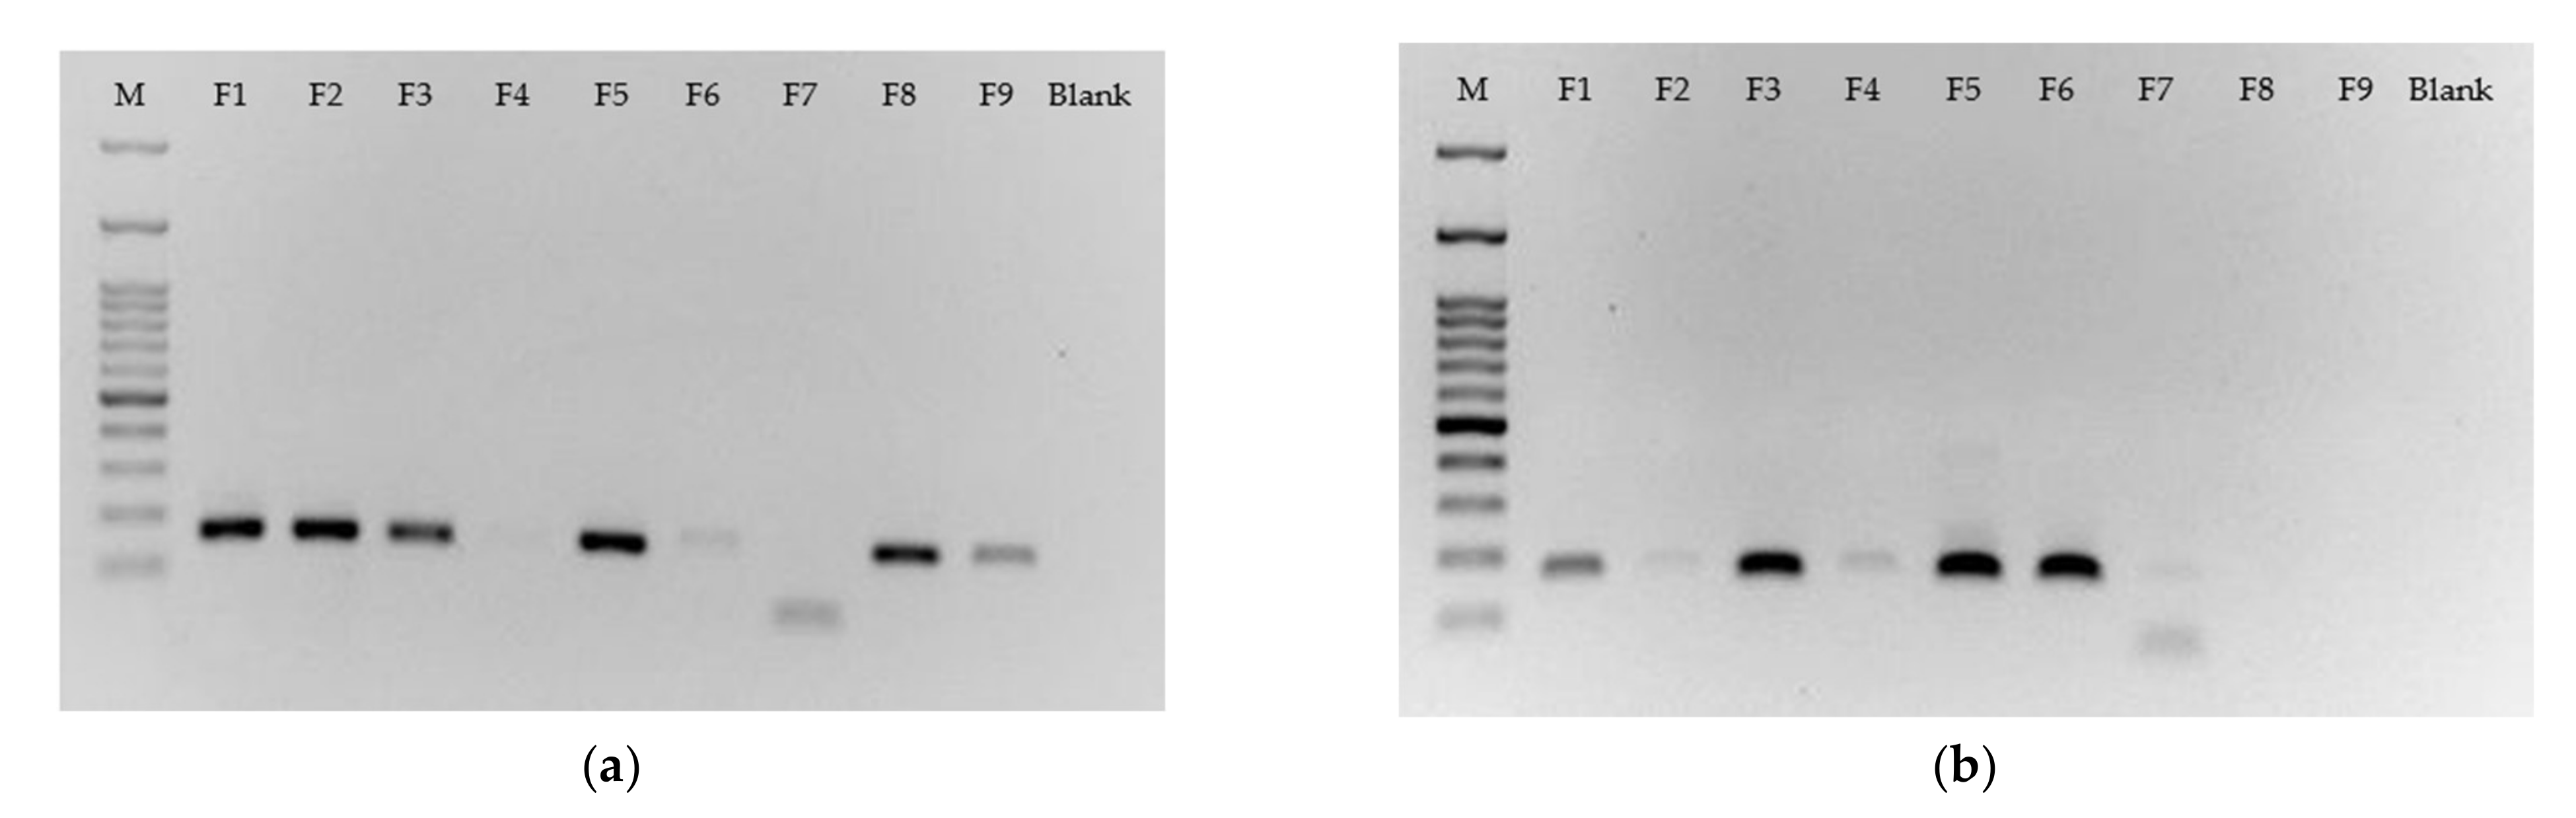
The gel electrophoresis was next conducted to screen for the best candidates of forward primers to identify gene HLA-A3101 from its allele. Two PCR batches were performed on Templates A and T. Target candidates should show a band signal on one gel but be absent on the other.
We first focus on Template A’s gel, as shown in
Figure 5a. Primers F1, F2, and F3, which, respectively, have 0, 1, and 2 mismatches with Template A, all have strong band signals no matter how many mismatches exist next to the SNP base, but we find that Primer F3, with two mismatches, had started a signal intensity drop. Primer 4, with three mismatches, further dropped to a very faint band. Moving the focus to Template T’s gel in
Figure 5b, we first investigate how Primers F5, F6, and F7 worked on Template T. Primers F5~F7, as indicated in
Figure 2, had an identical mismatching design to Primers F1~F3 but for different templates. Primers F5 and F6 had very similar performance to F1 and F2. However, unlike Primer 3, Primer 7 had already dramatically reduced the signal intensity with an unexpected primer dimer. Beside the quantity of sequence mismatches, types of nucleic acids in these matched or mismatched bases could be another factor affecting the amplification yields. This interesting issue was also observed again by the comparison between two gels for these two prime sets. The primer set F1~F3 has a mismatch base of nucleic acid “A” against Template T (
Figure 5b), while F5~F7 has nucleic acid “T” against Template A (
Figure 5a). These two types of “A-A” and “T-T” mismatching base pair performed very differently based on their PCR amplification. A research report investigated G/T, G/A, and G/G mismatches at 3′-end of a primer. It concluded that G/T mismatch performed as efficiently as the normal primer, but G/G mismatch had no amplification [
7].
Since we do not intend to conduct a study fully covering all issues relating to PCR yields, this section simply concludes that Primer F8 was the best candidate for detecting Template A and Primer F6 for Template T. They both showed intense signals on their target template but were relatively biased regarding the other one. The faint signal for F6 on Template A was diminished to disappear after it was labeled a ligand. We will further demonstrate how both primers, one with one mismatch beside the matched SNP base (F6) and the other with one mismatch on each side of the matched SNP base (F8), function for the identification of SNP on MBLF strips.
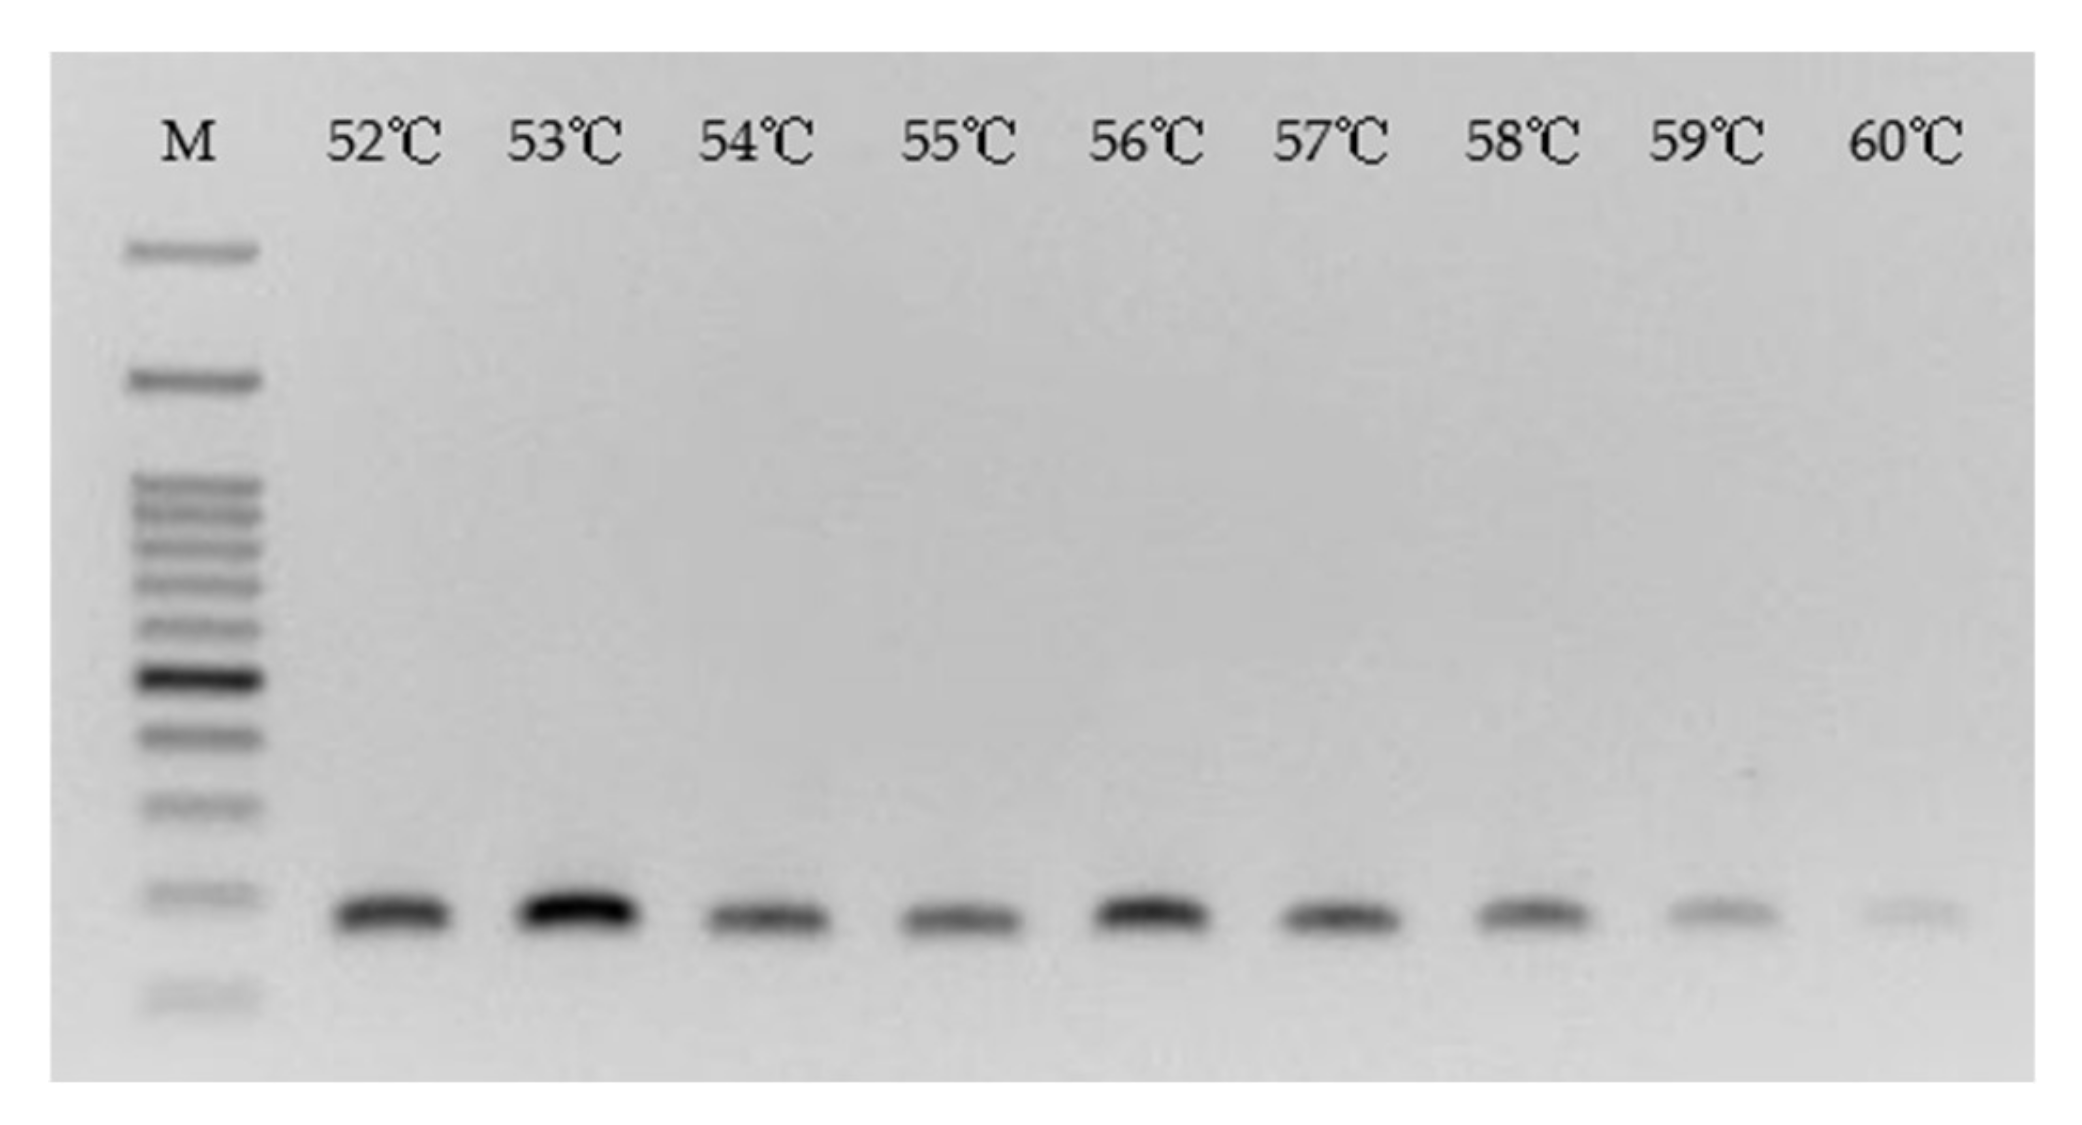
The annealing temperature of the PCR procedure was then surveyed. As shown in
Figure 6, Primer 8 participated in the PCR amplification of Template A in various annealing temperatures from 52~60 °C. The best Tm appeared on the gel at 53 °C, very close to the estimate obtained by the traditional formula 2 (T + A) + 4 (G + C), 52 °C, if two mismatches in Primer F8 were removed from the calculation. Since the Tm for running the PCR products shown in
Figure 5 was already at 53 °C, the performance of F6 at that temperature was therefore known. A practical application will mix F6 and F8 with unknown target gene to run a PCR amplification. These two primers thus have to use the same Tm during that process.
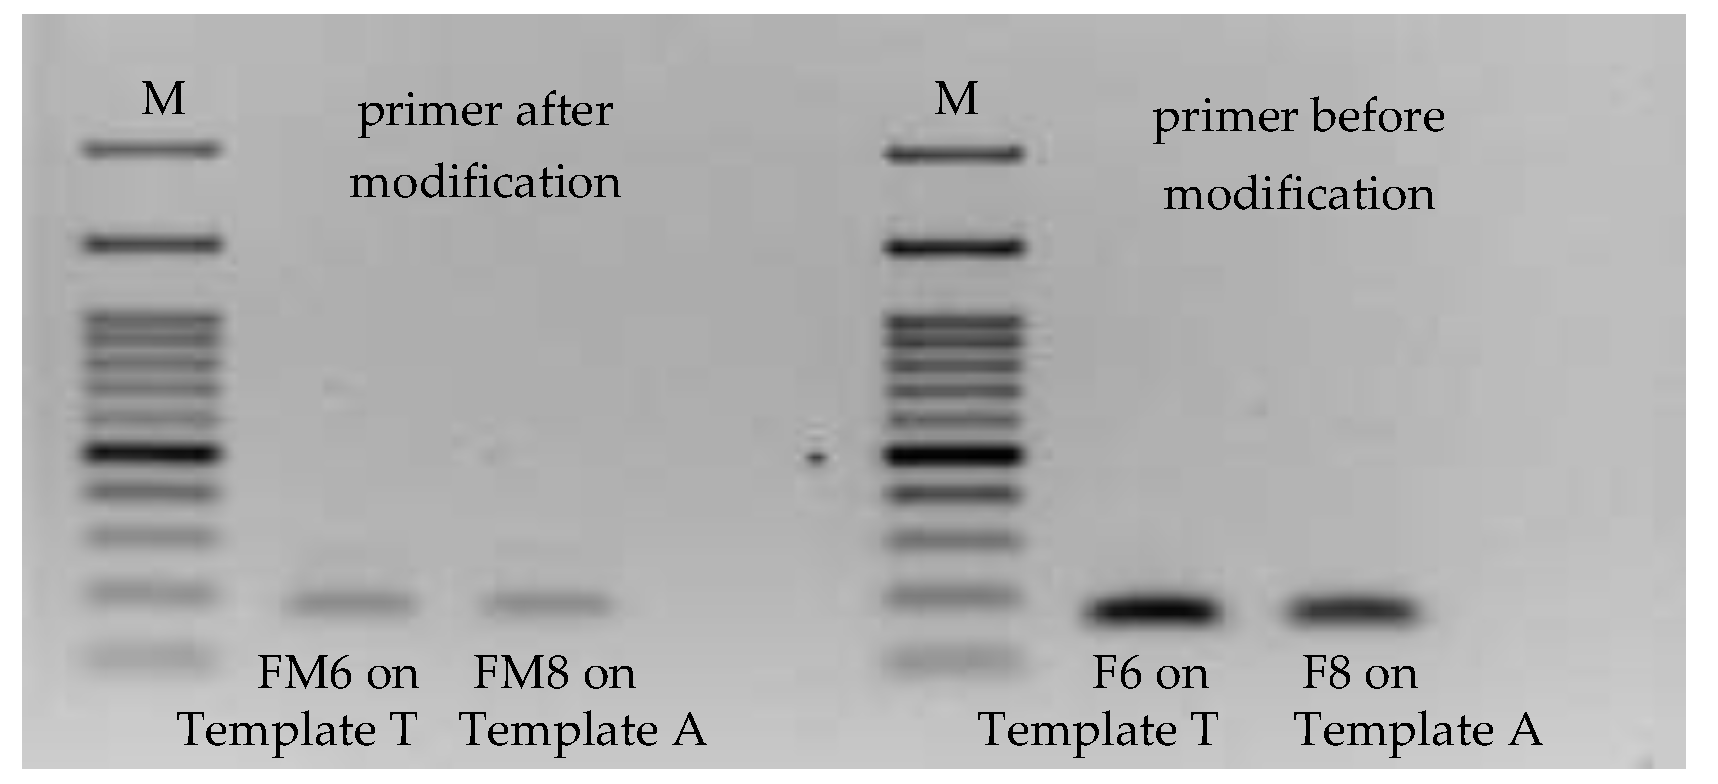
Primers F8 and F6 were then further tagged with biotin and FITC at their 5′ ends, respectively, as well as the reverse primer digoxigenin at 5′ end. Primers F8 and F6 were renamed to FM8 and FM6, respectively, to mark the modification. These tagged ligands enabled their PCR products to be recognizable on MBLF strips. However, before running the PCR products on MBLF strips, the modified primers were validated if they still kept the original function.
Figure 7 shows the PCR performance of Primers FM8 and FM6 working together with Templates A and T. Their amplification yields fell after ligands were tagged onto their 5′ end side, due to the molecule-steric effect caused by the ligands.
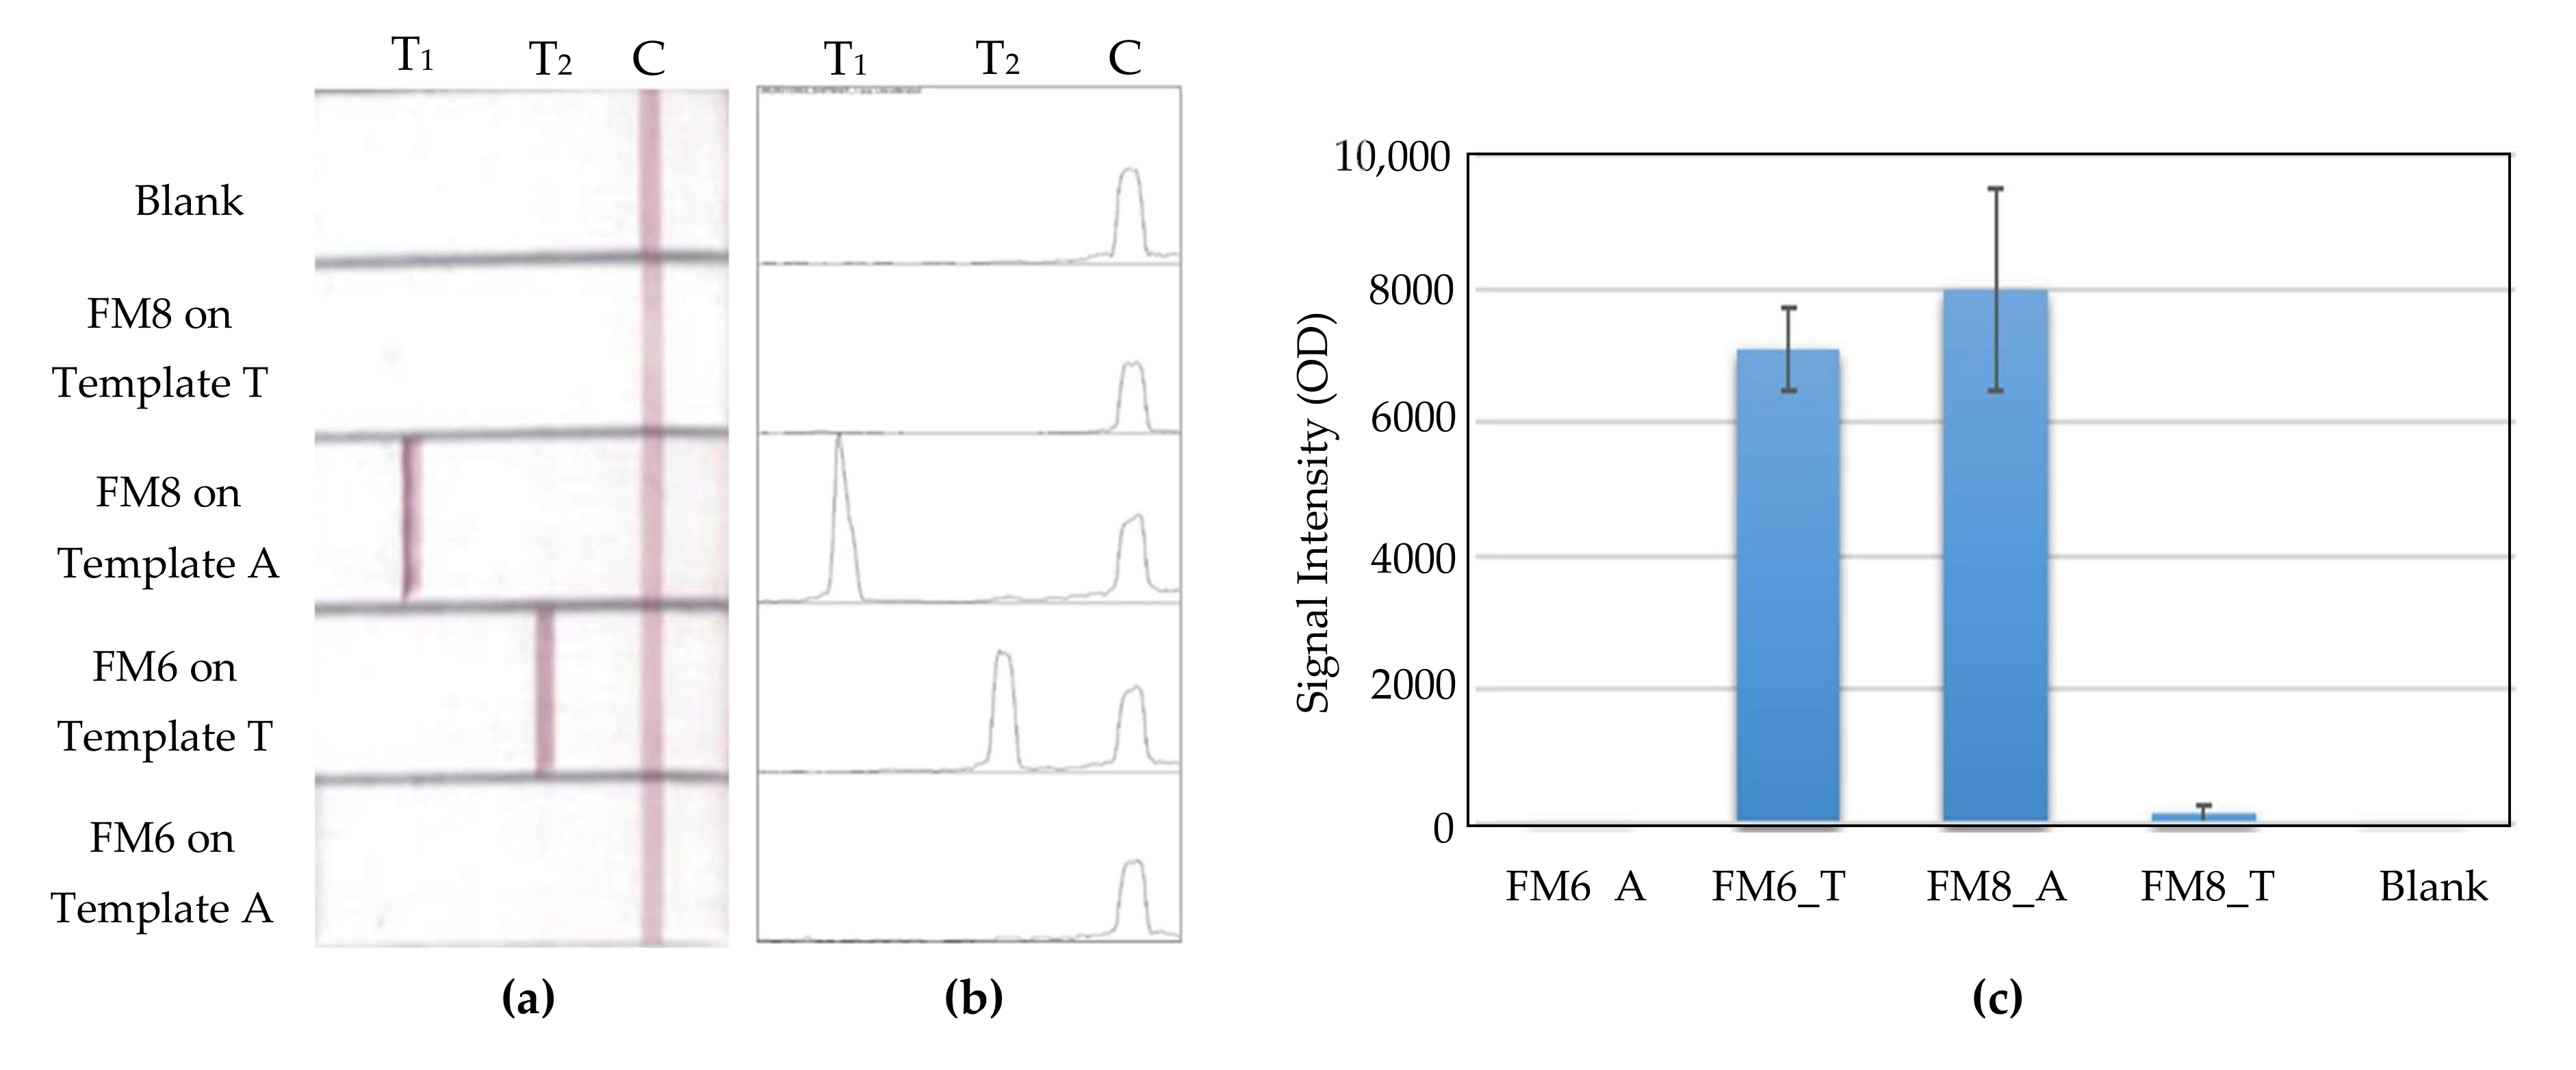
Figure 8 shows the detection of Template A and its allele, Template T, with an SNP, on MBLF strips. Since T1 line was printed streptavidin, which has a strong affinity with biotin, the PCR product duplicated by biotinylated Primer FM8 will be captured by this line. In addition, because the reverse primer was labeled with digoxigenin, it was able to work together with the gold-labeled anti-digoxigenin antibody to report the test using a gold color. Similarly, on T2, which is printed on the anti-FITC antibody, Line T2 was able to capture the allele amplified by FITC-tagged Primer FM6. In this way, the SNPs were able to be identified on the MBLF strips. The faint band signal for F6 on Template A shown in
Figure 5a disappeared later on the strip after it was labeled a ligand to became FM6. The strips were measured their signal intensities using software Image-J to further obtain their quantitative results.
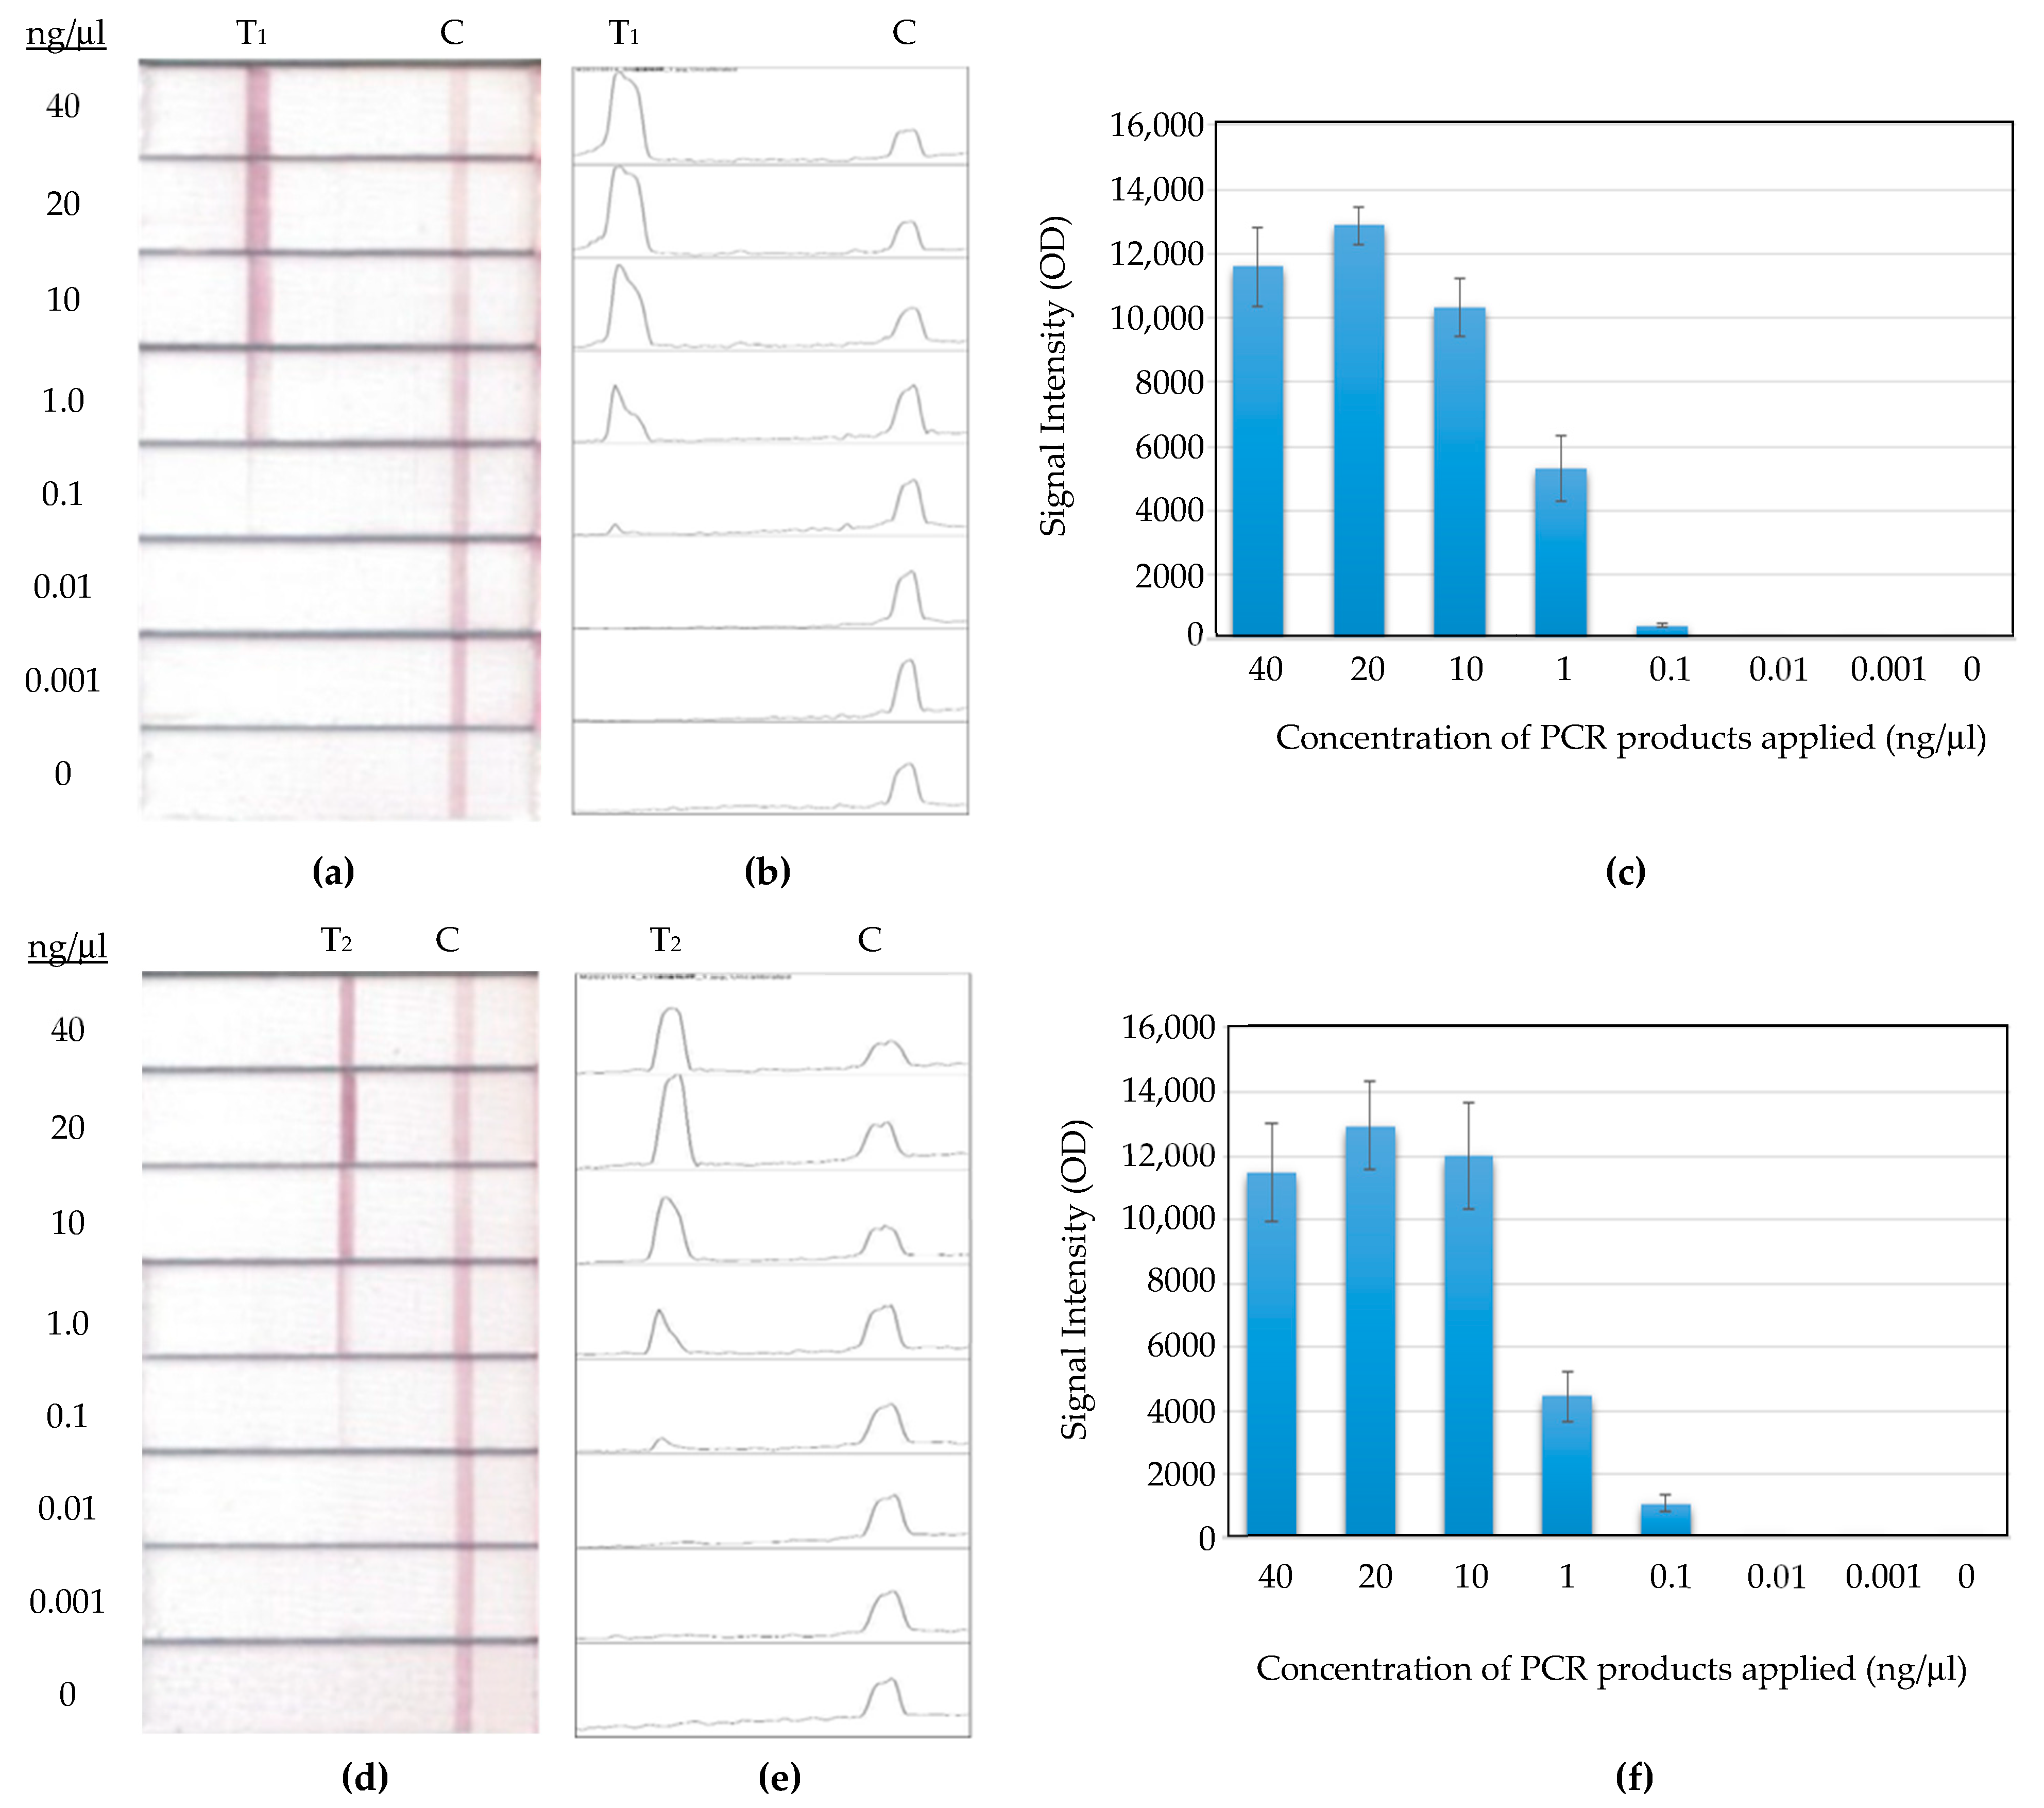
The detection limit was investigated in this study using a series of diluted PCR products at concentrations of 40, 20, 10, 1, 0.1, 0.01, 0.001, and 0 ng/μL. As shown in
Figure 9a, the PCR products of Template A working together with FM8 were detected on the MBLF strips. Their detection limit fell between 1 and 0.1 ng/μL. A similar detection on Template T-FM6 was also conducted, as shown in
Figure 9b. The detection limit of this set of tests was also between 1 and 0.1 ng/μL in 70 μL. This result is close to the report of 50 femtomole (5.9 ng) in the literature using the technology of deoxynucleotide-labeled gold nano-particle [
25].
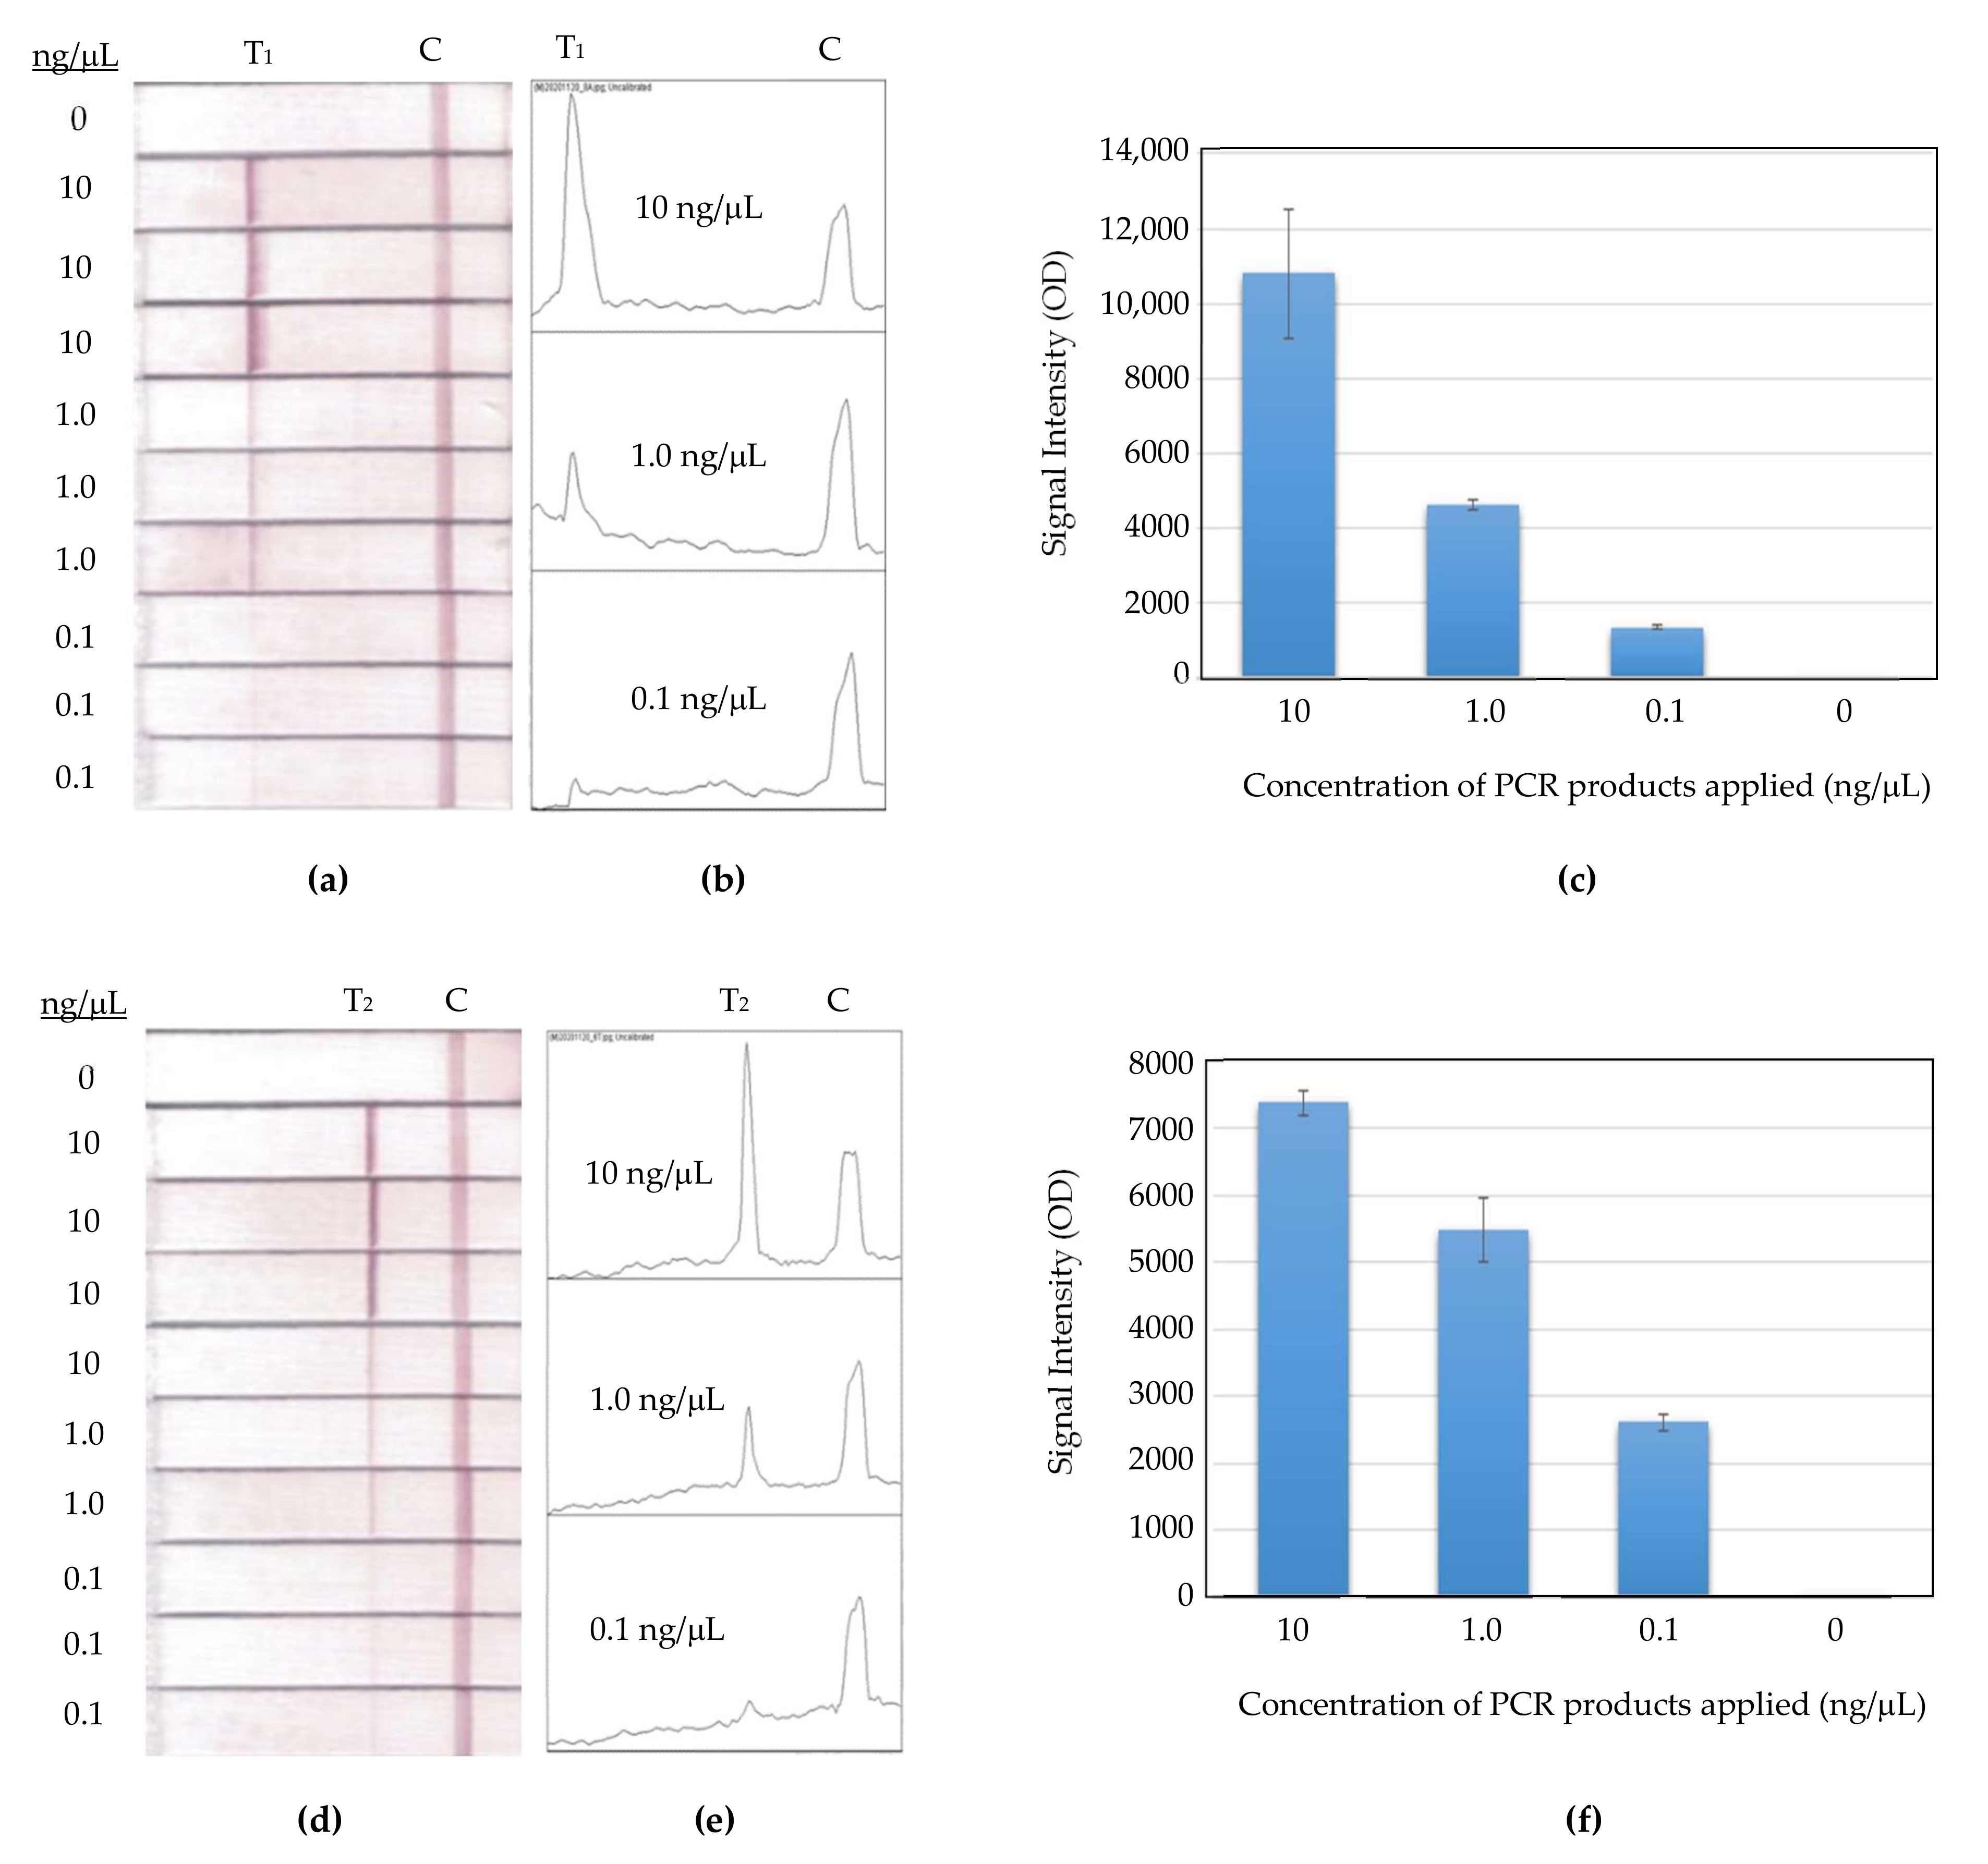
The reproducibility of this detection assay on the MBLF strips was also investigated using two approaches: intra assay and inter assay, with the former conducting tests on the same day for three sample concentrations, and each with three strip replicates, while the latter was used for three sample concentrations in three consecutive days. The quantitative analyses averaged over three replicates for the signal intensity and the replicate strip-to-strip deviations were calculated in CV% and indicated by error bars.
As shown in
Figure 10a, the intra assay ran three concentrations of PCR products in 10, 1, and 0.1 ng/μL, and each with three strip replicates at the same day. The replicate strip-to-strip deviations were 15.9%, 3.1%, and 3.5%, respectively, for the set of Primer 8-Template A. The experiment manipulation on concentration 10 ng/μL received a relatively high deviation in this study, but it did not hinder the trend of signal intensity in the way it correlated with the concentration variation.
Figure 10b shows the result of the other primer-template set for the intra assay. It was also run in the same condition as the previous set. The replicate strip-to-strip deviations for different PCR-product concentrations of 10, 1, and 0.1 ng/μL performed well, at 2.5%, 8.9%, and 4.9%, respectively.
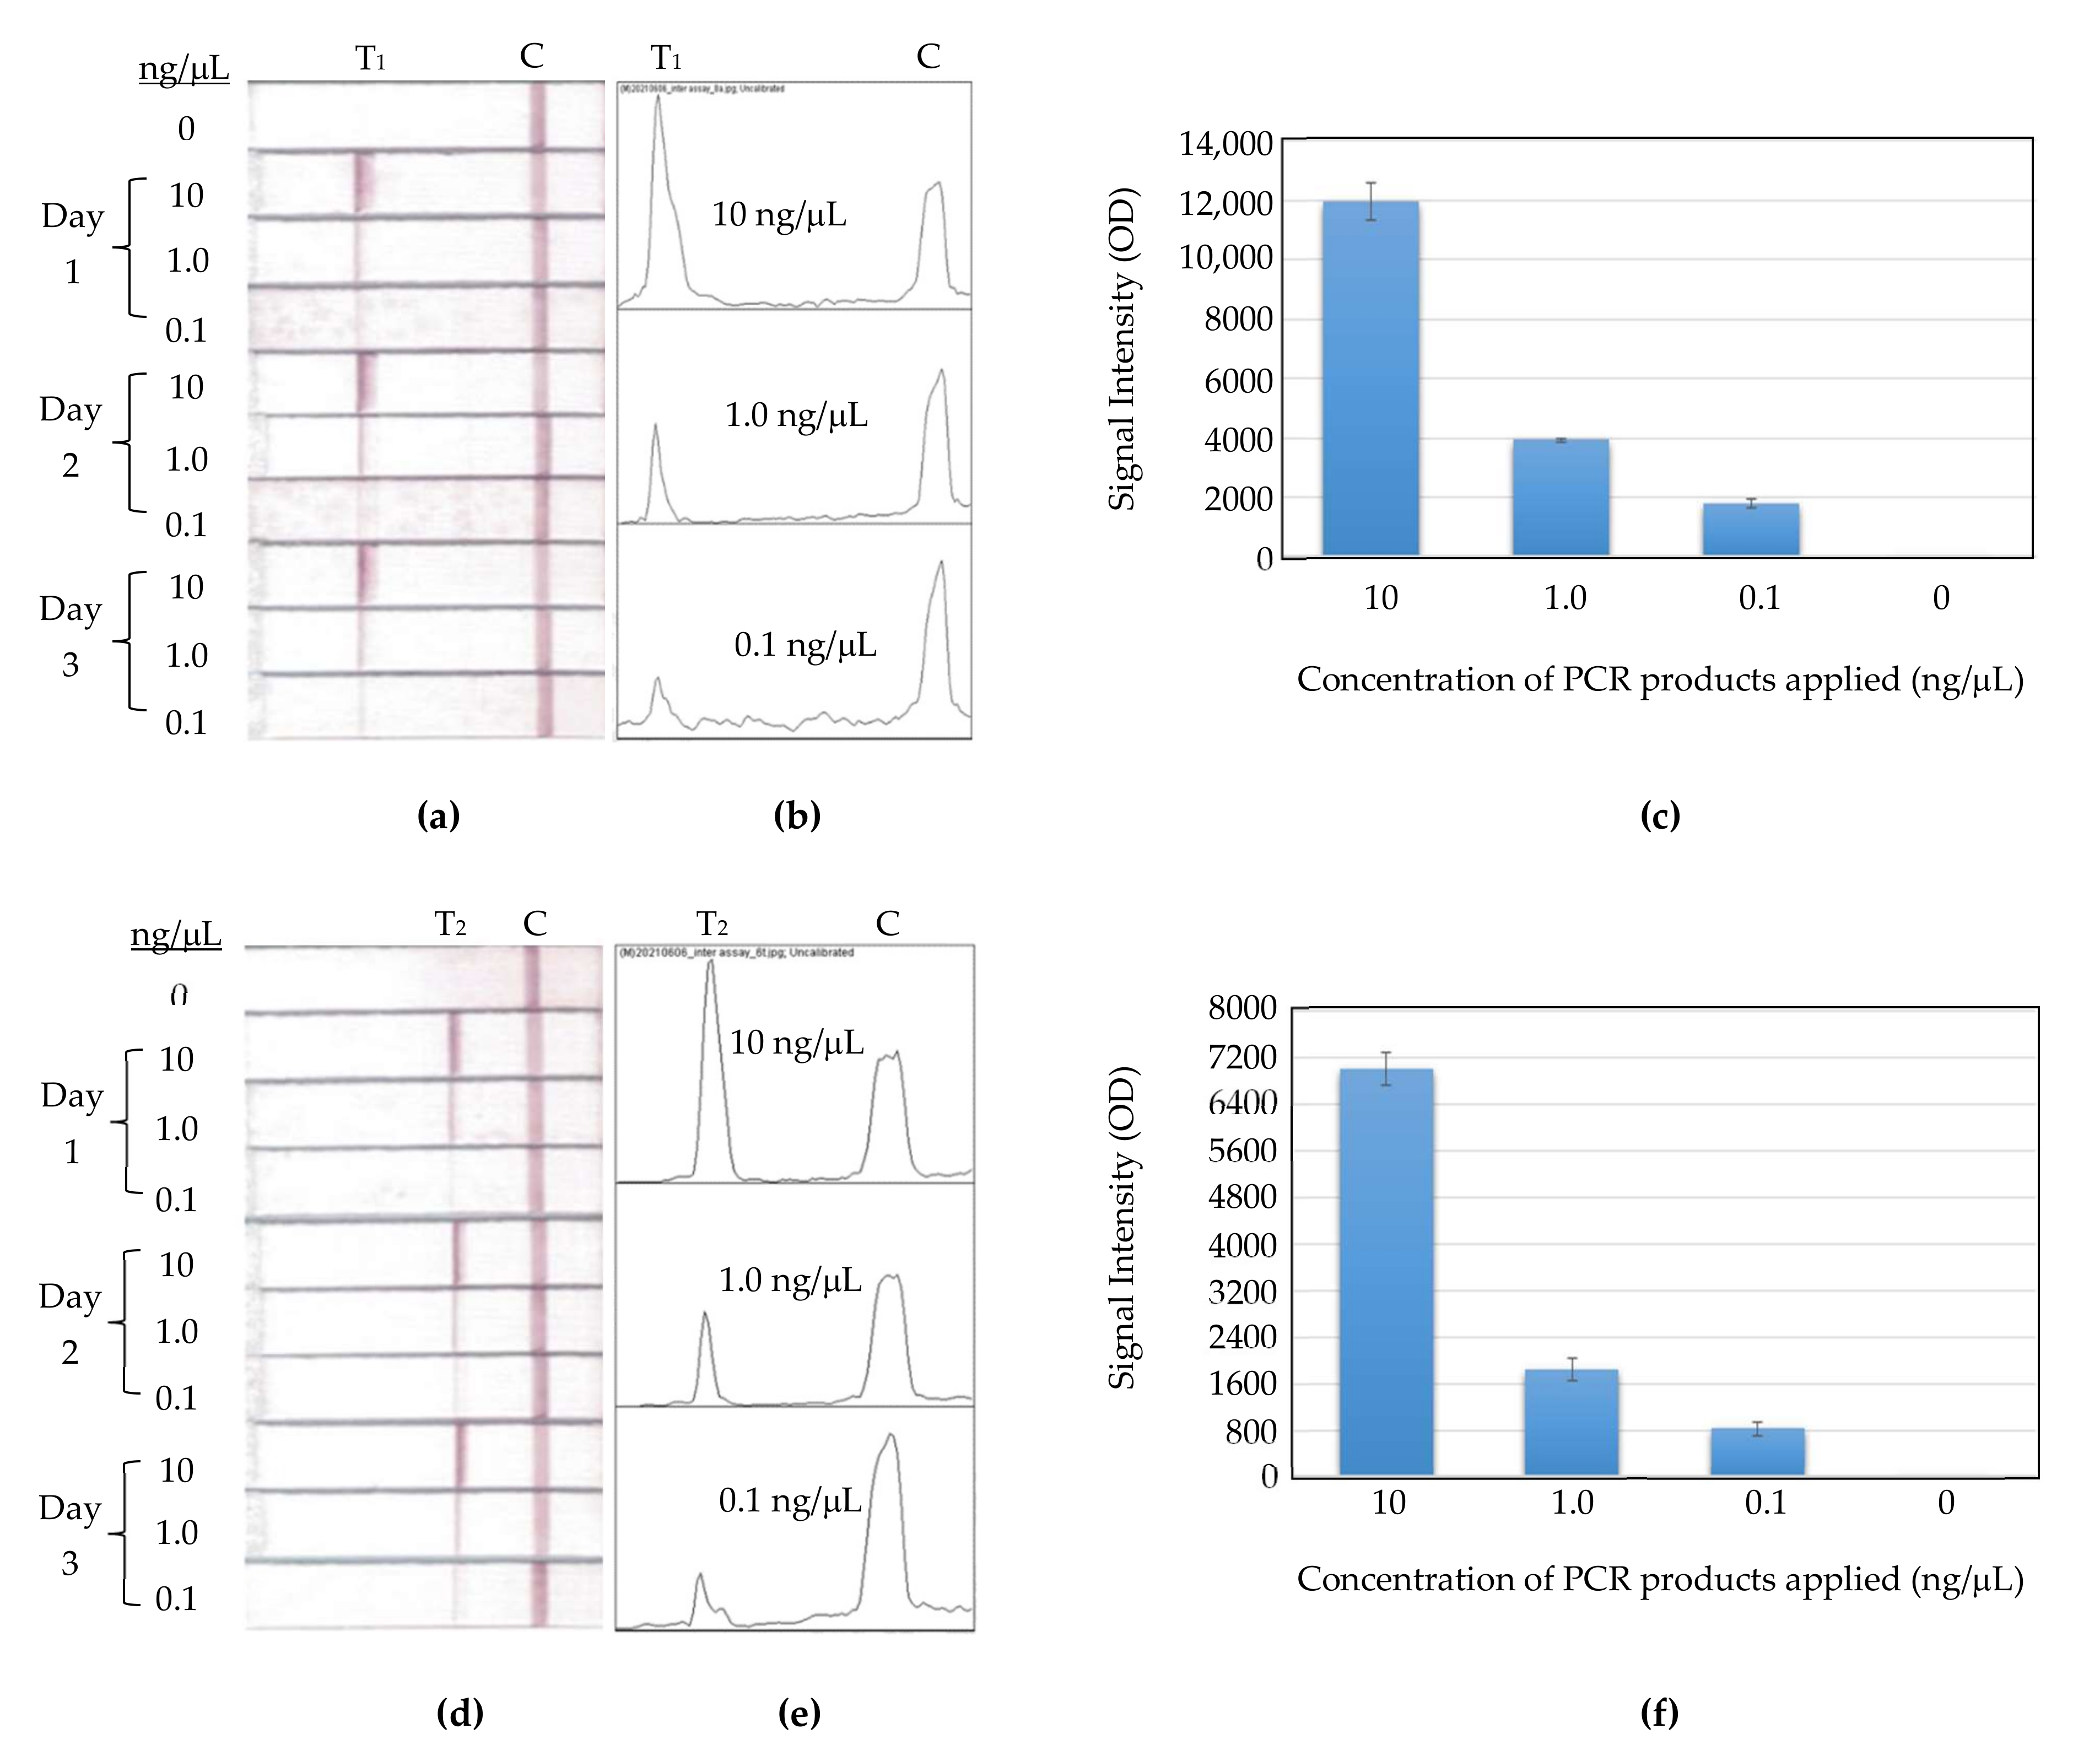
As shown in
Figure 11a, the inter assay ran three concentrations of PCR products in 10, 1, and 0.1 ng/μL, on three consecutive days, and each concentration contained three strip replicates. Their replicate strip-to-strip deviations were 5.2%, 1.7%, and 7.1%, respectively. The experiment manipulation on all concentrations received low deviations for Primer FM8-Template A in this study.
Figure 11b shows the other primer-template set for the inter assay. It was also run in the same condition as the previous set. Its replicated strip-to-strip deviations for concentrations of 10, 1, and 0.1 ng/μL were 4.0%, 9.8%, and 14.7%, respectively. This set had a higher CV%, at 0.1 ng/μL, than other two concentrations, and it did not hinder the trend of signal intensity in the way it correlated with the concentration variation.
The experiment manipulation in overall received a low strip-to-strip deviation from the intra- and inter-assay tests. The MBLF technology was demonstrated, in this study, to be capable of providing an easy, hands-on application without much deviation for untrained personnel at care points.
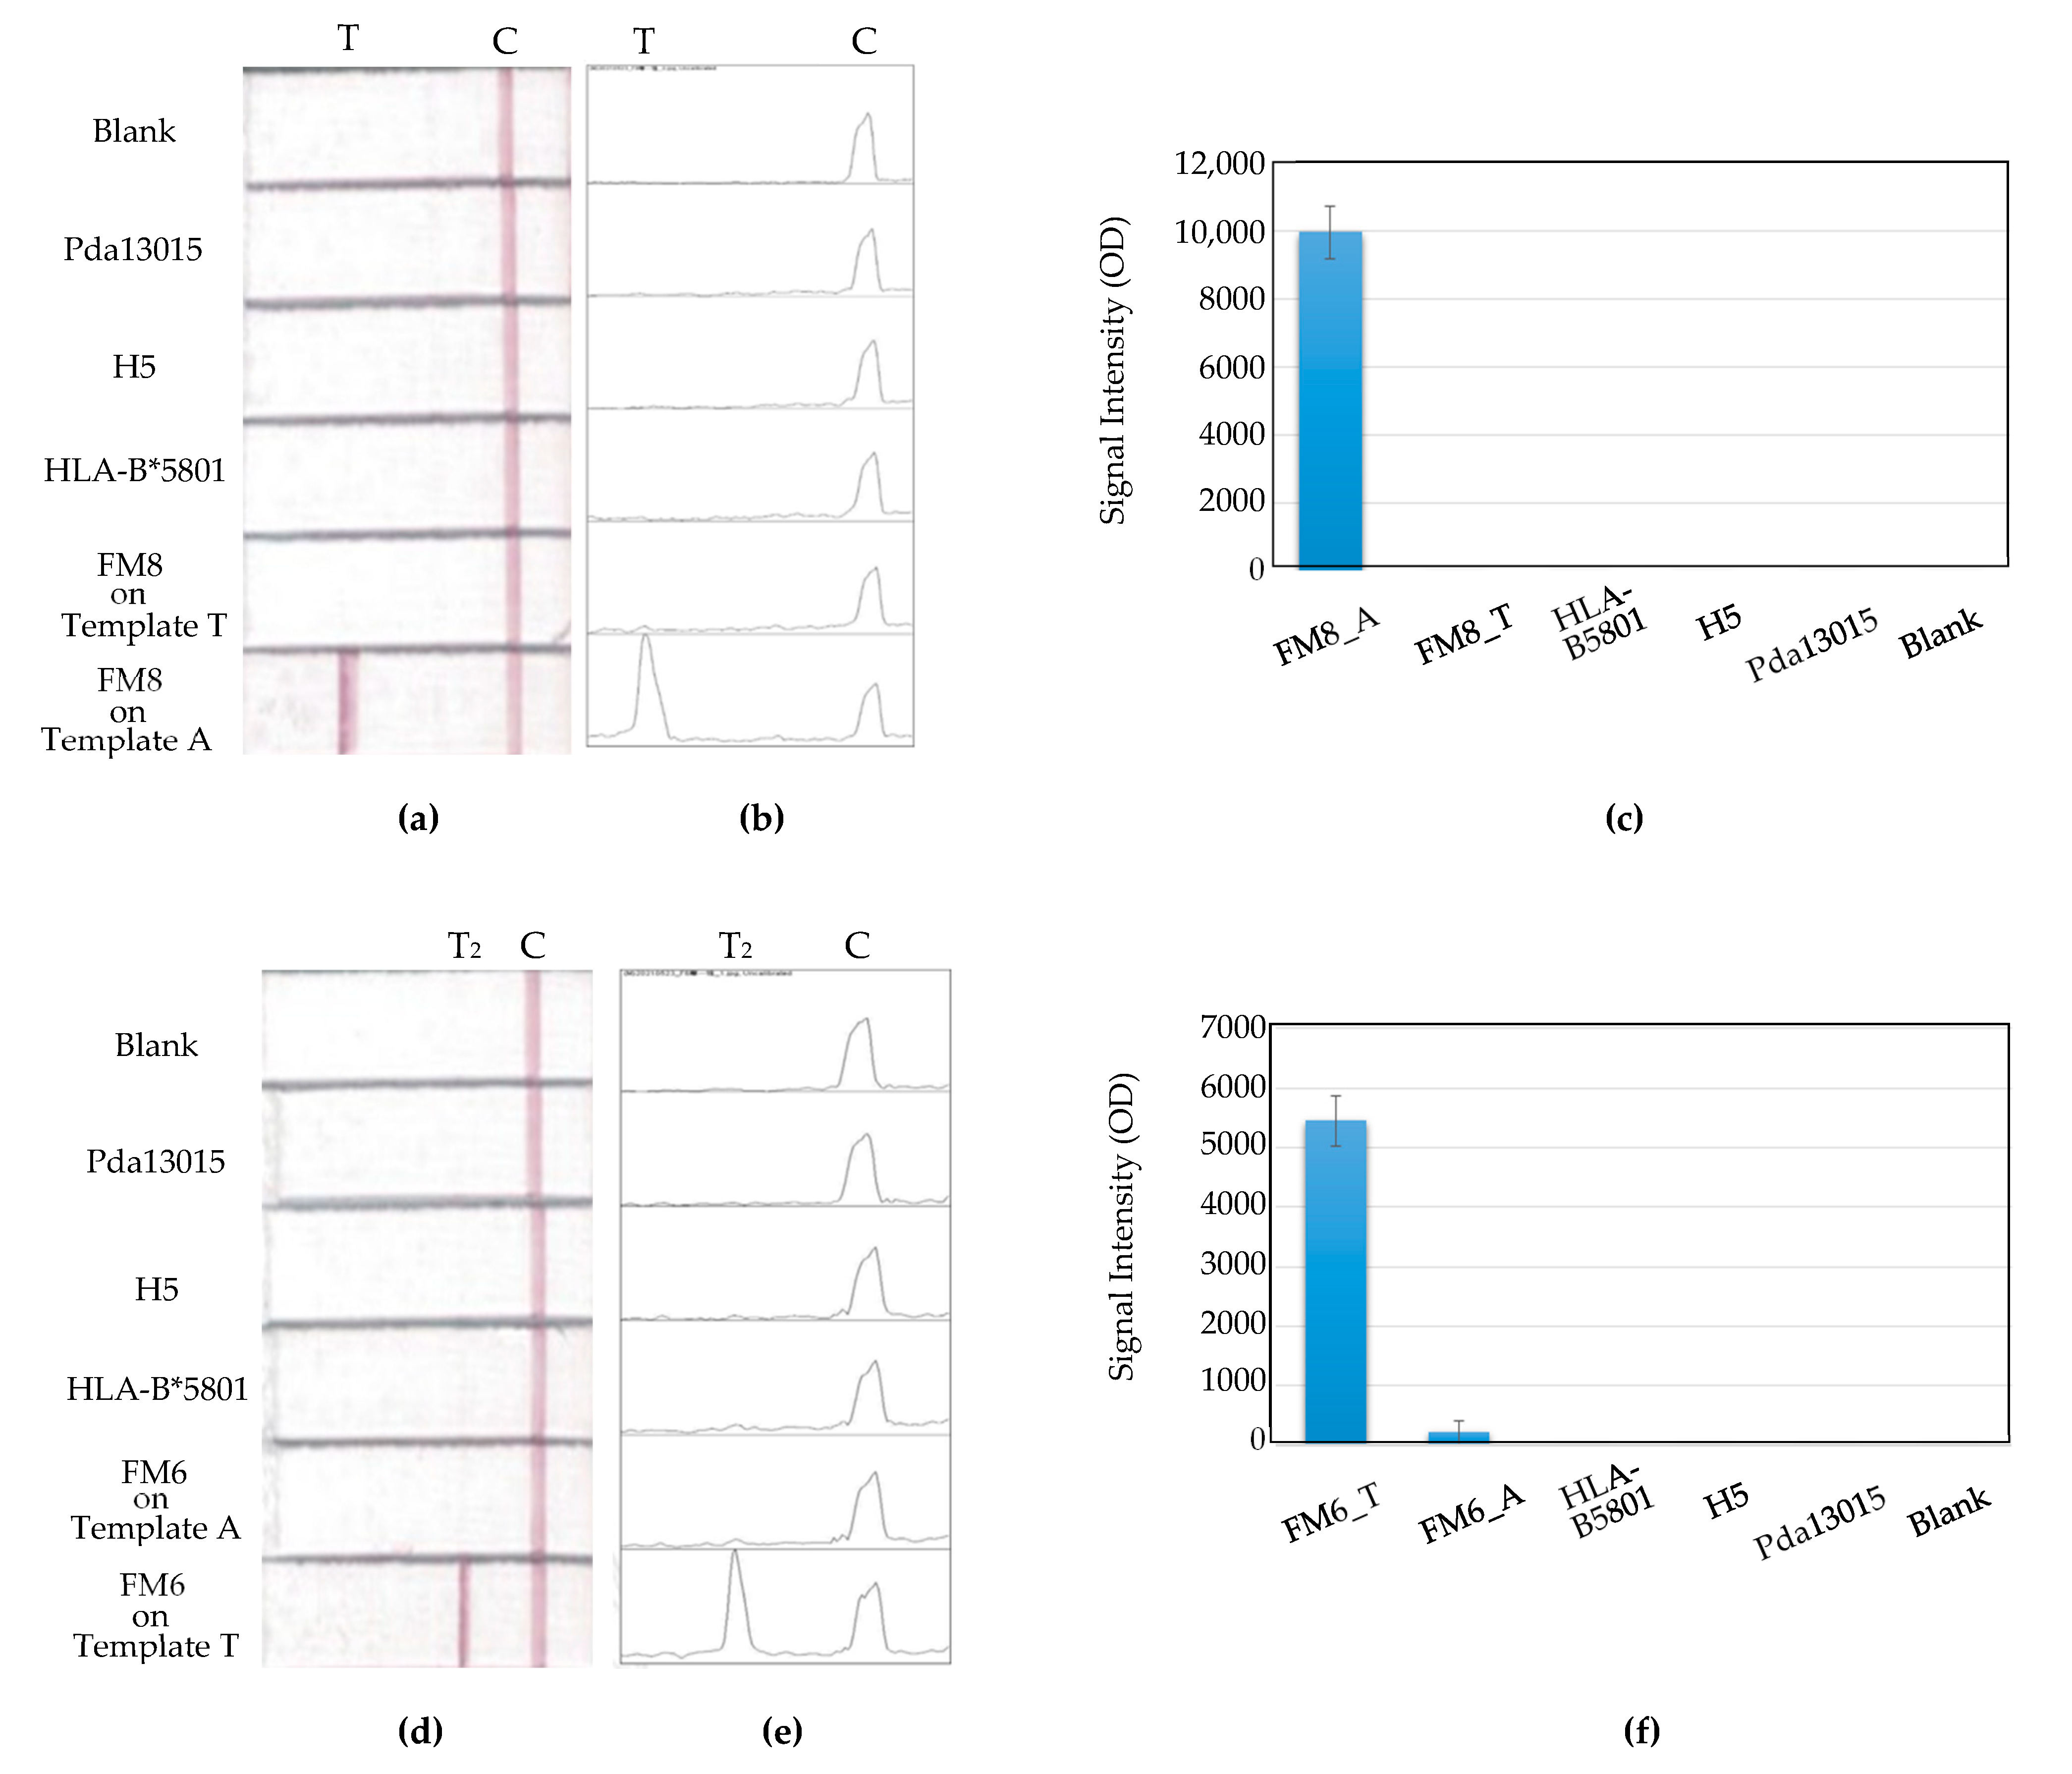
The binding specificity of primers with the model gene sequence was also investigated, along with other negative-control templates. The control sequences chosen were from human gene HLB-B5801, plant gene Pda13015, and bird gene H5. They were described in detail in the Materials and Methods Section. As shown in
Figure 12, for either Primer FM6 or FM8, no non-specific PCR amplifications occurred on any of these negative-control templates. The MBLF strips validated the SNP-sequence specificity for our primers.


