Article

Estimation of Grain Size in Randomly Packed Granular Material Using Laser-Induced Breakdown Spectroscopy

1
Institute of Modern Physics, Chinese Academy of Sciences, Lanzhou 730000, China
2
Institute of Photonics & Photon-Technology, Northwest University, Xi’an 710069, China
3
Advanced Energy Science and Technology, Guangdong Laboratory, Huizhou 516000, China
4
University of Chinese Academy of Sciences, Beijing 100049, China
*
Authors to whom correspondence should be addressed.
These authors contributed equally to this work.
Submission received: 18 March 2022 / Revised: 8 April 2022 / Accepted: 11 April 2022 / Published: 13 April 2022
(This article belongs to the Special Issue Application of Laser-Induced Breakdown Spectroscopy)

Abstract

:
Grain size is one of the most important physical parameters for randomly packed granular (RPG) materials. Its estimation, especially in situ, plays a key role in many natural and industrial processes. Here, the application of laser-induced breakdown spectroscopy (LIBS) was investigated experimentally to estimate the grain size in RPG materials. The experiment was performed by taking sieved copper microspheres with discrete median diameters ranging from 53 to 357 μm as examples and by measuring the plasma emissions induced by 1064 nm laser pulses with a duration of 7 ns in an air environment. It was found that the plasma emission measurements were successful in estimating the grain median diameter via monitoring the variations in plasma temperature (electron density) at the range of median diameter below (above) a critical value. In addition, it was demonstrated that, when plasma temperature serves as an indicator of grain size, the intensity ratio between two spectral lines from different upper energy levels of the same emitting species can be used as an alternative indicator with higher sensitivity. The results show the potential of using LIBS for in situ estimation of grain size in RPG materials for the first time.

1. Introduction

Grain size is one of the most important physical parameters that is examined during many natural and industrial processes involving randomly packed granular (RPG) materials. For example, in aeolian research, characterizing the size of granular sediments can provide information about how the sediments were transported, which is crucial for interpreting depositional environments [1,2]. Furthermore, in the industrial production of granular materials, appropriate and timely inspection of the grain size is essential to control the product quality. However, the current techniques of estimating grain size within a range of several tens to several hundreds of micrometers, such as mechanical sieving and laser diffraction methods, are time consuming and labor intensive. A fast and in situ approach for microgranular estimation is therefore urgently required.
Laser-induced breakdown spectroscopy (LIBS) is an emerging technique for in situ elemental analysis from optical emission of plasma generated by pulsed laser ablation of sample surfaces [3]. Compared with other spectral analysis techniques, LIBS has many unique advantages, including minimum sample preparation or no sample preparation, multi-element measurement, less damage to sample, and capable of remote analysis. Therefore, LIBS technique has good application prospects in the fields of environmental monitoring, industrial analysis, material identification, and space exploration, etc. It also plays a key role in direct analysis of RPG materials with grain sizes ranging from micrometer to submillimeter scale [4,5,6,7,8]. In studies on LIBS of RPG targets and related applications, plasma emissions were obtained by focusing laser pulses onto granular surfaces. It is worth noting that the analytical accuracy and precision of such a technique are usually degraded by the fluctuations of plasma emissions among RPG targets with diversity of grain size (hereinafter called size effect), which is a challenge for LIBS application. Therefore, direct LIBS-based multielement analyses of RPG materials require first to understand the complexity of the interaction between laser pulse and RPG target, especially to figure out the LIBS signal complicated by the size effect stemming from various physical properties of granular material. In fact, recent efforts [9,10] have been dedicated to the investigation on the size effect and achieved the identification of one kind of size effect from a mechanical property of RPG material. According to the fundamentals of granular mechanics [11], for an RPG material, grain size is one of the important factors that affects its mechanical properties. As discussed in previous publications [9,10], changing grain size leads to a difference in its mechanical performance to support the recoil stress induced during the generation and expansion of a laser-induced plasma (hereinafter called laser-induced recoil stress). This will inevitably cause differences in circumstance for the formation of a luminous plasma. Therefore, the size effect, which is originally considered as an adverse factor for spectrochemical analysis, may be employed to estimate the grain size in RPG materials.
The potential of LIBS application to estimate the physical properties of materials, especially material hardness, has been demonstrated frequently in the past nearly two decades. The first paper regarding this topic was published in 2006, in which authors found a monotonic response of the emission intensity ratio of calcium lines with the surface strength of the concrete samples [12]. Since then, LIBS has been widely deemed as a promising hardness testing tool for various materials, such as tissues [13,14], steels and alloys [15,16,17,18,19,20], ceramics [21], and stones [22], via monitoring the variations of the parameters obtainable from plasma emission measurements, including spectral line intensity, excitation temperature, and electron density in plasma. Despite these excellent attempts to expand the scope of LIBS application, to the best of our knowledge, no experiments have been conducted aiming to investigate a possible approach for estimating grain size in RPG materials using LIBS. Hence, the main goal of the present work is trying to establish such an approach. This was carried out by taking randomly packed copper microspheres with discrete median diameters as examples to measure the dependence of the laser-induced plasma emission on the median diameter. Based on detailed spectroscopic analysis, the response relations of the spectral line intensity emitted by copper atoms, the excitation temperature, and the electron density in plasma with the median diameter were obtained. The obtained results validated the potential of using LIBS for in situ estimation of grain size in RPG materials.

2. Material and Methods

2.1. Sample Preparation

For the purpose of this study, we prepared nine size-controlled granular samples using a copper (Cu) granular material which consists of polydisperse micrograins with near-spherical shapes. Sample preparations were realized by mechanical sieving with various mesh sizes. The analyses of the grain sizes and the size distributions in the samples were performed using a particle-size analyzer (Microtrac S3500, MICROTRAC MRB Company, Montgomeryville, PA, USA). The results are listed in Table 1. The sieved Cu microspheres exhibit mono-modal size distributions for all the nine samples (labeled Sn, n = 1–9) with median diameters, d 50 = 53 µm, 72 µm, 86 µm, 100 µm, 113 µm, 145 µm, 176 µm, 245 µm, and 357 µm, respectively.
The containers used in this study were cuboid vessels with an inner length of 10 cm, width of 10 cm, and height of 1 cm. Each sieved sample filled the same container to the brim, and the granular beds were scraped level using a straight edge without shaking or noticeable compaction, producing nine loosely RPG samples with fairly level surfaces. From the differences in mass between the filled and empty containers, the bulk packing fractions for the nine RPG samples were calculated to be in the range of 0.56 to 0.59 depending on grain size.

2.2. Setup and Data Acquisition

A unique LIBS system suitable for studying LIBS of RPG materials was developed in our laboratory. It is described in detail in previous publications [9,10] and only a short overview is presented here. We used a fundamental harmonic Nd: YAG laser with 7 ns pulse duration and 90 mJ pulse energy. The pulsed laser beam was focused using a quartz lens with 80 mm focal length. The lens-to-sample distance was set 68 mm, leading to a laser spot size of about 600 μm on the sample surfaces, which is sufficiently large compared to the grain sizes used here. Thus, a laser fluence of about 32 J/cm2 was irradiated on all the sample surfaces. The collection of light emitted by the plasma was performed along the laser optical axis using a separatrix. The collected lights were detected by a spectrograph (LTB ARYELLE 200) with a spectral resolution of 10,000. To ensure meaningful calculations of the spatially integrated plasma parameters, LIBS spectra were recorded by a spectrograph gate with a delay time of 1 μs to laser pulse and a width of 2 μs. A previous publication [23] showed that pulsed laser ablating RPG target can initiate an excavation process by the laser-induced recoil stress to form a millimetric granular crater. To avoid the influence of the excavation process on both laser–sample interactions and LIBS measurements of subsequent laser pulses, the pulsed laser worked at a low-repetition-rate (1 Hz) mode and each sample was moved rapidly on the plane perpendicular to the laser beam by a 2D mobile platform.

3. Spectroscopic Results

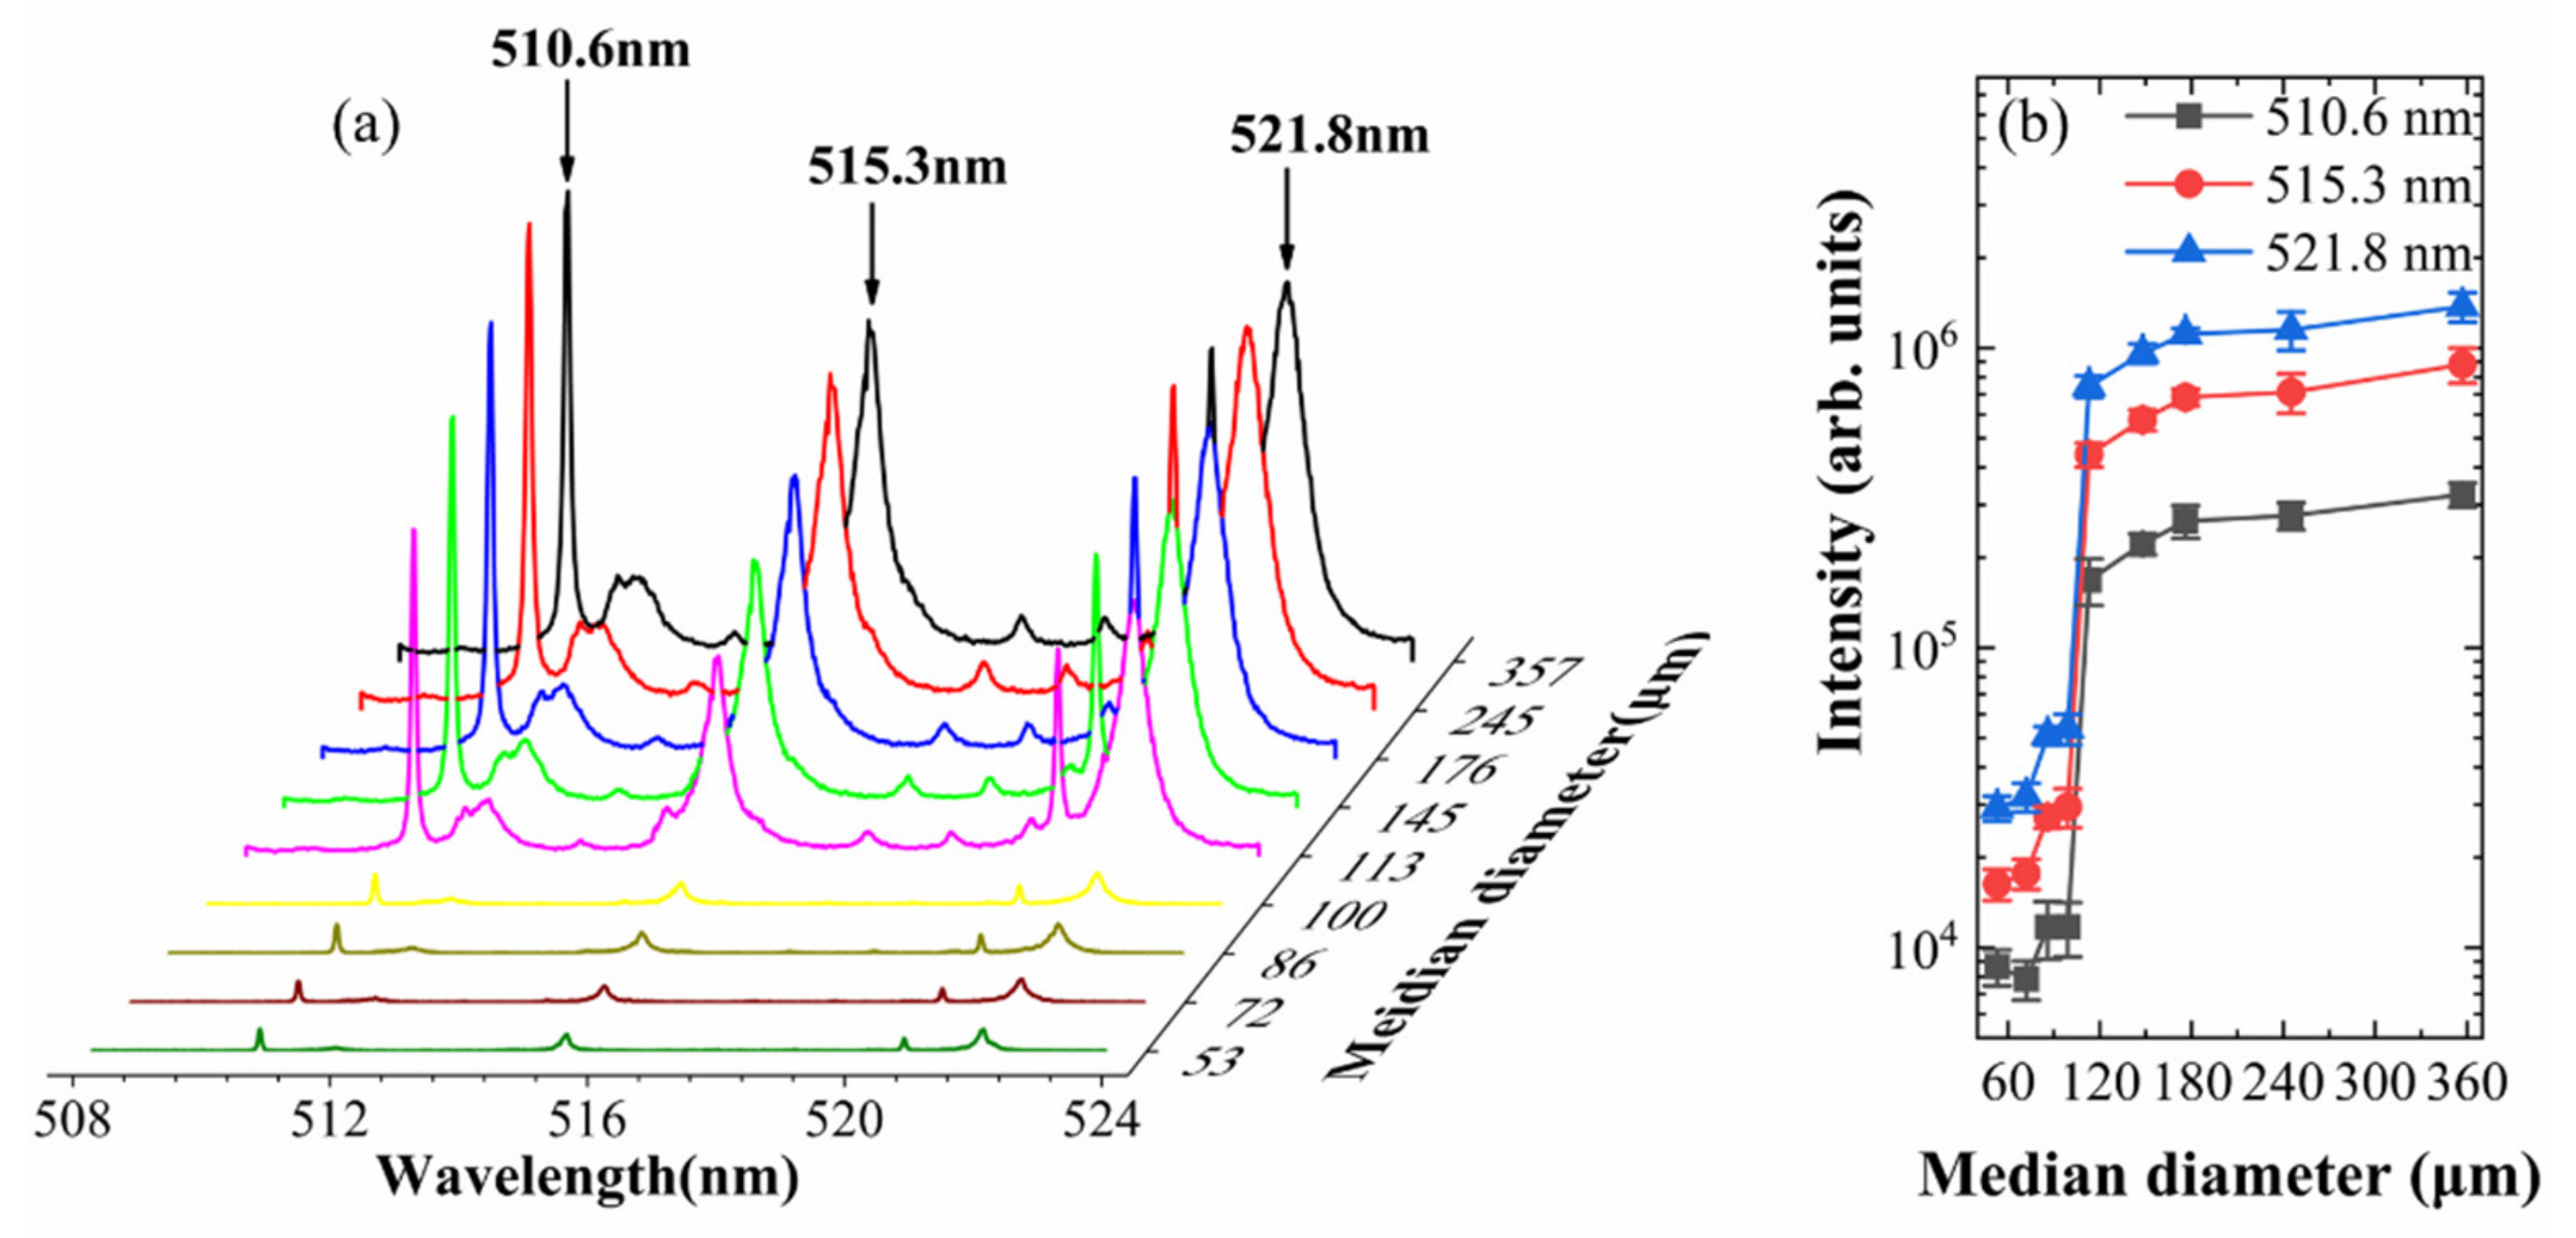
3.1. Response of Spectral Line Intensity with Grain Size

Segments of the LIBS spectra in the wavelength range between 508 and 524 nm for the nine samples are shown in Figure 1a. Each spectrum represents an average of spectra obtained by 60 single shots at fresh positions on the corresponding sample surface. Here, we chose the three spectral lines at 510.6 nm, 515.3 nm, and 521.8 nm emitted by neutral Cu atoms, which have been frequently used for plasma diagnostics in previous LIBS publications [24,25,26], as diagnostic tools for searching for a suitable indicator of grain size. The three lines were chosen because they were present in all the samples and separated sufficiently. In addition, the choice was also based on the fact that they are non-resonant lines as illustrated in Table 2, where some spectroscopic parameters for the three lines are also listed [27]. From Figure 1a one can see that the plasma emission depends on the grain size and two distinct regions of grain size can be identified, where a very different emission behavior is presented.
To obtain quantitative characterizations for the dependence of plasma emission on the grain size, Figure 1b shows the emission intensities of the three Cu I lines as a function of grain median diameter d 50 . The emission intensity I of each line was obtained by integrating the corresponding peak area in each spectrum, as shown in Figure 1a. A steplike phenomenon is observed in the measured I d 50 relations: when d 50 is less than a critical value d c located in the narrow region between 100 and 113 μm, the measured line intensities are weak and depend significantly on the median diameter, but seem not to show a strictly monotonic response with median diameter; when d 50 exceeds the critical value, the line intensities abruptly become 10 times higher and exhibit a level-off response as the d 50 value increases. It indicates that, at least in the present cases, directly monitoring the variations in spectral line intensity with the median diameter is unfeasible to establish a reliable calibration curve for estimation of grain size due to the absence of monotonic relation between them.

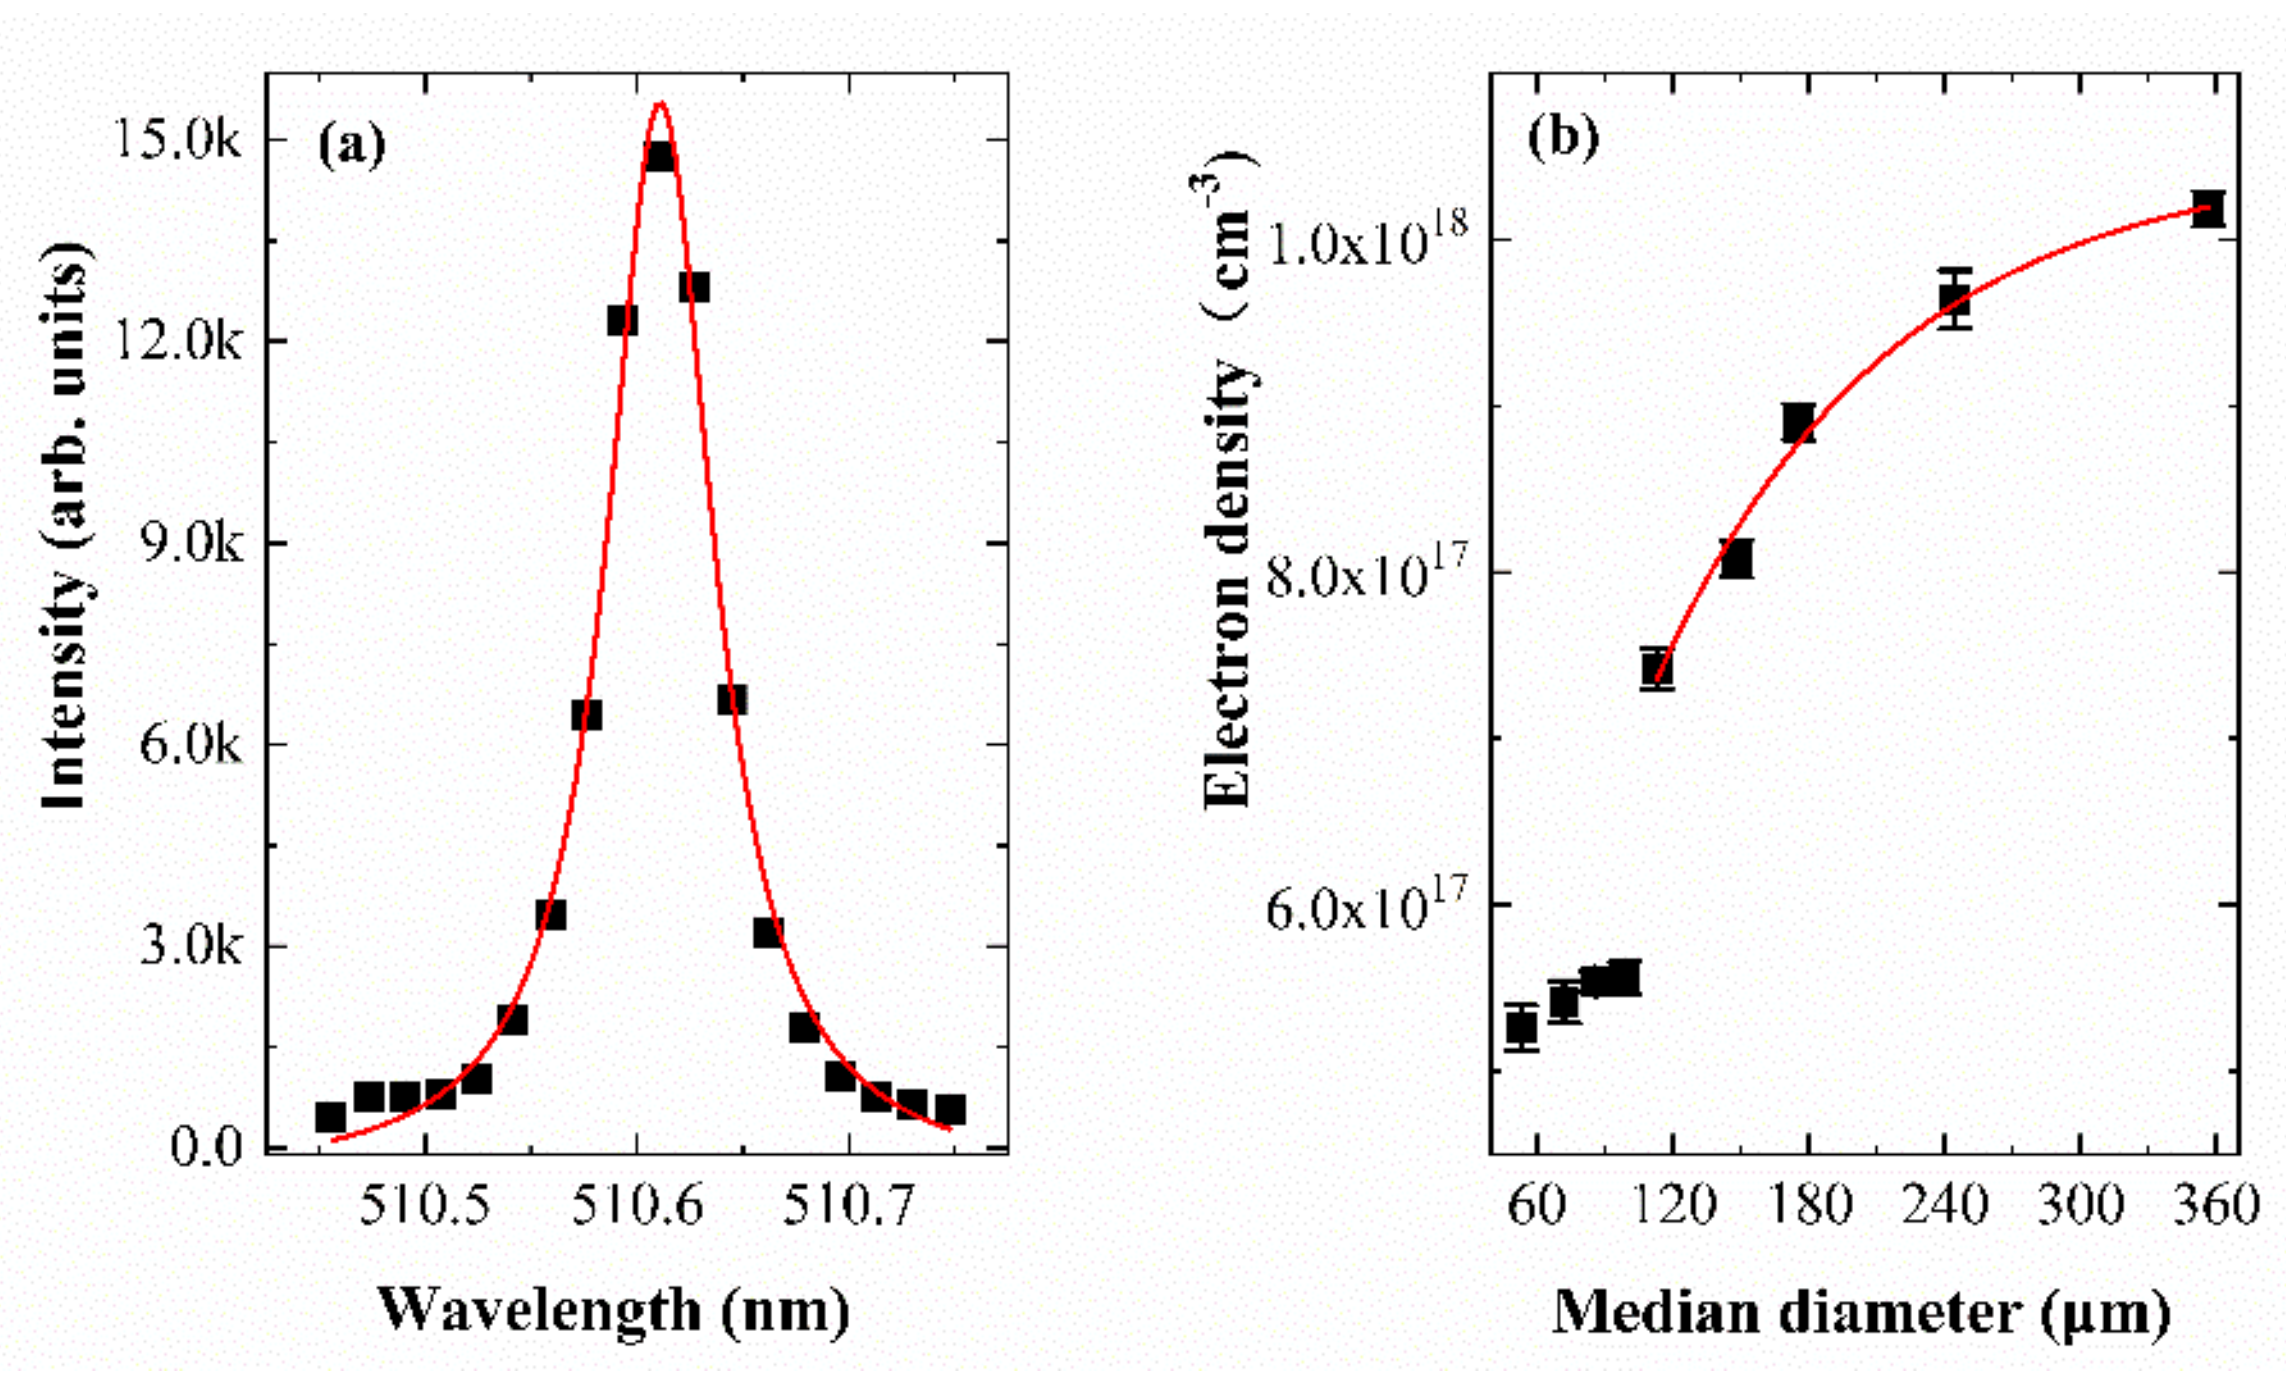
3.2. Response of Electron Density with Grain Size

Electron density in plasma is usually determined by measuring the broadening of a spectral line. In the case of LIBS spectra measured by a spectrograph with quite a good resolution, the Stark broadening is the most important and commonly used for this purpose [28]:
λ 1 / 2 = 2 ω N e 10 16
where λ 1 / 2 is the full width at half maxima (FWHM) of spectral line. ω and N e are the electron impact parameter and the electron density, respectively. Here, following previous publications [28,29], we used the Cu I line at 510.6 nm to determine the electron density. Taking sample S1 ( d 50 = 53 μm) as an example, the profile of the Cu I line at 510.6 nm is shown in Figure 2a and an approximately Lorentzian profile can be observed clearly. This implies that those other broadening mechanisms contributing to the line width, such as Doppler broadening, resonance broadening, and instrumental broadening, are negligible in current experiments.
The calculated N e values as a function of the grain median diameter are displayed in Figure 2b. One can see that the N e d 50 relation exhibits a similar steplike behavior to that shown in those measured I d 50 relations. In the size range of d 50 < d c , although the N e presents a slight increase with incremental d 50 value, it seems difficult to construct an unambiguous one-to-one correspondence between N e and d 50 , especially considering the error bars caused by uncertainties in extracting the λ 1 / 2 value by Lorentzian curve fitting. However, in the size range of d 50 > d c , the N e value shows an exponential increase from 7.42 × 1017 cm−3 to 1.02 × 1018 cm−3 as d 50 value increases from 113 μm to 357 μm. The exponential response of the electron density with the median diameter is sensitive and provide a reliable calibration curve to be used for the estimation of grain size in a similar copper RPG sample to those used here but having an unknown median diameter which is limited in the range of d 50 > d c .

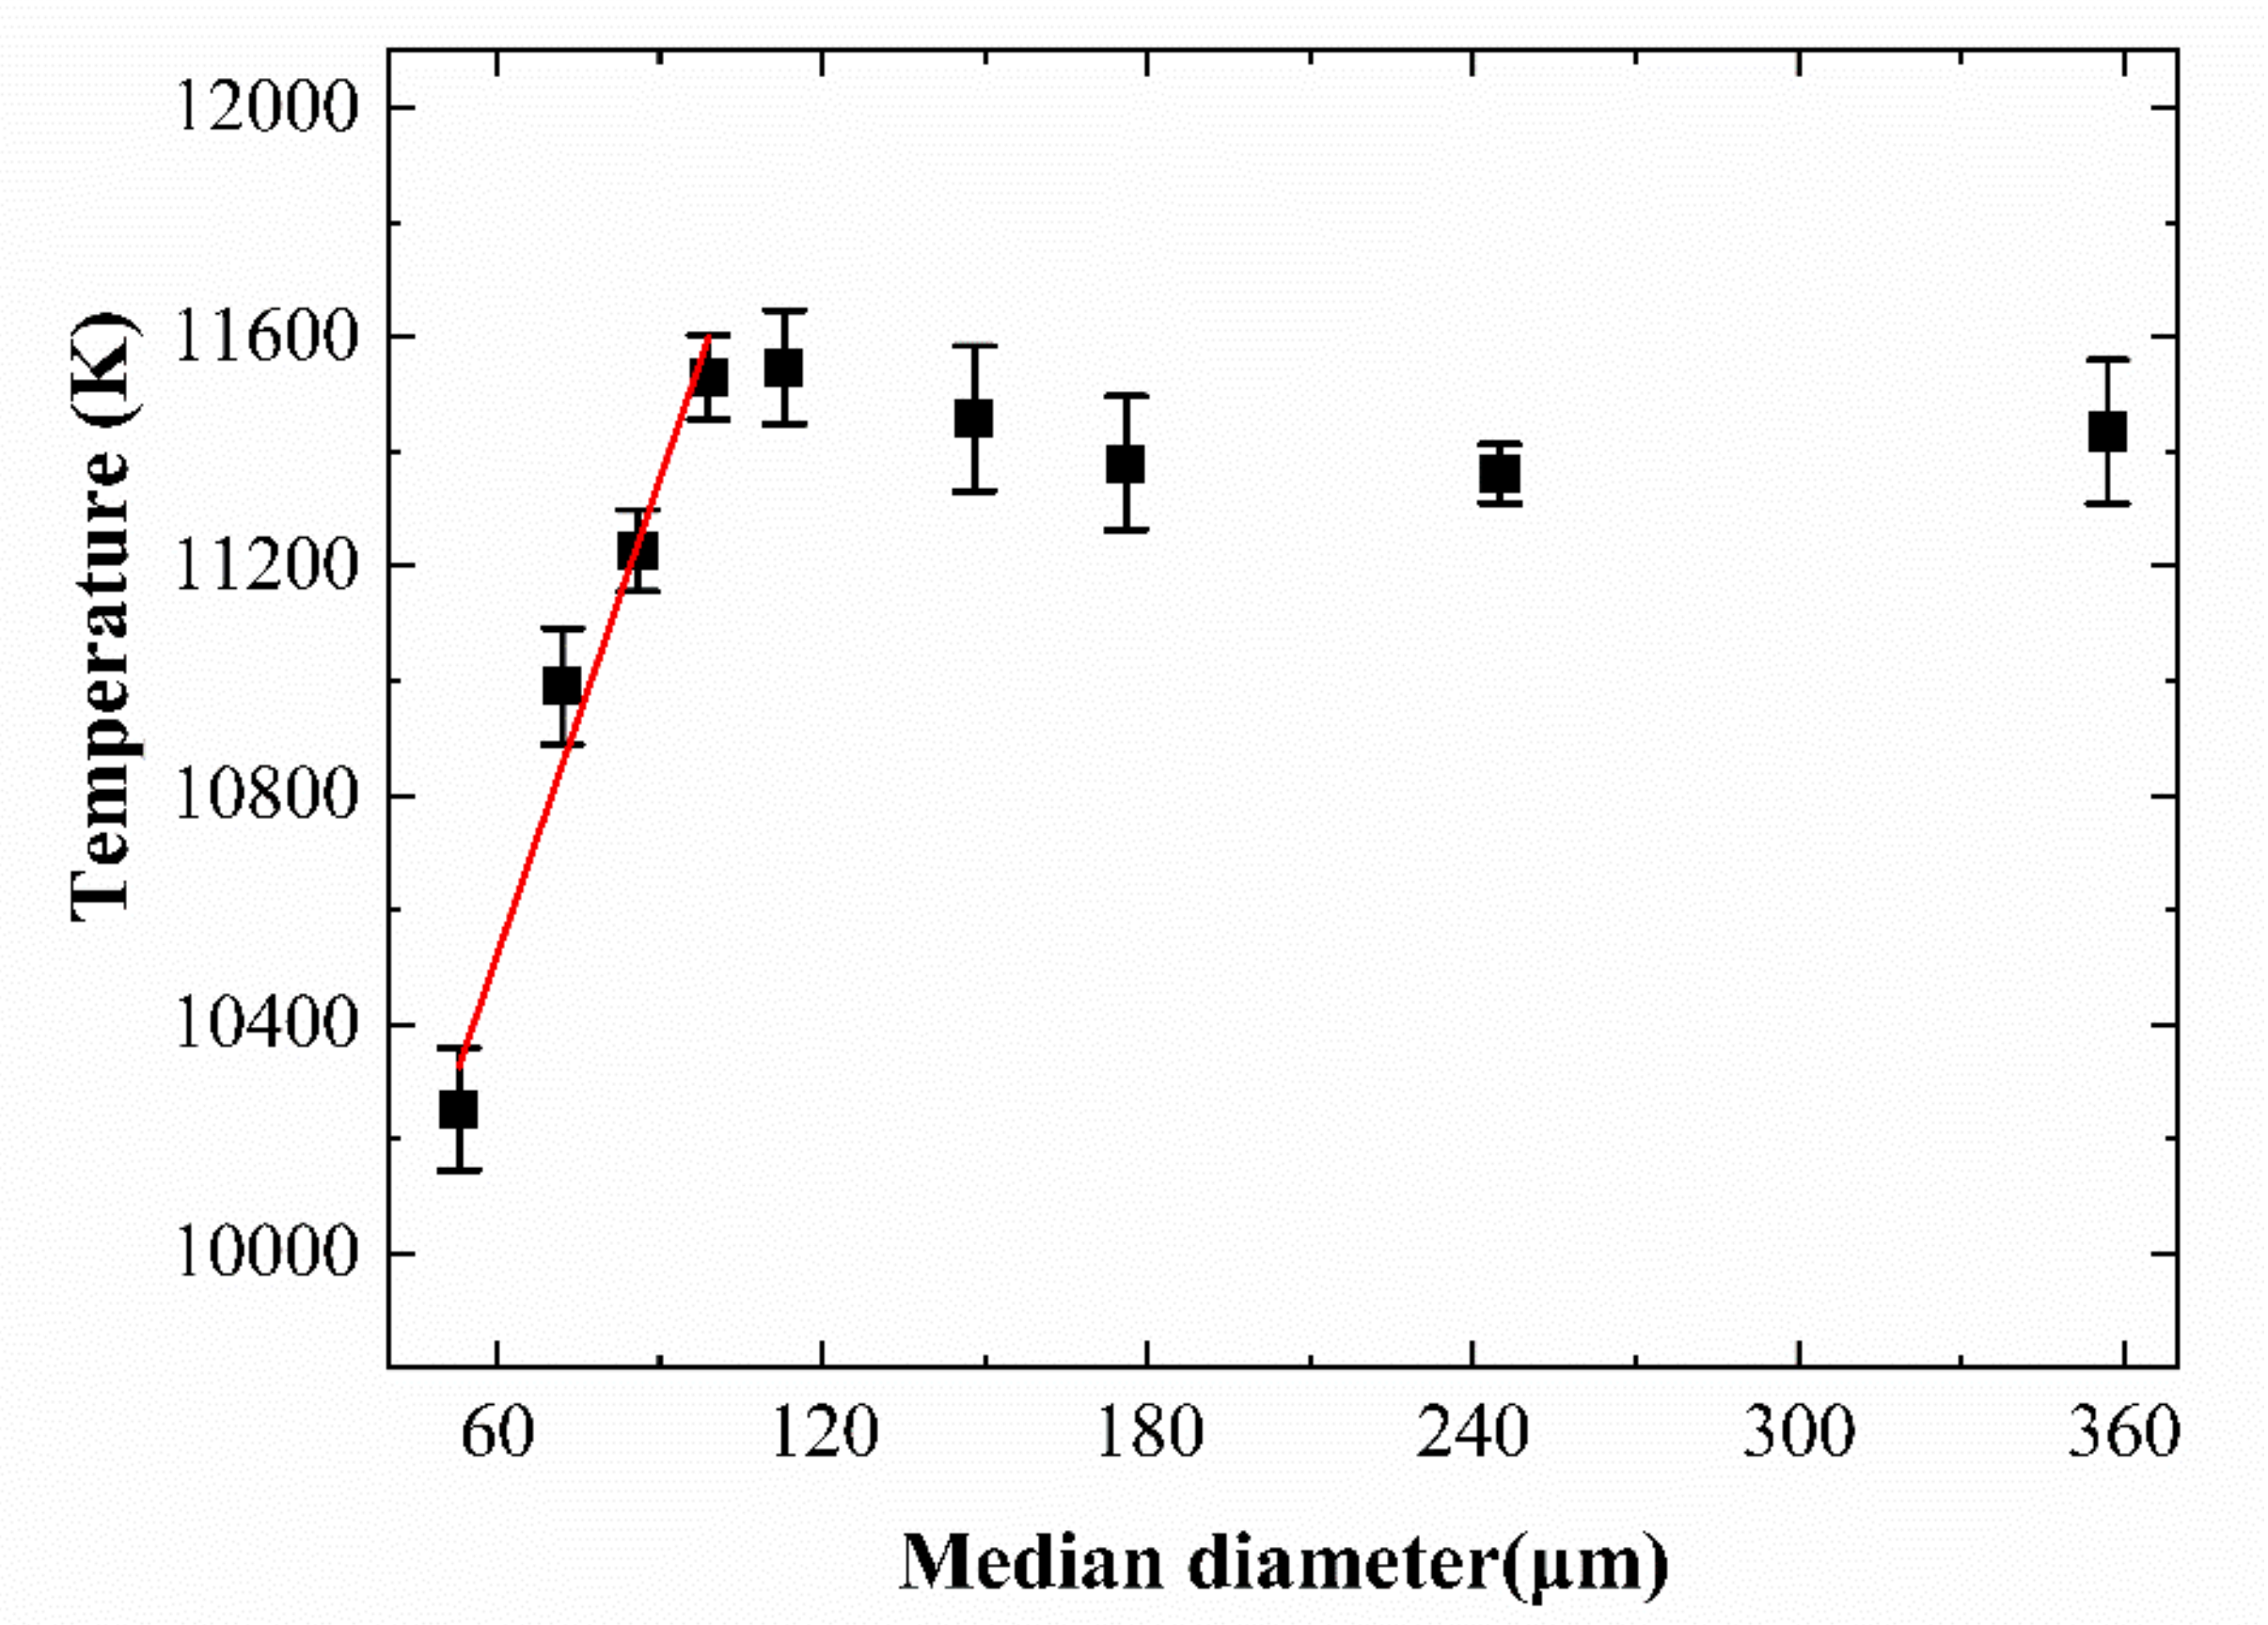
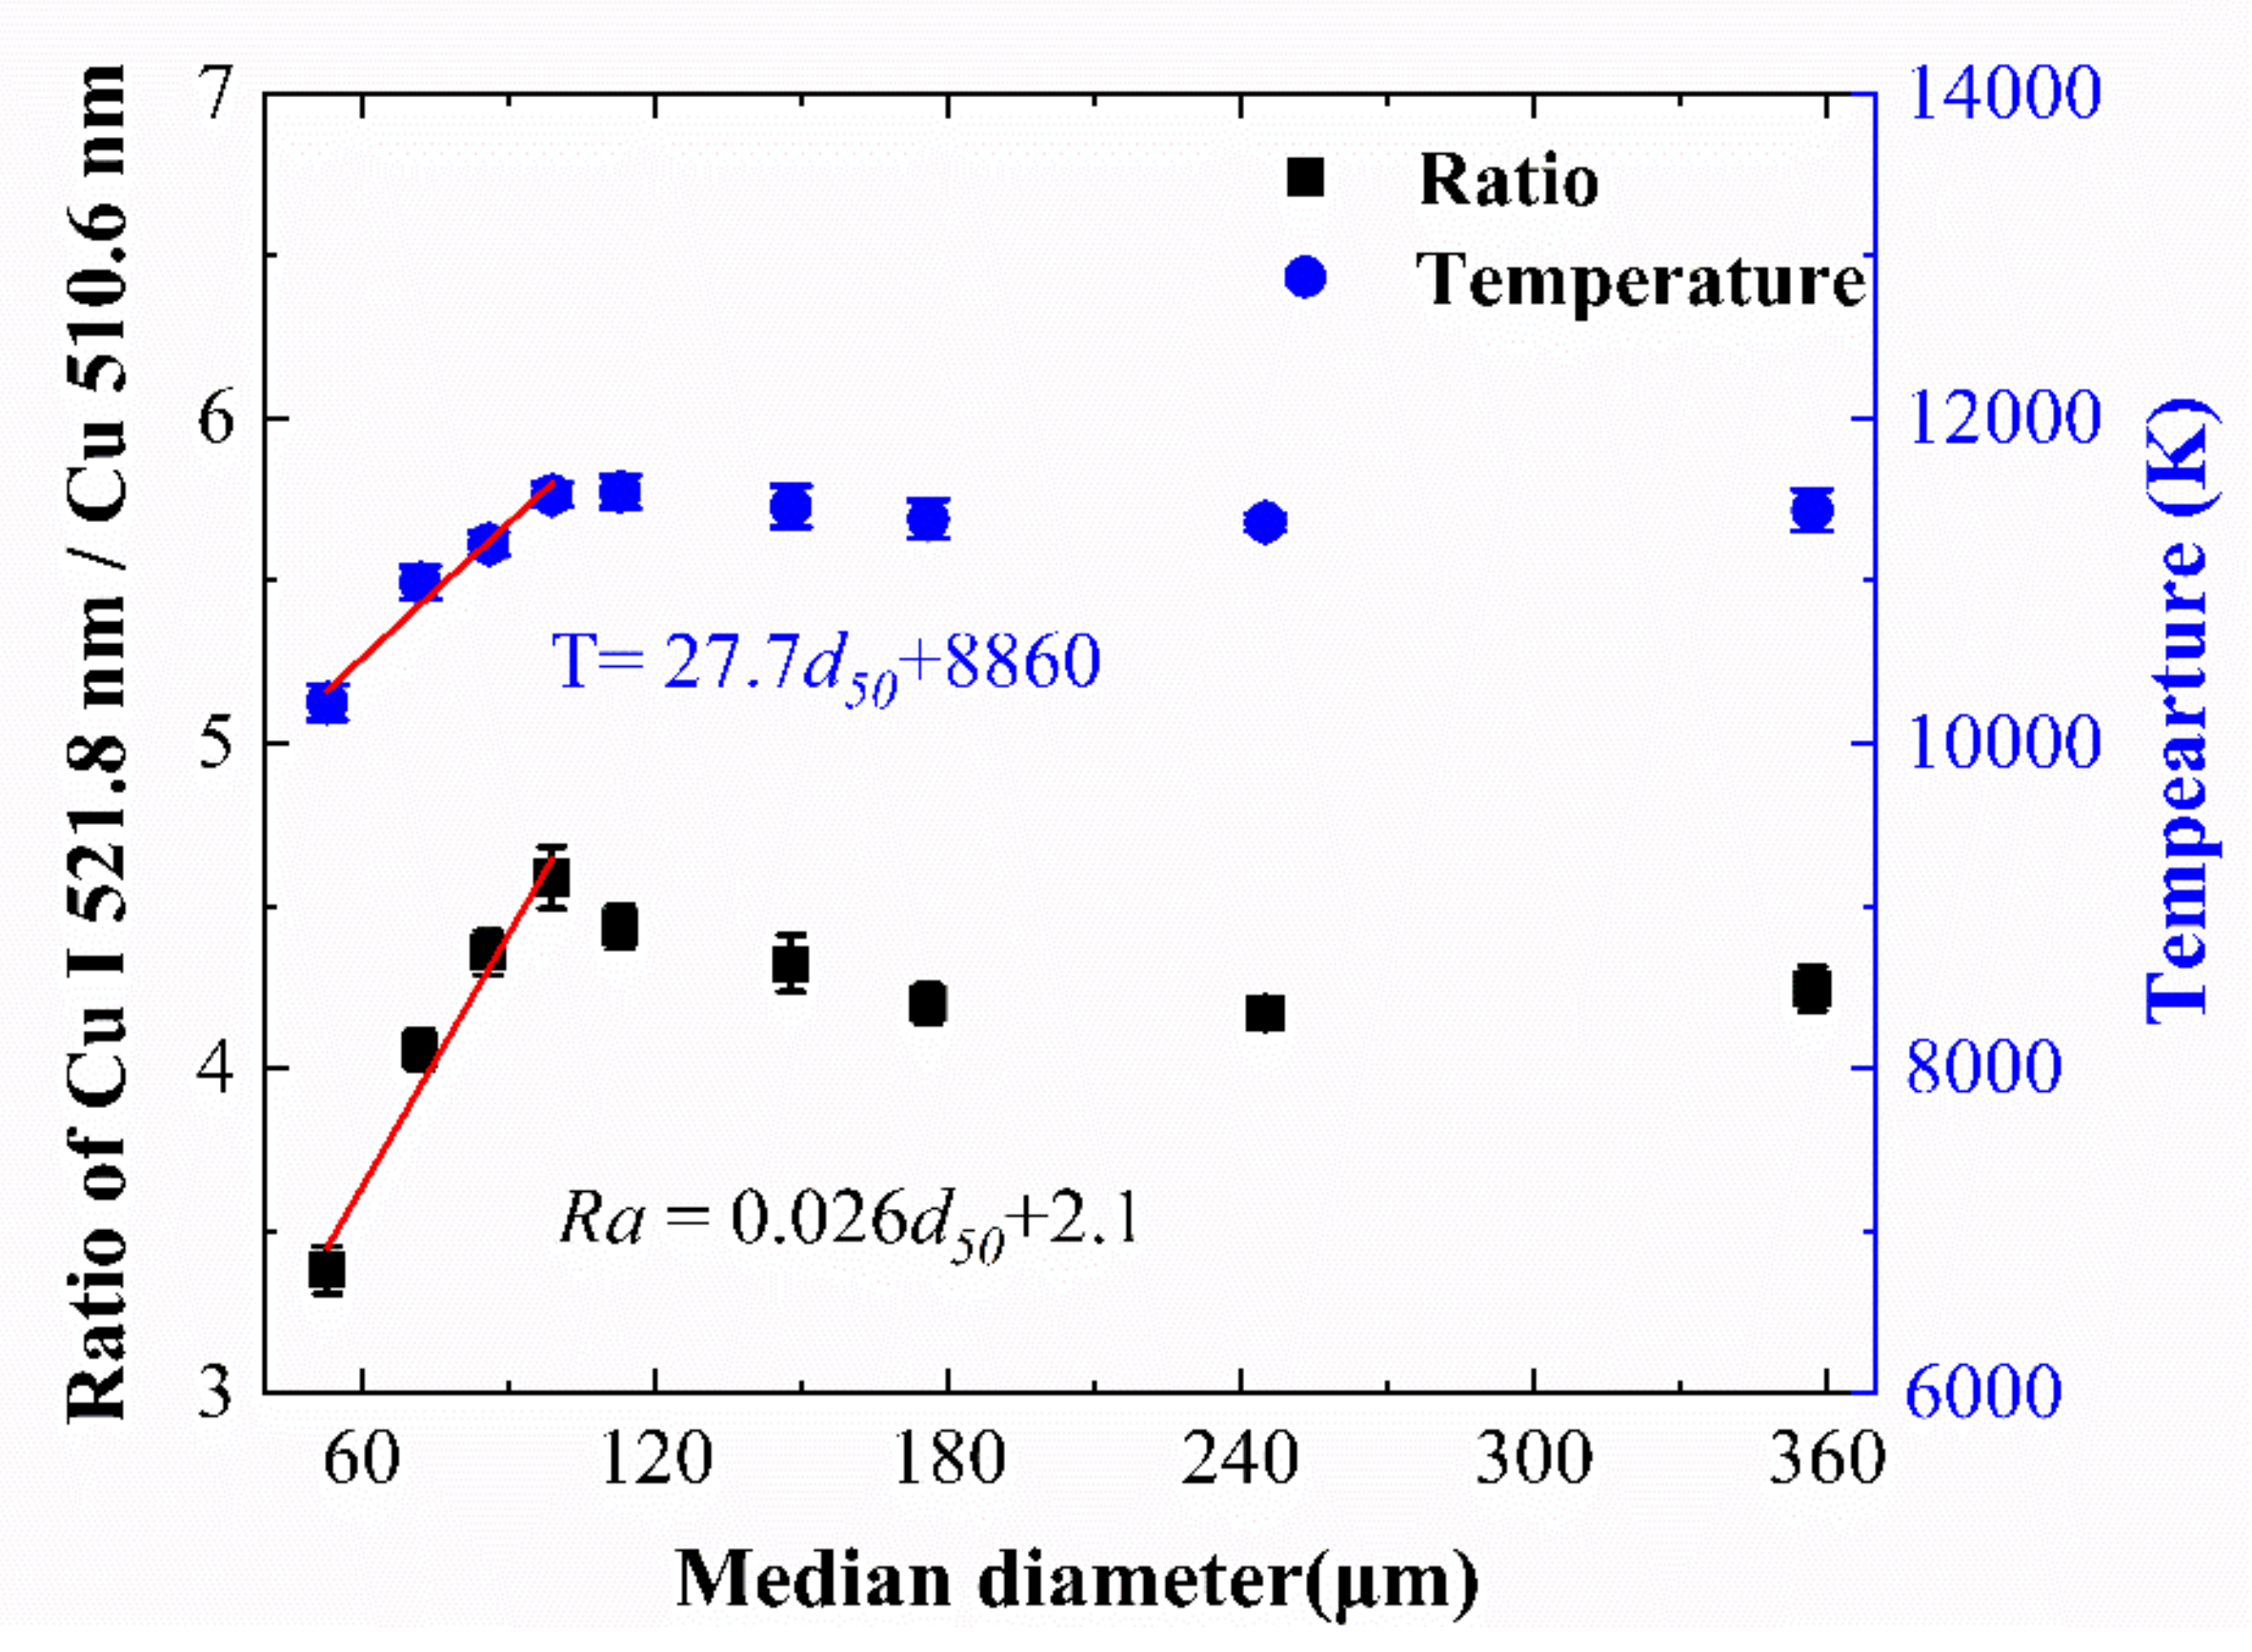
3.3. Response of Plasma Temperature with Grain Size

In studies on LIBS, plasma temperature can be determined using the Boltzmann plot method in the framework of local-thermal-equilibrium (LTE) approximation. The Boltzmann equation used to calculate plasma temperature is as follows [24]:
ln λ i j I i j h c g j A i j = E j k B T + ln h c N e U T
where I i j is the intensity of spectral line with a wavelength λ i j related to a degeneracy of upper state g j and transition probability A i j . E j is the atomic energy of the upper state, k B is the Boltzmann constant, T is the plasma temperature, h is the Planck’s constant, c is the speed of light, N e is the electron density in plasma, and U T is the partition function. The plasma temperature can be easily calculated from the slope of the plot of ln λ i j I i j h c g j A i j versus E j indicated in Equation (2). Here, the plasma temperature was calculated using the three Cu I lines listed in Table 1. The obtained values of temperature related to different grain median diameters are displayed in Figure 3. One can clearly see that, when d 50 < d c , the plasma temperature increases linearly from 10,250 K to 11,530 K with incremental d 50 value from 53 μm to 100 μm; however, when d 50 > d c , the plasma temperature shows a level-off response with the median diameter. This indicates that choosing plasma temperature as an indicator of grain size is feasible for similar copper RPG samples to those used here but having unknown median diameters limited in the range of d 50 < d c .
It is well known that emission intensity ratio between two spectral lines from different upper energy levels of the same emitting species is given by the following exponential equation:
R a = I λ j I λ k = C e E k E j k b T
where C is a constant that is determined by the wavelength, transition probability, and statistical weight of the two lines. E j and E k are the upper-level energies corresponding to the two transition lines, respectively. Because the power of the exponential Equation (3) is proportional to the inversion of T , the ratio should be viewed as a temperature amplifier which is more suitable for the T difference monitoring. As a result, when plasma temperature can serve as an indicator of grain size, R a could be employed as an alternative indicator with higher sensitivity. In order to check this point, the data shown in Figure 1b were used to obtain the ratio values of R a d 50 = I 521.8   nm / I 510.6   nm for the nine samples and displayed in Figure 4. To facilitate the comparison, the T d 50 values in Figure 3 are also plotted in Figure 4 with the right y-axis scale. One can find that the R a d 50 relation, closely similar to the T d 50 case, also presents two distinct regions separated by the critical size d c : a nearly level-off response when d 50 > d c and a fairly good linear response when d 50 < d c . It needs to be emphasized that the slope of the R a d 50 relation in the size range of d 50 < d c is nearly two times larger than that of T d 50 , indicating that the ratio indeed can serve as an indicator of grain size with a sensitivity two-times higher than direct use of plasma temperature.

4. Explanation and Discussion on Spectroscopic Results

The formation dynamics of a luminous plasma induced by focusing a laser pulse onto RPG target has been reported thoroughly in recent publications [9,10]. To put it simply, three physical properties of RPG target surface are important in influencing the plasma formation, including roughness, thermal conductivity, and mechanical performance. The spectroscopic results observed here are actually the consequences of a collective effect of grain size stemming from the three properties. The first two properties produce an effect that smaller grain sizes prefer to form a luminous plasma with higher temperature and higher density because smaller sizes lead to more efficient laser ablation [30]. However, the third property produces an opposite effect, i.e., smaller grain sizes prefer to form a luminous plasma with lower temperature and lower density. This is due to the fact that smaller sizes lead to poorer mechanical performances of RPG target surface to support the laser-induced recoil stress. As a result, RPG target surfaces with smaller grain sizes absorb more efficiently the energy and particles originally belonging to the plasma during its expansion. For the steplike phenomenon present in the measured I ( d 50 ) , N e d 50 and T ( d 50 ) relations, it has been well understood by considering RPG material as a non-Newtonian fluid with a bulk yield stress and an effective viscosity [9]: in the size range of d 50 > (<) d c , the RPG target surface has a yield stress larger (smaller) than the laser-induced recoil stress, and therefore behaves like an elastic solid (a viscous fluid) to assist (impede) the formation of a plasma with high temperature and high density.
Based on the above descriptions, our results that larger grain sizes lead to higher plasma temperatures and electron densities when d 50 < d c , should be attributed to the fact that the collective effect of grain size is dominated by that stemming from the mechanical performance. Specifically speaking, it can be understood by considering the differences in viscosity (the resistance to flow) among the RPG samples S1–S4. According to the fundamentals of granular mechanics [11], the viscosity of an RPG material depends on grain size: larger sizes lead to higher viscosities and thus to poorer fluidities. For an RPG material with a poorer fluidity, it would be expected to have a lower absorption efficiency to the energy and particles (at least including electron and Cu atom) originally belonging to the plasma. As a result, we observed a hotter and denser luminous plasma with incremental grain size.
In the size range of d 50 > d c , the exponential increase in electron density with incremental grain size suggests that the size effect stemming from the mechanical performance is still present although each sample has a bulk yield stress larger than the laser-induced recoil stress. This is understandable when considering that the yield stress of the superficial layer of the RPG target may be still less than the recoil stress and depends on the grain size (smaller sizes to lower yield stresses of superficial layers, thus to poorer mechanical performances of superficial layers). As a result, a portion of electrons originally belonging to the plasma can be absorbed by the RPG target with an efficiency depending on its mechanical performance, which is characterized by the increase in electron density with incremental grain size. Negligible differences in plasma temperature among the five samples may reflect that, in the size range of d > dc, the size effect from roughness and thermal conductivity becomes important and has an ability to compensate the variations in the plasma temperature caused by that stemming from the mechanical performance.
Now let us address the reason why directly monitoring the variations in line intensity with the grain size is unfeasible to estimate the grain size. It is well known that directly influencing the intensity of a specific spectral line is not only the number density of the emitting species in plasma but also the plasma temperature and electron density. Considering this point, it is not surprising that an expected monotonic response of line intensity with the grain size may be disturbed by the multi-parameter effect.
It should be stressed that the measured response trends of the spectral line intensity, the excitation temperature, and the electron density in plasma with the grain size should be common behaviors in LIBS of RPG materials. Knowing and understanding these response trends are very useful to establish an approach for estimating the grain size in RPG materials using LIBS. Considering that the mechanical performance of RPG material surface is the decisive factor for the specific response relations, the calibration curves to be used for the estimation of unknown grain size in an RPG material should depend on many granular parameters such as size distribution, packing fraction, grain roughness, and shape.

5. Conclusions

Taking nine sieved copper microspheres with discrete median diameters ranging from 53 to 357 μm as examples, we experimentally investigated the approach for in situ estimating the grain size in RPG material using LIBS. The experiment was performed to measure the plasma emissions induced by 1064 nm laser pulses of 7 ns duration ablating the nine copper RPG samples in air. By detailed spectroscopic analysis, we presented two important observations. One is that the responses of the spectral line intensity, the plasma temperature and the electron density with the microsphere median diameter are separated as two distinct regions by a common critical median diameter. Another is that the measured response relation of the plasma temperature (electron density) with the median diameter can provide a reliable calibration curve to be used for the estimation of the median diameter in the limited range below (beyond) the critical size. The successful establishment of the calibration curves in the two distinct size regions is attributed to the dependence of mechanical performance of RPG material surface on grain size, resulting in a grain-size dependent formation circumstance of luminous plasma. The results obtained in the present work confirmed the potential of using LIBS for direct estimation of grain size in RPG materials.

Author Contributions

Conceptualization, S.L., Y.L., X.L. and D.Q.; methodology, S.L. and Y.L.; software, X.L. and L.C.; validation, S.L.; formal analysis, S.L. and Y.L.; investigation, S.L.; resources, X.L., S.L. and Y.L.; data curation, S.L.; writing—original draft preparation, S.L.; writing—review and editing, D.Q., S.Z. and X.M.; visualization, S.L.; supervision, S.Z. and X.M.; project administration, D.Q. and X.M.; funding acquisition, D.Q. and X.M. All authors have read and agreed to the published version of the manuscript.

Funding

This research was funded by the National Key Research and Development Program of China (2017YFA0402300), the National Natural Science Foundation of China (11974359 and U1632143).

Institutional Review Board Statement

Not applicable.

Informed Consent Statement

Not applicable.

Data Availability Statement

Not applicable.

Acknowledgments

The authors thank the National Natural Science Foundation of China.

Conflicts of Interest

The authors declare no conflict of interest.

References

  1. Laceby, J.P.; Evrard, O.; Smith, H.; Blake, W.; Olley, J.M.; Minella, J.P.; Owens, P. The challenges and opportunities of addressing particle size effects in sediment source fingerprinting: A review. Earth Sci. Rev. 2017, 169, 85–103. [Google Scholar] [CrossRef]
  2. Vandenberghe, J. Grain size of fine-grained windblown sediment: A powerful proxy for process identification. Earth Sci. Rev. 2013, 121, 18–30. [Google Scholar] [CrossRef]
  3. Wang, Z.; Afgan, M.S.; Gu, W.; Song, Y.; Wang, Y.; Hou, Z.; Song, W.; Li, Z. Recent advances in laser-induced breakdown spectroscopy quantification: From fundamental understanding to data processing. TrAC Trends Anal. Chem. 2021, 143, 116385. [Google Scholar] [CrossRef]
  4. David, G.; Meslin, P.-Y.; Dehouck, E.; Gasnault, O.; Cousin, A.; Forni, O.; Berger, G.; Lasue, J.; Pinet, P.; Wiens, R.; et al. Laser-Induced Breakdown Spectroscopy (LIBS) characterization of granular soils: Implications for ChemCam analyses at Gale crater, Mars. Icarus 2021, 365, 114481. [Google Scholar] [CrossRef]
  5. Wisbrun, R.; Schechter, I.; Niessner, R.; Schroeder, H.; Kompa, K.L. Detector for trace elemental analysis of solid environmental samples by laser plasma spectroscopy. Anal. Chem. 1994, 66, 2964–2975. [Google Scholar] [CrossRef]
  6. Xu, L.; Bulatov, V.; Gridin, V.V.; Schechter, I. Absolute analysis of particulate materials by laser-induced breakdown spectroscopy. Anal. Chem. 1997, 69, 2103–2108. [Google Scholar] [CrossRef] [PubMed]
  7. Stehrer, T.; Praher, B.; Viskup, R.; Jasik, J.; Wolfmeir, H.; Arenholz, E.; Heitz, J.; Pedarnig, J.D. Laser-induced breakdown spectroscopy of iron oxide powder. J. Anal. At. Spectrom. 2009, 24, 973–978. [Google Scholar] [CrossRef]
  8. Judge, E.J.; Barefield, J.E.; Berg, J.M.; Clegg, S.M.; Havrilla, G.J.; Montoya, V.M.; Le, L.A.; Lopez, L.N. Laser-induced breakdown spectroscopy measurements of uranium and thorium powders and uranium ore. Spectrochim. Acta Part B At. Spectrosc. 2013, 83–84, 28–36. [Google Scholar] [CrossRef]
  9. Li, X.-L.; Li, Y.-J.; Li, S.-T.; Zhou, M.-J.; Chen, L.-W.; Meng, J.; Qian, D.-B.; Yang, J.; Zhang, S.-F.; Wu, Y.; et al. Steplike behavior in grain-size-dependent optical emission of plasma induced by laser-ablating granular material. Phys. Rev. Appl. 2021, 16, 024017. [Google Scholar] [CrossRef]
  10. Li, Y.; Li, X.; Li, S.; Zhou, M.; Qian, D.; Chen, L.; Yang, J.; Zhang, S.; Ma, X. Observation of different regimes of the grain size effect on plasma emission induced by laser ablating granular materials. J. Anal. At. Spectrom. 2021, 36, 1969–1976. [Google Scholar] [CrossRef]
  11. Duran, J. Sands, Powders, and Grains: An Introduction to the Physics of Granular Materials; Springer: New York, NY, USA, 2000. [Google Scholar]
  12. Tsuyuki, K.; Miura, S.; Idris, N.; Kurniawan, K.H.; Lie, T.J.; Kagawa, K. Measurement of concrete strength using the emission intensity ratio between Ca(II) 396.8 nm and Ca(I) 422.6 nm in a Nd:YAG laser-induced plasma. Appl. Spectrosc. 2006, 60, 61–64. [Google Scholar] [CrossRef] [PubMed]
  13. Abdel-Salam, Z.; Galmed, A.; Tognoni, E.; Harith, M. Estimation of calcified tissues hardness via calcium and magnesium ionic to atomic line intensity ratio in laser induced breakdown spectra. Spectrochim. Acta Part B At. Spectrosc. 2007, 62, 1343–1347. [Google Scholar] [CrossRef]
  14. Abdel-Salam, Z.; Nanjing, Z.; Anglos, D.; Harith, M.A. Effect of experimental conditions on surface hardness measurements of calcified tissues via LIBS. Appl. Phys. A 2008, 94, 141–147. [Google Scholar] [CrossRef]
  15. Labutin, T.A.; Popov, A.; Lednev, V.; Zorov, N.B. Correlation between properties of a solid sample and laser-induced plasma parameters. Spectrochim. Acta Part B At. Spectrosc. 2009, 64, 938–949. [Google Scholar] [CrossRef]
  16. Aberkane, S.M.; Bendib, A.; Yahiaoui, K.; Boudjemai, S.; Abdelli-Messaci, S.; Kerdja, T.; Amara, S.; Harith, M. Correlation between Fe–V–C alloys surface hardness and plasma temperature via LIBS technique. Appl. Surf. Sci. 2014, 301, 225–229. [Google Scholar] [CrossRef]
  17. Huang, J.; Dong, M.; Lu, S.; Li, W.; Lu, J.; Liu, C.; Yoo, J.H. Estimation of the mechanical properties of steel via LIBS combined with canonical correlation analysis (CCA) and support vector regression (SVR). J. Anal. At. Spectrom. 2018, 33, 720–729. [Google Scholar] [CrossRef]
  18. Galmed, A.H.; Steenkamp, C.; Ahmed, I.; Du Plussis, A.; Von Bergmann, H.; Harith, M.A.; Maaza, M. Using laser-induced breakdown spectroscopy to monitor the surface hardness of titanium samples bombarded by carbon ions. Appl. Phys. A 2018, 124, 225. [Google Scholar] [CrossRef]
  19. Momcilovic, M.; Petrovic, J.; Ciganovic, J.; Cvijovic-Alagic, I.; Koldzic, F.; Zivkovic, S. Laser-induced plasma as a method for the metallic materials hardness estimation: An alternative approach. Plasma Chem. Plasma Process. 2020, 40, 499–510. [Google Scholar] [CrossRef]
  20. Sattar, H.; Ran, H.; Ding, W.; Imran, M.; Amir, M.; Ding, H. An approach of stand-off measuring hardness of tungsten heavy alloys using LIBS. Appl. Phys. A 2020, 126, 5. [Google Scholar] [CrossRef]
  21. Cowpe, J.; Moorehead, R.; Moser, D.; Astin, J.; Karthikeyan, S.; Kilcoyne, S.; Crofts, G.; Pilkington, R. Hardness determination of bio-ceramics using laser-induced breakdown spectroscopy. Spectrochim. Acta Part B At. Spectrosc. 2011, 66, 290–294. [Google Scholar] [CrossRef] [Green Version]
  22. Abdulmadjid, S.N.; Pardede, M.; Suyanto, H.; Ramli, M.; Lahna, K.; Marpaung, A.M.; Hedwig, R.; Lie, Z.S.; Kurniawan, D.P.; Kurniawan, K.H.; et al. Evidence of feasible hardness test on Mars using ratio of ionic/neutral emission intensities measured with laser-induced breakdown spectroscopy in low pressure CO2 ambient gas. J. Appl. Phys. 2016, 119, 163304. [Google Scholar] [CrossRef]
  23. Marston, J.O.; Pacheco-Vázquez, F. Millimetric granular craters from pulsed laser ablation. Phys. Rev. E 2019, 99, 030901. [Google Scholar] [CrossRef] [PubMed]
  24. Harilal, S.S.; Diwakar, P.K.; Hassanein, A. Electron-ion relaxation time dependent signal enhancement in ultrafast double-pulse laser-induced breakdown spectroscopy. Appl. Phys. Lett. 2013, 103, 041102. [Google Scholar] [CrossRef]
  25. Hafez, M.A.; Khedr, M.A.; Elaksher, F.F.; Gamal, Y.E. Characteristics of Cu plasma produced by a laser interaction with a solid target. Plasma Sources Sci. Technol. 2003, 12, 185–198. [Google Scholar] [CrossRef]
  26. Fernandez, A.; Mao, X.L.; Chan, W.T.; Shannon, M.A.; Russo, R.E. Correlation of spectral emission intensity in the inductively coupled plasma and laser-induced plasma during laser ablation of solid samples. Anal. Chem. 1995, 67, 2444–2450. [Google Scholar] [CrossRef]
  27. Zorba, V.; Mao, X.; Russo, R.E. Femtosecond laser induced breakdown spectroscopy of Cu at the micron/sub-micron scale. Spectrochim. Acta Part B At. Spectrosc. 2015, 113, 37–42. [Google Scholar] [CrossRef] [Green Version]
  28. Patel, D.N.; Pandey, P.K.; Thareja, R.K. Stoichiometric investigations of laser-ablated brass plasma. Appl. Opt. 2012, 51, B192–B200. [Google Scholar] [CrossRef]
  29. Cheng, D.; Zhu, H.; Ke, L. Investigation of plasma spectra during selective laser micro sintering Cu-based metal powder. Rapid Prototyp. J. 2013, 19, 373–382. [Google Scholar] [CrossRef]
  30. Yu, L.; Lu, J.; Chen, W.; Wu, G.; Shen, K.; Feng, W. Analysis of pulverized coal by laser-induced breakdown spectroscopy. Plasma Sci. Technol. 2005, 7, 3041–3044. [Google Scholar]
Figure 1. (a) Spectra recorded in the wavelength range of 508–524 nm for the nine RPG samples. (b) Intensities of Cu I lines at 510.6, 515.3, and 521.8 nm as a function of the grain median diameter. Error bars represent the standard deviation of 6 independent measurements.
Chemosensors 10 00144 g001
Figure 2. (a) Typical Stark broadening profile of Cu I line at 510.6 nm; red line is the Lorentzian fitting. (b) Electron density as a function of the grain median diameter; error bars represent the standard deviation of 6 independent measurements; red line is the exponential fitting, R2 = 0.97.
Chemosensors 10 00144 g002
Figure 3. Plasma temperature as a function of the grain median diameter. Error bars represent the standard deviation of 6 independent measurements. Red line is the linear fitting, R2 = 0.95.
Chemosensors 10 00144 g003
Figure 4. Intensity ratio of Cu I 521.8 nm to Cu I 510.6 nm and plasma temperature as a function of the grain median diameter. Error bars represent the standard deviation of 6 independent measurements and red lines are the linear fittings.
Chemosensors 10 00144 g004
Table 1. Characteristic diameters for the sieved copper microspheres used in this study. All values stated in μm. d 10 , the portion of microspheres with diameters smaller than this value is 10%; d 50 , the portions of microspheres with diameters smaller and larger than this value are 50%, also known as the median diameter. d 90 , the portion of microspheres with diameters below this value is 90%.
Sample ID d 10 d 50 d 90
S1435365
S2597292
S37286101
S477100123
S591113141
S6123145185
S7140176212
S8197245215
S9278357446
Table 2. List of the three analytical lines chosen in this study and corresponding spectroscopic parameters.
Wavelength
λ (nm)
TransitionTransition Probability
Aij (s−1)
Lower Level Energy Ei (eV)Upper Level Energy Ej (eV)Statistical Weight
gi, gj
510.63d94s2–3d10(1S)4p2.0 × 1061.3893.8176, 4
515.33d10(1S)4p–3d10(1S)4d6.0 × 1073.7866.1912, 4
521.83d10(1S)4p–3d10(1S)4d7.5 × 1073.8176.1924, 6
Publisher’s Note: MDPI stays neutral with regard to jurisdictional claims in published maps and institutional affiliations.

