Article

Phage Display Affibodies Combined with AuNPs@Ru(bpy)32+ for Ultra-Sensitive Electrochemiluminescence Detection of Abrin

State Key Laboratory of NBC Protection for Civilian, Beijing 102205, China
*
Author to whom correspondence should be addressed.
Submission received: 21 April 2022 / Revised: 10 May 2022 / Accepted: 12 May 2022 / Published: 13 May 2022

Abstract

:
Abrin is a cytotoxin with strong lethality, which is a serious threat to human health and public safety, and thus, highly sensitive detection methods are urgently needed. The phage display affibody has two major modules, among which, the affibody fragment, with small molecular weight, high affinity and easy preparation, can be used for the specific recognition of the target, and the phage shell, with numerous protein copies, can be used as a carrier for the massive enrichment of signal molecules, and thus is particularly suitable as a sensitive probe for signal amplification in high-sensitivity biosensors. In this study, with antibody-coated magnetic microspheres as capture probes, Ru(bpy)32+ and biotin dual-labeled phage display affibodies as the specific signal probes and AuNPs@Ru(bpy)32+ (Ru(bpy)32+-coated gold nanoparticles) as the signal amplification nanomaterials, a new electrochemiluminescence (ECL) biosensor with a four-level sandwich structure of “magnetic capture probe-abrin-phage display affibody-AuNPs@Ru(bpy)32+” was constructed for abrin detection. In this detection mode, AuNPs@Ru(bpy)32+, a gold nanocomposite prepared rapidly via electrical interaction, contained an extremely high density of signal molecules, and the phage display affibodies with powerful loading capacity were not only labeled with Ru(bpy)32+, but also enriched with AuNPs@Ru(bpy)32+ in large amounts. These designs greatly improved the detection capability of the sensor, ultimately achieving the ultra-sensitive detection of abrin. The limit of detection (LOD) was 4.1 fg/mL (3δ/S), and the quantification range was from 5 fg/mL to 5 pg/mL. The sensor had good reproducibility and specificity and performed well in the test of simulated samples. This study expanded the application of affibodies in the field of biosensing and also deeply explored the signal amplification potential of phage display technology, which is of high value for the construction of simple and efficient sensors with high sensitivity.

1. Introduction

Abrin, extracted from the seeds of Abrus precatorius, is one of the most dangerous lethal biotoxins [1,2,3]. It may not only cause accidental harm to human bodies, but can also be used to commit murders and terrorist attacks, posing a serious threat to the public safety of society [4,5]. Like most protein toxins, abrin is colorless, relatively stable and without specific elements and chemical groups, thus difficult to identify with general physical, chemical and biochemical methods, so there is an urgent need to develop accurate and sensitive detection methods. With electrical signal as the input signal and optical signal as the detection signal, the electrochemiluminescence biosensor has the remarkable features of low background interference, high signal resolution, good stability, high sensitivity, controllability and high detection efficiency and is a good choice for the detection of abrin [6,7]. Compared with other biosensors or bioassays, such as ELISA [8,9,10], fluorescence [11,12,13], immunochromatography [14], piezoelectricity [15], Raman scattering [16], mass spectrometry [17] and radioimmunoassay [18], it has shown higher sensitivity in abrin detection and is a very promising biosensing method.
An affibody, composed of 58 residues, is a three-helical scaffold protein derived from the B domain in protein A of Staphylococcus [19,20]. As a new class of affinity ligands, affibodies are now commonly used in medical research such as in vivo imaging and tumor therapy [21,22,23,24] because of good biocompatibility and tissue penetration, but rarely play an important role in biosensors, despite their good specificity and affinity. Traditional biosensors mostly use antibodies as sensitive probes, but antibodies have large molecular weights, multi-domain structures and their activities often depend on disulfide bonds and glycosylation, so they are thermally unstable, susceptible to pH and other factors and difficult to preserve for a long time. In contrast, affibodies have good biological, chemical and thermal stability and are easy to produce, modify and preserve, making them very suitable as molecular recognition components for biosensors. Affibodies are often prepared using phage display techniques [25,26]. By introducing an affibody gene library into the gene region encoding phage capsid proteins, target affibody genes, as well as phages containing the corresponding genes and affibody fragments, can be obtained after protein fusion expression and affinity elution. On this basis, subsequent sustainable preparation can only be made by culturing the corresponding engineered bacteria and phages, which greatly reduces the difficulty of acquisition and usage cost. A phage display affibody contains both the affinity fragments and the phage capsid; the former can be used to recognize and bind the target, while the latter can provide the signal marker sites, so it naturally has the property of specific signal amplification probe, especially suitable for the construction of highly sensitive biosensors.
We constructed a simple ECL biosensor based on phage display affibodies and successfully achieved the highly sensitive detection of abrin [27]. The basic structure of this sensor was “antibody-abrin-phage display affibody”, and M13 phages were all labeled with Ru(bpy)32+. Although the LOD was as low as 5 pg/mL, we still believe that the signal amplification effect of phage display technology in bioassays has not been fully utilized, and huge phage capsids can still be linked with the higher density of signal molecules to achieve further sensing signal amplification. Based on this idea, a new four-level sensing structure, “antibody-abrin-phage display affinity-nanomaterial”, can be established, with the basic principle of replacing individual signal molecules with nanomaterials with higher Ru(bpy)32+ density, which are attached to the phage surface as new signal monomers. This means that the same phage epitope can be enriched with more signal molecules, which would greatly increase the upper limit of signal sensitization of phage display technology.
A good choice for the nanomaterial is gold nanoparticles (AuNPs), which are fast and simple to prepare, biocompatible, with surface effects and catalytic activity, as well as good optical, thermal, and electrical properties, and are extremely widely used in biosensors [28,29,30,31]. AuNPs are usually prepared in the form of colloidal gold and are commonly used in immunochromatographic techniques [32,33]. AuNPs prepared via the reduction of sodium citrate are negatively charged, while ECL luminophores Ru(bpy)32+ are strongly positively charged, so they can be rapidly combined by electro-adsorption to form the composites AuNPs@Ru(bpy)32+. Theoretically, a sufficient amount of Ru(bpy)32+ can cover all sites on the surface of AuNPs, and the strong electrical interaction may cause a certain degree of agglomeration to form nanogold aggregates with larger particle size, which is beneficial to further enhance the sensitivity of the sensor.
In this study, Ru(bpy)32+ and biotin dual-labeled phage display affibodies were used as the recognition probes and nanomaterial carriers, AuNPs@Ru(bpy)32+ was used as the signal enrichment nanomaterial, which was combined with streptavidin to be loaded on the phage surface through biotin–streptavidin interaction, and a new ECL sensing system based on a four-level sandwich structure of “magnetic capture probe-toxin-phage display affibody-AuNPs@Ru(bpy)32+” was constructed to achieve the ultra-sensitive detection of toxins. In addition, the detection platform for this study was a portable electrochemiluminescence sensor based on screen-printed electrodes (Figure S1, refer to Supplementary Materials for details of screen-printed electrodes and sensors), which can also provide a reference for in situ detection.

2. Materials and Methods

2.1. Reagents and Instruments

Reagents, materials and instruments used in the bioassay are detailed in the Supplementary Materials.

2.2. Experimental Methods

2.2.1. Preparation of Magnetic Capture Probes

The magnetic capture probes were prepared via specific high-affinity interaction between protein A and the Fc domain of antibody. Protein-A-coated magnetic microspheres (30 mg/mL) were used as the carriers and incubated with the polyclonal antibodies of abrin in PBST (0.01 mol/L PBS, 0.02% Tween-20, pH = 7.4). The binding capacity of protein-A-coated magnetic microspheres is approximately 8 μg IgG/mg beads according to the manufacturer. To ensure that all sites on the magnetic bead were covered, five times the saturation binding amount of antibodies was used, and the reaction system was slowly rotated in a vertical rotator for 40 min at room temperature. After the binding reaction was completed, the prepared magnetic capture probes were washed three times and finally diluted to 6 mg/mL with 0.01 mol/L PBST (0.02% Tween-20, pH = 7.4) and stored at 4 °C for use. Magnetic microspheres have excellent separation efficiency and can complete the magnetic separation process within 15 s (Figure S2 in Supplementary Materials). In addition, the UV-Vis absorbance of the antibody solution before and after being adsorped by magnetic microspheres was characterized (Figure S3 in Supplementary Materials), and a significant difference in A280 (absorbance at 280 nm, a typical characteristic absorption peak of proteins) could be found, indicating that protein-A-coated magnetic microspheres can bind antibodies and the magnetic capture probes were prepared successfully.

2.2.2. Preparation of Dual-Labeled Phage Display Affibodies

The phage display affibodies used in the experiments were labeled with both Ru(bpy)32+ and biotin and were therefore termed dual-labeled phage display affibodies. We referred to Liu et al. [6] and made some changes; the reaction system consisted of biotin-d(PEG)4-NHS ester (4 mg/mL), Ru(bpy)32+-NHS ester (1 mg/mL), carbonate buffer (0.05 mol/L, pH = 9.6) and DMF, and the ratio of biotin to Ru(bpy)32+ needed to be explored and optimized (see Optimization of experimental conditions for details). The phage display affibodies were added to the reaction system and rotated vertically for 12 h at room temperature protected from light. The mixture was added into the treated dialysis bags and placed in dialysis solution (0.01 mol/L PBS, pH = 7.4) at 4 °C for 24 h. Finally, the purified dual-labeled phage display affibodies were resuspended in PBS (0.01 mol/L, pH = 7.4) and stored at 4 °C for use.

2.2.3. Preparation of AuNPs@Ru(bpy)32+-SA (Streptavidin)

Firstly, the AuNP suspension (colloidal gold) was prepared using the microwave method [34]: HAuCl4 solution (0.01%, 100 mL) was added into a clean beaker which was washed repeatedly to ensure there were no impurities. Following the successive steps of boiling in a microwave oven for 3 min, the addition of 3 mL trisodium citrate solution (1%) and re-boiling for 3 min, the solution turned from light yellow to a bright burgundy color, and AuNPs were prepared successfully. Then, deionized water was added to reconstitute 100 mL for subsequent use.
Secondly, an appropriate amount of Ru(bpy)32+ -NHS ester (1 mg/mL) was added to 60 mL of colloidal gold (see Optimization of experimental conditions for details), and the mixed solution immediately changed to a gray-blue color. After being spun for 10 min and centrifuged for 30 min at 7000× g, the supernatant was discarded, and 5 mL of carbonate buffer (0.05 mol/L, pH = 9.6) was added to resuspend the precipitate AuNPs@Ru(bpy)32+ and sonicated for 10 min. Then, excess streptavidin (SA, 1 mg/mL, 500 μL) and moderate DMF (60 μL) were added to the suspension and rotated vertically overnight at 4 °C. The next day, the suspension was sonicated for 5 min, and 1 mL of 2% bovine serum albumin (BSA) solution was added directly to block the remaining reactive sites for 2 h at room temperature. Finally, following the successive steps of centrifugation (6000 g/10 min), sonication and cleaning with 0.01 mol/L PBST (pH = 7.4, 0.1% Tween-20), the gold nanocomposite AuNPs@Ru(bpy)32+-SA was prepared successfully and resuspended in 10 mL of PBS (0.01 mol/L PBS, pH = 7.4), and then stored at 4 °C for use.

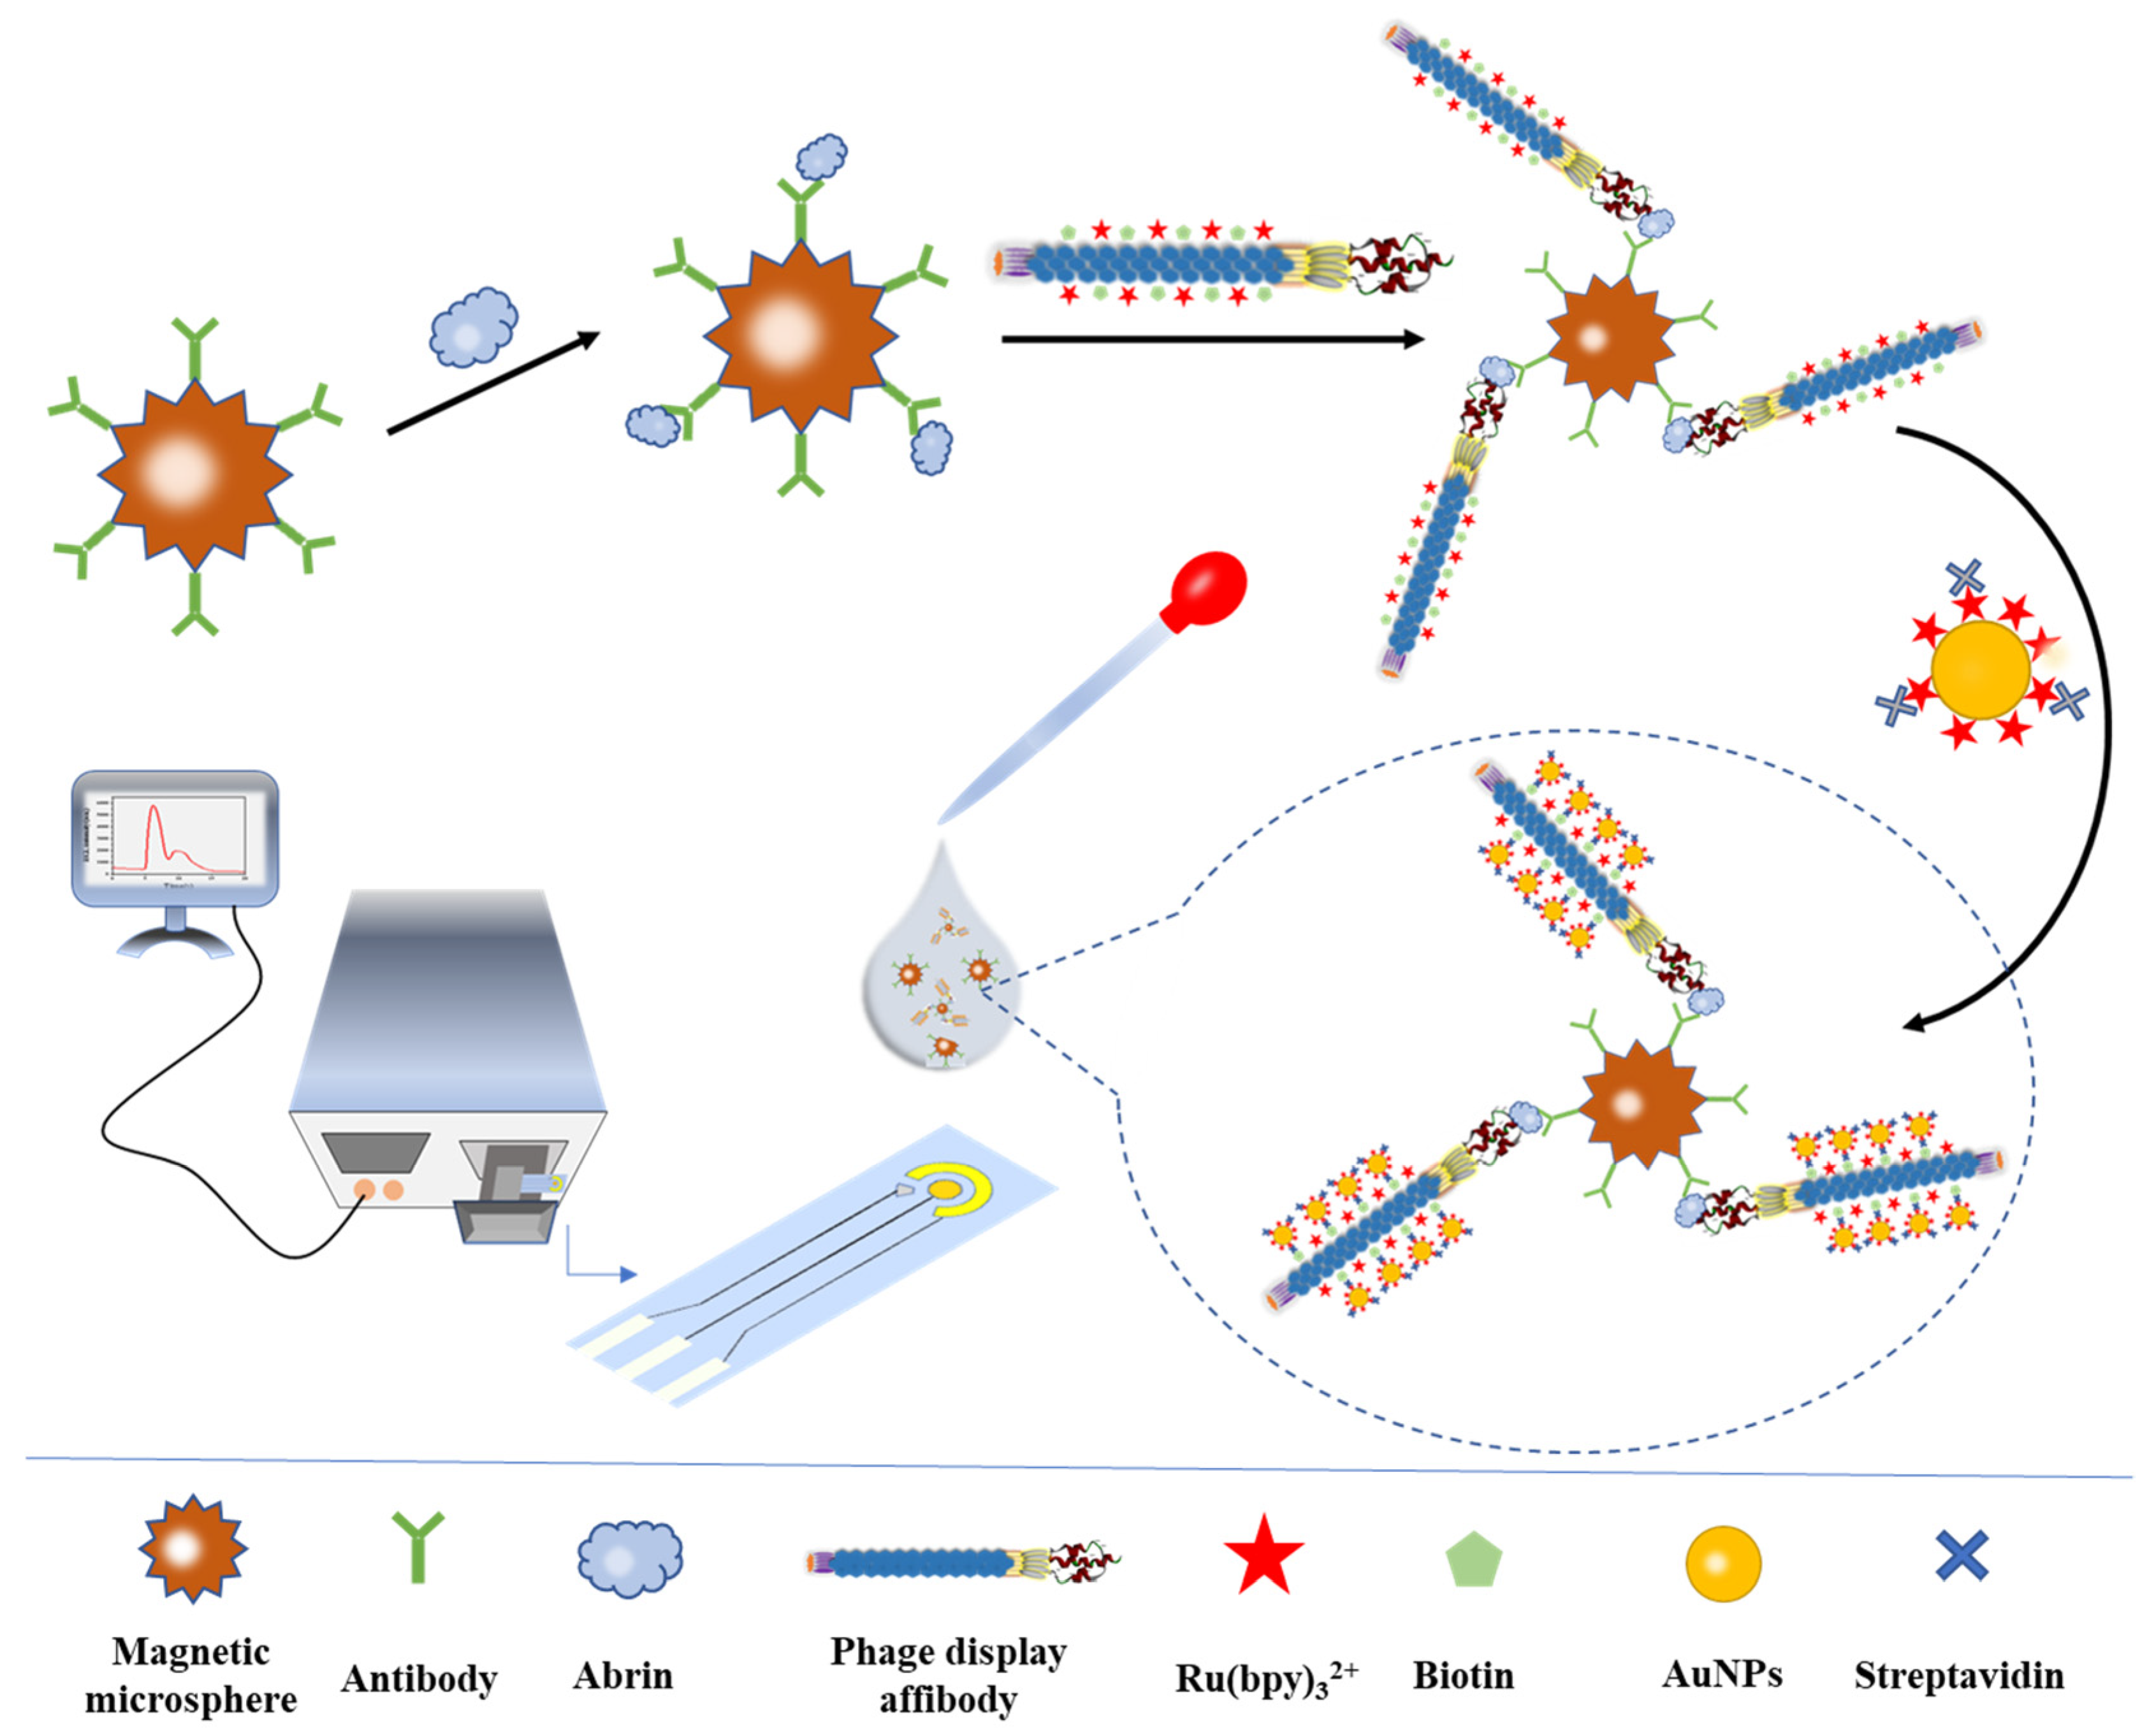
2.2.4. Construction of ECL Biosensor and Detection of Abrin

The first step of the detection process was to capture the toxin: magnetic capture probes (50 μL) and different concentrations of abrin solution (400 μL) were mixed and rotated vertically at room temperature for 1 h. After the toxin was captured, the magnetic microspheres were washed three times with PBST (0.01 mol/L PBS, 0.05% Tween-20). Then, 400 μL of dual-labeled phage display affibodies (about 1011 PFU/mL) was added and continued to rotate vertically for 1 h at room temperature [27]. Theoretically, the sandwich structure of the “magnetic capture probe-abrin-phage display affibody” was formed at this point.
Immediately after being washed three times with PBST (0.01 mol/L PBS, 0.05% Tween-20), the critical step of signal amplification was performed: 400 μL of AuNPs@Ru(bpy)32+-SA suspension was added to resuspend the magnetic microspheres and reacted at room temperature for 30 min. After sonication for 1 min, the super-composites composed of the “magnetic capture probe-abrin-phage display affibody-AuNPs@Ru(bpy)32+” structure were washed three times, and 400 μL of Procell solution (TPA as the main component, co-reactive solution) was added for ECL detection. The detection platform was a portable ECL sensor based on screen-printed electrodes. Magnetic microspheres were magnetically adsorbed on the surface of the working electrode, and a photomultiplier tube was located directly above the electrode for the determination of the luminescence signal. The instrument parameters were set as follows: the amplification level was 5, the high voltage of the photomultiplier tube was 700 mV, the cyclic voltammetry voltage was 0.2~1.35 V and the scan rate was 0.1 V/s. The detection process is shown in Scheme 1.

2.2.5. Test of Simulated Samples

In order to investigate the detection effect for simulated samples and the anti-interference ability to complex environmental substances of the constructed ECL biosensor, milk, honey, plasma and pollen samples containing 100 fg/mL abrin were prepared (brief preparation procedure: rabbit plasma, milk, honey and pollen were dispersed in 0.01 mol/L PBS, respectively, and then centrifuged at 2000× g for 5 min. After removing the precipitate, the supernatant was used to prepare simulated samples containing 100 fg/mL abrin) and tested with exactly the same conditions and steps as above, and the recoveries and relative standard deviations (RSDs) were calculated to assess the practicability of the sensor.

3. Results and Discussion

3.1. Optimization of Experimental Conditions

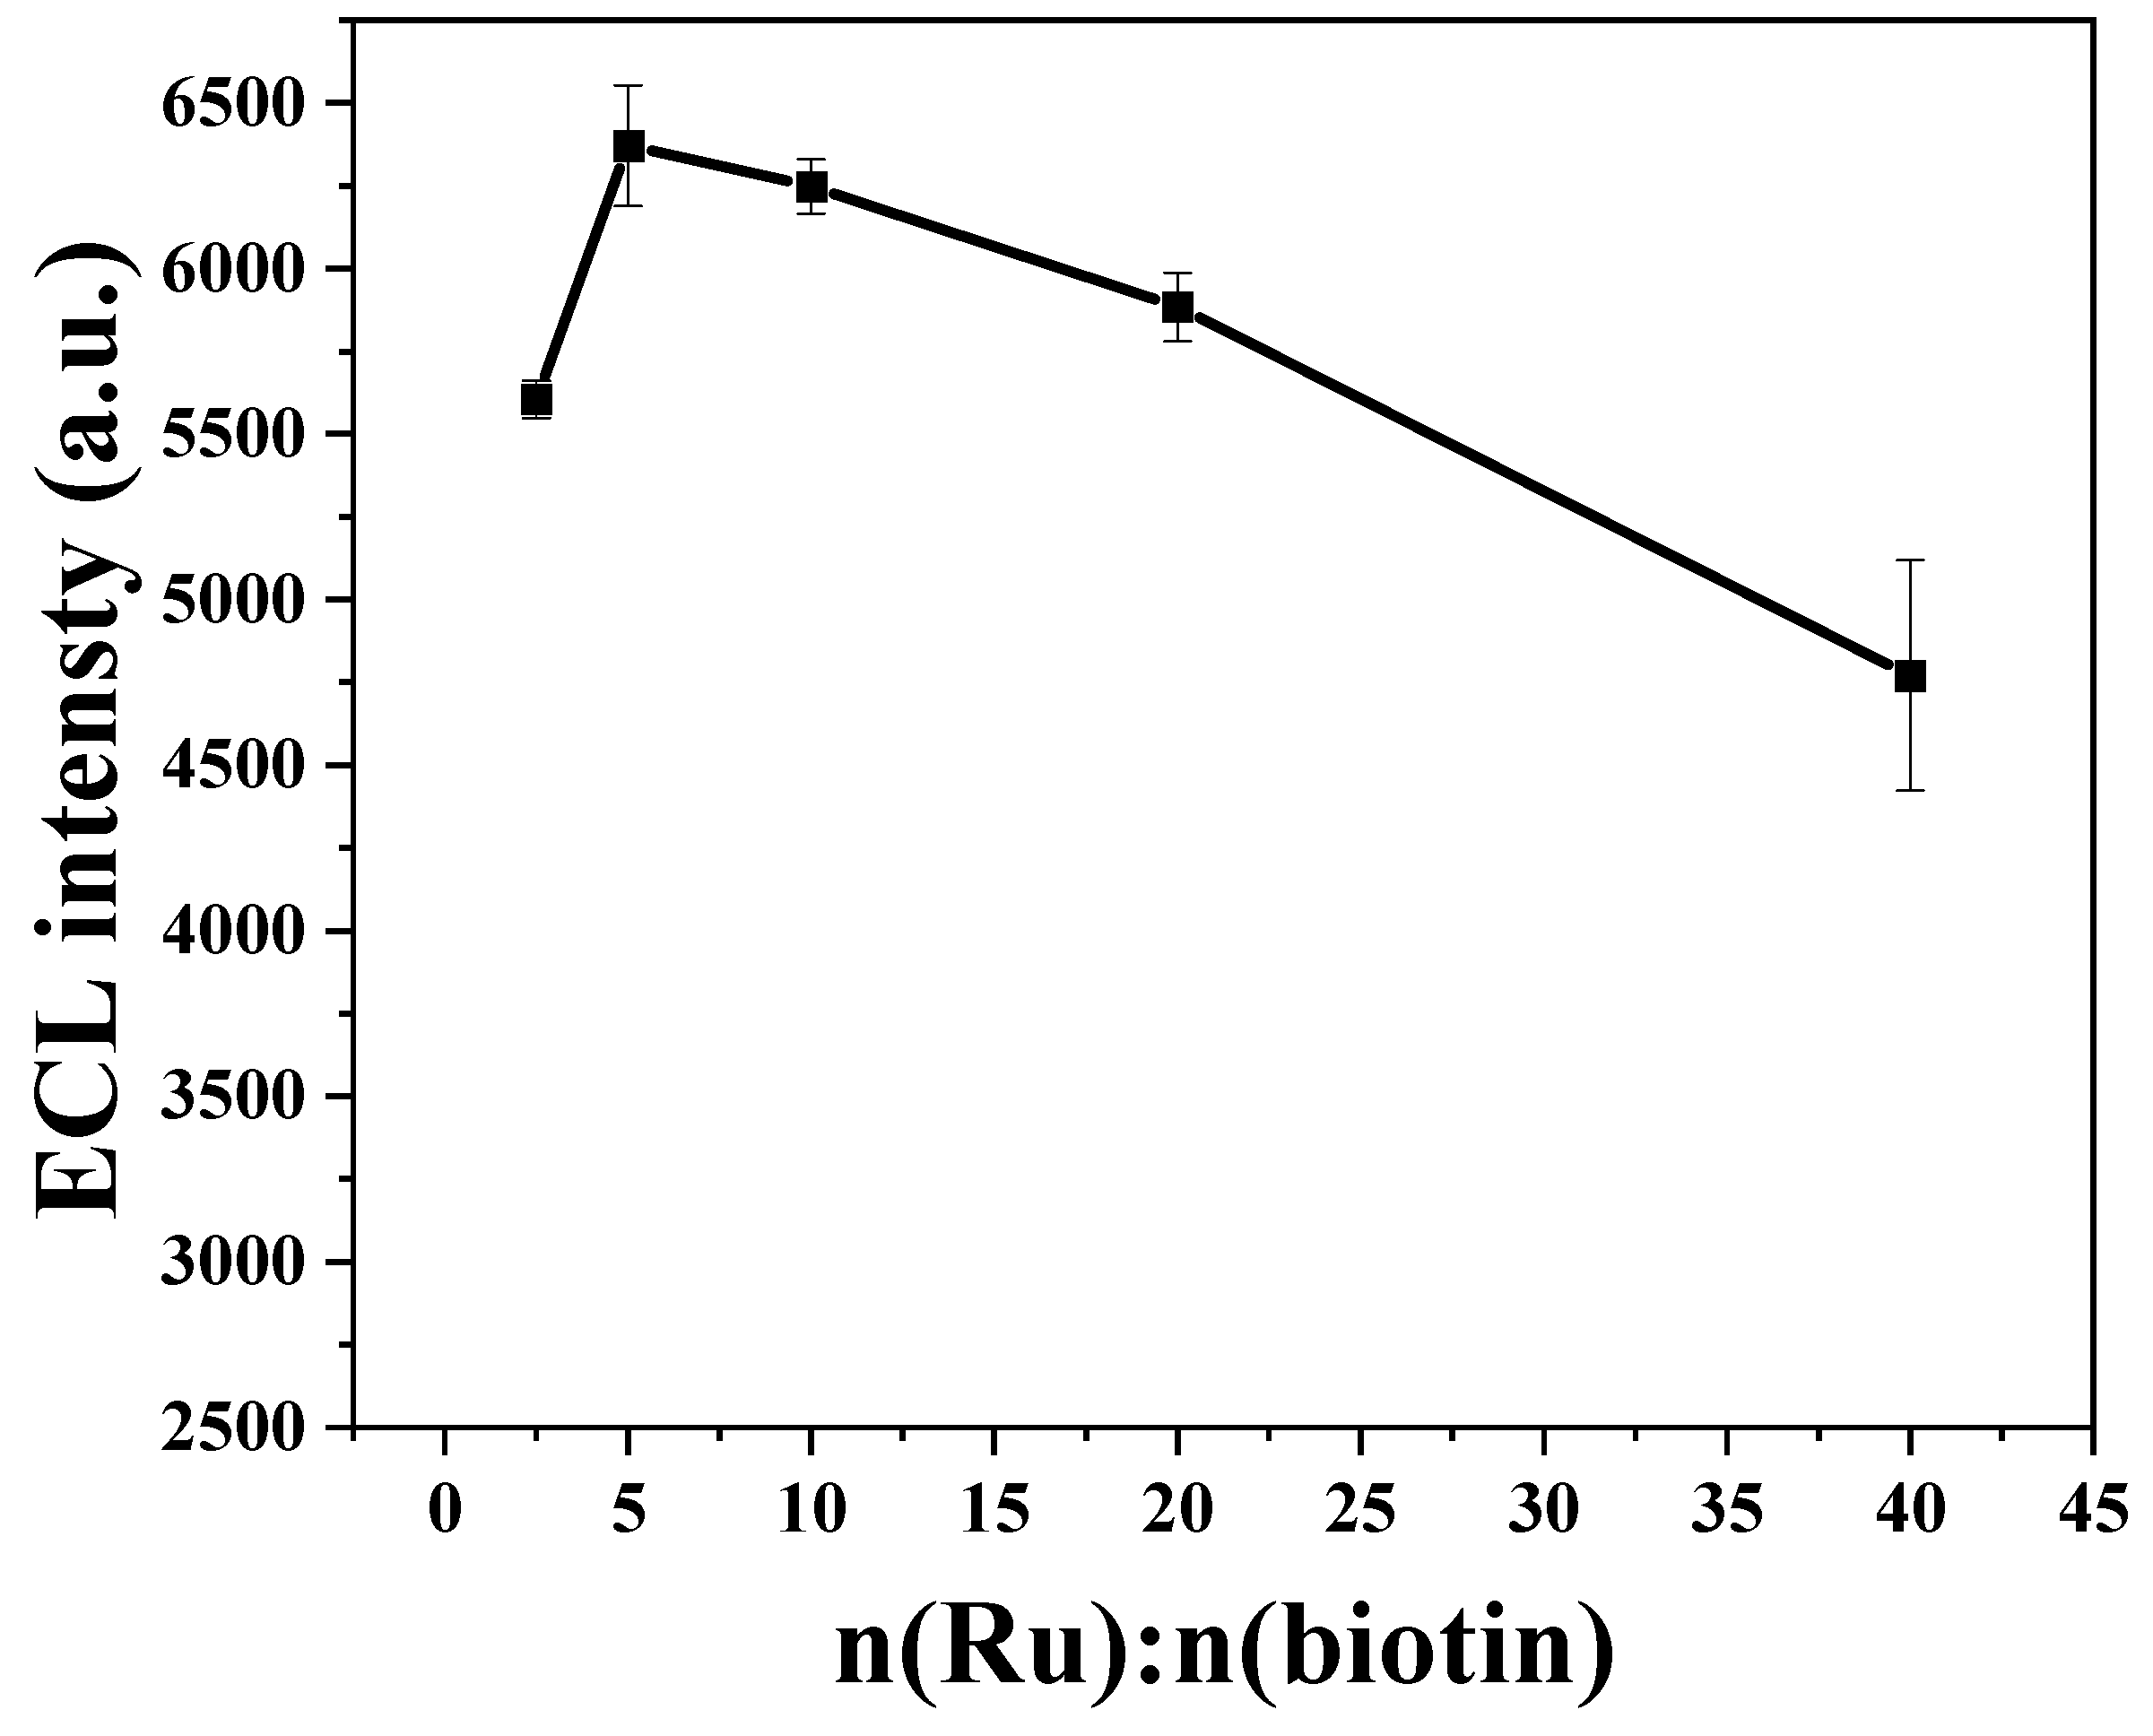
3.1.1. ECL Characterization of and Optimization of Labeling Ratio of Ru(bpy)32+ and Biotin

If M13 phage display affibodies were all labeled with Ru(bpy)32+, the sensor would adopt an “antibody-abrin-phage display affibody” sandwich model (cf. paper [27]), and phages would not further connect to AuNPs@Ru(bpy)32+-SA. If they were all labeled with biotin, and AuNPs@Ru(bpy)32+-SA were attached by biotin–streptavidin interactions, that would work, but obviously, most of the biotin molecules on the phage surface would be unused and wasted due to spatial blocking effects. Therefore, to reduce the waste, the phages can be dual-labeled, where biotin continues to be used to attach gold nanocomposites, while Ru(bpy)32+ provides the primary signal. Theoretically, the dual-labeled phage display affibodies can further improve the sensitivity of a sensor.
Therefore, the labeling ratio of biotin and Ru(bpy)32+ needed to be further explored to optimize the signal amplification efficiency. Based on this idea, different ratios of biotin and Ru(bpy)32+ (molar ratios of 1:40, 1:20, 1:10, 1:5 and 1:2.5, respectively, fixing the amount of Ru(bpy)32+) were mixed with phage display affibodies with the same titer and amount, respectively. After adequate reaction and dialysis, several groups of labeled samples were incubated with streptavidin-coated magnetic microspheres for 30 min to examine the difference in ECL intensity. The principle of this method (Figure S4 in Supplementary Materials) is that the proportion of biotin determines the number of phages bound to the magnetic microspheres at the same time, while the proportion of Ru(bpy)32+ determines the intensity of the ECL signal for the same number of phages. Therefore, this method allows the combined effect of both to be determined. As shown in Figure 1, the strongest ECL response was observed when n(biotin): n(Ru) = 1:5, and therefore, the phage display affibodies used in the sensor were prepared based on this ratio. It should be noted, however, that this value is the ratio of reactants and not the ratio of two molecules linked with phage capsid proteins. This characterization can also demonstrate that the phage display affibodies were labeled with both Ru(bpy)32+ and biotin.

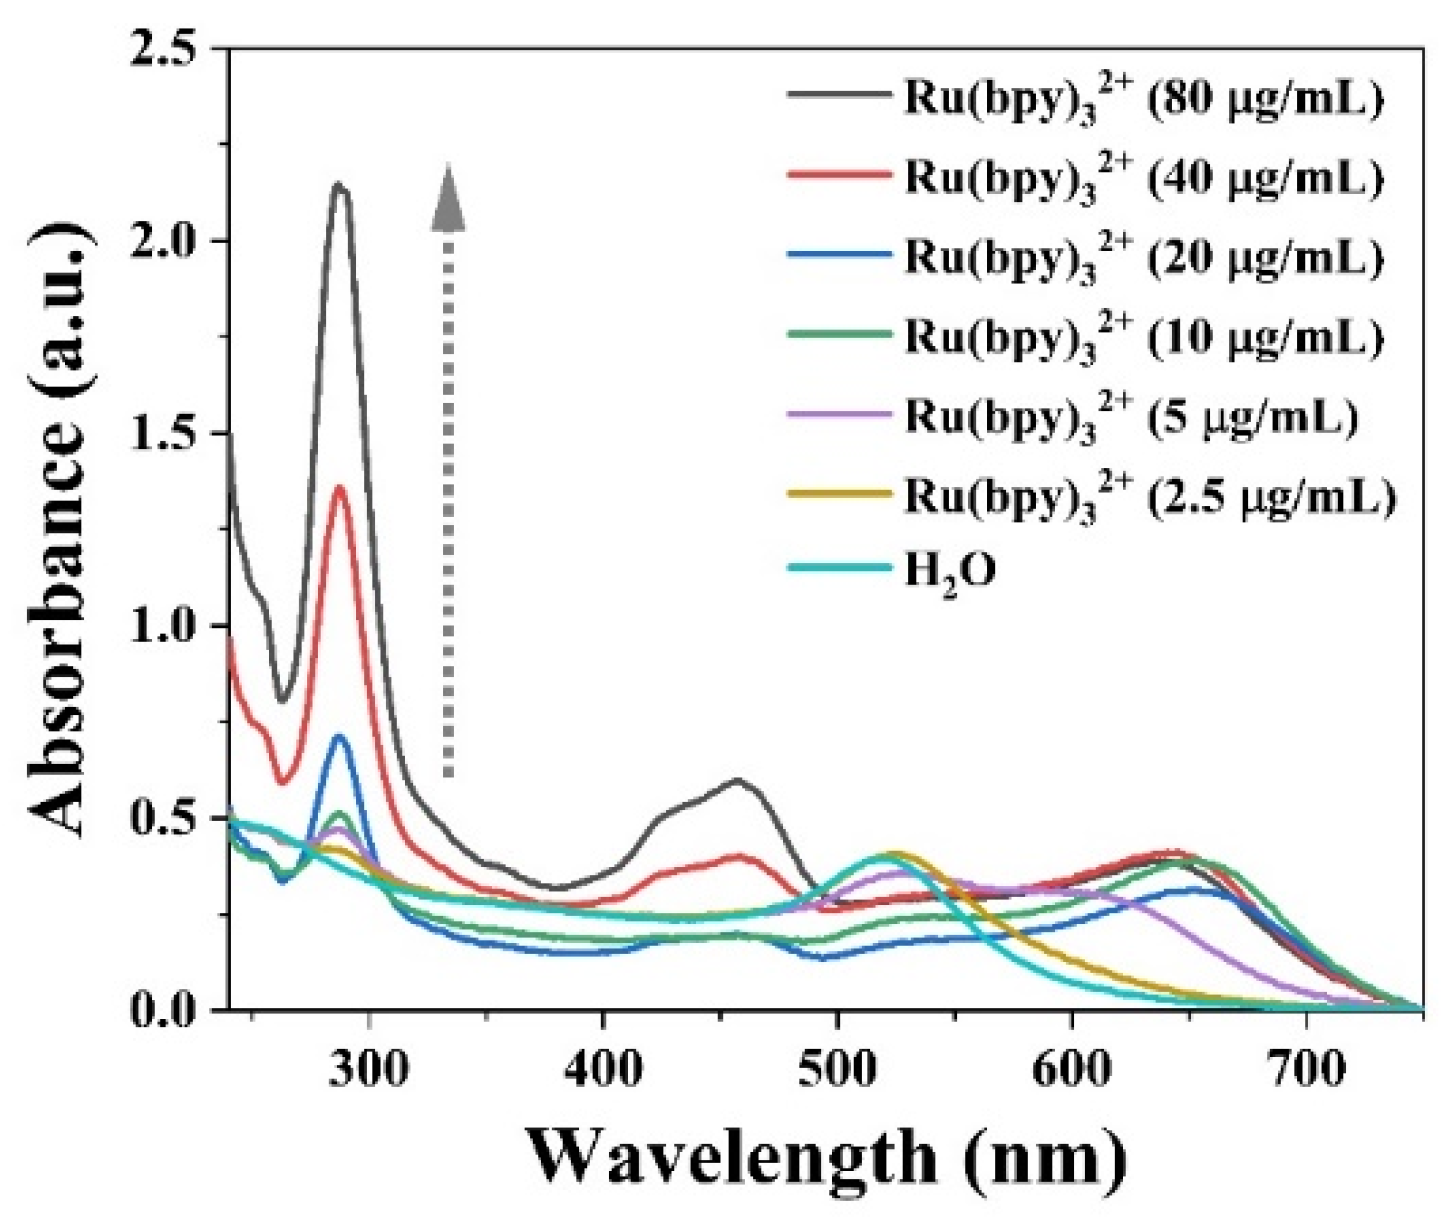
3.1.2. UV-Vis Characterization of the Formation of AuNPs@ Ru(bpy)32+ and Optimization of the Amount of Ru(bpy)32+

In this experiment, AuNPs were prepared using the sodium citrate reduction method, so their surface had a negative charge due to the overlay of citrate. The signal molecule Ru(bpy)32+ had a strong positive charge, so it could bind to AuNPs quickly via electrical interaction. Theoretically, the higher the concentration of Ru(bpy)32+, the more ECL signal molecules can be carried by AuNPs. However, considering the limited surface area and net charge, the adsorption capacity must exist in a saturated state. We prepared different concentrations of Ru(bpy)32+-NHS aqueous solutions and mixed them with colloidal gold to investigate and optimize the amount of Ru(bpy)32+-NHS. After mixing for 5 min, the UV-Vis absorption spectra of each group of mixed samples were measured (Figure 2).
It can be found that there is a characteristic peak at 520 nm, which is the typical absorption peak of AuNPs originating from surface plasmon resonance [35,36]. When the frequency of incident light and the vibration frequency of the conduction band electrons are the same, there is a distinctive characteristic peak in the visible light (510~550 nm) region, and the position of the absorption peak and the particle size of AuNPs have obvious correlation [37]. According to this feature, the increase in particle size will lead to the red-shift of the absorption peak, and the aggregation of AuNPs will also cause a significant color change. With the increase in the concentration of Ru(bpy)32+, the characteristic peak at 520 nm kept decreasing, which means that monodisperse AuNPs were decreasing, and the peak basically disappeared when the concentration was 20 μg/mL. In contrast, the peak gradually shifted red, and a new distinctive peak appeared at about 650 nm, which was the newly formed AuNPs@ Ru(bpy)32+ with the aggregation of AuNPs, and its absorbance value reached stability at the Ru(bpy)32+ concentration of 40 μg/mL. Therefore, this ratio can be chosen for the preparation of AuNPs@ Ru(bpy)32+.

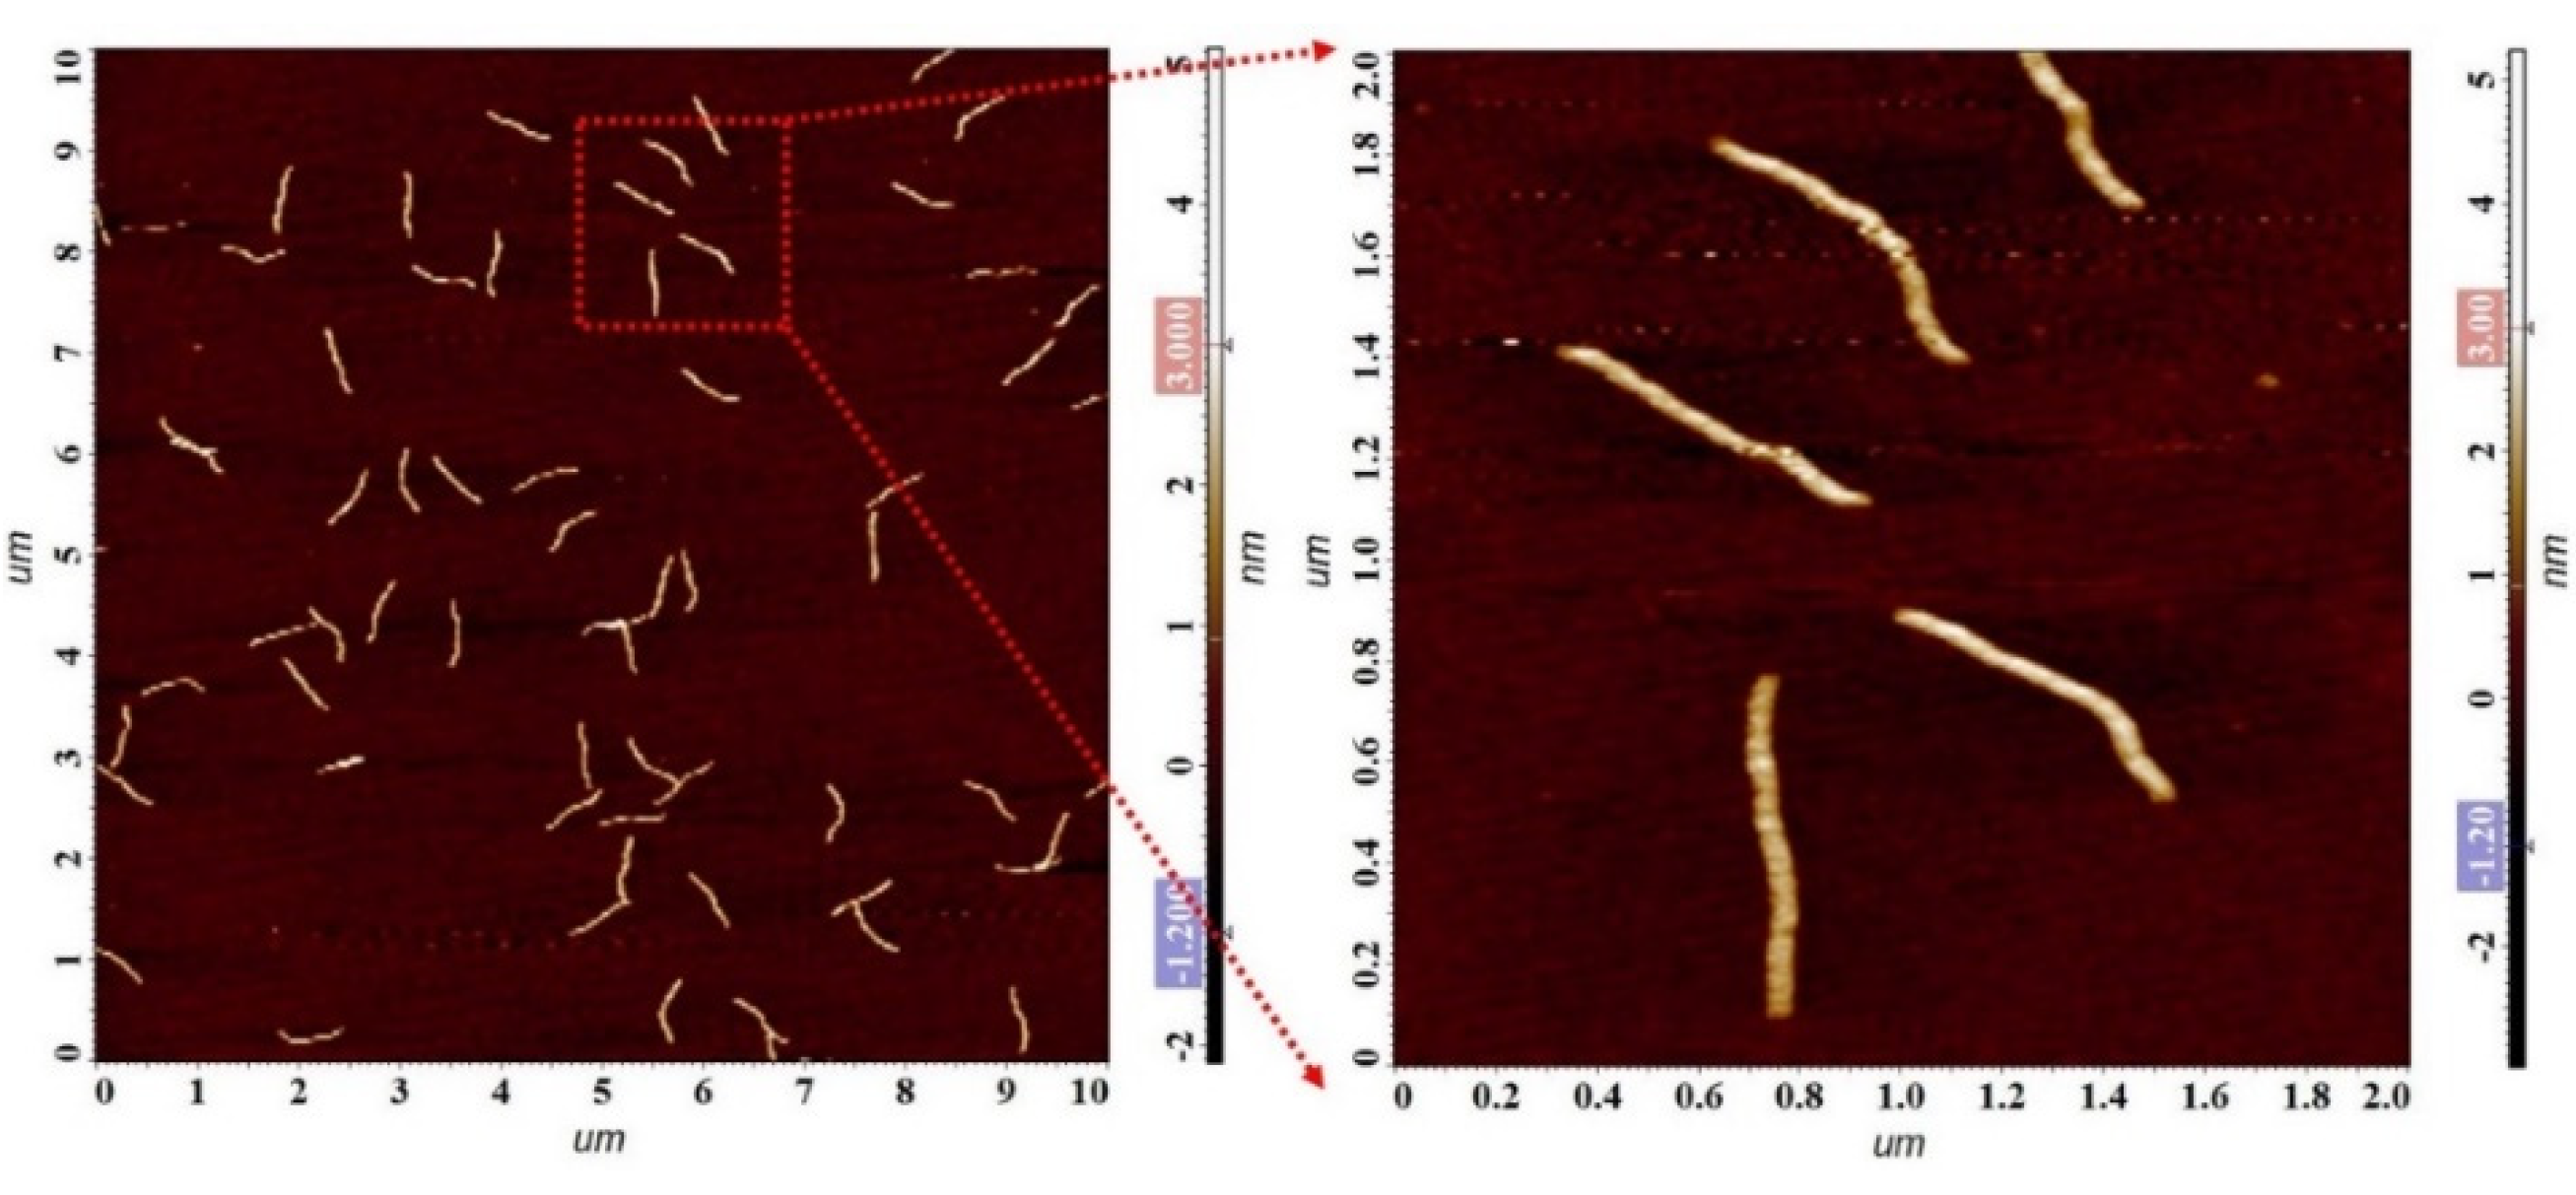
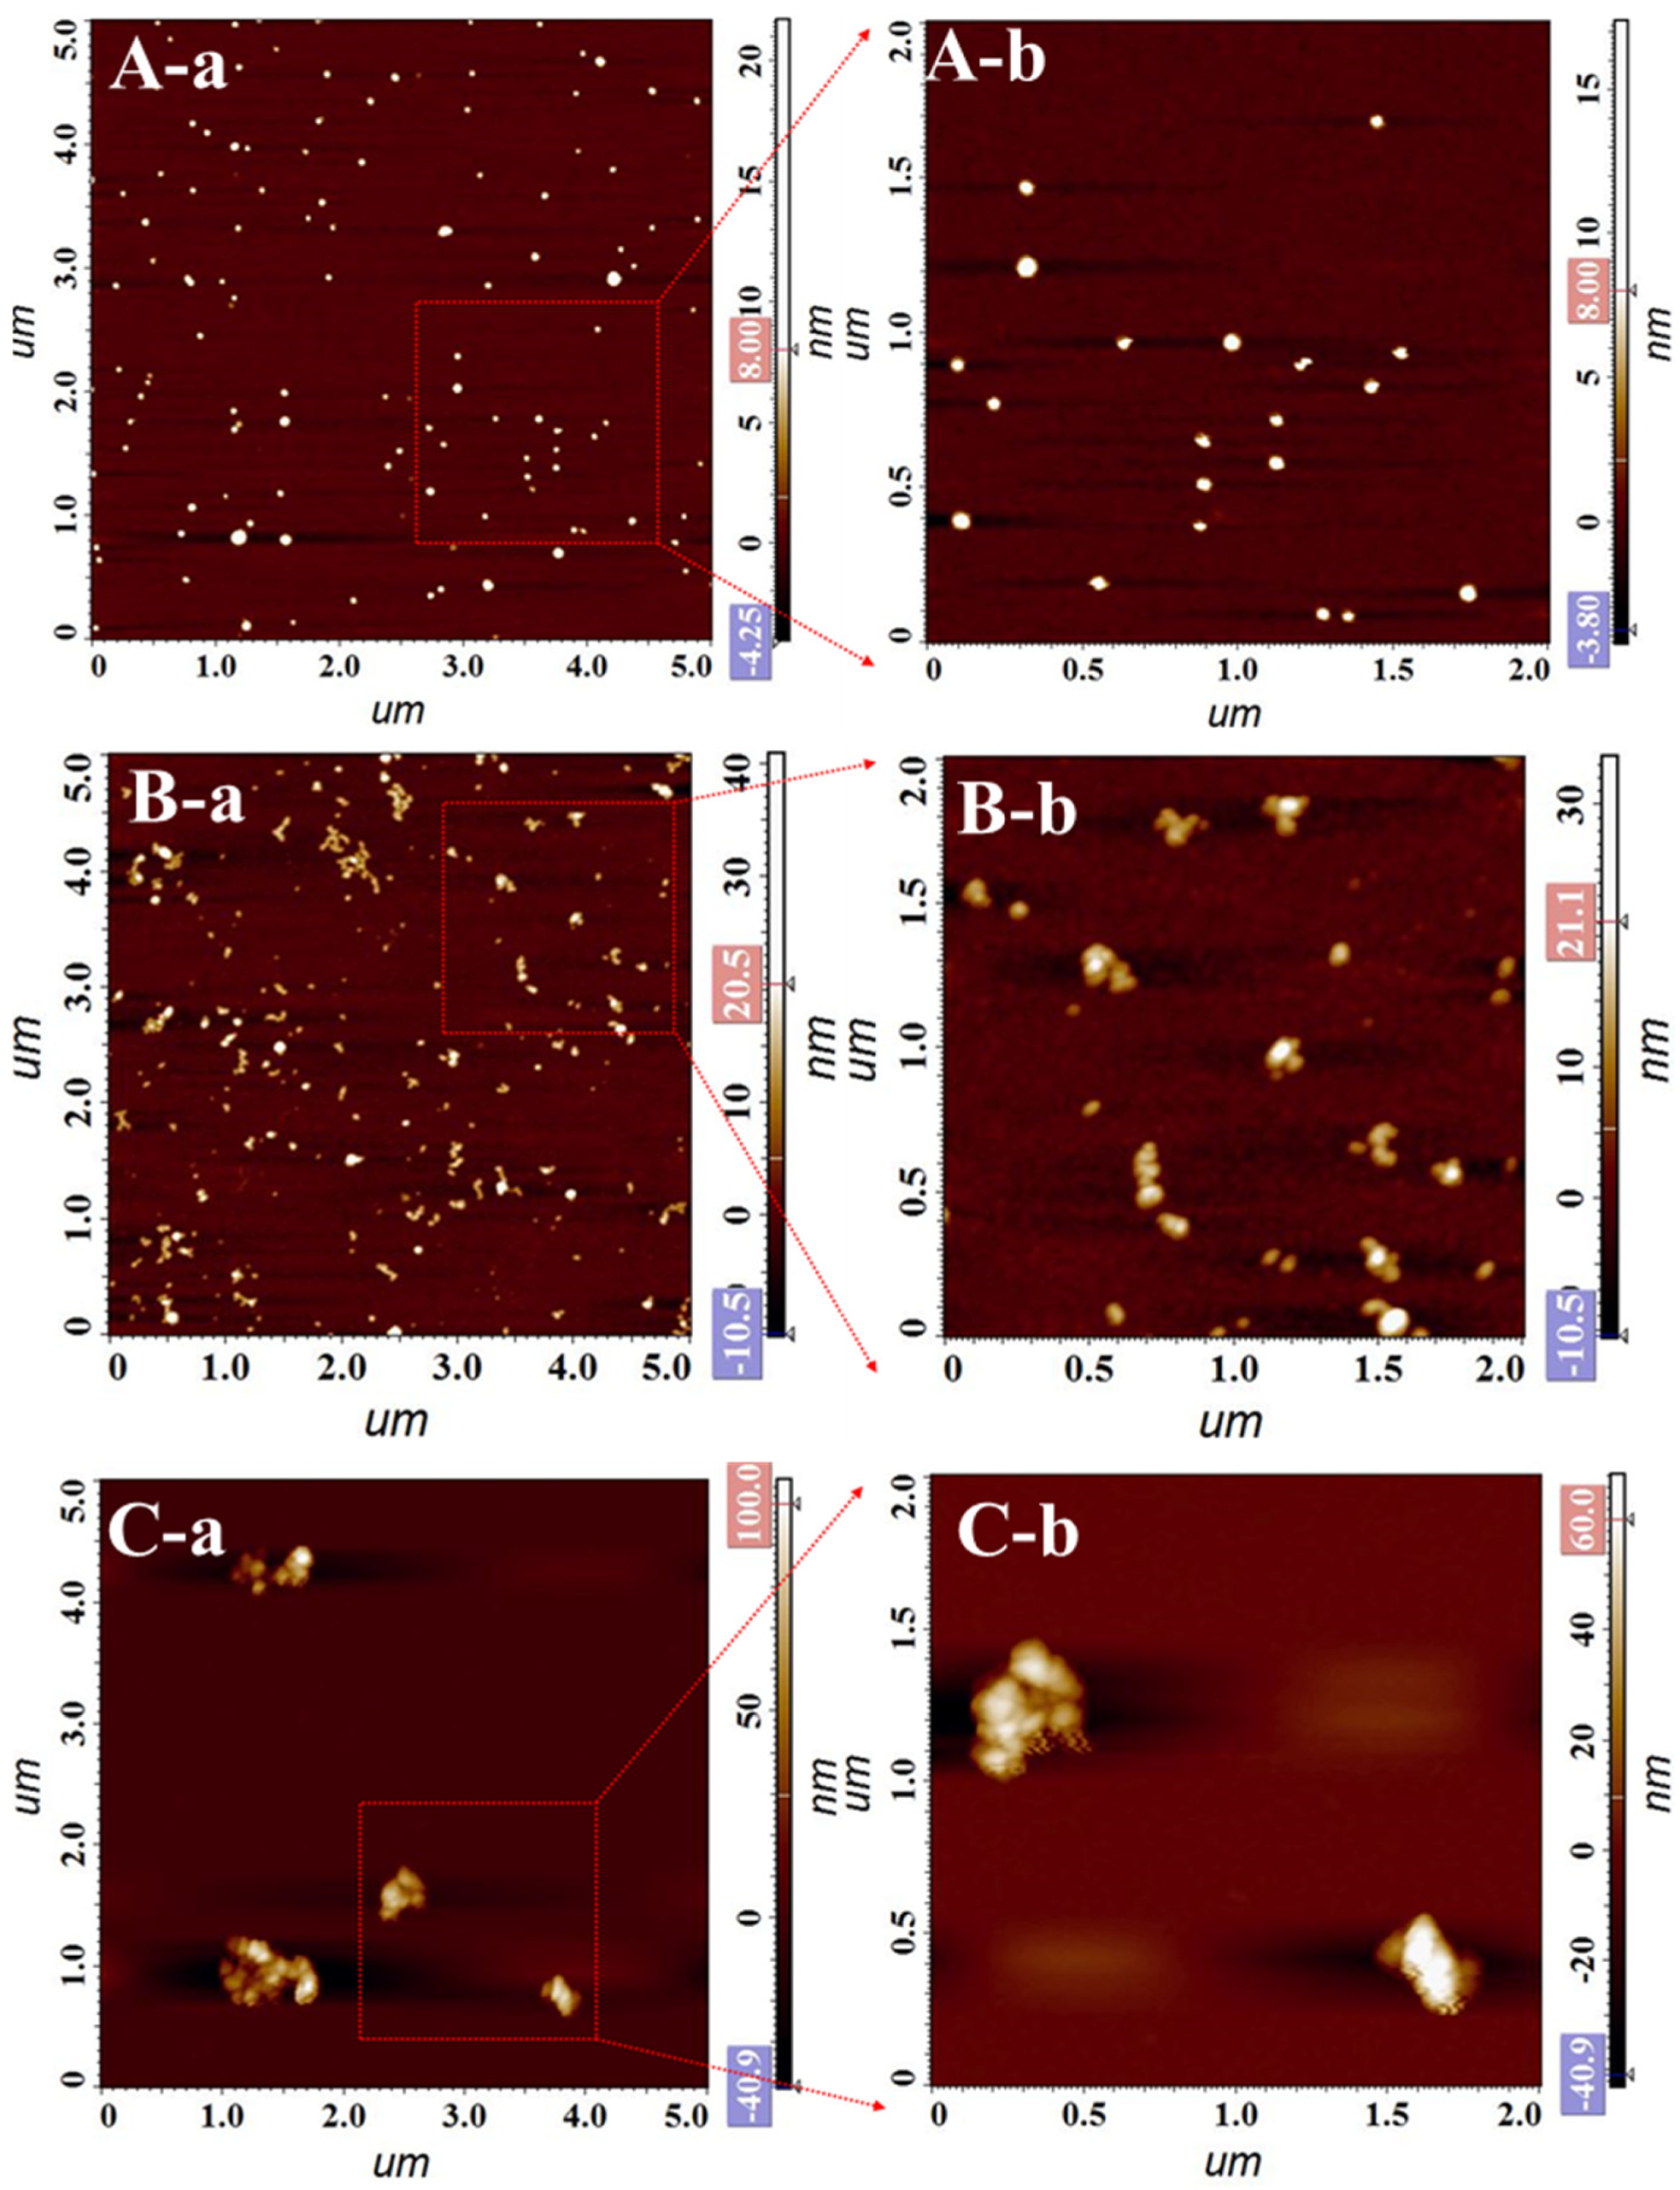
3.2. Characterization of Phage Display Affibodies

M13 phage is a kind of filamentous virus. Due to the destructiveness of high-energy electron flow to biomaterials and the limitation of phage size, an atomic force microscope (AFM) was used to characterize the morphology and structure of phage display affibodies. As shown in Figure 3, M13 phages were evenly adsorbed on the surface of silicon wafer, showing an obvious long, strip-shaped, flexible structure with a length of less than 1 μm and a diameter of less than 10 nm. It should be noted that the affibody fragment is displayed at one end of M13 phage and cannot be captured and shown via AFM images. This invisible segment determines the specific recognition and binding of phage display affibodies to the target, and the visible part of M13 phage in the microscopic image can be used as the carrier of nanomaterials for signal amplification of the ECL biosensor.

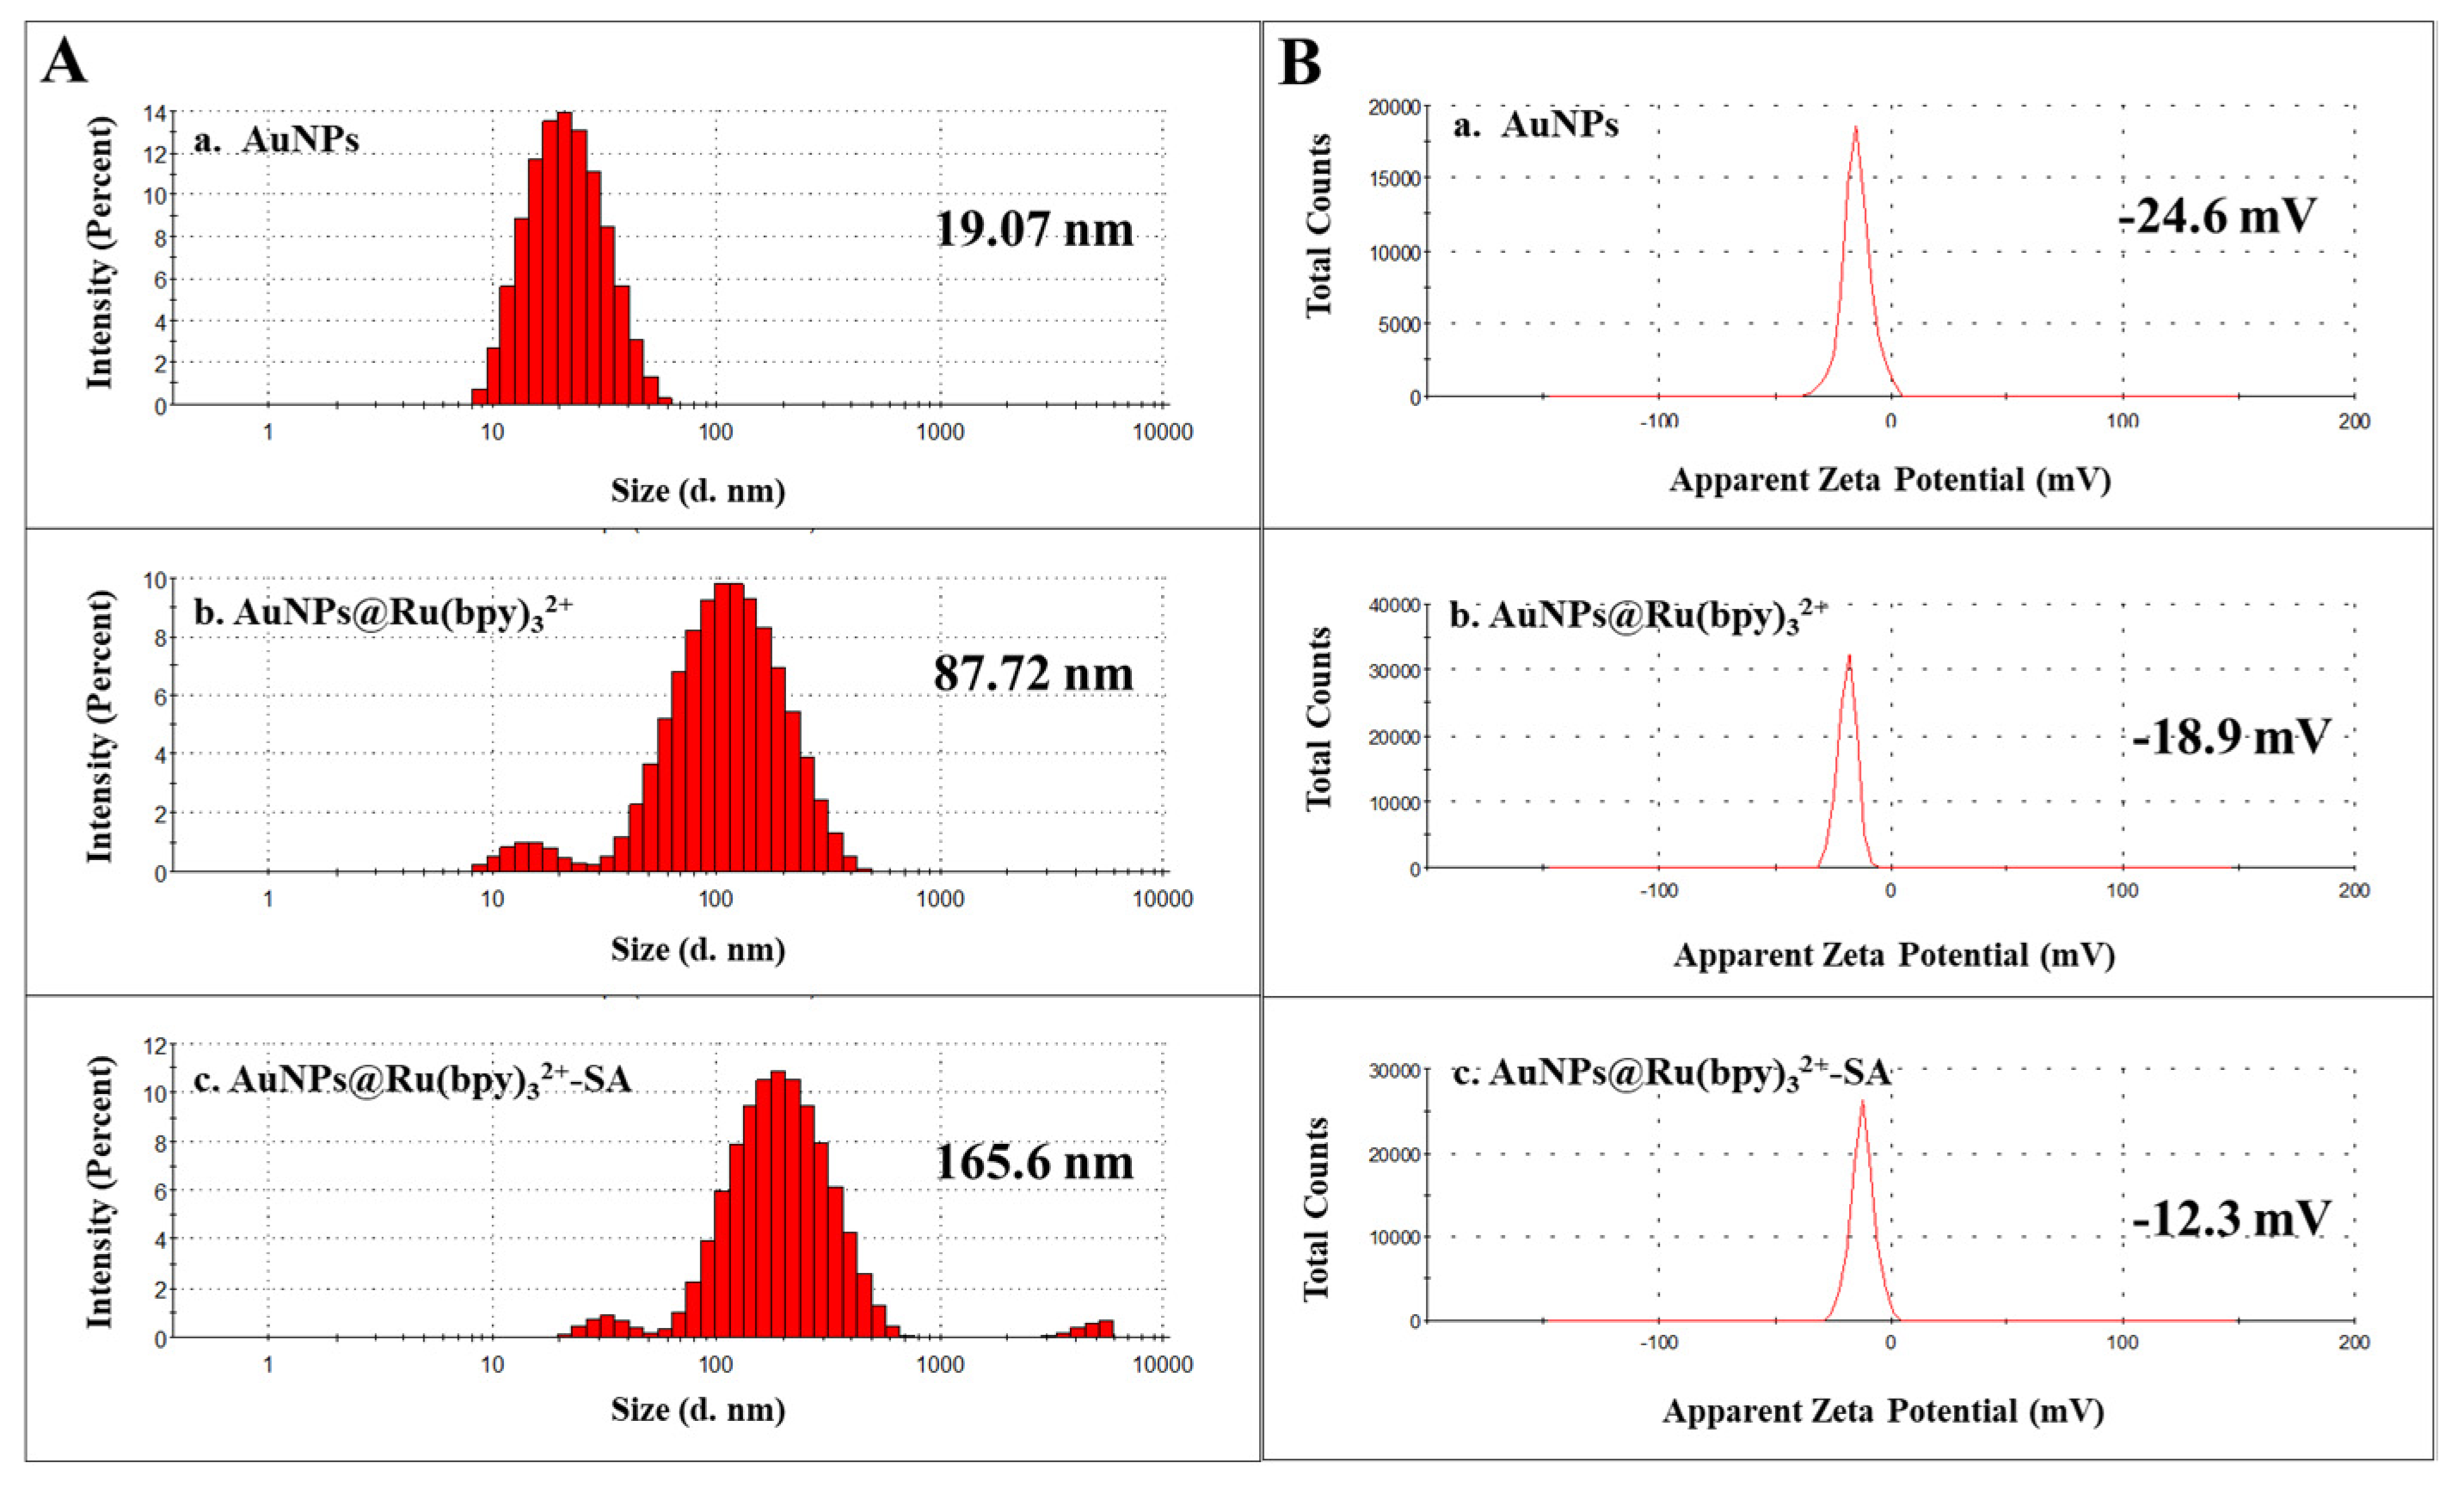
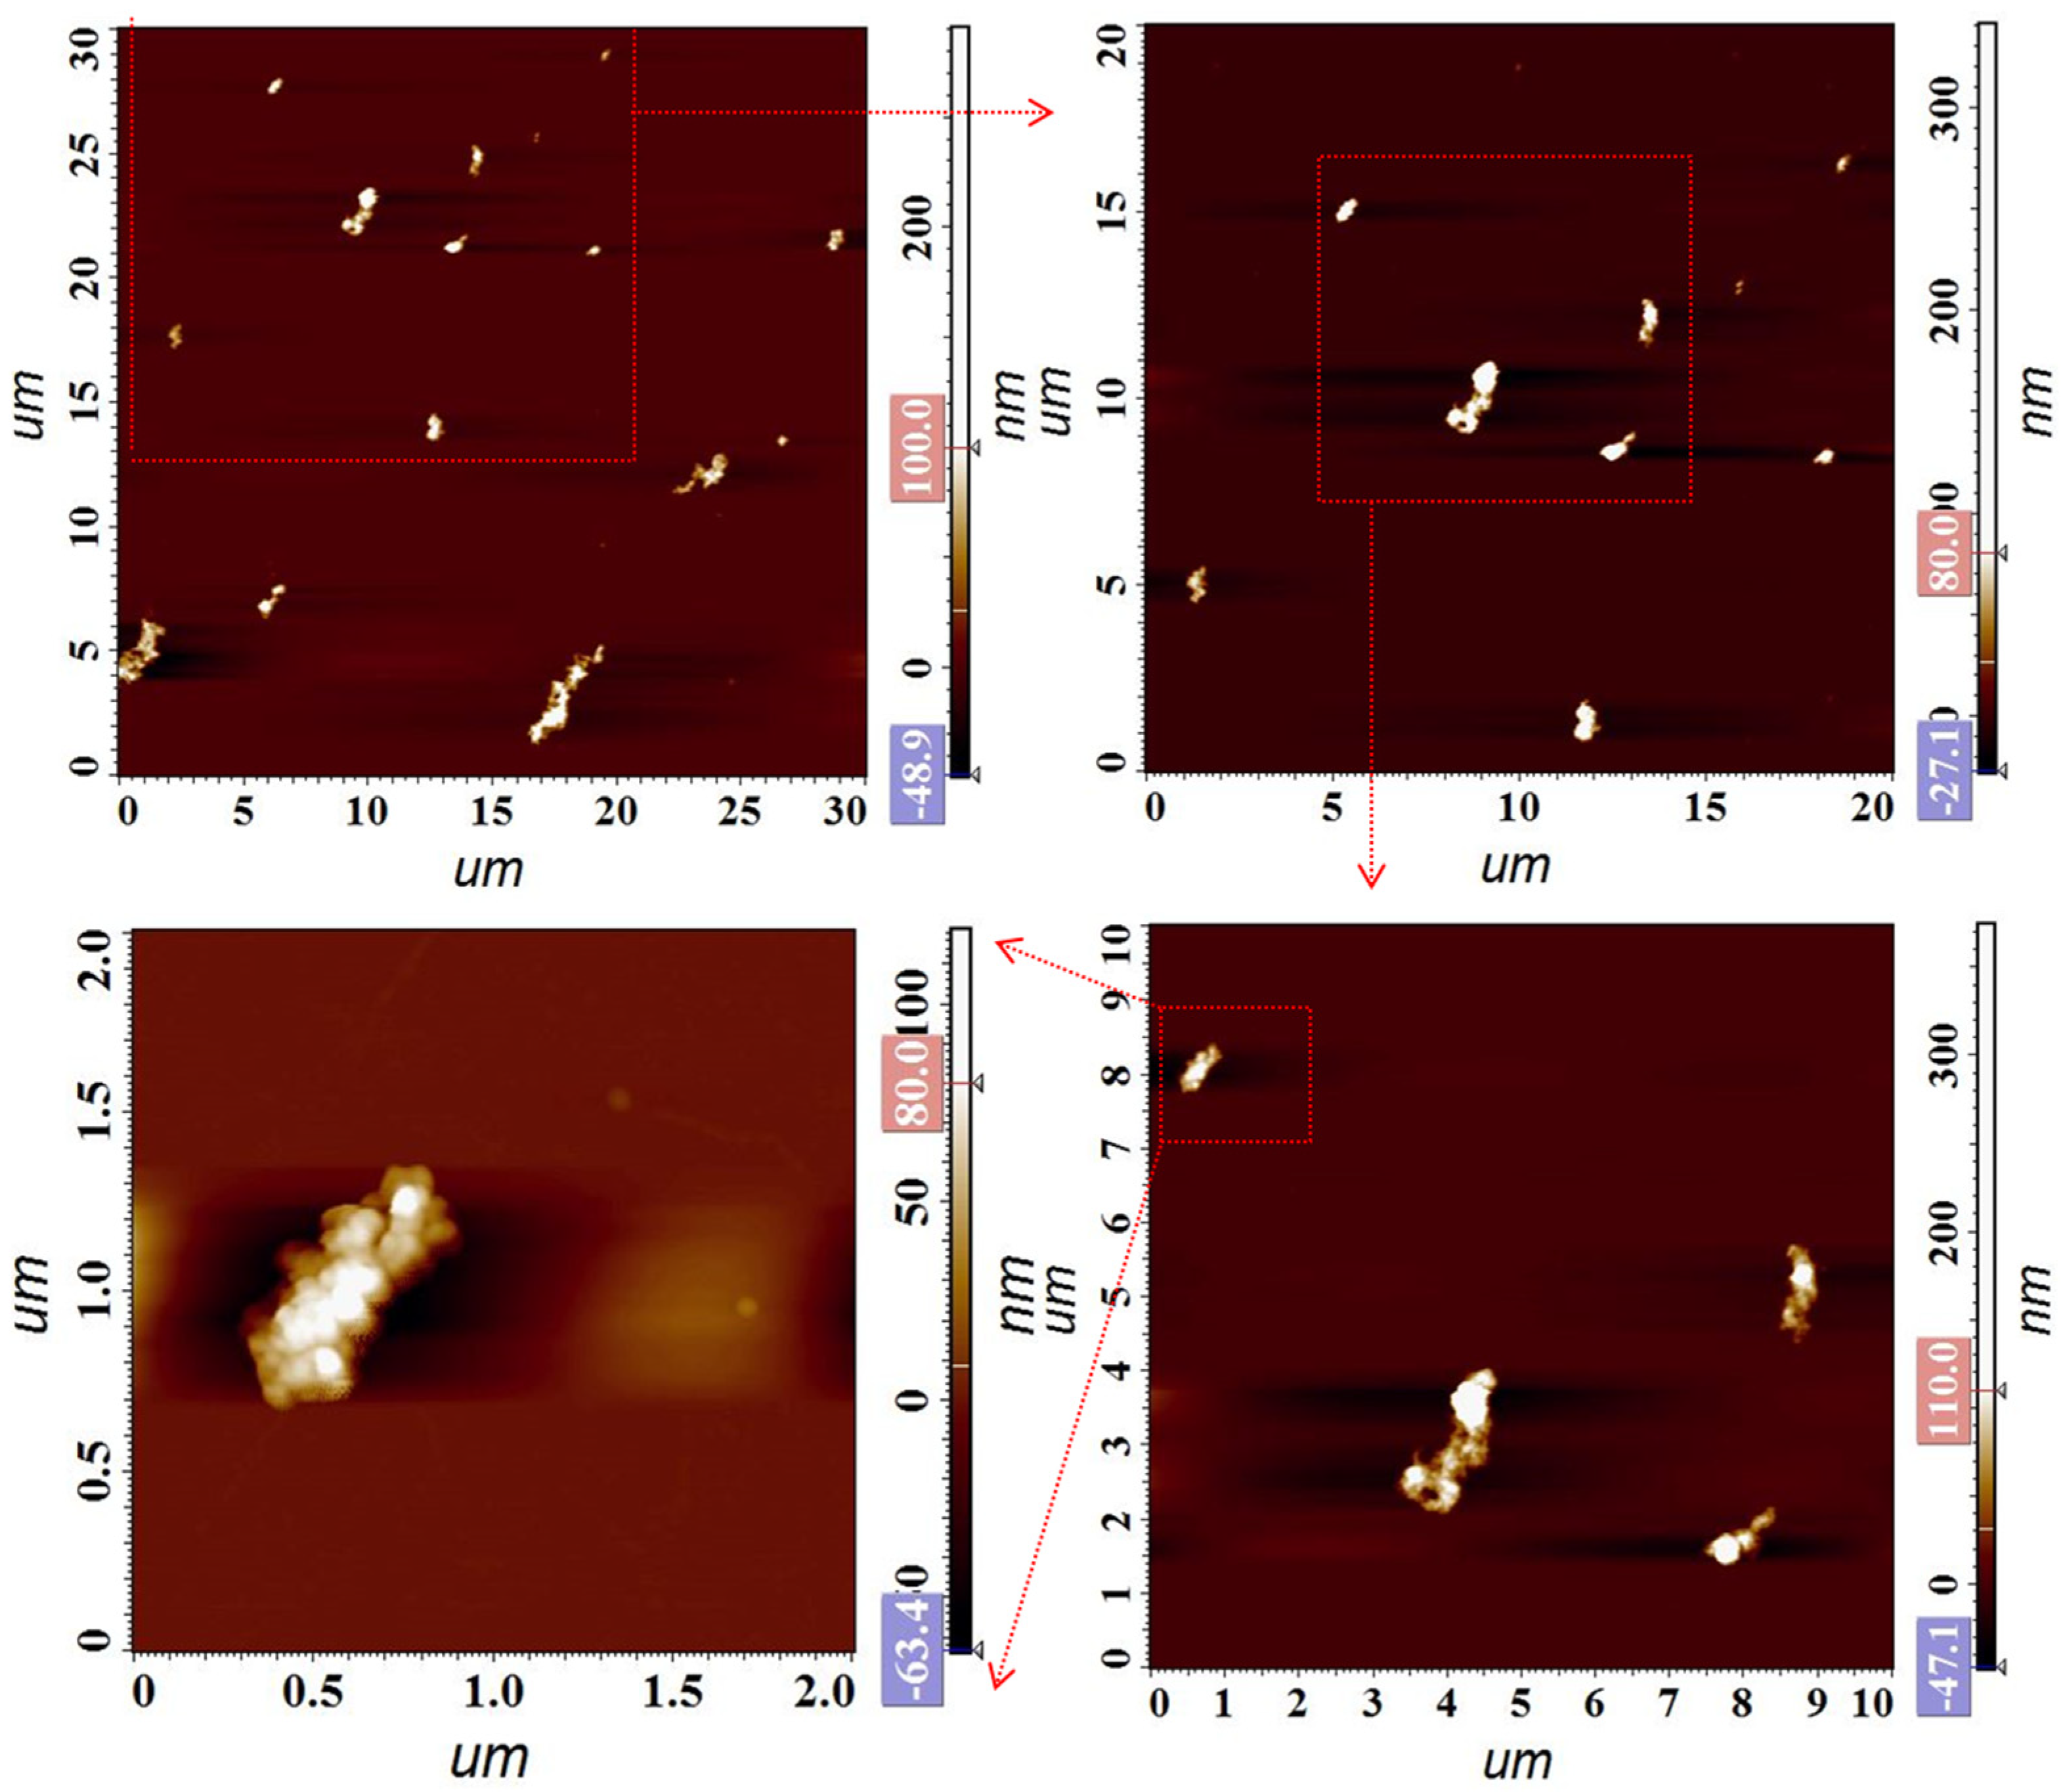
3.3. Characterization of AuNPs and Gold Nanocomposites

Firstly, AuNPs and their composites (AuNPs@Ru(bpy)32+ and AuNPs@Ru(bpy)32+-SA) were, respectively, diluted with deionized water and sonicated for 10 min, followed by nanoparticle size determination (Figure 4A; Table 1) and zeta potential characterization (Figure 4B, Table 1). The particle size of AuNPs was about 19 nm, and the particle size of AuNPs@Ru(bpy)32+ was about 90 nm, indicating that multiple AuNPs were interconnected and aggregated due to the strong electrical adsorption of Ru(bpy)32+. The particle size of AuNPs@Ru(bpy)32+-SA was about 165 nm, indicating that AuNPs@Ru(bpy)32+ connected with streptavidin or even interconnected to some extent. The significant size difference of the three nanomaterials indicates that AuNPs and gold nanocomposites were successfully prepared and can be used for subsequent experiments. Likewise, the significant changes in zeta potential of the three materials also support this judgment.
AFM visual characterization of AuNPs and gold nanocomposites (Figure 3) was also performed. Figure 5A shows AuNPs are small regular spheres with a particle size of about 20 nm, which is in agreement with the measurements using a nanoparticle sizer. AuNPs@Ru(bpy)32+ (Figure 5B) undergoes significant aggregation with an overall particle size between about 50 and 150 nm, but monomers and larger aggregates are also present. Figure 5C shows AuNPs@Ru(bpy)32+-SA, where the larger particle size of the aggregates can be found. The AFM characterization results of the three nanomaterials can be matched and corroborated particle size measurement results, which also proves the successful preparation of gold nanocomposites.

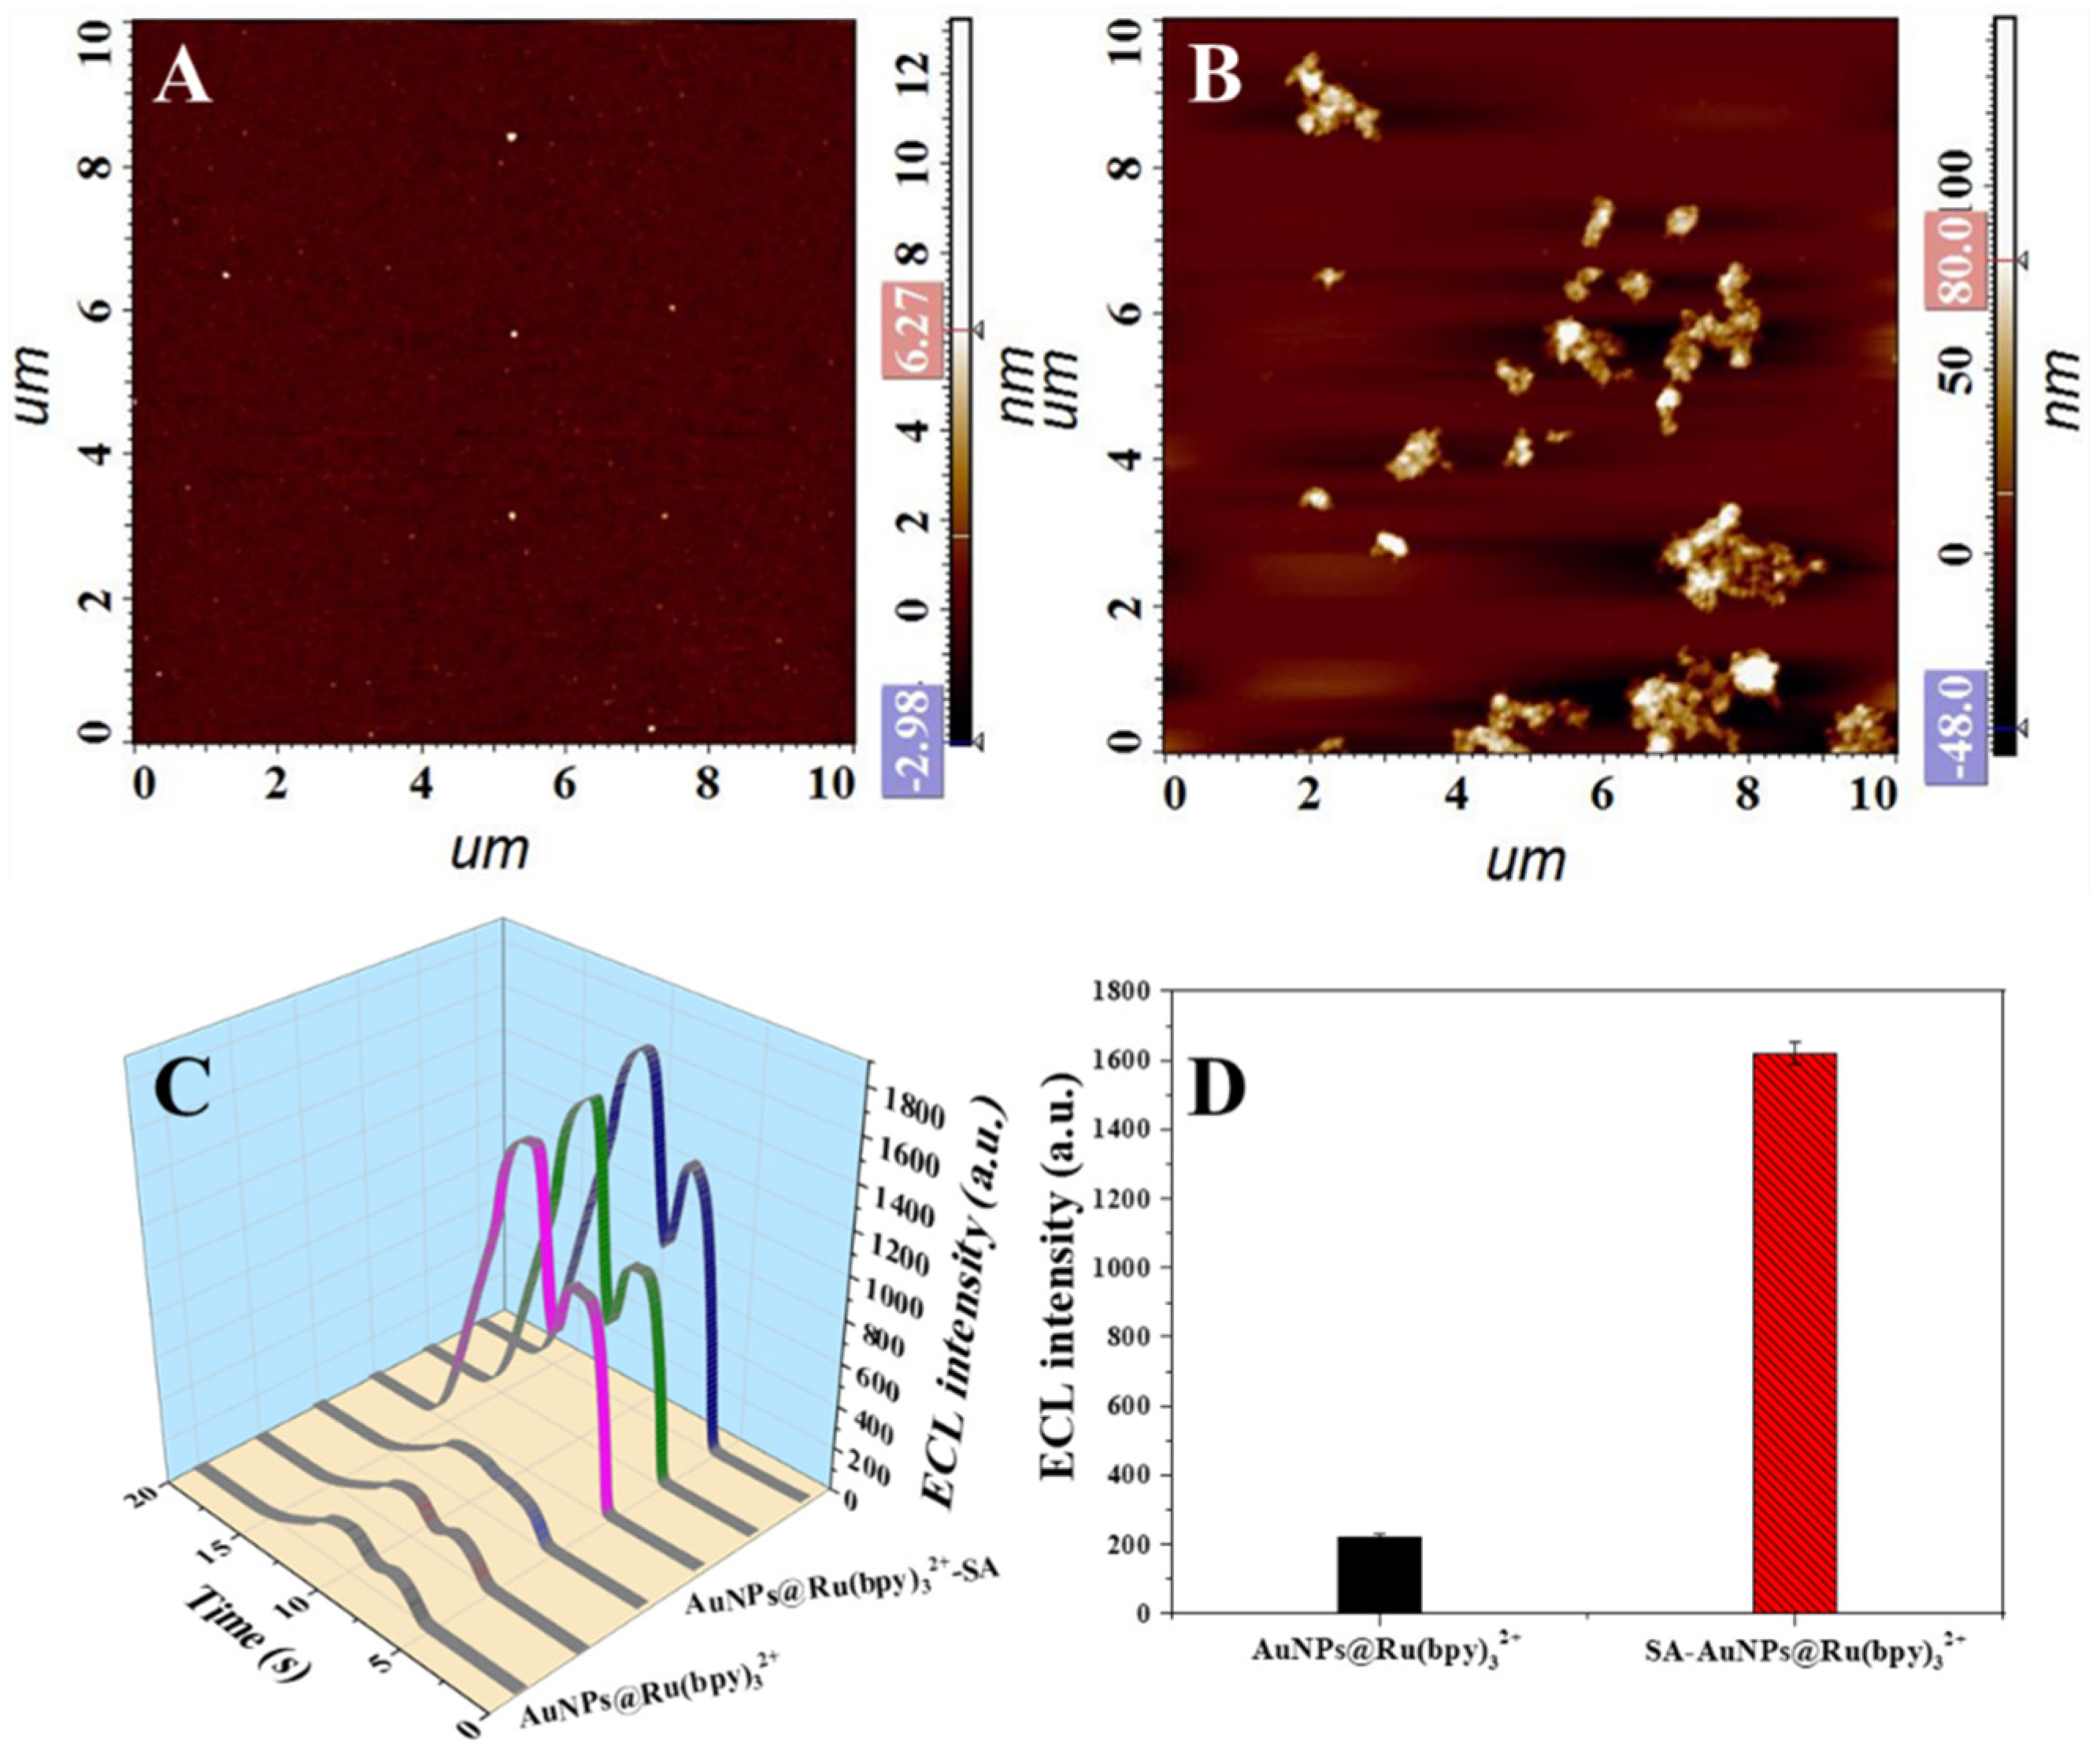
3.4. Characterization and Validation of the Coupling of Streptavidin and AuNPs@Ru(bpy)32+

Streptavidin is the key to load AuNPs@Ru(bpy)32+ on the surface of dual-labeled phage display affibodies. To further confirm whether streptavidin was bound to AuNPs@Ru(bpy)32+, two identical silica wafers were blocked with BSA and biotinylated BSA, respectively, and then incubated with equal amounts of AuNPs@Ru(bpy)32+-SA for 30 min. After sufficient washing, AFM characterization was performed, and it was found that the gold nanocomposites on the surface of the biotinylated BSA-blocked wafer were extremely dense (Figure 6B), while the surface of the BSA-blocked wafer was essentially devoid of nanomaterials (Figure 6A), strongly demonstrating that the AuNPs@Ru(bpy)32+-SA was successfully prepared.
In addition, we examined the electrochemiluminescence properties of gold nanocomposites. Firstly, an excess of biotin-labeled M13 phages were mixed with streptavidin-coated magnetic microspheres for 1 h, and magnetic microspheres with a large number of biotin molecules were obtained after sufficient washing. Then, the microspheres were divided equally into two groups; one group was added with AuNPs@Ru(bpy)32+ suspension and another group was mixed with the same concentration of AuNPs@Ru(bpy)32+-SA suspension. After 30 min of reaction and thorough washing, the magnetic microspheres were used for ECL characterization, and the results are shown in Figure 6C,D. It was found that the two groups of samples had extremely significant ECL signal differences, which also indicated that streptavidin was successfully linked to AuNPs@Ru(bpy)32+ and AuNPs@Ru(bpy)32+-SA was prepared successfully.

3.5. Analysis of the Proposed ECL Biosensing Method

3.5.1. Characterization and Validation of the Coupling of Dual-Labeled Phage Display Affibodies and AuNPs@Ru(bpy)32+-SA

Different from the double antibody sandwich structure and the three-level sandwich structure of “antibody-toxin-phage display affibody”, in this study, a new sensing model was constructed based on a “antibody-toxin-phage display affibody-AuNPs@Ru(bpy)32+” four-level sandwich structure. The magnetic capture probes first caught the abrin and then further formed sandwich composites with the dual-labeled phage display affibodies. On this basis, the phage capsid was used as the carrier to enrich AuNPs@Ru(bpy)32+-SA on its surface via biotin–streptavidin interaction, which finally brought about magnetic super-composites with highly enriched signal molecules, and was the key to the signal amplification of the biosensor.
To determine whether AuNPs@Ru(bpy)32+-SA could be successfully loaded on the surface of the dual-labeled phage display affibody, appropriate proportions of both were mixed and rotated vertically for 1 h. The mixture was added dropwise and adsorbed on the silicon wafer and observed via AFM (Figure 7). It was found that the AuNPs@Ru(bpy)32+-SA formed obvious large-sized composites compared to the monomer and showed a long, strip-like distribution, indicating that they had been successfully attached to the M13 phages. This result proved that the key structure of the sensing model was successfully constructed and also laid the foundation for the signal amplification of abrin detection.

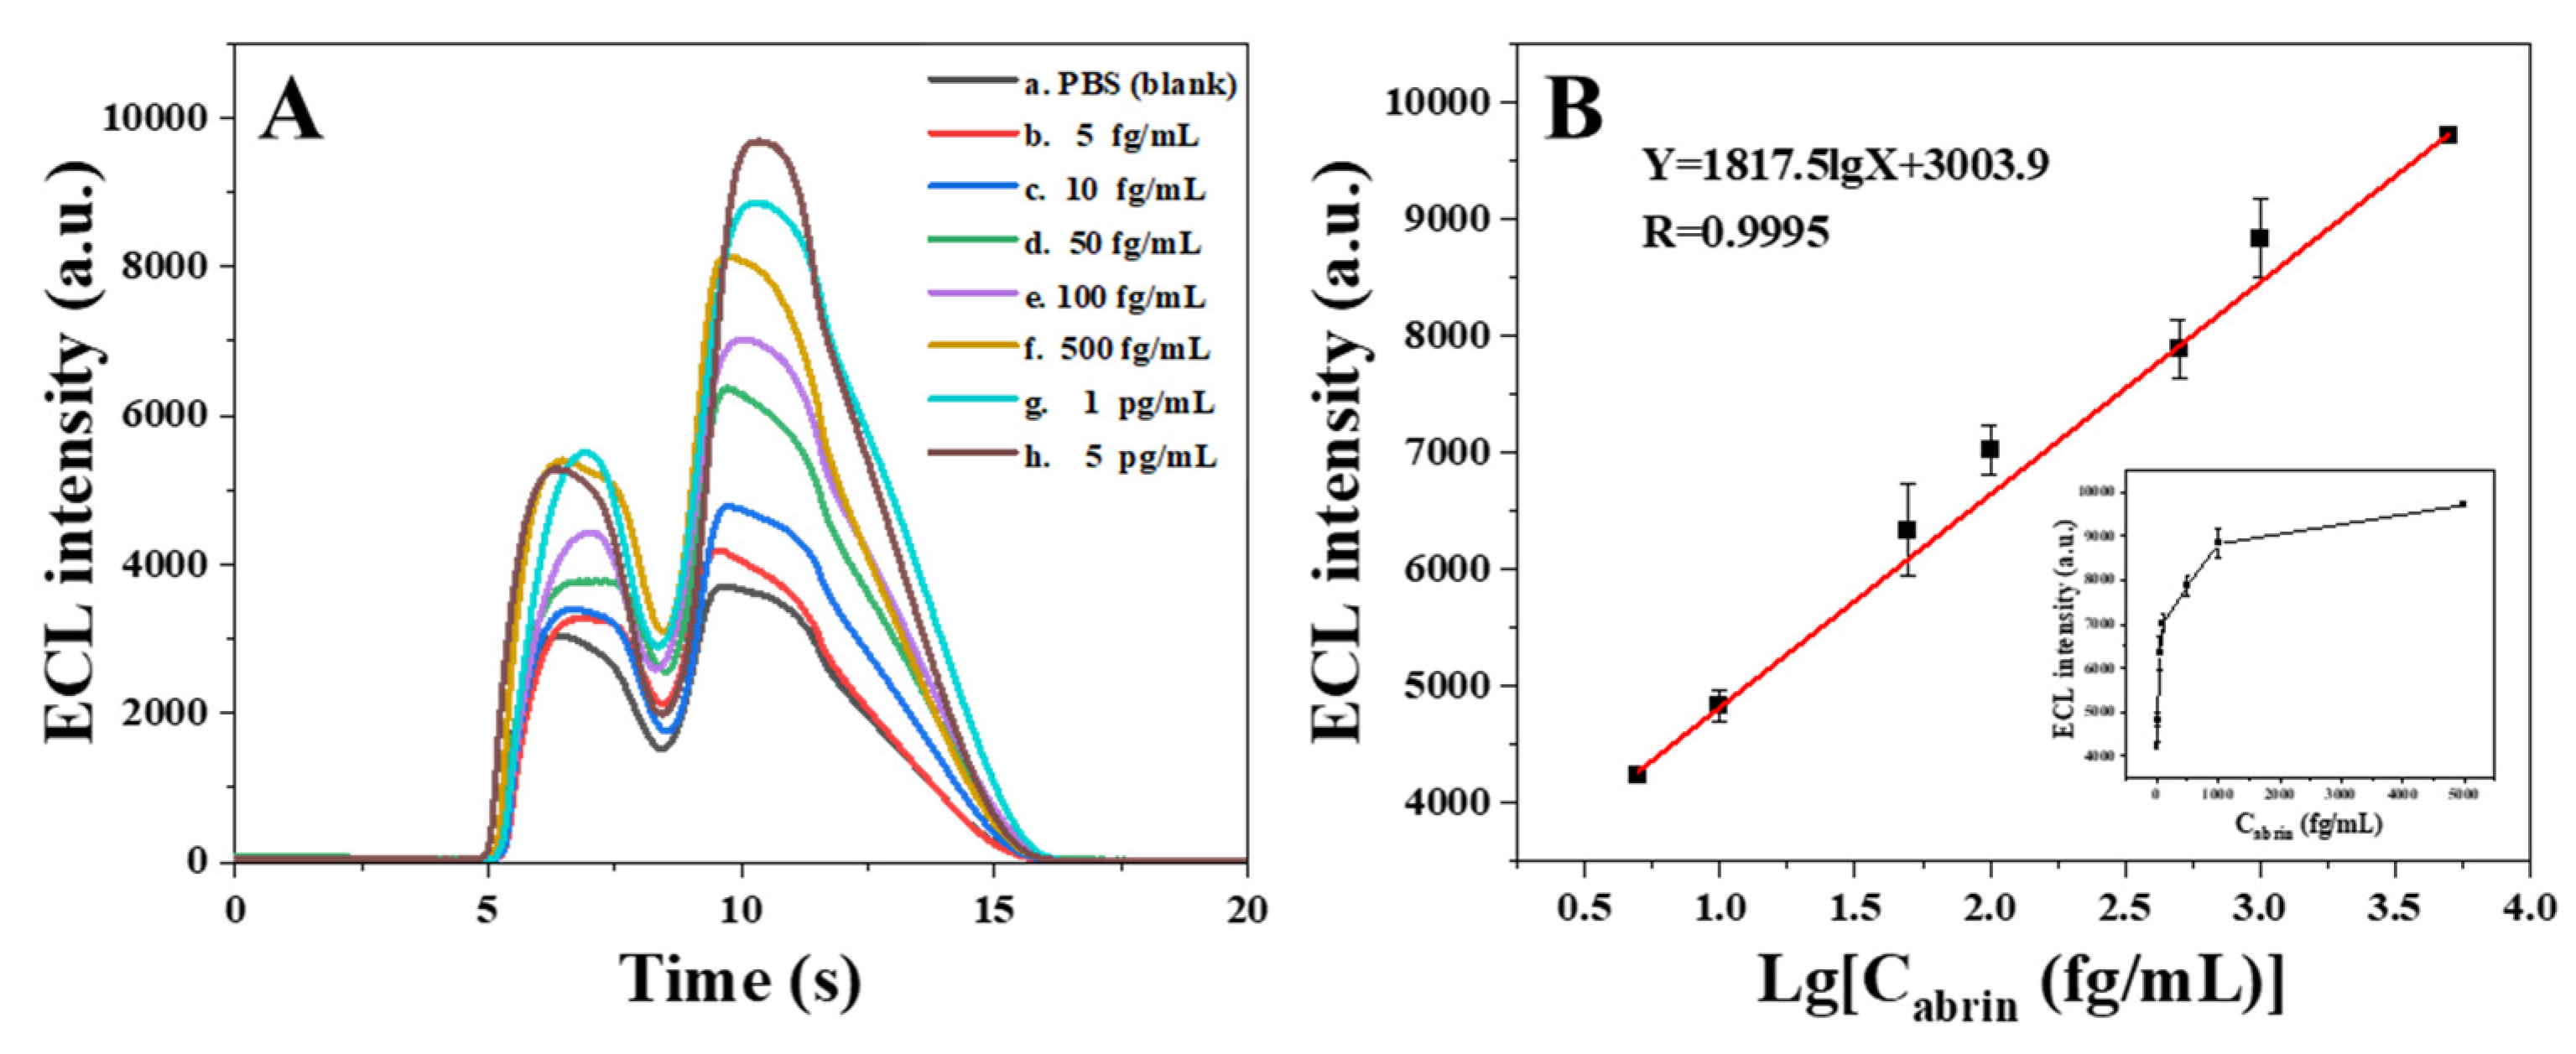
3.5.2. Quantification Range, Regression Equation and LOD

The magnetic super-composites were cleaned, resuspended with co-reactive solution, added dropwise to the surface of the screen-printed electrode and detected using a portable ECL sensor. The real-time responses of samples with different concentrations are shown in Figure 8A, and there was a significant signal gradient difference between samples with different concentrations in the range of 5 fg/mL~5 pg/mL. Within this range, a linear relationship between the ECL signal (Y) and the logarithm of abrin concentration (X, fg/mL) was observed, and the regression equation was Y = 1817.5 lgX + 3003.9 (R = 0.9995, n = 7, p < 0.0001) (Figure 8B). The mean value of the sensor for the blank sample (0.01 mol/L PBS, pH = 7.4) was 3908 a.u., and the standard deviation of the five parallel assays was 67 a.u. Using the principle of 3δ/S (δ: the standard deviation of black; S: the slope of the calibration curve) [38,39], it can be judged that the LOD of the ECL sensor was 4.1 fg/mL. In this detection mode, AuNPs, with large specific surface area, can rapidly adsorb a large number of signal molecules through electrical interaction, forming gold nanocomposites [AuNPs@Ru(bpy)32+] with extremely high signal density, and the phage display affibodies with powerful loading capacity were not only labeled with Ru(bpy)32+, but also enriched with AuNPs@Ru(bpy)32+ in large amounts. These designs greatly improved the detection capability of the sensor, ultimately achieving the ultra-sensitive detection of abrin. Compared with the ECL biosensors based on antibodies [7] and phage display affibodies without nanomaterial modification [27], the LOD of the present sensor was decreased by about 99.996 and 99.92, respectively, and significant signal amplification was finally achieved.

3.5.3. Reproducibility, Specificity and Stability

The reproducibility, specificity and stability of the sensor were tested. Firstly, five parallel determinations were carried out for different concentrations of abrin standards (Figure 9A. Table S1 in Supplementary Materials), and the results showed that the overall RSDs ranged from 0.38% to 6.19%. In addition, samples with a concentration of 250 fg/mL were also prepared and measured five times in parallel using the same method, and the assay results are shown in Figure 9B, with a relative standard deviation of 1.7%. Therefore, the sensor has acceptable reproducibility.
The specificity of the sensor was investigated with abrin (1 pg/mL) as the positive control and PBS (0.01 mol/L, pH = 7.4) as the negative control. The non-target proteins were BSA, human IgG and β-bungarotoxin (β-BGT, a kind of biotoxin), respectively, and the concentrations were all 1 ng/mL. The assay results are shown in Figure 9B and Table 2. The ECL response for the BSA, human IgG and β-BGT samples were all at negative levels and differed greatly from the abrin sample. The mixture sample containing three non-target proteins (1 ng/mL) and abrin (1 pg/mL) was also examined, and the ECL response was comparable to that of the positive control group. These results indicate that the ECL biosensor has good specificity for biotoxin detection. Multiple washes and magnetic separations, as well as the dual specific recognition of antibody and phage display affibody, guarantee the outstanding specificity.
The stability of the sensor for the abrin sample (5 fg/mL) was tested, and the results are shown in Figure 9D and Figure S5 (Supplementary Materials). As can be seen in Figure 9, the sensor had good detection stability in five detection cycles. However, the subsequent detection results continued to decline steadily (Figure S5), which is due to the fact that each cycle required the consumption of co-reactants in the detection fluid. In the case of excess co-reactants, the measured values can remain stable, but when the co-reactants are consumed, the detection value will decrease with the reduction in luminescence efficiency. In fact, in the actual detection process, only the first peak was used as the standard detection value, and the subsequent luminescence did not affect the detection results.

3.5.4. Test of Simulated Samples

In order to explore the practicability of this ECL biosensor and its anti-interference ability, simulated samples with 100 fg/mL of abrin were prepared with rabbit plasma, milk, honey and pollen as the matrix, respectively, corresponding to different toxin sources from the body, food and the environment. The determined values were calculated using the regression equation. As shown in Table 3, the recoveries of the different simulated samples ranged from 97.1% to 104.0%, and the RSDs ranged from 1.65% to 3.79%. The ECL biosensor had a good detection effect on the simulated samples and is potentially useful for the ultra-sensitive detection of complex samples.

4. Conclusions

In this study, a new ECL biosensor based on a four-level sandwich structure of “magnetic capture probe-toxin-phage display affibody-AuNPs@Ru(bpy)32+” was constructed using phage display affibodies as both specific sensitive probes and nanomaterial carriers, AuNPs@Ru(bpy)32+ as signal amplification materials and a portable electrochemiluminescence sensor based on a screen-printed electrode as the detection platform. This sensor made full use of the multi-copies of phage capsid proteins and the signal molecule loading capability of AuNPs to achieve the ultra-sensitive detection of abrin. The LOD was 4.1 fg/mL, and the quantification range was from 5 fg/mL to 5 pg/mL. The sensor showed good reproducibility and specificity and performed well in the detection of simulated samples. The phage display affibody combined the dual functions of target recognition and signal carrier, which is an important aspect in the construction of highly sensitive biosensors.

Supplementary Materials

The following supporting information can be downloaded at: https://0-www-mdpi-com.brum.beds.ac.uk/article/10.3390/chemosensors10050184/s1, Reagents and instruments; Figure S1: The portable ECL sensor and screen-printed electrode; Figure S2: Magnetic separation efficiency test of magnetic microspheres ((a) 0 s; (b) 5 s; (c) 10 s; (d) 15 s; (e) 20 s); Figure S3: UV-Vis absorbance spectra of antibody solution before (a) and after (b) absorbed by protein A-coated magnetic microspheres; Figure S4: Schematic diagram of labeling ratio (Ru(bpy)32+ and biotin) optimization principle; Figure S5. Stability test (ten cycles); Table S1: Measured values and reproducibility test (n = 5).

Author Contributions

S.L.: Conceptualization, data curation, formal analysis, investigation, methodology, software, visualization, writing—original draft, writing—review and editing. Z.T.: formal analysis, funding acquisition, investigation, project administration, supervision, resources. C.J.: data curation, writing—review and editing. C.G.: resources, investigation. J.X.: supervision, resources. X.M.: resources, formal analysis. B.L.: funding acquisition, conceptualization. B.D.: resources. Z.L.: investigation. P.Z.: investigation. All authors have read and agreed to the published version of the manuscript.

Funding

This research was funded by the National Key R&D Program of China (SKLNBC2020-03).

Institutional Review Board Statement

Not applicable.

Informed Consent Statement

Not applicable.

Data Availability Statement

Not applicable.

Conflicts of Interest

The authors declare no conflict of interest.

References

  1. Patocka, J. Abrin and ricin-two dangerous poisonous proteins. ASA Newsl. 2001, 85, 205–208. [Google Scholar]
  2. Shih, S.F.; Wu, Y.H.; Hung, C.H.; Yang, H.Y.; Lin, J.Y. Abrin triggers cell death by inactivating a thiol-specific antioxidant protein. J. Biol. Chem. 2001, 276, 21870–21877. [Google Scholar] [CrossRef] [PubMed] [Green Version]
  3. Dickers, K.J.; Bradberry, S.M.; Rice, P.; Griffiths, G.D.; Vale, J.A. Abrin poisoning. Toxicol. Rev. 2003, 22, 137–142. [Google Scholar] [CrossRef] [PubMed]
  4. Rinner, G.R.; Watkins, S.A.; Shirazi, F.M.; Fernández, M.C.; Hess, G.; Mihalic, J.; Runcorn, S.; Waddell, V.; Ritter, J.; Reagan-Steiner, S. Fatal abrin poisoning by injection. Clin. Toxicol. 2021, 59, 169–171. [Google Scholar] [CrossRef] [PubMed]
  5. Roxas-Duncan, V.; Smith, L. Of beans and beads: Ricin and abrin in bioterrorism and biocrime. J. Bioterrorism Biodefense 2014, 5, S2-002. [Google Scholar] [CrossRef]
  6. Liu, B.; Tong, Z.-Y.; Liu, W.; Hao, L.-Q.; Mu, X.-H.; Huang, Q.-B. Determination of Abrin by Electrochemiluminescence Immunosensor Based on Phage-displayed Antibody. Chin. J. Anal. Chem. 2013, 41, 1449–1453. [Google Scholar] [CrossRef]
  7. Liu, S.; Tong, Z.; Mu, X.; Liu, B.; Du, B.; Liu, Z.; Gao, C. Detection of Abrin by Electrochemiluminescence biosensor based on screen printed electrode. Sensors 2018, 18, 357. [Google Scholar] [CrossRef] [Green Version]
  8. Garber, E.A. Toxicity and detection of ricin and abrin in beverages. J. Food Prot. 2008, 71, 1875–1883. [Google Scholar] [CrossRef]
  9. Garber, E.A.; Walker, J.L.; O’BRIEN, T.W. Detection of abrin in food using enzyme-linked immunosorbent assay and electrochemiluminescence technologies. J. Food Prot. 2008, 71, 1868–1874. [Google Scholar] [CrossRef]
  10. Zhou, Y.; Tian, X.-L.; Li, Y.-S.; Pan, F.-G.; Zhang, Y.-Y.; Zhang, J.-H.; Wang, X.-R.; Ren, H.-L.; Lu, S.-Y.; Li, Z.-H. Development of a monoclonal antibody-based sandwich-type enzyme-linked immunosorbent assay (ELISA) for detection of abrin in food samples. Food Chem. 2012, 135, 2661–2665. [Google Scholar] [CrossRef]
  11. Tang, J.; Yu, T.; Guo, L.; Xie, J.; Shao, N.; He, Z. In vitro selection of DNA aptamer against abrin toxin and aptamer-based abrin direct detection. Biosens. Bioelectron. 2007, 22, 2456–2463. [Google Scholar] [CrossRef] [PubMed]
  12. Rasooly, R.; Do, P.; Hernlem, B. CCD based detector for detection of abrin toxin activity. Toxins 2020, 12, 120. [Google Scholar] [CrossRef] [PubMed] [Green Version]
  13. Sun, X.; Fei, R.; Zhang, L.; Huo, B.; Wang, Y.; Peng, Y.; Ning, B.; He, J.; Gao, Z.; Hu, Y. Bio–barcode triggered isothermal amplification in a fluorometric competitive immunoassay for the phytotoxin abrin. Microchim. Acta 2020, 187, 127. [Google Scholar] [CrossRef] [PubMed]
  14. Gao, S.; Nie, C.; Wang, J.; Wang, J.; Kang, L.; Zhou, Y.; Wang, J.-L. Colloidal Gold–Based Immunochromatographic Test Strip for Rapid Detection of Abrin in Food Samples. J. Food Prot. 2012, 75, 112–117. [Google Scholar] [CrossRef]
  15. Mu, X.-H.; Zhou, Z.-Q.; Tong, Z.-Y.; Liu, B.; Hao, L.-Q. Detection of abrin by piezoelectric immunosensor based on biotin-avidin system. Chin. J. Anal. Chem. 2009, 37, 1499–1502. [Google Scholar]
  16. Yang, H.; Deng, M.; Ga, S.; Chen, S.; Kang, L.; Wang, J.; Xin, W.; Zhang, T.; You, Z.; An, Y. Capillary-driven surface-enhanced Raman scattering (SERS)-based microfluidic chip for abrin detection. Nanoscale Res. Lett. 2014, 9, 138. [Google Scholar] [CrossRef] [Green Version]
  17. Hansbauer, E.-M.; Worbs, S.; Volland, H.; Simon, S.; Junot, C.; Fenaille, F.; Dorner, B.G.; Becher, F. Rapid detection of abrin toxin and its isoforms in complex matrices by immuno-extraction and quantitative high resolution targeted mass spectrometry. Anal. Chem. 2017, 89, 11719–11727. [Google Scholar] [CrossRef]
  18. Godal, A.; Olsnes, S.; Pihl, A. Radioimmunoassays of abrin and ricin in blood. J. Toxicol. Environ. Health 1981, 8, 409–417. [Google Scholar] [CrossRef]
  19. Nilsson, B.; Moks, T.; Jansson, B.; Abrahmsen, L.; Elmblad, A.; Holmgren, E.; Henrichson, C.; Jones, T.A.; Uhlen, M. A synthetic IgG-binding domain based on staphylococcal protein A. Protein Eng. Des. Sel. 1987, 1, 107–113. [Google Scholar] [CrossRef] [Green Version]
  20. Braisted, A.C.; Wells, J.A. Minimizing a binding domain from protein A. Proc. Natl. Acad. Sci. USA 1996, 93, 5688–5692. [Google Scholar] [CrossRef] [Green Version]
  21. Tolmachev, V.; Orlova, A.; Nilsson, F.Y.; Feldwisch, J.; Wennborg, A.; Abrahmsen, L. Affibody molecules: Potential for in vivo imaging of molecular targets for cancer therapy. Expert Opin. Biol. Ther. 2007, 7, 555–568. [Google Scholar] [CrossRef] [PubMed]
  22. Li, S.; Jin, Y.; Su, Y.; Li, W.; Xing, Y.; Wang, F.; Hong, Z. Anti-HER2 Affibody-Conjugated Photosensitizer for Tumor Targeting Photodynamic Therapy. Mol. Pharm. 2020, 17, 1546–1557. [Google Scholar] [CrossRef] [PubMed]
  23. Xu, Y.; Wang, L.; Pan, D.; Yan, J.; Wang, X.; Yang, R.; Li, M.; Liu, Y.; Yang, M. Synthesis of a novel 89Zr-labeled HER2 affibody and its application study in tumor PET imaging. EJNMMI Res. 2020, 10, 58. [Google Scholar] [CrossRef] [PubMed]
  24. Liu, J.; Cui, D.; Jiang, Y.; Li, Y.; Liu, Z.; Tao, L.; Zhao, Q.; Diao, A. Selection and characterization of a novel affibody peptide and its application in a two-site ELISA for the detection of cancer biomarker alpha-fetoprotein. Int. J. Biol. Macromol. 2021, 166, 884–892. [Google Scholar] [CrossRef]
  25. Nord, K.; Nilsson, J.; Nilsson, B.; Uhlén, M.; Nygren, P.-Å. A combinatorial library of an α-helical bacterial receptor domain. Protein Eng. Des. Sel. 1995, 8, 601–608. [Google Scholar] [CrossRef]
  26. LI, S.; HAO, Z.-M. An Engineered Affinity Protein-affibody. Prog. Biochem. Biophys. 2012, 39, 137–141. [Google Scholar] [CrossRef]
  27. Liu, S.; Gao, C.; Tong, Z.Y.; Mu, X.H.; Liu, B.; Xu, J.J.; Du, B.; Wang, J.; Liu, Z.W. A highly sensitive electrochemiluminescence method for abrin detection by a portable biosensor based on a screen-printed electrode with a phage display affibody as specific labeled probe. Anal. Bioanal. Chem. 2022, 414, 1095–1104. [Google Scholar] [CrossRef]
  28. Tortolini, C.; Tasca, F.; Venneri, M.A.; Marchese, C.; Antiochia, R. Gold Nanoparticles/Carbon Nanotubes and Gold Nanoporous as Novel Electrochemical Platforms for L-Ascorbic Acid Detection: Comparative Performance and Application. Chemosensors 2021, 9, 229. [Google Scholar] [CrossRef]
  29. Hua, Z.; Yu, T.; Liu, D.; Xianyu, Y. Recent advances in gold nanoparticles-based biosensors for food safety detection. Biosens. Bioelectron. 2021, 179, 113076. [Google Scholar] [CrossRef]
  30. Song, M.; Khan, I.M.; Wang, Z. Research Progress of Optical Aptasensors Based on AuNPs in Food Safety. Food Anal. Methods 2021, 14, 2136–2151. [Google Scholar] [CrossRef]
  31. Yazdian-Robati, R.; Hedayati, N.; Dehghani, S.; Ramezani, M.; Alibolandi, M.; Saeedi, M.; Abnous, K.; Taghdisi, S.M. Application of the catalytic activity of gold nanoparticles for development of optical aptasensors. Anal. Biochem. 2021, 629, 114307. [Google Scholar] [CrossRef] [PubMed]
  32. Dzantiev, B.B.; Byzova, N.A.; Urusov, A.E.; Zherdev, A.V. Immunochromatographic methods in food analysis. TrAC Trends Anal. Chem. 2014, 55, 81–93. [Google Scholar] [CrossRef]
  33. Singh, J.; Sharma, S.; Nara, S. Evaluation of gold nanoparticle based lateral flow assays for diagnosis of enterobacteriaceae members in food and water. Food Chem. 2015, 170, 470–483. [Google Scholar] [CrossRef] [PubMed]
  34. Ngo, V.K.T.; Nguyen, H.P.U.; Huynh, T.P.; Tran, N.N.P.; Lam, Q.V.; Huynh, T.D. Preparation of gold nanoparticles by microwave heating and application of spectroscopy to study conjugate of gold nanoparticles with antibody E. coli O157: H7. Adv. Nat. Sci. Nanosci. Nanotechnol. 2015, 6, 035015. [Google Scholar] [CrossRef]
  35. Foss Jr, C.A.; Hornyak, G.L.; Stockert, J.A.; Martin, C.R. Template-synthesized nanoscopic gold particles: Optical spectra and the effects of particle size and shape. J. Phys. Chem. 1994, 98, 2963–2971. [Google Scholar] [CrossRef]
  36. Link, S.; El-Sayed, M.A. Shape and size dependence of radiative, non-radiative and photothermal properties of gold nanocrystals. Int. Rev. Phys. Chem. 2000, 19, 409–453. [Google Scholar] [CrossRef]
  37. Haiss, W.; Thanh, N.T.; Aveyard, J.; Fernig, D.G. Determination of size and concentration of gold nanoparticles from UV-Vis spectra. Anal. Chem. 2007, 79, 4215–4221. [Google Scholar] [CrossRef]
  38. Ling, Y.; Wang, L.; Zhang, X.Y.; Wang, X.H.; Zhou, J.; Sun, Z.; Li, N.B.; Luo, H.Q. Ratiometric fluorescence detection of dopamine based on effect of ligand on the emission of Ag nanoclusters and aggregation-induced emission enhancement. Sens. Actuators B Chem. 2020, 310, 127858. [Google Scholar] [CrossRef]
  39. Huang, W.; Liu, F.; Huang, Y.; Yang, W.; Zhong, H.; Peng, J. Facile one-pot synthesis of hollow-structured CuS/Cu2S hybrid for enhanced electrochemical determination of glucose. Electrochemistry 2021, 89, 340–347. [Google Scholar] [CrossRef]
Scheme 1. Construction of an ultrasensitive ECL biosensor for the detection of abrin based on phage display affibodies and AuNPs@Ru(bpy)32+.
Chemosensors 10 00184 sch001
Figure 1. ECL intensity variation curves of magnetic complexes formed by different ratios of Ru(bpy)32+ and biotin-labeled phage displaying affibodies and streptavidin-coated magnetic microspheres.
Chemosensors 10 00184 g001
Figure 2. UV-Vis absorption spectra of mixed solutions of Ru(bpy)32+ at different concentrations and colloidal gold.
Chemosensors 10 00184 g002
Figure 3. AFM images of the M13 phage display affibodies.
Chemosensors 10 00184 g003
Figure 4. Particle size (A) and zeta potential (B) distribution of AuNPs and gold nanocomposites (a. AuNPs; b. AuNPs@Ru(bpy)32+; c. AuNPs@Ru(bpy)32+-SA).
Chemosensors 10 00184 g004
Figure 5. AFM images of AuNPs and gold nanocomposites ((A): AuNPs; (B): AuNPs@Ru(bpy)32+; (C): AuNPs@Ru(bpy)32+-SA).
Chemosensors 10 00184 g005
Figure 6. AuNPs@Ru(bpy)32+-SA attached to BSA (A) and biotinylated BSA (B) blocked silica wafers; ECL real-time response comparison (C) and measured values comparison (D) of AuNPs@Ru(bpy)32+ and AuNPs@Ru(bpy)32+-SA mixed with biotinylated magnetic microspheres.
Chemosensors 10 00184 g006
Figure 7. AFM characterization of AuNPs@Ru(bpy)32+-SA in complex with dual-labeled phage display affibodies.
Chemosensors 10 00184 g007
Figure 8. (A) ECL real-time curves for samples with different abrin concentrations (a. PBS; b. 5 fg/mL; c. 10 fg/mL; d. 50 fg/mL; e. 100 fg/mL; f. 500 fg/mL; g. 1 pg/mL; h. 5 pg/mL). (B) Fitted curve and regression equation for ECL values versus abrin concentration.
Chemosensors 10 00184 g008
Figure 9. (A) Detection values for different concentration samples; (B) reproducibility test; (C) specificity test; (D) stability test (five cycles).
Chemosensors 10 00184 g009
Table 1. Average particle size and zeta potential of AuNPs and the related nanocomposites.
NanomaterialsDiameter (nm)Zeta Potential (mV)
AuNPs19.1 ± 0.05−24.9 ± 1.5
AuNPs@ Ru(bpy)32+89.6 ± 2.1−18.8 ± 0.3
AuNPs@Ru(bpy)32+-SA164.9 ± 1.8−12.0 ± 0.6
Table 2. Specificity test (n = 5).
SubstrateCon. (pg/mL)ECL Intensity (a.u.)
abrin18835 ± 340
BSA10003937 ± 129
β-BGT10003939 ± 229
Hu-IgG10004038 ± 147
mixture1 (abrin)8614 ± 193
PBS--3908 ± 67
Table 3. Test results of simulated sample (n = 5).
SampleAdded (fg/mL)Determined (fg/mL)Recovery (%)RSD (%)
plasma10097.197.13.05
milk10098.998.91.65
honey10098.498.43.79
pollen100104.0104.02.29
Publisher’s Note: MDPI stays neutral with regard to jurisdictional claims in published maps and institutional affiliations.

