
α-Glucosidase-Mediated Glucometer Readout for Portable Monitoring of Acarbose and Migliol


1
Chongqing Key Laboratory of High Active Traditional Chinese Drug Delivery System, Chongqing Medical and Pharmaceutical College, Chongqing 401331, China
2
College of Pharmacy, Chongqing Medical University, Chongqing 400016, China
3
School of Chemistry and Chemical Engineering, Chongqing University, Chongqing 401331, China
*
Author to whom correspondence should be addressed.
Chemosensors 2022, 10(6), 198; https://0-doi-org.brum.beds.ac.uk/10.3390/chemosensors10060198
Submission received: 21 April 2022
/
Revised: 18 May 2022
/
Accepted: 23 May 2022
/
Published: 24 May 2022
(This article belongs to the Special Issue Advanced Sensing Technologies in Medical and Pharmaceutical Analysis)
Abstract
:The α-glucosidase inhibitor is regarded as one of the most important drugs for the treatment of diabetes, which can control postprandial blood glucose levels via prolonging the carbohydrate digestion time and retarding the carbohydrates’ absorption. The present work aims to establish a facile bioanalytical method, based on α-glucosidase catalyzing the hydrolysis of 2-O-alpha-D-Glucopyranosyl-L-ascorbic acid (AA-2G), for the quantification of acarbose and migliol using a personal glucose meter (PGM). The hydrolysis products (ascorbic acid and glucose) can trigger the reduction of K3[Fe(CN)6] to K4[Fe(CN)6] in the glucose test strips, which results in the formation of the electron, which can be measured by PGM. Thus, ascorbic acid and glucose can be simultaneously measured by a simplified and miniaturized PGM method. However, the products produced by the hydrolysis of AA-2G will be decreased after the addition of acarbose or migliol to inhibit the activity of α-glucosidase, thereby resulting in a decreased PGM readout. After being incubated with α-glucosidase for 3.0 min and enzymatic reaction for 5.0 min, the quantitative detection of acarbose and migliol can be achieved within the ranges of 1.0–30.0 μM with the limit of detection of 0.33 μM and 3.0–33.3 μM with the limit of detection of 1.0 μM, respectively. IC50 values for acarbose and migliol are calculated to be 10.0 μM and 16.0 μM, respectively. The recoveries of the acarbose and migliol spiked with three different concentrations (final concentrations of 10.0, 20.0, and 30.0 μM) in human serum sample are in the ranges of 89.6–114.5% and 93.9–106.5%, respectively. These results demonstrate that the developed PGM method may be useful in future studies on therapeutic monitoring of acarbose and migliol.
1. Introduction
Diabetes mellitus, a serious and common chronic disease with high incidence, has become a global health problem [1,2,3]. Type I, type II, and gestational diabetes are the main types of diabetes mellitus. Among them, type II diabetes accounts for more than 90% of diabetes mellitus [4]. Moreover, diabetes mellitus is commonly accompanied with many complications such as cardiovascular diseases, nephropathy, foot ulcers, blindness, and so on [5,6,7]. After years of research, α-glucosidase (α-Glu) inhibitor has been regarded as one of the most important drugs for the treatment of diabetes, which can control postprandial blood glucose level via prolonging the carbohydrate digestion time and retarding the carbohydrates absorption in the intestine. To date, all α-Glu inhibitor drugs have demonstrated efficacy and safety in randomized controlled clinical trials. In addition to effectiveness, the definition of optimal therapeutic effect must be based on safety. However, studies have shown that several α-Glu inhibitors used in the clinic still have gastrointestinal adverse effects, including flatulence, abdominal discomfort, and gastrointestinal spasm pain [8,9]. Therefore, to ensure the treatment effect and minimize adverse effects, the dosage of drug is often adjusted according to the needs of the patient. In this case, it is significant to develop simple and facile methods with low-cost for performing therapeutic monitoring.
Spectrophotometry is the most commonly used method for screening inhibitors of α-Glu using p-nitrophenol glucopyranoside as the enzyme substrate [10]. However, this method is susceptible to interference from the absorption peak at 400 nm of the sample, which hindered its application. Currently, there are many other approaches developed for the screening of α-Glu inhibitors, including capillary electrophoresis [11], high performance liquid chromatography-mass spectrometry [12], electrochemical [13], colorimetric [14], and fluorescent methods [15]. Most of these methods are based on nanomaterials that require long-term synthesis, complex manipulation and purification steps, and bulky and expensive equipment, which increase the cost of testing and are not available to the public all over the world.
In recent years, considerable efforts have been devoted to developing portable, simple, low-cost, and user-friendly detection methods that allow people to quickly take care of themselves without advanced instrument, especially in developing countries and resource-limited areas. The personal glucose meter (PGM), one of the most commercially successful sensors, has improved the quality of life of people with diabetes worldwide [16]. As compared to other devices, the advantages of PGM are their portability, low cost, environmental friendliness, and ease of operation [17,18]. Most importantly, PGM can be widely used and will bridge the gaps between people living in urban areas and remote rural areas regarding access to medical diagnosis [19]. PGM was initially used to measure the blood glucose of diabetic patients. Recently, PGM-based measurement of other non-glucose analytes has attracted wide attention, including heavy metal ions, aflatoxin, DNA, enzymes, dopamine, and protein [17,20,21,22,23,24]. Most of the published methods utilize mediators that are closely related to the glucose concentration (such as invertase) or another mediator that can bind the mediator (such as invertase) to non-glucose targets to achieve PGM measurement. For example, Chen et al. [25] fabricated a portable antibody-free sandwich assay for the quantitative detection of chloramphenicol based on PGM. In the study, invertase was linked to the β-cyclodextrin to form β-cyclodextrin/invertase polymer bioconjungate, and a magnetic molecularly imprinted probe was synthesized by using 2,2-dichloroacetamide as the template. Finally, the limit of detection for chloramphenicol is about 0.16 ng/mL. Fang et al. [26] developed a sensitive and portable biosensor for the quantitative detection of DNA using nanogold-functionalized poly(amidoamine) (PAMAM) dendrime composites and PGM. In the study, invertase was linked to the DNA nanogold-functionalized PAMAM, and the signal DNA undergoes a strand displacement reaction with the target DNA. Finally, the limit of detection for the target DNA sequence is 0.26 pM. Another way of expanding the application of PGM is to establish a direct redox reaction relationship with the mediator in the glucose test strip. For example, a PGM method was developed for the direct determination of hydrogen peroxide and hypochlorite by us [27]. Acetylcholinesterase catalyzes the hydrolysis of acetylthiocholine iodide (ATCI) to generate thiocholine iodide, which triggers the reduction of K3[Fe(CN)6] to K4[Fe(CN)6] in the glucose test strips and generates a PGM detectable signal. The PGM readout can be reduced after the hydrogen peroxide or hypochlorite was pre-incubated with the ATCI. The limits of quantitation are 1.7 mM and 0.9 mM for hydrogen peroxide and hypochlorite, respectively. Enzyme cascades have sparked tremendous attention in bioanalysis. The coupled biocatalysis can generate extremely amplified signals, enabling quantitative detection of trace targets. For example, Zhang et al. [28] developed versatile enzyme cascade-based colorimetric bioassays for the ultrasensitive detection of diabetes-related glucose. Zhou et al. [29] developed a hybrid nanozyme cascade system with high reaction selectivity, which can transform the substrate into the targeted product by more than 2000 times.
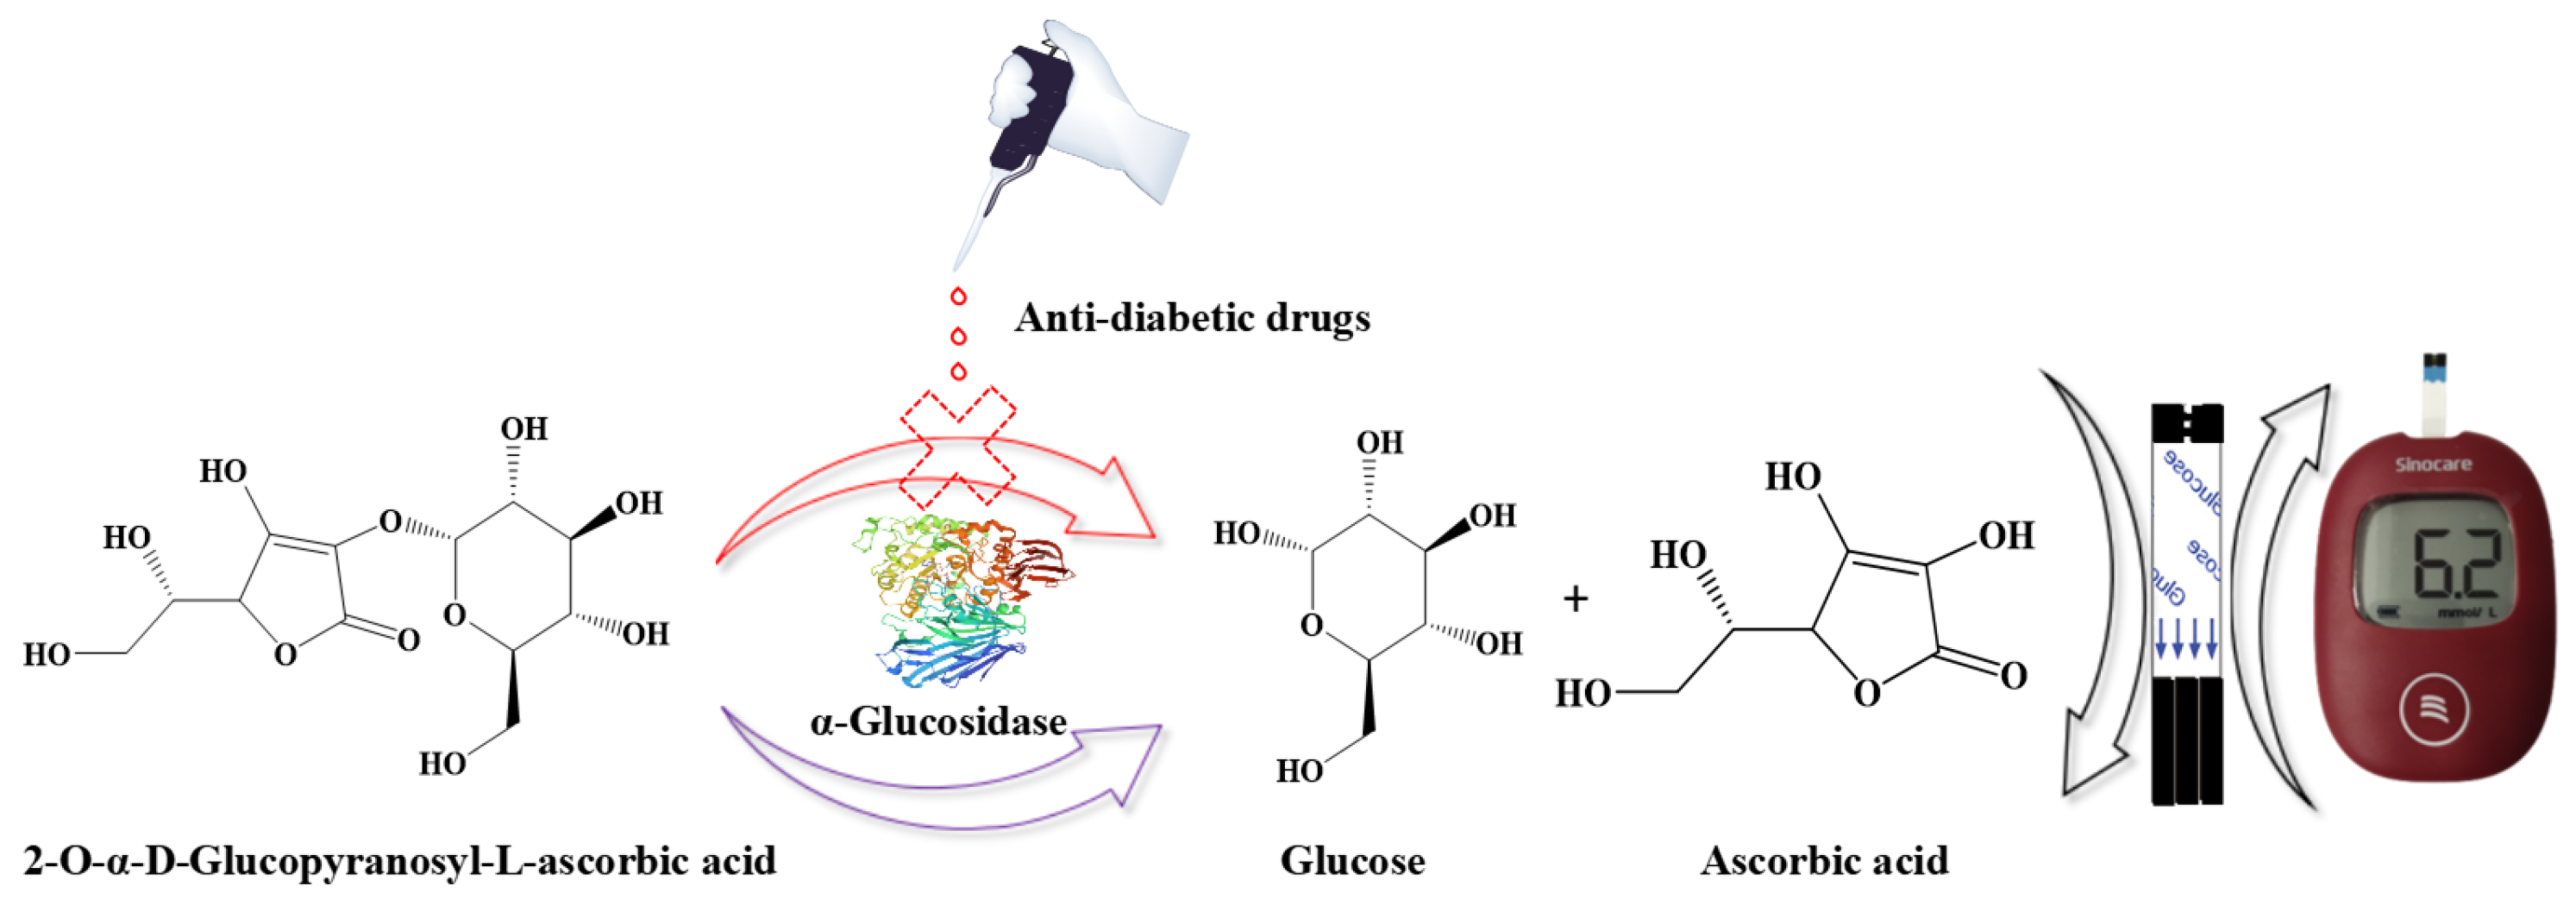
Ascorbic acid (AA) has a strong reducing property, which can reduce K3[Fe(CN)6] to K4[Fe(CN)6]. The 2-O-α-D-Glucopyranosyl-L-ascorbic acid (AA-2G) has been extensively studied as a substrate of α-Glu [30,31]. In this study, a simple and facile bioanalytical method for the acarbose and migliol determination was developed based on α-Glu catalyzing the hydrolysis of AA-2G in PGM. As shown in Figure 1, α-Glu catalyzes the hydrolysis of AA-2G to produce glucose and AA, and the glucose can be catalyzed by FAD-dependent glucose dehydrogenase in glucose test strips. Meanwhile, AA can trigger the reduction of K3[Fe(CN)6] to K4[Fe(CN)6] through redox reaction. Afterwards, K4[Fe(CN)6] is re-oxidized in the glucose test strips to generate PGM detectable signals. When the anti-diabetic drugs (such as acarbose and miglitol) are added in the reaction mixtures, the activity of α-Glu will be inhibited, resulting in the decrease in products and a lower PGM readout. Thus, acarbose and migliol can be detected without any additional modifications of the PGM, α-Glu, and substrate, as well as the complex manipulation and purification steps, bulky, and expensive equipment. Finally, the developed PGM method was used to detect acarbose and migliol in normal human serum for validating its applicability in real sample analysis.
2. Materials and Methods
2.1. Materials and Reagents
The α-Glu (754,360 U/mL, liquid), L-arginine hydrochloride, L-lysine hydrochloride, L-hisidine monohydrocholoride, L-serine hydrochloride, and L-glutamic acid monosodium salt were purchased from Shanghai Yuanye Biological Technology Co., Ltd. (Shanghai, China). AA-2G was purchased from Shanghai Macklin Biochemical Co., Ltd. (Shanghai, China). Normal human serum was purchased from Beijing Solarbio Science & Technology Co., Ltd. (Beijing, China). Miglitol and acarbose were purchased from Shanghai Bidepharm Technology Co., Ltd. (Shanghai, China). Sodium acetate trihydrate was purchased from Shanghai Titan Scientific Co., Ltd. (Shanghai, China). AA and glacial acetic acid (≥99.5%) were purchased from Chengdu Chron Chemicals Co., Ltd. (Chengdu, China). Glutathione was purchased from Sigma-Aldrich (Shanghai, China) Trading Co., Ltd. (Shanghai, China).
2.2. Instrumentation
The PGM of Sannuo + (glucose detection ranges: 1.1–33.3 mM) and glucose test strips (the sample detection area of the glucose test strip contains potassium ferricyanide and FAD-dependent glucose dehydrogenase) were purchased from Sinocare Inc. (Changsha, China). The pH of solution was measured by a FE28-standard pH meter (Mettler-Toledo Instruments, Shanghai, China). The UC-2H ultrasonic cleaner was purchased from Shanghai Titan Scientific Co., Ltd. (Shanghai, China).
2.3. Preparation of Solutions and Samples
The buffer was prepared by dissolving 10.0 mM sodium acetate trihydrate in ultrapure water and the required pH was adjusted by glacial acetic acid. The α-Glu was diluted 800 times by sodium acetate buffer (10.0 mM, pH = 5.0). AA-2G (42.0 mM) solution was prepared by dissolving 7.1 mg of AA-2G in 0.5 mL sodium acetate buffer (10.0 mM, pH = 5.0) and protected from light. Acarbose and miglitol were prepared by dissolving them in sodium acetate buffer (10.0 mM, pH = 5.0) with the final concentration of 1.0 mM, respectively.
2.4. Detection of the Anti-Diabetic Drugs Using PGM Method
First, 1.0 μL of α-Glu was pre-incubated at 40 °C for 3.0 min with the anti-diabetic drugs before the enzymatic reaction. Then, 1.0 μL of AA-2G (42.0 mM) solution was added to initiate the enzymatic reaction and incubated for 5.0 min at 40 °C; the concentration of product was measured by the PGM within 5 s. With different amounts of anti-diabetic drugs, different PGM readout values were obtained. Then, the interferences from the sample matrixes were eliminated by subtracting the background of the PGM readout. Finally, comparisons were made with the PGM readout obtained without the addition of antidiabetic drugs. All tests in this study were repeated at least three times, and the data are shown as mean ± standard deviation. The percentage of inhibition I(%) can be calculated through Equation (1).
where It and I0 are the PGM readout with and without the anti-diabetic drug, respectively. Ib represents the PGM readout of the background sample.
The Z’ factor is an index to evaluate the performance of the developed PGM method for portable monitoring of anti-diabetic drugs, which is calculated by Equation (2).
where μs and μc represent the PGM signal of standard (s) (without inhibition) and the negative (c) group (100% inhibition by the anti-diabetic drug), respectively. The σs and σc represent the standard deviations of the PGM signal of the standard and the negative (c) group, where 100% inhibition indicates that μc = 0; Equation (2) is simplified to Equation (3). The developed PGM method is accurate and reliable when the value of the Z’ factor is higher than 0.5.
2.5. Determination of the Anti-Diabetic Drugs in Human Serum
Before analysis, the human serum was diluted two times with sodium acetate buffer without any sample cleaning-up step. Spiked samples were prepared by diluting high concentrations of the anti-diabetic drugs with the desired amount of human serum sample. The interferences from the sample matrixes were eliminated by measuring and subtracting the background PGM readout. The solution without α-Glu served as the background solution and was measured by the PGM. In brief, 1.0 μL of spiked sample was measured by PGM. Then, 1.0 μL of spiked samples was mixed with 1.0 μL of sodium acetate buffer (10.0 mM, pH = 5.0) and 1.0 μL of AA-2G solution, which was detected by the PGM.
3. Results and Discussion
3.1. The Principle of the Anti-Diabetic Drugs Detection
As shown in Figure 1, α-Glu catalyzes the hydrolysis of AA-2G to produce glucose and AA, and the glucose is oxidized by glucose dehydrogenase in glucose test strips. Meanwhile, AA can trigger the reduction of K3[Fe(CN)6] to K4[Fe(CN)6] through a redox reaction. Both of the above pathways can form electrons to generate the PGM-detectable signal. When the anti-diabetic drugs (such as acarbose and miglitol) are added in the reaction mixtures, the activity of α-Glu can be inhibited, which results in the decrease in products and a lower PGM readout. Thus, the determination of acarbose and migliol can be achieved without any additional modification to the PGM, α-Glu, and substrate.
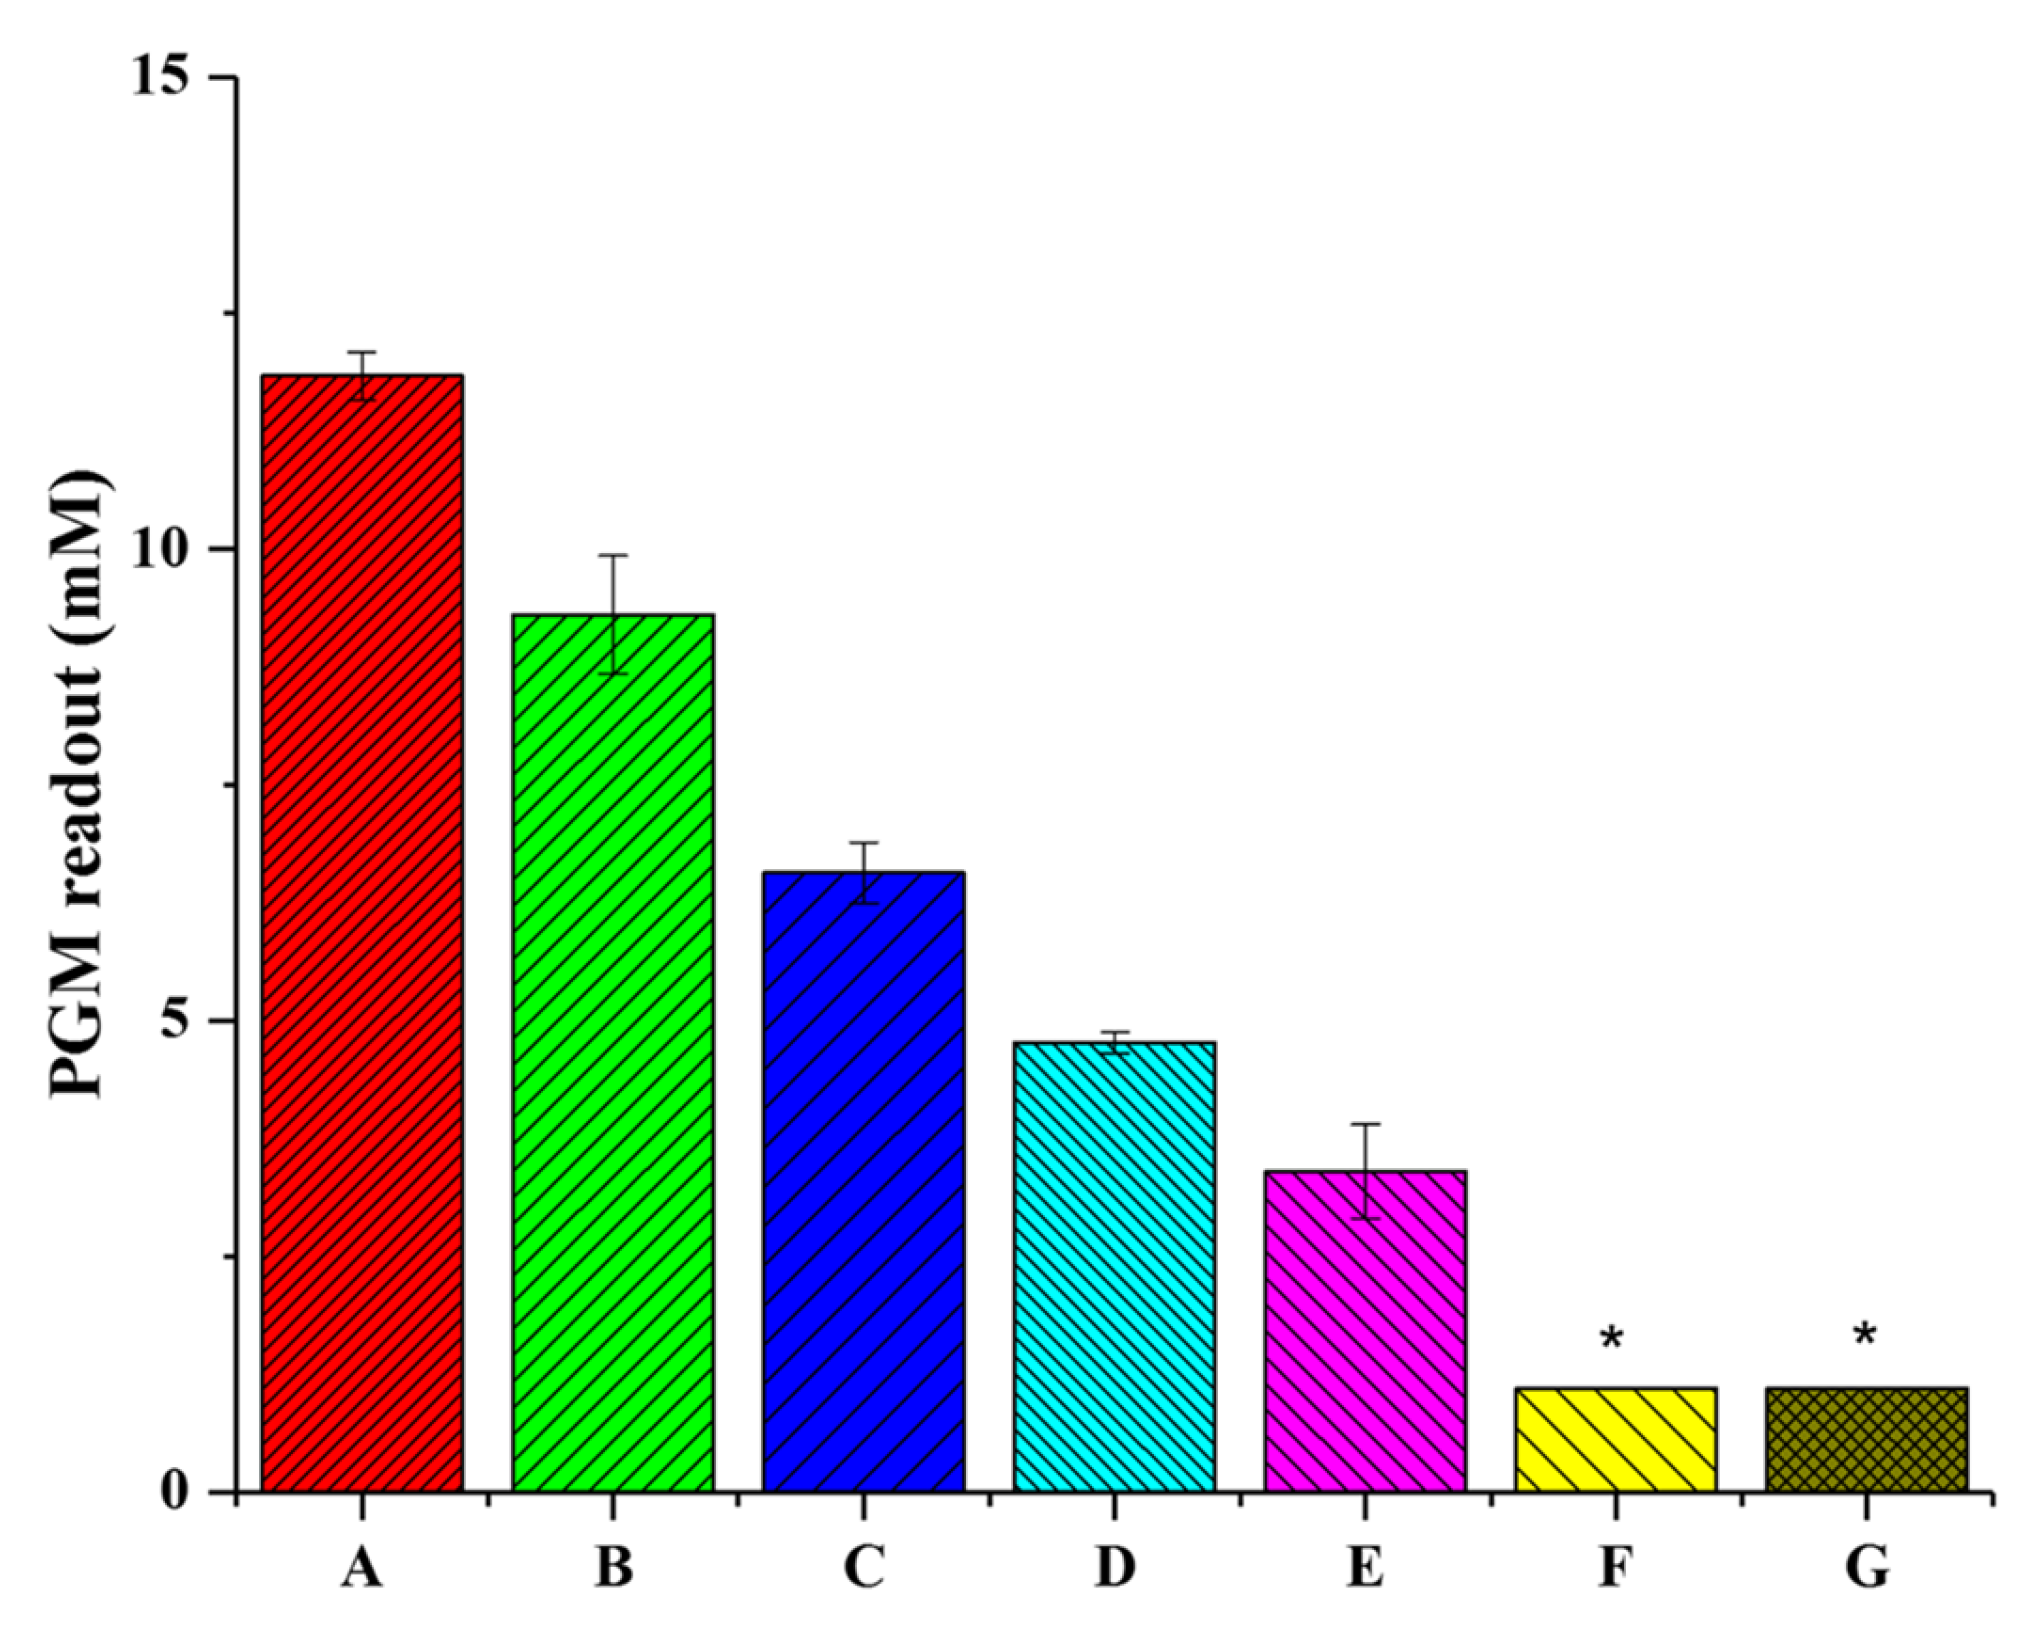
To verify the feasibility of the principle using PGM for the monitoring of anti-diabetic drugs based on the AA-2G-mediated reaction, seven solutions were measured using PGM. As shown in Figure 2, the PGM readout is (6.5 ± 0.3) mM after AA-2G is added to the α-Glu solution and incubated for 15.0 min (Figure 2C). After α-Glu is pre-incubated with the anti-diabetic drugs at 40 °C for 3.0 min, 1.0 μL of AA-2G solution was added to the enzymatic reaction solution and incubated for 5.0 min at 40 °C; then, the PGM readout was decreased to (4.7 ± 0.1) mM (Figure 2D). The PGM readout of the AA-2G or α-Glu + acarbose solutions (Figure 2F or Figure 2G) are all L0 (L0 value means PGM readout < 1.1 mM). On the other hand, the PGM readouts of AA and glucose at the same molar concentration were determined as (9.3 ± 0.6) mM and (3.4 ± 0.5) mM (Figure 2B,E), respectively. Thus, AA contributes more to the PGM readout. Moreover, the PGM readout indicated that the co-existence of AA and glucose (molar ratio of 1:1) was (11.8 ± 0.3) mM (Figure 2A). Therefore, the co-existence of AA and glucose had little effect on the PGM readout. These results indicate that it is feasible to detect an anti-diabetic drug using the PGM method based on an AA-2G-mediated reaction.
3.2. Optimization of the Experimental Conditions
The main experimental factors were investigated and optimized using acarbose as an example, including the effect of AA-2G concentration (6.0–22.0 mM) on the PGM readout, the relationships between percentage of inhibition and the enzymatic reaction time (5.0–15.0 min), as well as AA-2G concentration (10.0–14.0 mM) and inhibition time (0.0–7.0 min), to acquire an effective PGM-based method for monitoring the anti-diabetic drugs.
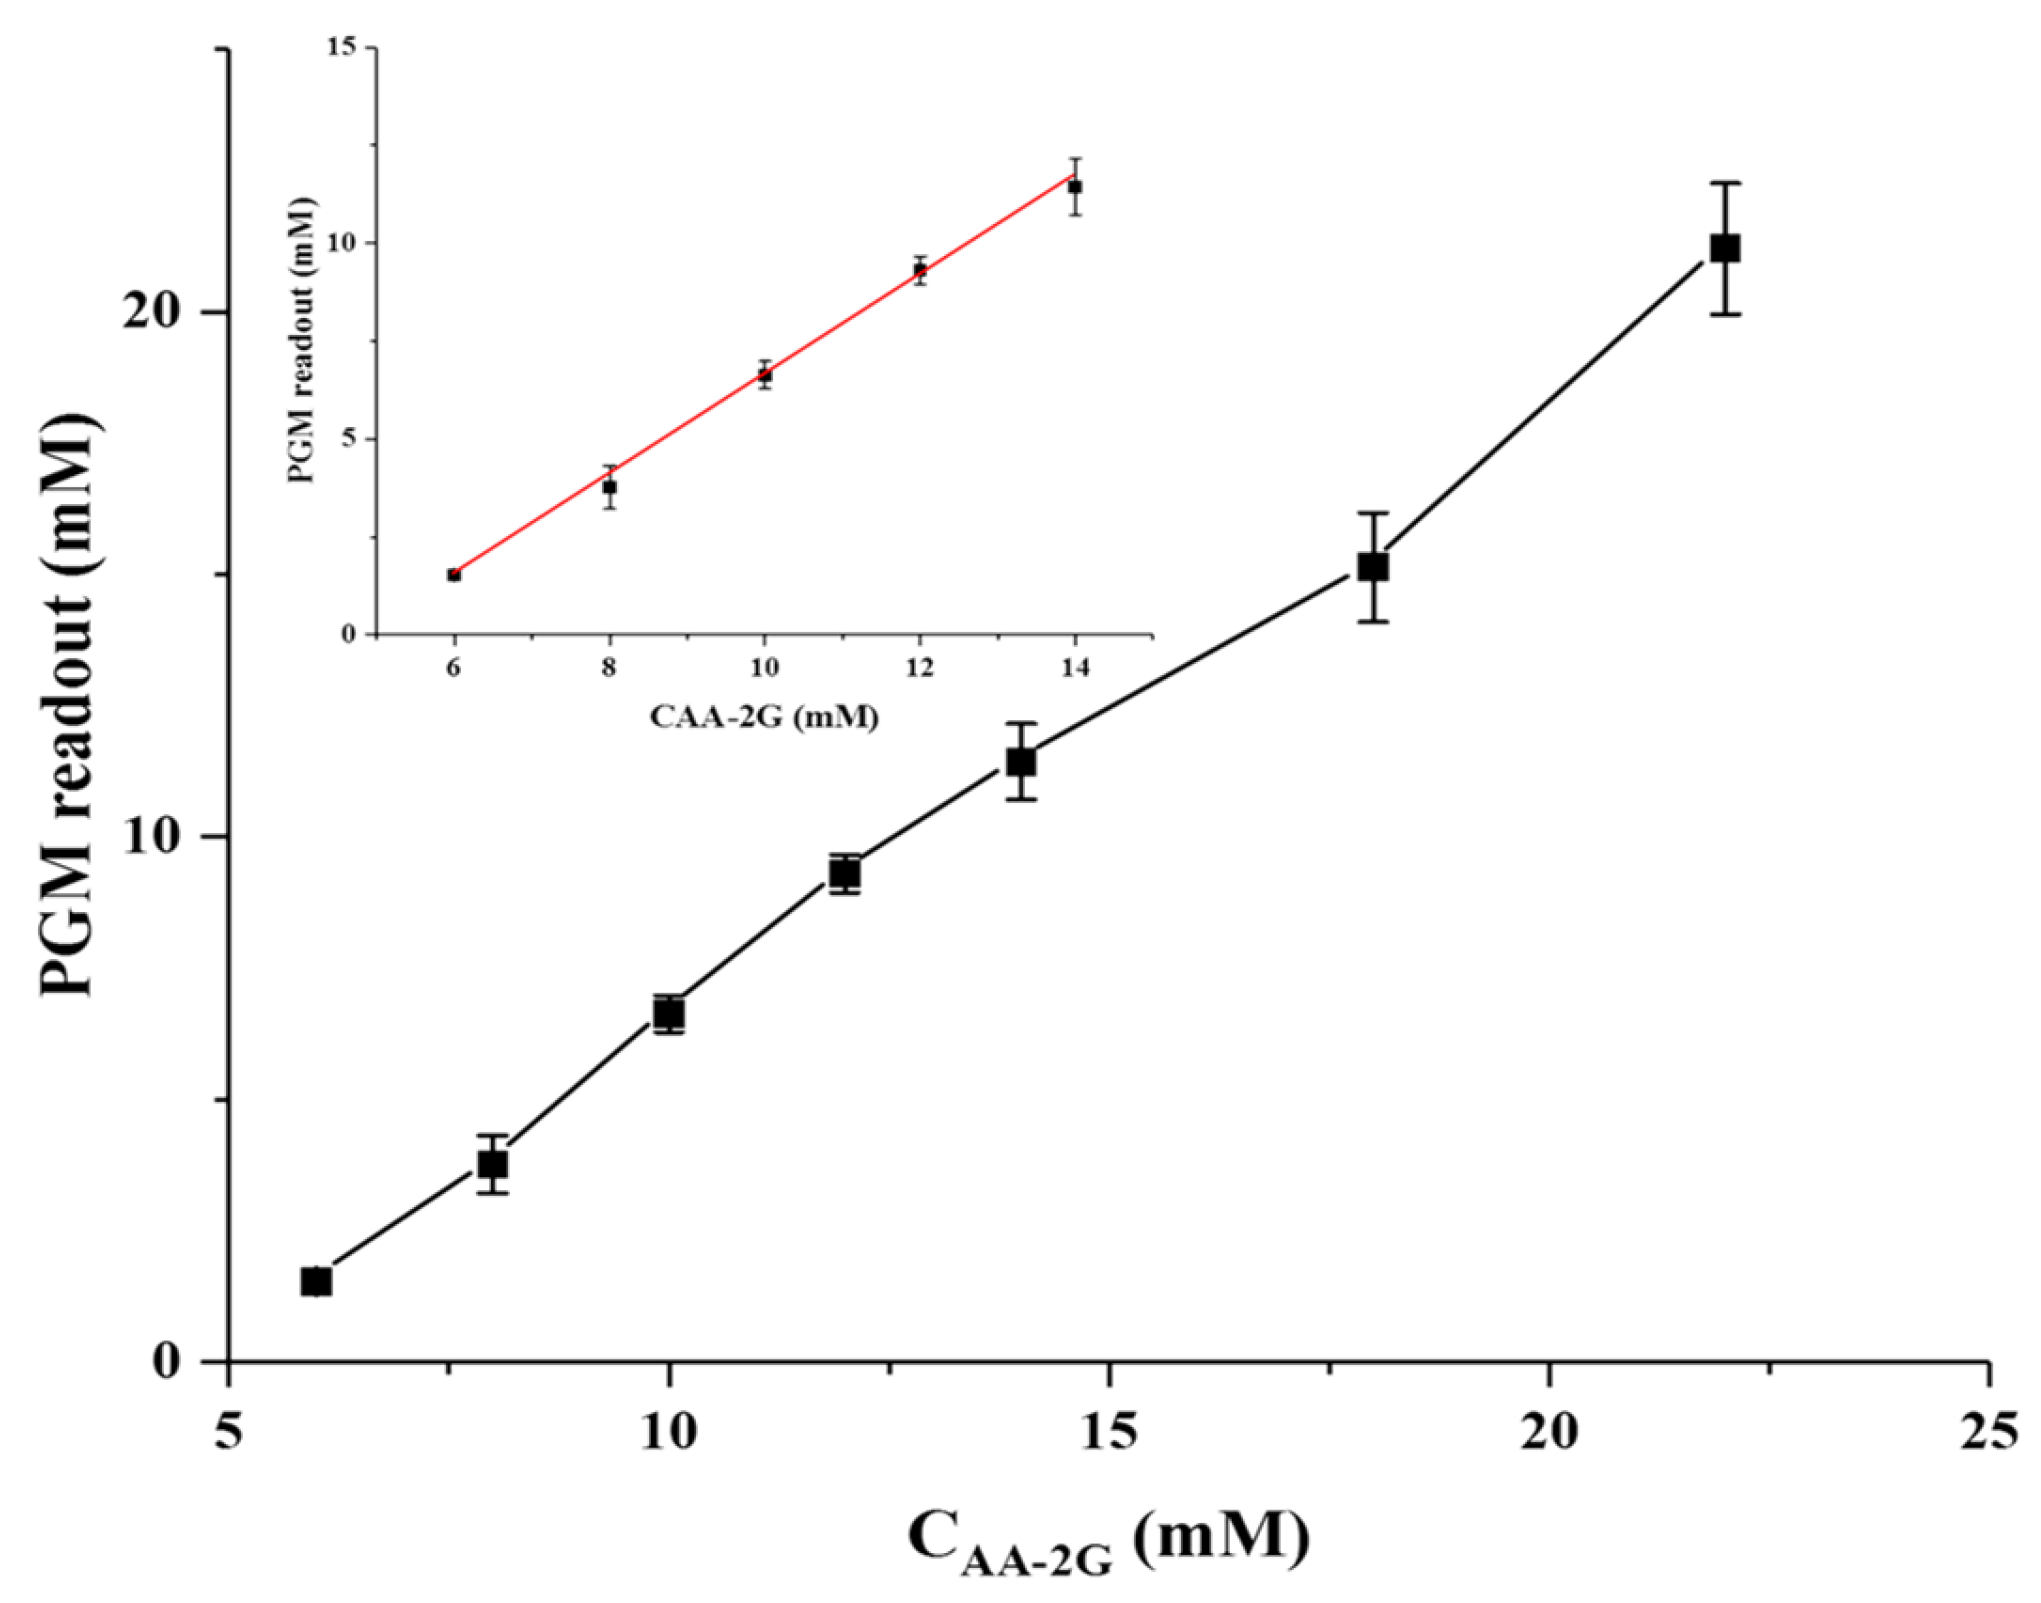
AA-2G concentration is important in the PGM method for monitoring the anti-diabetic drugs. With AA-2G in the α-Glu solution, AA and glucose will be produced, which will cause the increase in PGM readout. As shown in Figure 3, it was found that the PGM readout increased with the increase in the AA-2G concentration. Moreover, the PGM readout shows a good linear relationship with the concentration of AA-2G in a range from 6.0 to 14.0 mM and the regression equation of the PGM readout = 1.2729 × CAA-2G (mM) − 6.1057 (R2 = 0.9993). The results demonstrate that the developed PGM method is feasible to measure the products of glucose and AA. Therefore, an AA-2G concentration of 6.0 to 14.0 mM was chosen for the following experiments.
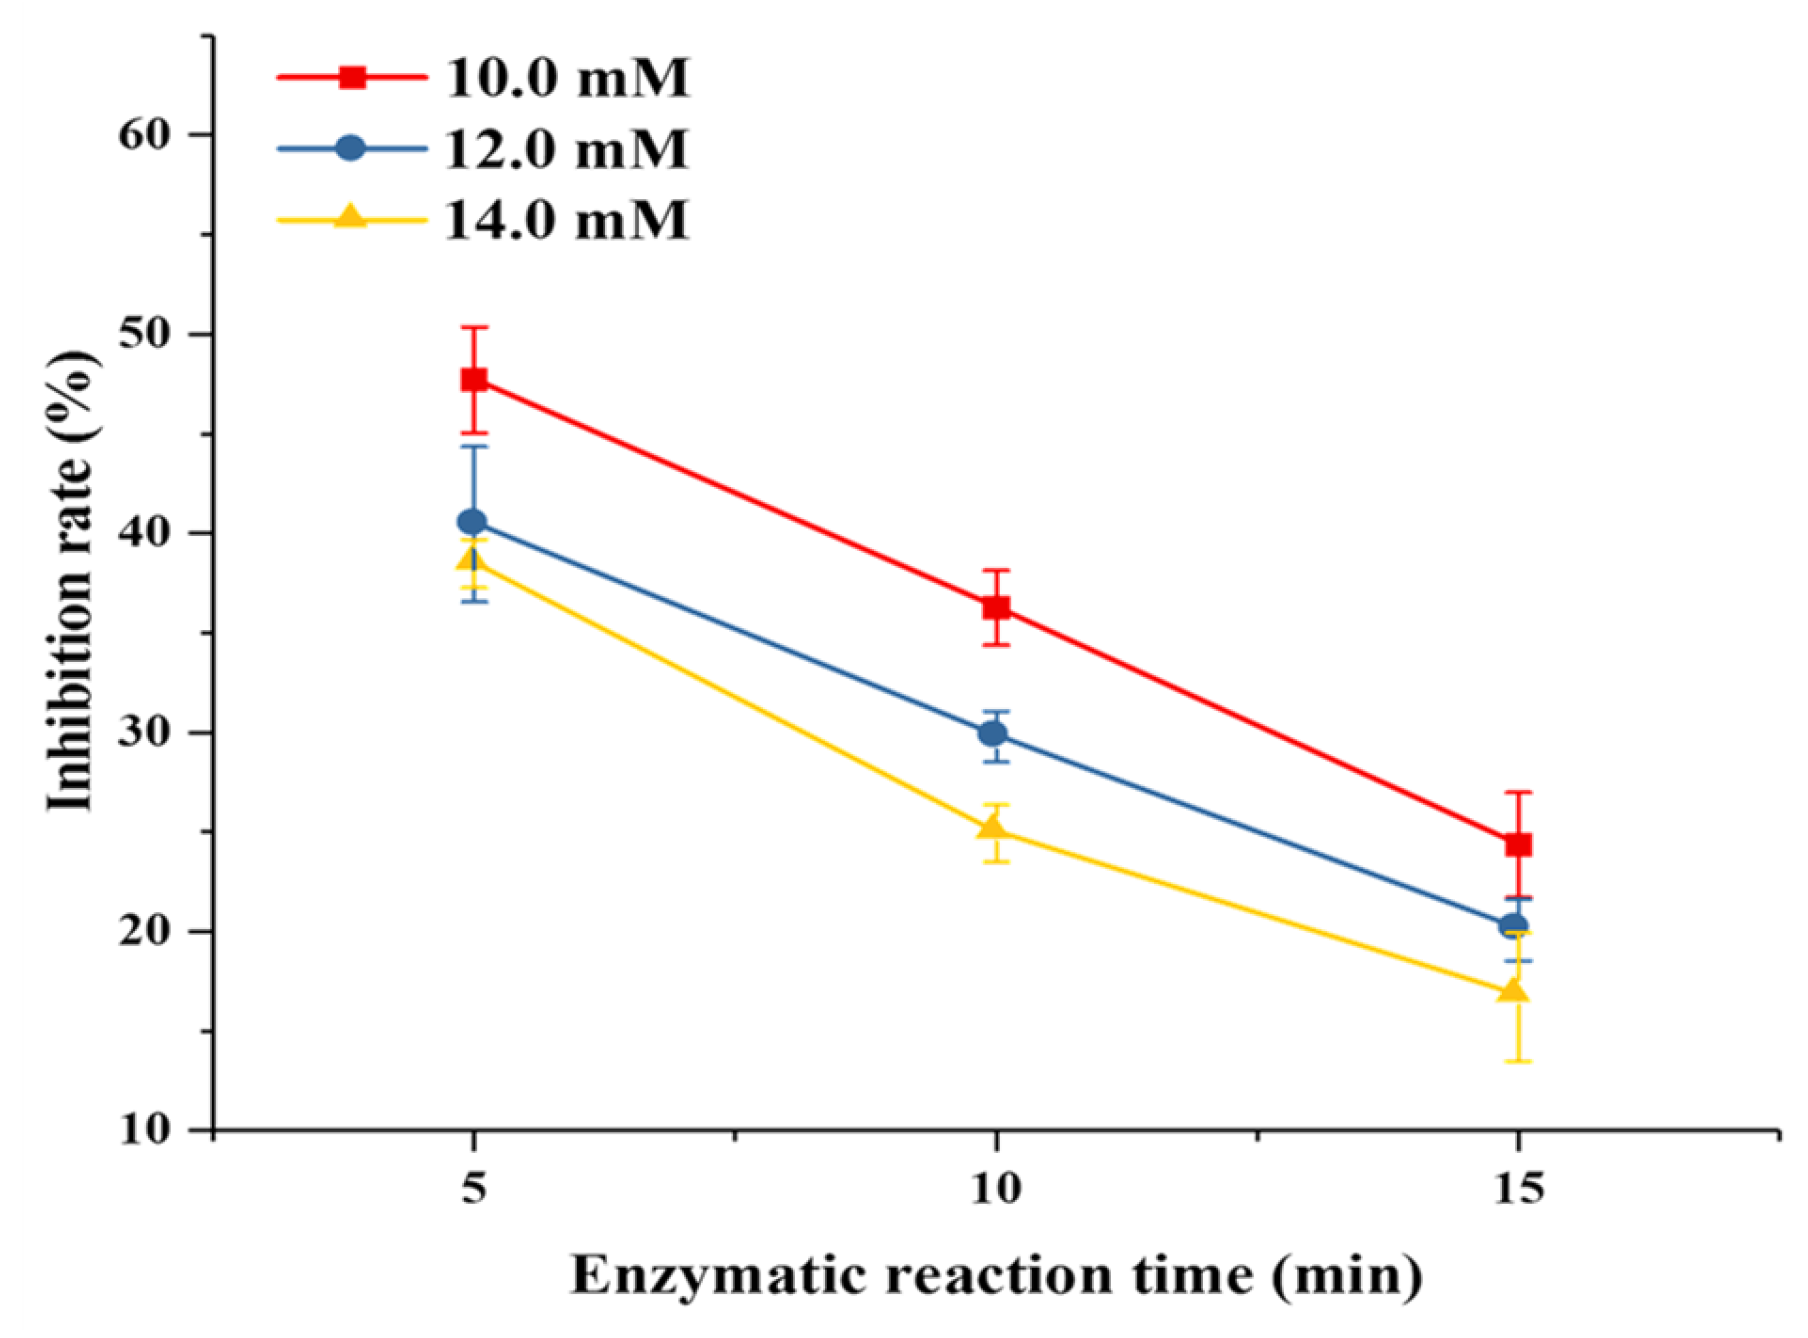
As shown in Figure 4, the enzymatic reaction can generate enough products for a PGM readout in the concentrations of AA-2G from 10.0 to 14.0 mM after incubation for 5.0 min. The percentage of inhibition decreases with the increase in the enzymatic reaction time and AA-2G concentration. Therefore, the enzymatic reaction time of 5.0 min was selected for the next study. On the other hand, the PGM readout in 10.0 mM and 12.0 mM of AA-2G are 2.2 mM and 3.0 mM after incubation for 5.0 min, respectively, and the PGM readout in 14.0 mM of AA-2G is 4.8 mM. Therefore, considering the analytical performance, the concentration of AA-2G at about 14.0 mM was used for the further study.
As shown in Figure 5, the PGM readout decreases with the increase in inhibition time from 0 to 3.0 min, while the PGM readout almost remains constant after inhibition for 3.0 min. Therefore, the inhibition time of 3.0 min was selected for the next study.
3.3. Determination of Anti-Diabetic Drugs by the PGM Method
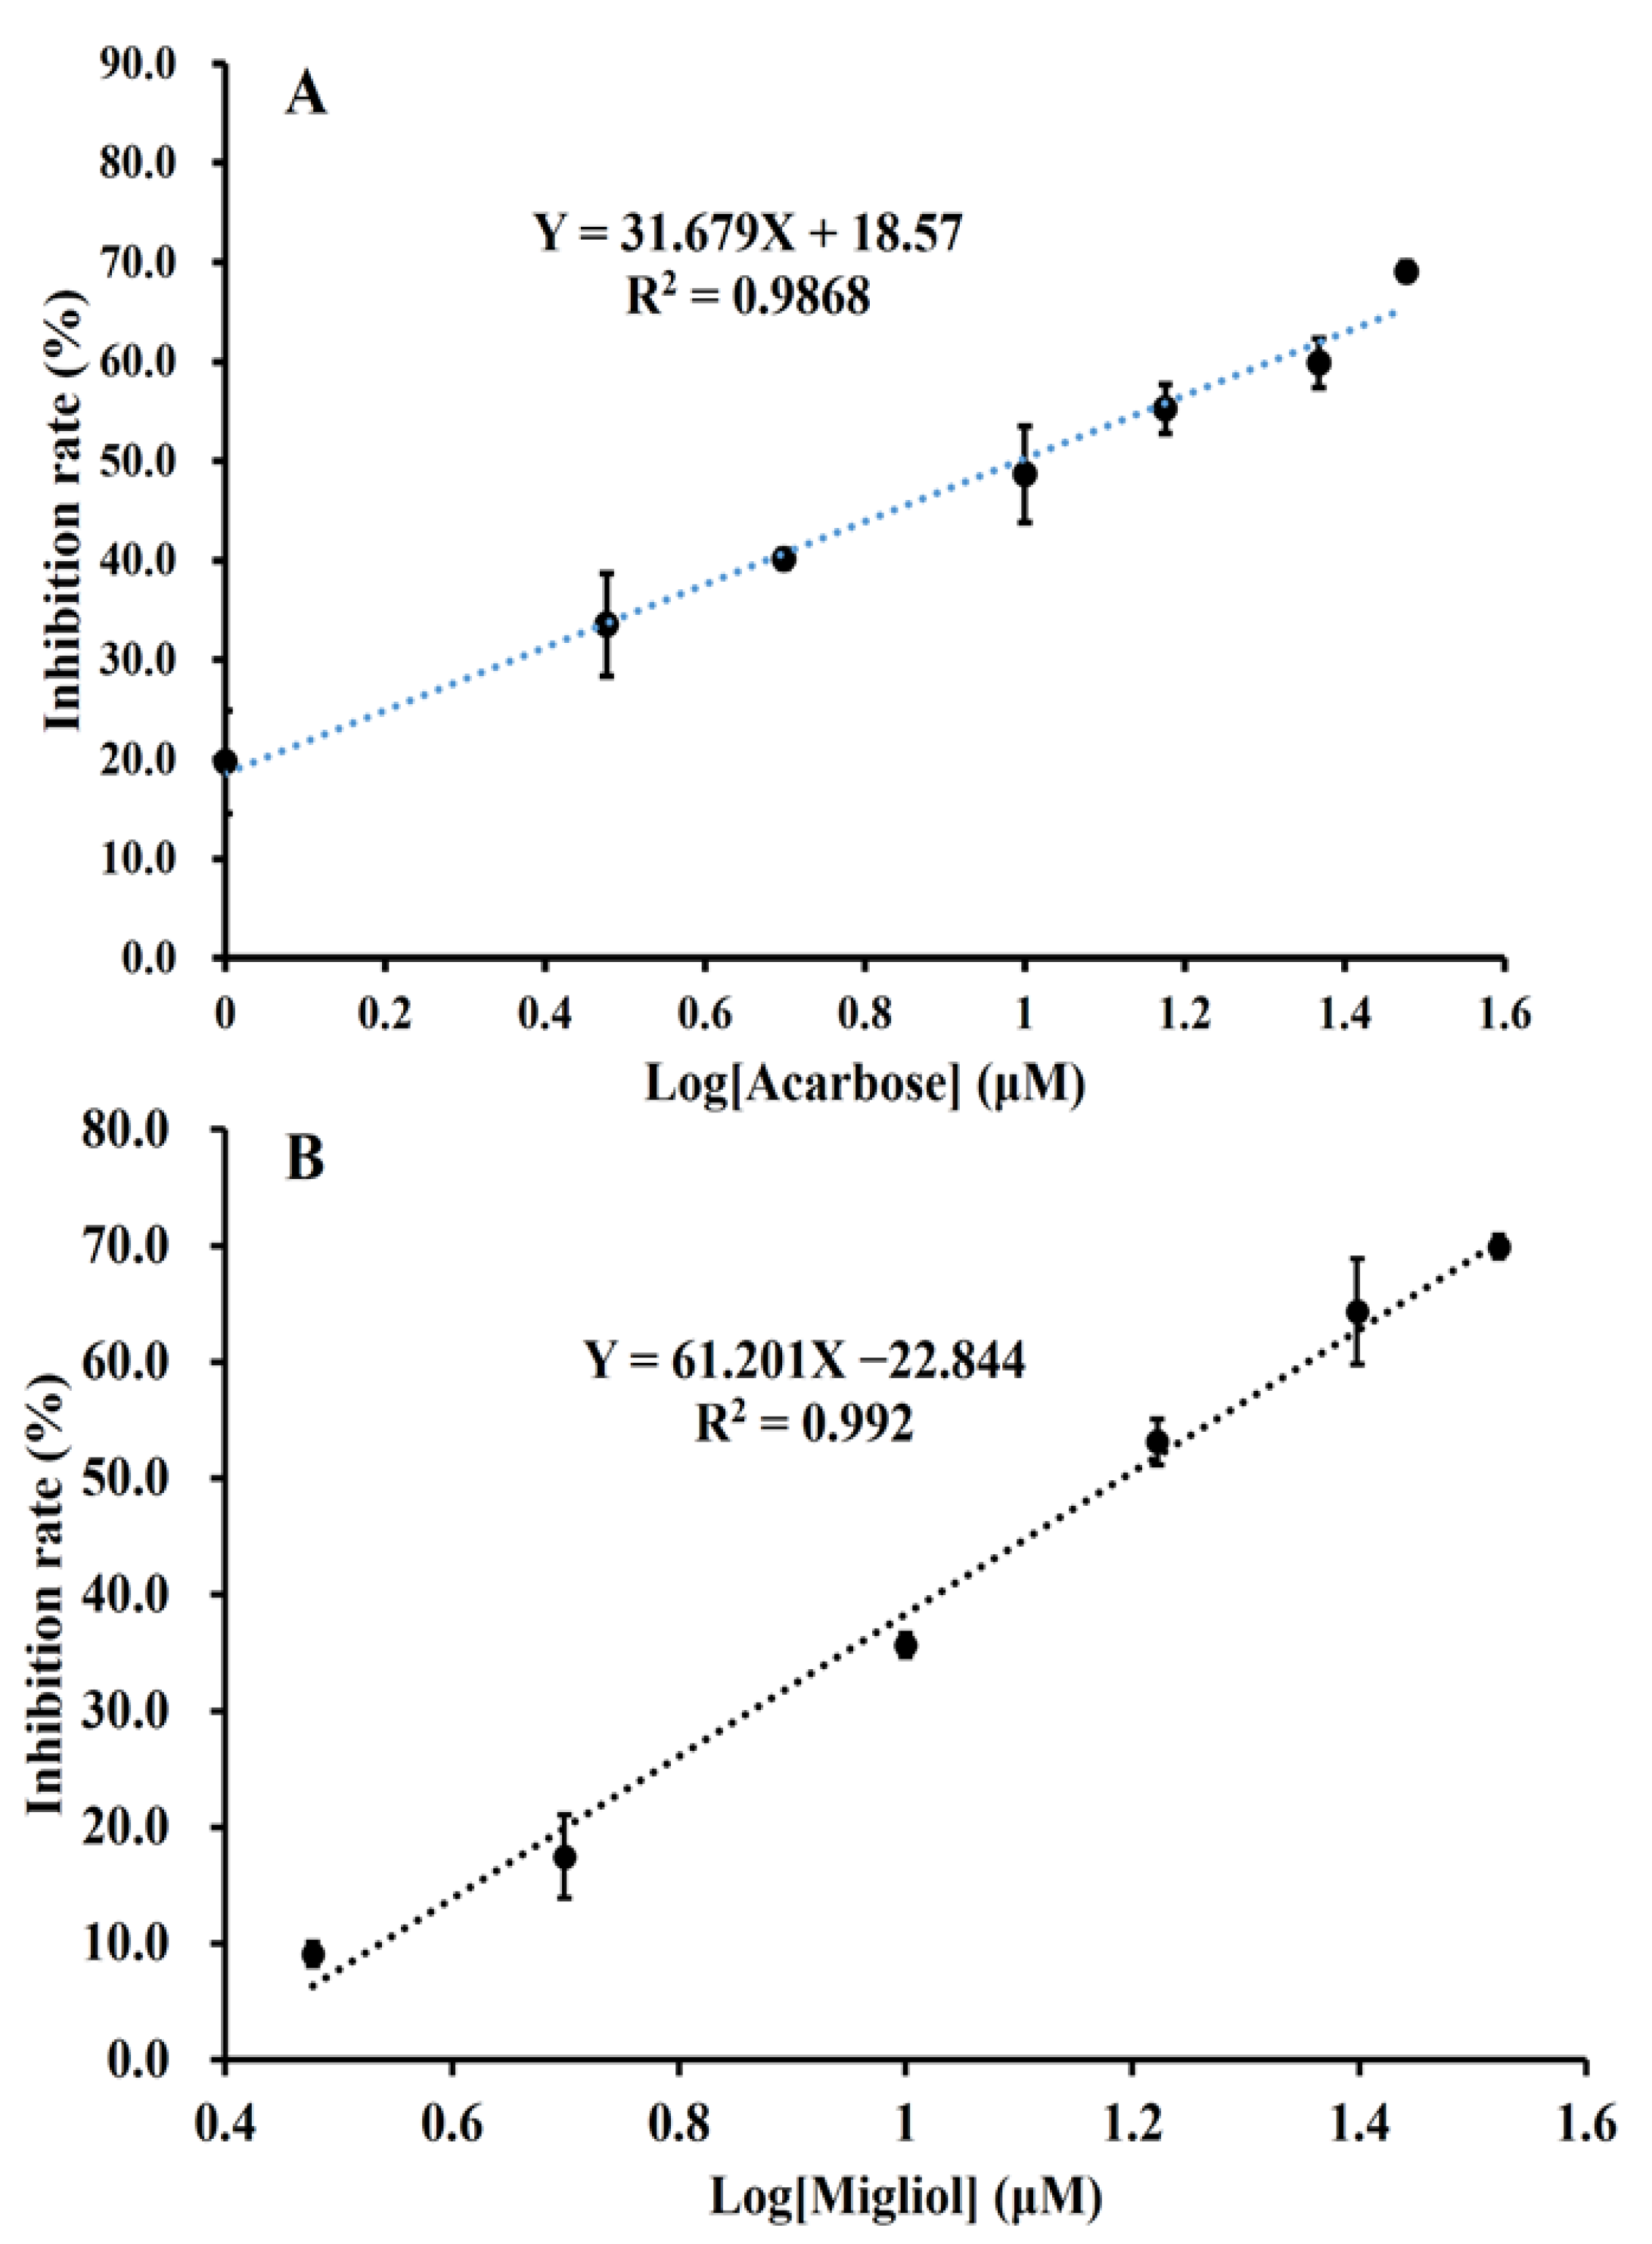
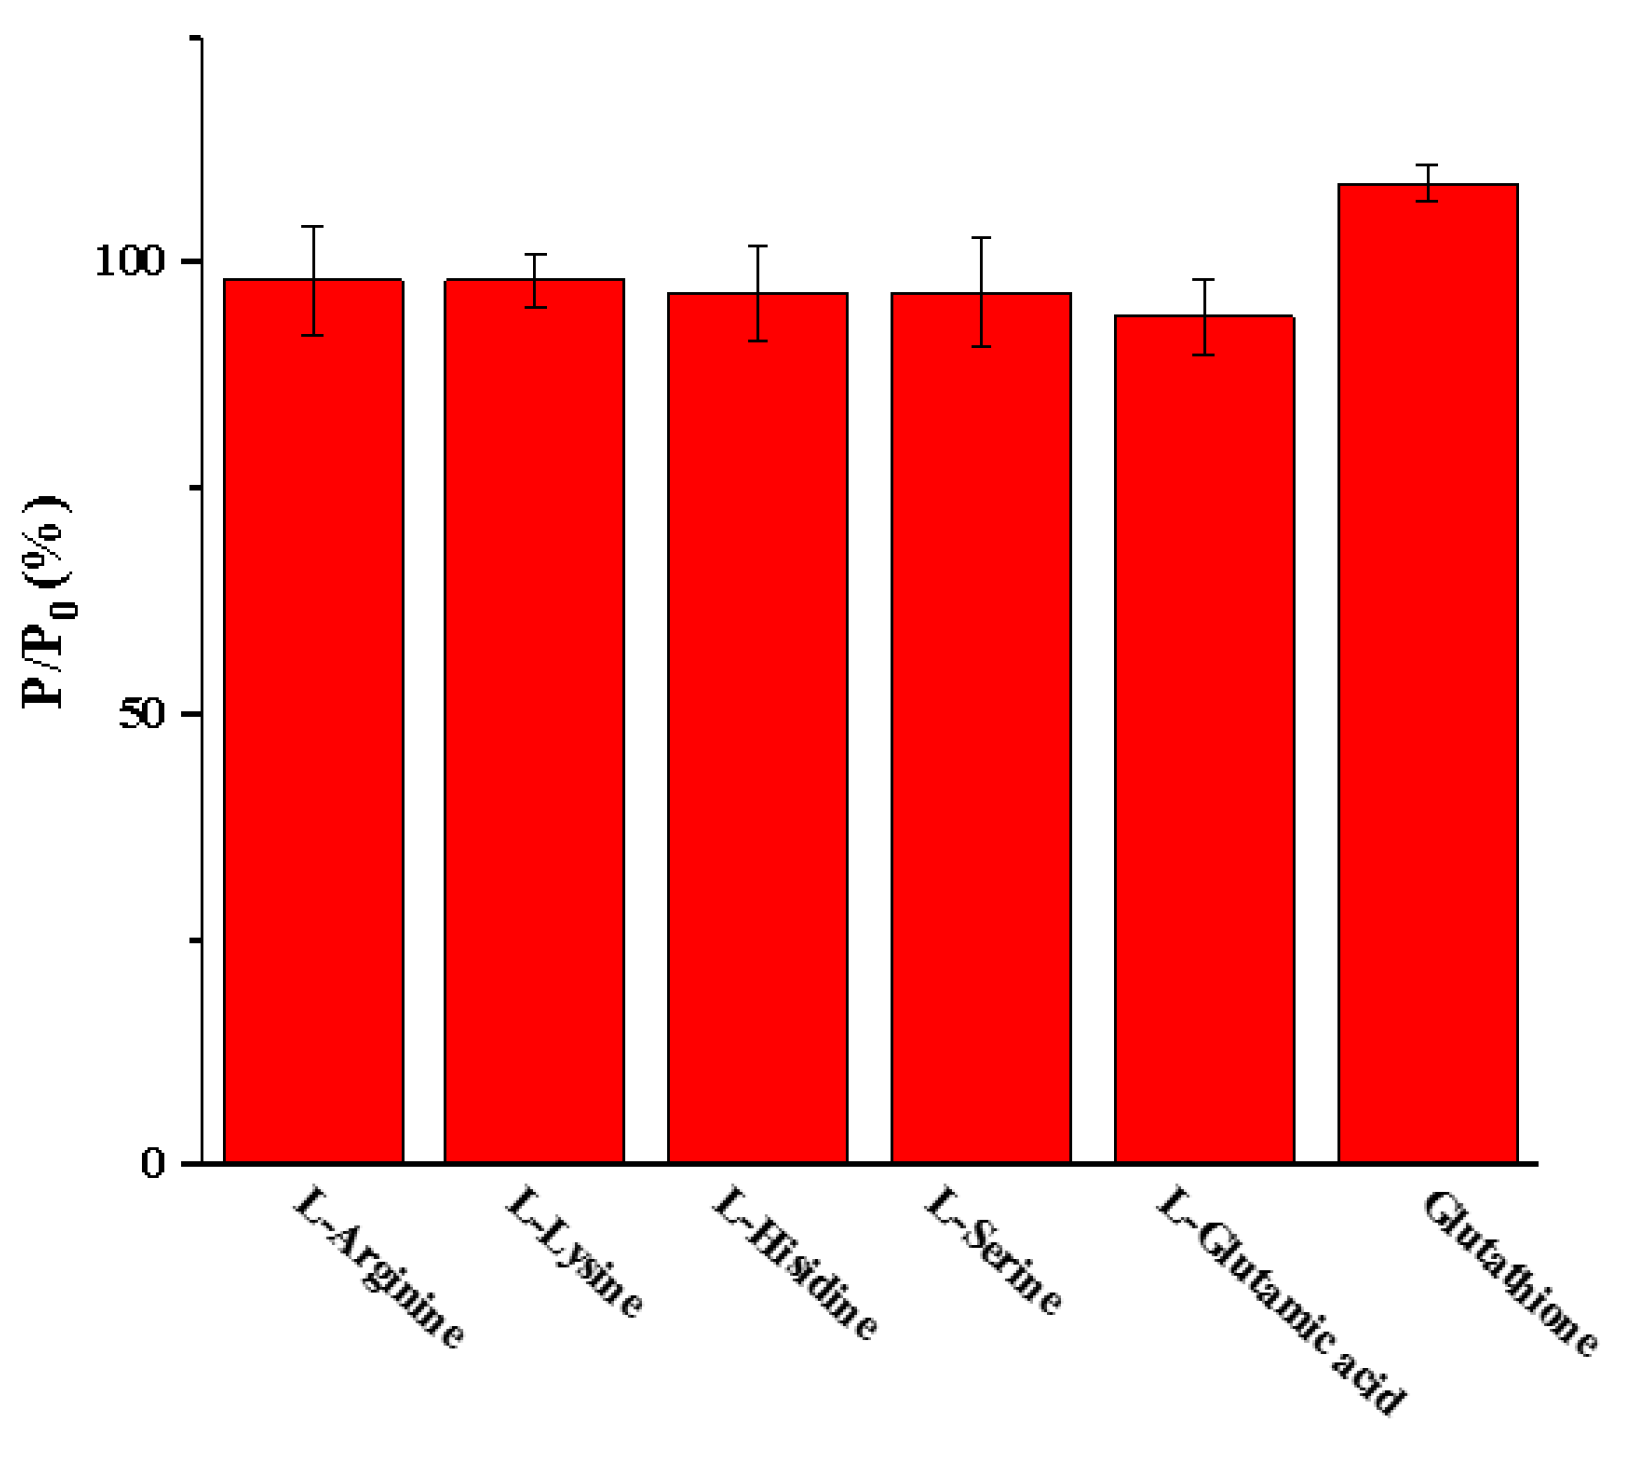
The repeatability of the PGM method for the portable monitoring of anti-diabetic drugs was investigated based on the relative standard deviation (RSD) of the PGM readout. The run-to-run repeatability using a batch (n = 5) of glucose test strips was calculated to be 2.8%. The repeatability using different batches (n = 5) of glucose test strips was calculated to be 4.5%. The Z’ factor was determined to be 0.84 (n = 8) according to Equation (3), which indicates that the developed method is precise and reliable. The anti-diabetic drugs can be detected based on the PGM method, as they can inhibit the activity of α-Glu through reducing the production of AA and glucose. With less anti-diabetic drugs, more AA and glucose will be produced, and the inhibition rate (%) of anti-diabetic drugs can be easily calculated through the variation of PGM readout. Under the optimized conditions (314.3 U/mL of α-Glu, 5.0 min of incubation time, 14.0 mM of AA-2G, 3.0 min of inhibition time), the anti-diabetic drugs with different concentrations were pre-incubated with α-Glu before the enzymatic reaction. Followed by the AA-2G catalytic reaction, the variations of PGM readout were recorded. Based on the relationship between inhibition rate (%) and anti-diabetic drugs concentration, the calibration curve can be plotted. As shown in Figure 6A, the inhibition rate (%) of acarbose on α-Glu increases gradually with the increase in the concentration of acarbose. The inhibition rate (%) vs. Log[acarbose] presents excellent linear dependence in the range of 1.0–30.0 μM with the regression equation of Y = 31.679 × Log[acarbose](μM) + 18.570 (R2 = 0.9868). The limit of detection of acarbose is 0.33 μM (Inhibition rate (%) is 13.1 ± 3.4, n = 3). The IC50 value is calculated to be 10.0 μM for acarbose, which is comparable to the reported literature with IC50 values (Table 1). In addition, using the developed PGM assay, the calibration plot for migliol was constructed (Figure 6B). The inhibition rate (%) vs. Log[migliol] presents good linear correlation in the range of 3.0–33.3 μM with the regression equation of Y = 61.201 × Log[migliol](μM) − 22.844 (R2 = 0.9920). The limit of detection of migliol is 1.0 μM (inhibition rate (%) is 4.9 ± 1.2, n = 3), and the IC50 value is calculated to be 16.0 μM. Compared to the other anti-diabetic drugs assays (Table 1), this method does not require expensive instrument, skilled operators, or a complicated synthesis process, but it offers a satisfactory linear range and limit of detection. To investigate the selectivity of the PGM determination method, the interferences with the concentration of 0.1 mg/mL were tested, and the relative values are shown in Figure 7. Because of the specificity of α-Glu, no obvious changes in the relative PGM readout were observed under the same conditions. This result confirms the satisfactory selectivity of the PGM method.
3.4. Detection of the Anti-Diabetic Drugs in Human Serum
The PGM method based on the AA-2G-mediated reaction was further tested by sample spiked recovery in human serum without a sample cleaning-up step to investigate its practical application. The recoveries (Table 2) of the acarbose in the human serum sample spiked with three different concentrations (final concentrations of 10.0, 20.0, and 30.0 μM) are in the range of 89.6–114.5%. On the other hand, the recoveries (Table 2) of the migliol in the human serum sample spiked with three different concentrations (final concentrations of 10.0, 20.0 and 30.0 μM) are in the range of 93.9–106.5%. The results indicate that the proposed strategy has the potential to be applied in the monitoring of anti-diabetic drugs. Typically, some additional methods are used to remove the sample matrix prior to analysis, such as solid-phase extraction techniques, but this process is complex and time consuming. In contrast, the increments of PGM readout used in this study allows us to use one touch with the sample to obtain the background readout and subtract it, which can be realized easily by an untrained person. This method does not require immobilization of the enzyme, chemical modification of the substrate, and customization of the PGM, highlighting an easily accessible and user-friendly method for the monitoring of acarbose and migliol.
4. Conclusions
In this study, a simple and portable acarbose and migliol detection method was developed based on α-glucosidase catalyzing the hydrolysis of AA-2G in PGM for the first time. The developed method does not require the design and manufacturing process of PGM nor any modification of enzyme or substrates. Furthermore, this strategy enjoys sensitivity by taking advantage of the two pathways to generate a PGM-detectable signal. The glucose is catalyzed by FAD-dependent glucose dehydrogenase in glucose test strips, and AA can trigger the reduction of K3[Fe(CN)6] to K4[Fe(CN)6] through redox reaction, which is conceptually different from the PGM methods for other non-glucose analyte detection. However, this method also has some disadvantages. First, the limited detection range of PGM of 1.1–33.3 mM may result in a narrow linear range of analyte. Second, the developed method has limited detection capability for trace-level analytes. Third, it is difficult to apply this method to the simultaneous analysis of multiple analytes. Finally, the determination of the anti-diabetic drugs in human serum sample by the developed PGM method was achieved with good recovery. In short, this study provides a simple and portable bioanalytical method for the monitoring of acarbose and migliol using PGM, which can be of great potential in therapeutic monitoring.
Author Contributions
H.Z.: Conceptualization, methodology, investigation, writing—original draft, funding acquisition. F.-Q.Y.: supervision, project administration, writing—review and editing. All authors have read and agreed to the published version of the manuscript.
Funding
This work was sponsored by Chongqing Medical and Pharmaceutical College, China (YGZ2021301).
Institutional Review Board Statement
Normal human serum used in this study was purchased from Beijing Solarbio Science & Technology Co., Ltd., Beijing, China, which is a biological product. Thus, not applicable to Ethics statement.
Informed Consent Statement
Not applicable.
Data Availability Statement
Not applicable.
Conflicts of Interest
The authors declare no conflict of interest.
References
- American Diabetes Association. Standards of medical care in diabetes-2013. Diabetes Care 2013, 36, S11. [Google Scholar] [CrossRef] [PubMed] [Green Version]
- Ogurtsova, K.; da Rocha Fernandes, J.; Huang, Y.; Linnenkamp, U.; Guariguata, L.; Cho, N.H.; Cavan, D.; Shaw, J.; Makaroff, L. IDF Diabetes atlas: Global estimates for the prevalence of diabetes for 2015 and 2040. Diabetes Res. Clin. Pract. 2017, 128, 40–50. [Google Scholar] [CrossRef] [PubMed] [Green Version]
- Hardie, D.G. Targeting an energy sensor to treat diabetes. Science 2017, 357, 455. [Google Scholar] [CrossRef] [PubMed] [Green Version]
- Warren, R.E. The stepwise approach to the management of type 2 diabetes. Diabetes Res. Clin. Pract. 2004, 65S, S3–S8. [Google Scholar] [CrossRef] [PubMed]
- American Diabetes Association. Diagnosis and classification of diabetes mellitus. Diabetes Care 2010, 33, S62–S69. [Google Scholar] [CrossRef] [Green Version]
- Tripathi, B.K.; Srivastava, A.K. Diabetes mellitus: Complications and therapeutics. Med. Sci. Monit. 2006, 12, RA130-47. [Google Scholar]
- Rask-Madsen, C.; King, G.L. Vascular complications of diabetes: Mechanisms of injury and protective factors. Cell Metab. 2013, 17, 20–33. [Google Scholar] [CrossRef] [Green Version]
- Modak, M.; Dixit, P.; Londhe, J.; Ghaskadbi, S.; Devasagayam, T.P.A. Indian herbs and herbal drugs used for the treatment of diabetes. J. Clin. Biochem. Nutr. 2007, 40, 163–173. [Google Scholar] [CrossRef] [Green Version]
- Khan, I.; Khan, A.; Halim, S.A.; Khan, M.; Zaib, S.; Al-Yahyaei, B.E.M.; Ibrar, A. Utilization of the common functional groups in bioactive molecules: Exploring dual inhibitory potential and computational analysis of keto esters against α-glucosidase and carbonic anhydrase-II enzymes. Int. J. Biol. Macromol. 2021, 167, 233–244. [Google Scholar] [CrossRef]
- Özil, M.; Emirik, M.; Etlik, S.Y.; Ülker, S.; Kahveci, B. A simple and efficient synthesis of novel inhibitors of alpha-glucosidase based on benzimidazole skeleton and molecular docking studies. Bioorg. Chem. 2016, 68, 226–235. [Google Scholar] [CrossRef]
- Zhang, Y.; Zhong, H.Y.; Nsanzamahoro, S.; Yao, X.J.; Wang, W.F.; Yang, J.L. An online target and rapid screening method for α-glucosidase inhibitors based on capillary electrophoresis. Electrophoresis 2021, 42, 1221–1228. [Google Scholar] [CrossRef] [PubMed]
- Wang, Z.; Li, X.Q.; Chen, M.H.; Liu, F.Y.; Han, C.; Kong, L.Y.; Luo, J.G. A strategy for screening of α-glucosidase inhibitors from Morus alba root bark based on the ligand fishing combined with high-performance liquid chromatography mass spectrometer and molecular docking. Talanta 2018, 180, 337–345. [Google Scholar] [CrossRef] [PubMed]
- Liu, Y.Y.; Li, H.M.; Lu, L.; Sun, B.; Huang, L.H.; Chen, H.Y.; Qiu, W.H.; Tao, J.; Zhao, P. A ratiometric electrochemical sensor with integrated probe for the assay of α-glucosidase activity and screening of its inhibitors. J. Electrochem. Soc. 2019, 166, B133–B140. [Google Scholar] [CrossRef]
- Cheng, X.; Huang, Y.; Yuan, C.; Dai, K.; Jiang, H.; Ma, J. Colorimetric detection of α-glucosidase activity based on the etching of gold nanorods and its application to screen anti-diabetic drugs. Sens. Actuators B Chem. 2019, 282, 838–843. [Google Scholar] [CrossRef]
- Huang, S.; Yang, E.L.; Yao, J.D.; Liu, Y.; Xiao, Q. Carbon dots doped with nitrogen and boron as ultrasensitive fluorescent probes for determination of α-glucosidase activity and its inhibitors in water samples and living cells. Microchim. Acta 2018, 185, 394. [Google Scholar] [CrossRef] [PubMed]
- Xiang, Y.; Lu, Y. Using personal glucose meters and functional DNA sensors to quantify a variety of analytical targets. Nat. Chem. 2011, 3, 697–703. [Google Scholar] [CrossRef]
- Hun, X.; Xu, Y.Q.; Xie, G.L.; Luo, X.L. Aptamer biosensor for highly sensitive and selective detection of dopamine using ubiquitous personal glucose meters. Sens. Actuators B Chem. 2015, 209, 596–601. [Google Scholar] [CrossRef]
- Yang, W.X.; Lu, X.H.; Wang, Y.C.; Sun, S.J.; Liu, C.H.; Li, Z.P. Portable and sensitive detection of protein kinase activity by using commercial personal glucose meter. Sens. Actuators B Chem. 2015, 210, 508–512. [Google Scholar] [CrossRef]
- Xiang, Y.; Lu, Y. Portable and quantitative detection of protein biomarkers and small molecular toxins using antibodies and ubiquitous personal glucose meters. Anal. Chem. 2012, 84, 4174–4178. [Google Scholar] [CrossRef] [Green Version]
- Fu, L.B.; Zhuang, J.Y.; Lai, W.Q.; Que, X.H.; Lu, M.H.; Tang, D.P. Portable and quantitative monitoring of heavy metal ions using DNAzyme-capped mesoporous silica nanoparticles with a glucometer readout. J. Mater. Chem. B 2013, 1, 6123–6128. [Google Scholar] [CrossRef]
- Fu, X.H.; Xu, K.; Ye, J.; Chen, J.; Feng, X.Y. Glucoamylase-labeled nanogold flowers for in situ enhanced sensitivity of a glucometer-based enzyme immunoassay. Anal. Methods 2015, 7, 507–512. [Google Scholar] [CrossRef]
- Tang, J.; Huang, Y.P.; Liu, H.Q.; Zhang, C.C.; Tang, D.P. Novel glucometer-based immunosensing strategy suitable for complex systems with signal amplification using surfactant-responsive cargo release from glucose-encapsulated liposome nanocarriers. Biosens. Bioelectron. 2016, 79, 508–514. [Google Scholar] [CrossRef] [PubMed]
- Xu, X.T.; Liang, K.Y.; Zeng, J.Y. Portable and sensitive quantitative detection of DNA using personal glucose meters and exonuclease III-assisted signal amplification. Analyst 2014, 139, 4982. [Google Scholar]
- Wang, Z.Z.; Chen, Z.W.; Gao, N.; Ren, J.S.; Qu, X.G. Transmutation of personal glucose meters into portable and highly sensitive microbial pathogen detection platform. Small 2015, 11, 4970–4975. [Google Scholar] [CrossRef] [PubMed]
- Chen, S.; Gan, N.; Zhang, H.; Hu, F.; Li, T.; Cui, H.; Cao, Y.; Jiang, Q. A portable and antibody-free sandwich assay for determination of chloramphenicol in food based on a personal glucose meter. Anal. Bioanal. Chem. 2015, 407, 2499–2507. [Google Scholar] [CrossRef] [PubMed]
- Fang, J.; Guo, Y.; Yang, Y.; Yu, W.; Tao, Y.; Dai, T.; Yuan, C.; Xie, G. Portable and sensitive detection of DNA based on personal glucose meters and nanogold-functionalized PAMAM dendrimer. Sens. Actuators B Chem. 2018, 272, 118–126. [Google Scholar] [CrossRef]
- Zhang, H.; Gong, Z.M.; Li, Y.; Yang, F.Q. A simple and green method for direct determination of hydrogen peroxide and hypochlorite in household disinfectants based on personal glucose meter. Enzyme Microb. Technol. 2022, 155, 109996. [Google Scholar] [CrossRef]
- Zhang, C.H.; Chen, C.X.; Zhao, D.; Kang, G.; Liu, F.N.; Yang, F.; Lu, Y.Z.; Sun, J. Multienzyme cascades based on highly efficient metal-nitrogen-carbon nanozymes for construction of versatile bioassays. Anal. Chem. 2022, 94, 3485–3493. [Google Scholar] [CrossRef]
- Zhou, Q.; Yang, H.; Chen, X.H.; Xu, Y.; Han, D.; Zhou, S.S.; Liu, S.Q.; Shen, Y.F.; Zhang, Y.J. Cascaded nanozyme system with high reaction selectivity by substrate screening and channeling in a microfluidic device. Angew. Chem. Int. Ed. 2022, 61, e202112453. [Google Scholar]
- Liu, D.M.; Dong, C.; Ma, R.T. A colorimetric method for screening α-glucosidase inhibitors from flavonoids using 3,3′,5,5′-tetramethylbenzidine as a chromogenic probe. Colloids Surf. B Biointerfaces 2021, 197, 111400. [Google Scholar] [CrossRef]
- Wu, D.; Hu, N.; Liu, J.C.; Fan, G.S.; Li, X.T.; Sun, J.; Dai, C.J.; Suo, Y.R.; Li, G.L.; Wu, Y.N. Ultrasensitive colorimetric sensing strategy based on ascorbic acid triggered remarkable photoactive-nanoperoxidase for signal amplification and its application to α-glucosidase activity detection. Talanta 2018, 190, 103–109. [Google Scholar] [CrossRef] [PubMed]
- Sun, H.N.; Yin, F.C.; Liu, X.F.; Jiang, T.; Ma, Y.H.; Gao, G.H.; Shi, J.G.; Hu, Q.Z. Development of a liquid crystal-based α-glucosidase assay to detect anti-diabetic drugs. Microchem. J. 2021, 167, 106323. [Google Scholar] [CrossRef]
- Tian, T.; Chen, G.Y.; Zhang, H.; Yang, F.Q. Personal glucose meter for α-glucosidase inhibitor screening based on the hydrolysis of maltose. Molecules 2021, 26, 4638. [Google Scholar] [CrossRef] [PubMed]
- Kong, W.H.; Wu, D.; Xia, L.; Chen, X.F.; Li, G.L.; Qiu, N.N.; Chen, G.; Sun, Z.W.; You, J.M.; Wu, Y.N. Carbon dots for fluorescent detection of α-glucosidase activity using enzyme activated inner filter effect and its application to anti-diabetic drug discovery. Anal. Chim. Acta 2017, 973, 91–99. [Google Scholar] [CrossRef] [PubMed]
- Chen, S.H.; Li, Z.; Li, W.J.; Huang, Z.Z.; Jia, Q. Confining copper nanoclusters on exfoliation-free 2D boehmite nanosheets: Fabrication of ultra-sensitive sensing platform for α-glucosidase activity monitoring and natural anti-diabetes drug screening. Biosens. Bioelectron. 2021, 182, 113198. [Google Scholar] [CrossRef] [PubMed]
Figure 1.
Schematic illustration of the principle of the PGM method based on α-glucosidase-mediated reaction.
Figure 1.
Schematic illustration of the principle of the PGM method based on α-glucosidase-mediated reaction.

Figure 2.
The PGM readout of seven solutions. (A) Ascorbic acid solution + glucose solution (molar ratio: 1:1); (B) Ascorbic acid solution; (C) α-Glucosidase + AA-2G solution; (D) α-Glucosidase + AA-2G + acarbose solution; (E) Glucose solution; (F) AA-2G solution; (G) α-Glucosidase + acarbose solutions. * PGM readout < 1.1 mM.

Figure 3.
Effect of the concentration of AA-2G on the PGM readout. The inset is the linear relationship between the concentration of AA-2G and the PGM readout. Conditions: α-Glucosidase, 314.3 U/mL; incubation time, 15.0 min; AA-2G, 6.0–22.0 mM.
Figure 3.
Effect of the concentration of AA-2G on the PGM readout. The inset is the linear relationship between the concentration of AA-2G and the PGM readout. Conditions: α-Glucosidase, 314.3 U/mL; incubation time, 15.0 min; AA-2G, 6.0–22.0 mM.

Figure 4.
Effect of the concentrations of AA-2G and enzymatic reaction time on the percentage of inhibition. Conditions: α-glucosidase, 314.3 U/mL; incubation time, 5.0–15.0 min; AA-2G, 10.0–14.0 mM; inhibition time, 3.0 min; acarbose, 2.2 μM.
Figure 4.
Effect of the concentrations of AA-2G and enzymatic reaction time on the percentage of inhibition. Conditions: α-glucosidase, 314.3 U/mL; incubation time, 5.0–15.0 min; AA-2G, 10.0–14.0 mM; inhibition time, 3.0 min; acarbose, 2.2 μM.

Figure 5.
Effect of the inhibition time on the PGM readout. Conditions: α-glucosidase, 314.3 U/mL; incubation time, 5.0 min; AA-2G, 14.0 mM; inhibition time, 1.0–9.0 min; acarbose, 2.2 μM.
Figure 5.
Effect of the inhibition time on the PGM readout. Conditions: α-glucosidase, 314.3 U/mL; incubation time, 5.0 min; AA-2G, 14.0 mM; inhibition time, 1.0–9.0 min; acarbose, 2.2 μM.

Figure 6.
The plots of percentage of inhibition versus the logarithmic concentration of acarbose (A) and migliol (B) Conditions: α-glucosidase, 314.3 U/mL; incubation time, 5.0 min; AA-2G, 14.0 mM; inhibition time, 3.0 min.
Figure 6.
The plots of percentage of inhibition versus the logarithmic concentration of acarbose (A) and migliol (B) Conditions: α-glucosidase, 314.3 U/mL; incubation time, 5.0 min; AA-2G, 14.0 mM; inhibition time, 3.0 min.

Figure 7.
Selectivity of the developed PGM-based method. P/P0 = the ratio of PGM readout measured with/without interfering substances.
Figure 7.
Selectivity of the developed PGM-based method. P/P0 = the ratio of PGM readout measured with/without interfering substances.


Table 1.
Comparison of different methods for the anti-diabetic drugs detection in terms of substrates, linear range, limit of detection, and IC50.
Table 1.
Comparison of different methods for the anti-diabetic drugs detection in terms of substrates, linear range, limit of detection, and IC50.
| Methods | Substrates | Linear Range (μM) | Limit of Detection (μM) | IC50 (μM) | Ref. |
|---|---|---|---|---|---|
| Liquid crystal-based assay | Dodecyl α-D-glucopyranoside | Acarbose: 1.0–10.0; Migliol: 1.0–20.0 | Acarbose: 0.57; Migliol: 1.00 | - | [32] |
| Personal glucose meter | Maltose | Acarbose: 1600–46,500 | - | Acarbose: 16,800 | [33] |
| Fluorescence | 4-Nitrophenyl-α-D-glucopyranoside | Acarbose: 0.1–1000 | Acarbose: 0.01 | Acarbose: 58.68 | [34] |
| Colorimetry-naked-eye detection | L-ascorbic acid-2-O-α-D-glucopyranosyl | Acarbose: 0–16 | Acarbose: 1.0 | - | [31] |
| Colorimetry | L-ascorbic acid-2-O-α-D-glucopyranosyl | Acarbose: 25–4500 | - | Acarbose: 370 | [30] |
| Fluorescence | 4-Nitrophenyl-α-D-glucopyranoside | Acarbose: 50–300 | - | Acarbose: 203.5 | [35] |
| Personal glucose meter | L-ascorbic acid-2-O-α-D-glucopyranosyl | Acarbose: 1.0–30.0; Migliol: 3.0–33.3 | Acarbose: 0.33; Migliol: 1.00 | Acarbose: 10.0; Migliol: 16.0 | This study |
Note: “-” not mentioned.
Table 2.
Recovery studies of acarbose and migliol in normal human serum by the PGM method (n = 3).
| Anti-Diabetic Drugs | Added (μM) | Found (SD) (μM) | Recovery (%) |
|---|---|---|---|
| Acarbose | 10.0 | 9.0 (1.1) | 89.6 |
| 20.0 | 20.3 (4.8) | 101.6 | |
| 30.0 | 34.3 (4.2) | 114.5 | |
| Migliol | 10.0 | 9.4 (1.6) | 93.9 |
| 20.0 | 19.6 (1.9) | 98.2 | |
| 30.0 | 31.9 (2.0) | 106.5 |
Publisher’s Note: MDPI stays neutral with regard to jurisdictional claims in published maps and institutional affiliations. |
© 2022 by the authors. Licensee MDPI, Basel, Switzerland. This article is an open access article distributed under the terms and conditions of the Creative Commons Attribution (CC BY) license (https://creativecommons.org/licenses/by/4.0/).
Share and Cite
MDPI and ACS Style
Zhang, H.; Yang, F.-Q. α-Glucosidase-Mediated Glucometer Readout for Portable Monitoring of Acarbose and Migliol. Chemosensors 2022, 10, 198. https://0-doi-org.brum.beds.ac.uk/10.3390/chemosensors10060198
AMA Style
Zhang H, Yang F-Q. α-Glucosidase-Mediated Glucometer Readout for Portable Monitoring of Acarbose and Migliol. Chemosensors. 2022; 10(6):198. https://0-doi-org.brum.beds.ac.uk/10.3390/chemosensors10060198
Chicago/Turabian StyleZhang, Hao, and Feng-Qing Yang. 2022. "α-Glucosidase-Mediated Glucometer Readout for Portable Monitoring of Acarbose and Migliol" Chemosensors 10, no. 6: 198. https://0-doi-org.brum.beds.ac.uk/10.3390/chemosensors10060198
Note that from the first issue of 2016, this journal uses article numbers instead of page numbers. See further details here.