Communication

Study on Microdamage Quantitative Analysis of Cd and Pb in Leaves by Laser Induced Breakdown Spectroscopy

1
Key Laboratory of Environmental Optics and Technology, Anhui Institute of Optics and Fine Mechanics, Chinese Academy of Sciences, Hefei 230031, China
2
Key Laboratory of Optical Monitoring Technology of Environment, Anhui Institute of Optics and Fine Mechanics, Hefei 230031, China
3
School of Environmental Science and Optoelectronic Technology, University of Science and Technology of China, Hefei 230026, China
*
Author to whom correspondence should be addressed.
Submission received: 26 May 2022 / Revised: 20 June 2022 / Accepted: 23 June 2022 / Published: 25 June 2022
(This article belongs to the Special Issue Application of Laser-Induced Breakdown Spectroscopy)

Abstract

:
Recent years, research on the detection of heavy metals in Traditional Chinese Medicine (TCM) by laser induced breakdown spectroscopy (LIBS) have gradually increased. Current main methods of establishing calibration curve are based on grounding and pelleting of the tested samples. Although compared to digested samples, grounding and pelleting of the sample is already quite simple, it cannot fully reflect the advantages of LIBS: rapid analysis, and, also, the uneven distribution of heavy metals in the TCM is ignored. In order to avoid grinding and pelleting sample to be tested, and to achieve microdamage quantitative analysis by LIBS, this article presents a new method for establishing calibration curve. The experiment in this paper based on a study with Cd and Pb in leaves of laurel. The preparation of calibration samples and the establishment of calibration methods for microdamage quantitative analysis were presented, which proved the feasibility of microdamage quantitative analysis by LIBS. The square of the linear relationship coefficient R of Pb was higher than 0.82. This method provides a guiding method for the rapid quantitative analysis of heavy metals in TCM by LIBS.

1. Introduction

There have been many research studies on the detection of heavy metals in traditional Chinese medicine (TCM) by laser induced breakdown spectroscopy (LIBS). Cao et al. reviewed the principle, device and pharmaceutical applications of LIBS [1]. Compared with traditional methods such as inductively coupled plasma mass spectrometry (ICP-MS), atomic absorption spectrometry (AAS), atomic emission spectrometry (AES) and electrochemical (EC), LIBS technology has unique advantages in heavy metal: simple sample preparation, rapid detection, simultaneous detection of multiple elements, no secondary pollution, detection in harsh and extreme environments and so on [2]. Zhang et al. qualitatively analyzed the variation of iron spectral of Chinese yam before and after sample pretreatment, and the results showed that the intensity of Fe was improved after grinding and pelleting [3]. Li et al. proved that LIBS had great potential for applications in rapid identification of tobacco [4]. M. Galiová et al. applied LIBS and laser ablation inductively coupled plasma mass spectrometry (LA-ICP-MS) for high-resolution mapping of accumulation and distribution of lead and nutrition elements in leaves of Capsicum annuum L., elemental mapping performed on fresh and dried Capsicum annuum L. leaves were compared. The major disadvantage of the techniques in the case of analysis of environmental samples in their natural form was the difficult standardization [5]. The measurements presented in their work gave the map of the intensity of a spectral line, which may be proportional to the local concentration, but there was no attempt at calibration. Qualitative analysis of TCM samples were carried out in the above literatures and other papers [6,7,8,9]. The samples were simply pretreated in these papers and were not ground and pelletized. However, for quantitative analysis, grinding and pelleting of the samples is essential. Because, when testing natural samples such as TCM and plant tissues, there is usually no available standard samples. The acquisition of calibration samples is usually a complex process. In order to establish the calibration curve for LIBS technique, reference samples need to be prepared. The usual practice is adding standard elements to the test sample, and this inevitably requires grinding, sieving and pelleting the samples. Zheng et al. detected Cu and Pb in Coptidis by reheated double-pulse LIBS (RDP-LIBS), the detection of Cu and Pb were 1.91 and 3.03 mg/kg, respectively [10]. Li compared and analyzed the sensitivity of single pulse LIBS and double pulse LIBS to Cu in Artemisia annua, and the detection limits of the two methods were 7.75 and 3.46 mg/kg, respectively [11]. Three heavy metals (Cu, Cd and Pb) in Salvia miltiorrhiza were quantitatively analyzed based on LIBS combined with least squares support vector machine (LSSVM) by Liang, and the result proved that variable importance measure (VIM) combined with LSSVM calibration model showed a better predictive performance [12]. Su et al. established the detection models to simultaneously and quantitatively analyze seven heavy metals in Sargassum fusiforme by LIBS coupled with a simple framework [13]. Zhang et al. used LIBS for quantitative analysis of Cr in dried kelp samples, but the abscissa of the calibration curve was the Cr content of the soaking solution, not the actual content of heavy metals in the kelp samples [14]. Inevitably, when the sample to be tested is quantitatively analyzed, it must also be ground and pelleted in order to maintain consistency with the calibration sample [15]. Moreover, the distribution of heavy metals in natural samples is not uniform, and grinding can eliminate the influence of non-uniformity and obtain stable spectral signals. This method of sample preparation greatly increases the complexity of the detection process. It is urgent to develop a calibration method for microdamage quantitative analysis of plant samples in their natural form by LIBS. That is, the samples are dried to remove moisture and then directly quantitatively analyzed, rather than quantitative analysis of samples after grinding and pelleting. There is limited literature about this. In Ref. [16], the macro spatial distribution of chromium in rice leaves was visualized by double pulse LIBS, then the reference value of chromium content was measured by ICP-MS, finally the chromium content in rice leaves was successfully visualized with a SVM model based on feature variables. It proved that this method could be used for element mapping. However, in order to obtain the calibration curve, the whole rice leaves were used to digested and detected by ICP-MS, so the uneven distribution of heavy metals had a greater impact on the results.
This paper focused on establishing the calibration curve for microdamage quantitative analysis of heavy metals in leaves by LIBS. With the help of this calibration, the dried samples could be directly quantitative analysis by LIBS, without grinding and pelleting. This could save a lot of time in sample pretreatment, and make quantitative analysis by LIBS much quicker. The specific idea of this experiment was that spectral intensities of the undamaged treated samples had to be obtained by LIBS first, and then the corresponding concentration of the element to be tested were detected by ICP-MS. For leaf samples, it was not a simple process for establishing the calibration curve, but once the calibration curve was established, it was of great significance to microdamage quantitative analysis for the subsequent samples to be tested, and highlighted the advantages of rapid LIBS detection.

2. Experimental Method

2.1. Experimental Setup

The spectra of the samples in this experiment were recorded by the traditional LIBS system, described in detail in the previous research paper [17]. Briefly, the plasma was produced by Q-switched Nd:YAG pulse laser (BIGSKY, Ultra-100, Shanghai, China). Then the laser was focused by a lens with a 100 mm focal length. The signal was collected by a spectrometer (Avantes, AVS-DESKTOP-USB2, Beijing, China). The spectrometer had a spectral range of 200–500 nm and a resolution of 0.08–0.12 nm. The leaf samples were placed on the X-Y stage (Zolix, PSA150-11-X, Shanghai, China), controlled by a two-phase stepper motor controller (Zolix, SC300-2B, Shanghai, China). LIBS data acquisition was performed using single shot scanning, and a total of 12 spectra were obtained for each sample, and no shot was overlapped with the help of the X-Y moving stage.
Microwave digestion was used for sample pretreatment. The microwave digestion system (XT-mul) was purchased from Shanghai Xintuo Analytical Instrument Technology Co., LTD (Shanghai, China). The concentration of heavy metals of the samples were detected by ICP-MS (Thermo Fisher, iCAP RQ, Shanghai, China).

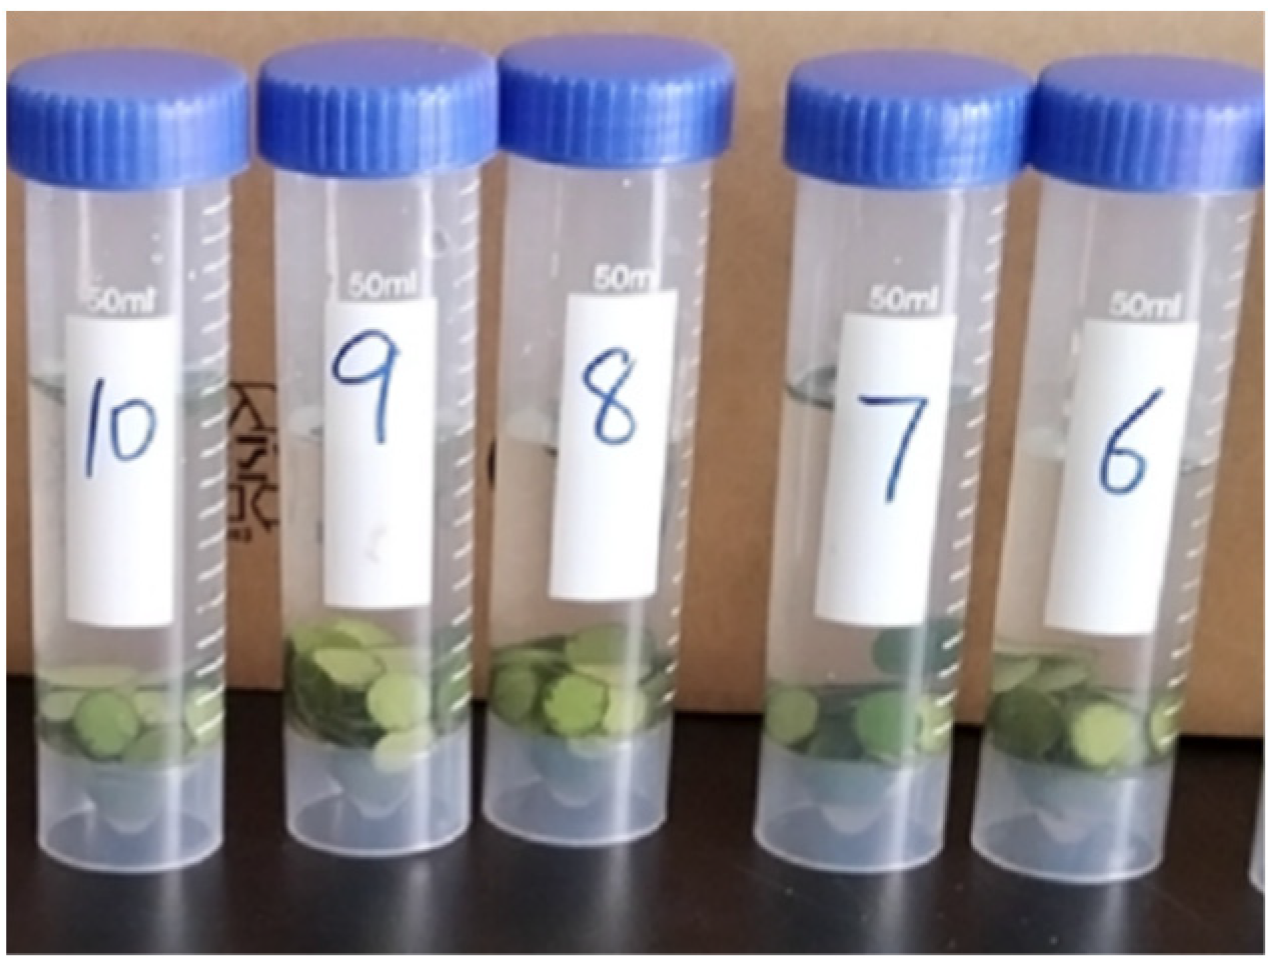
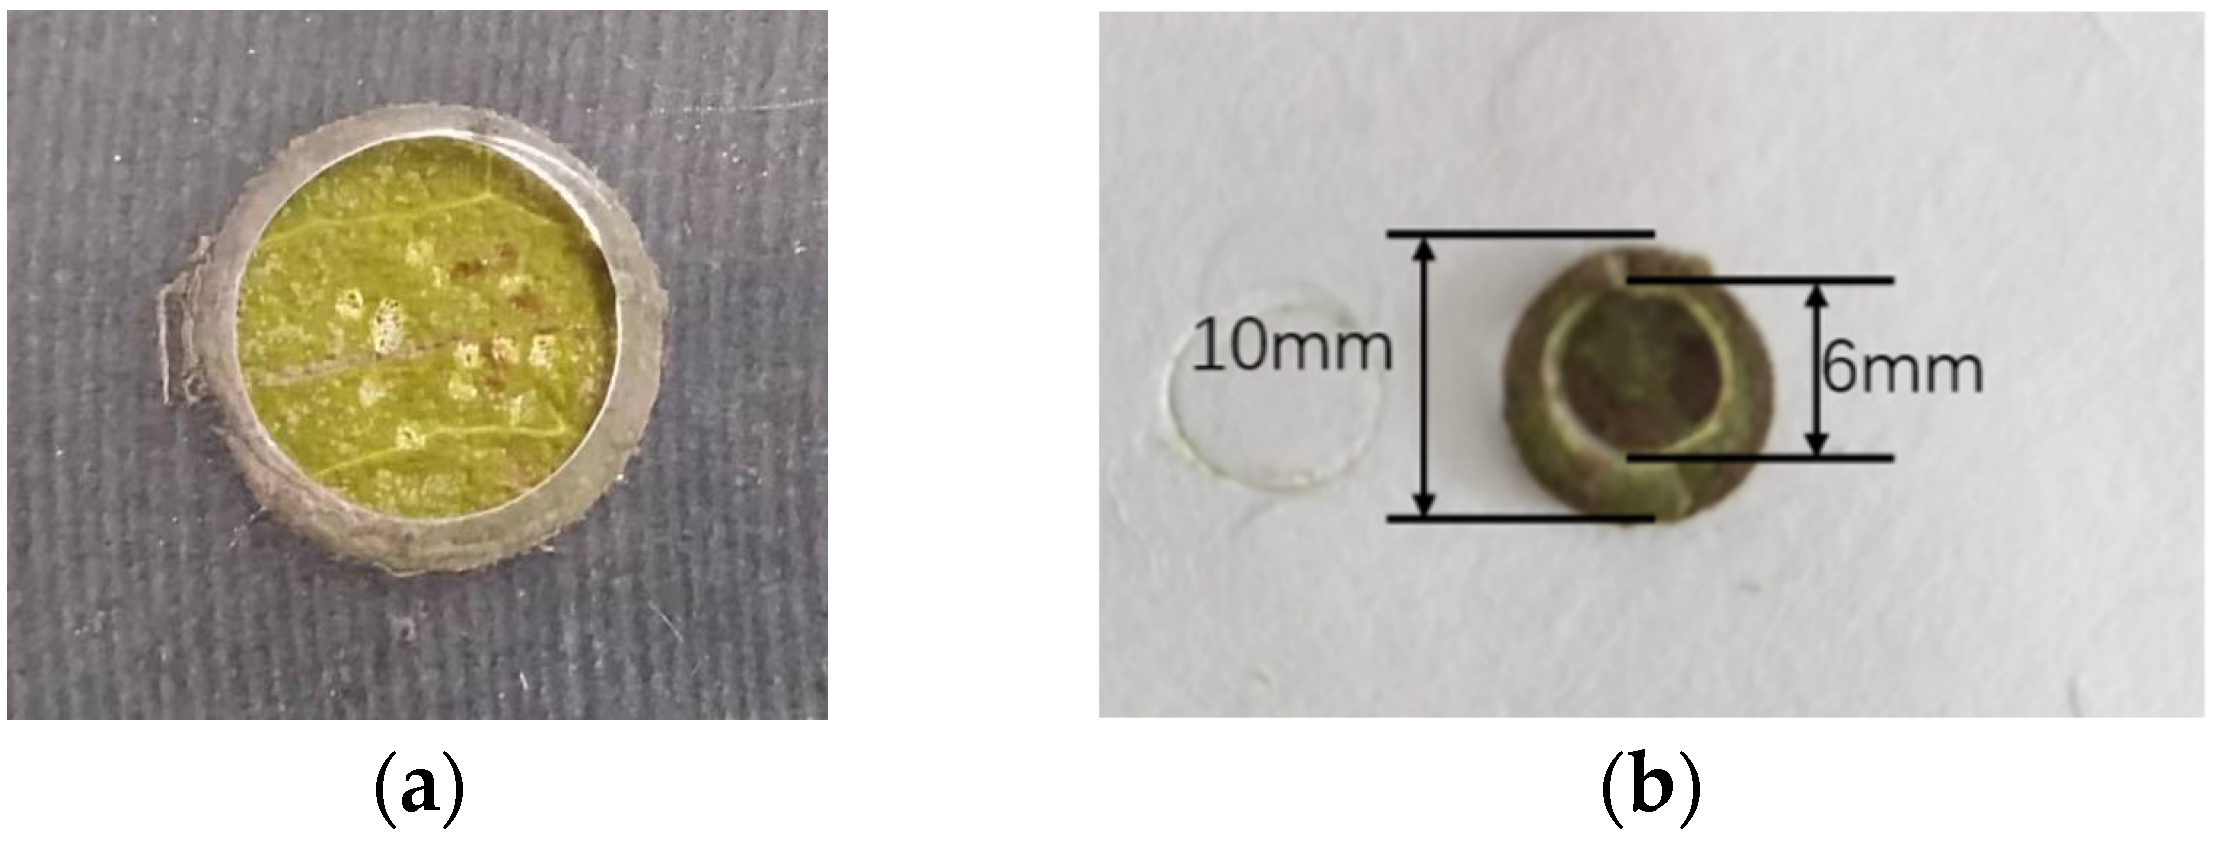
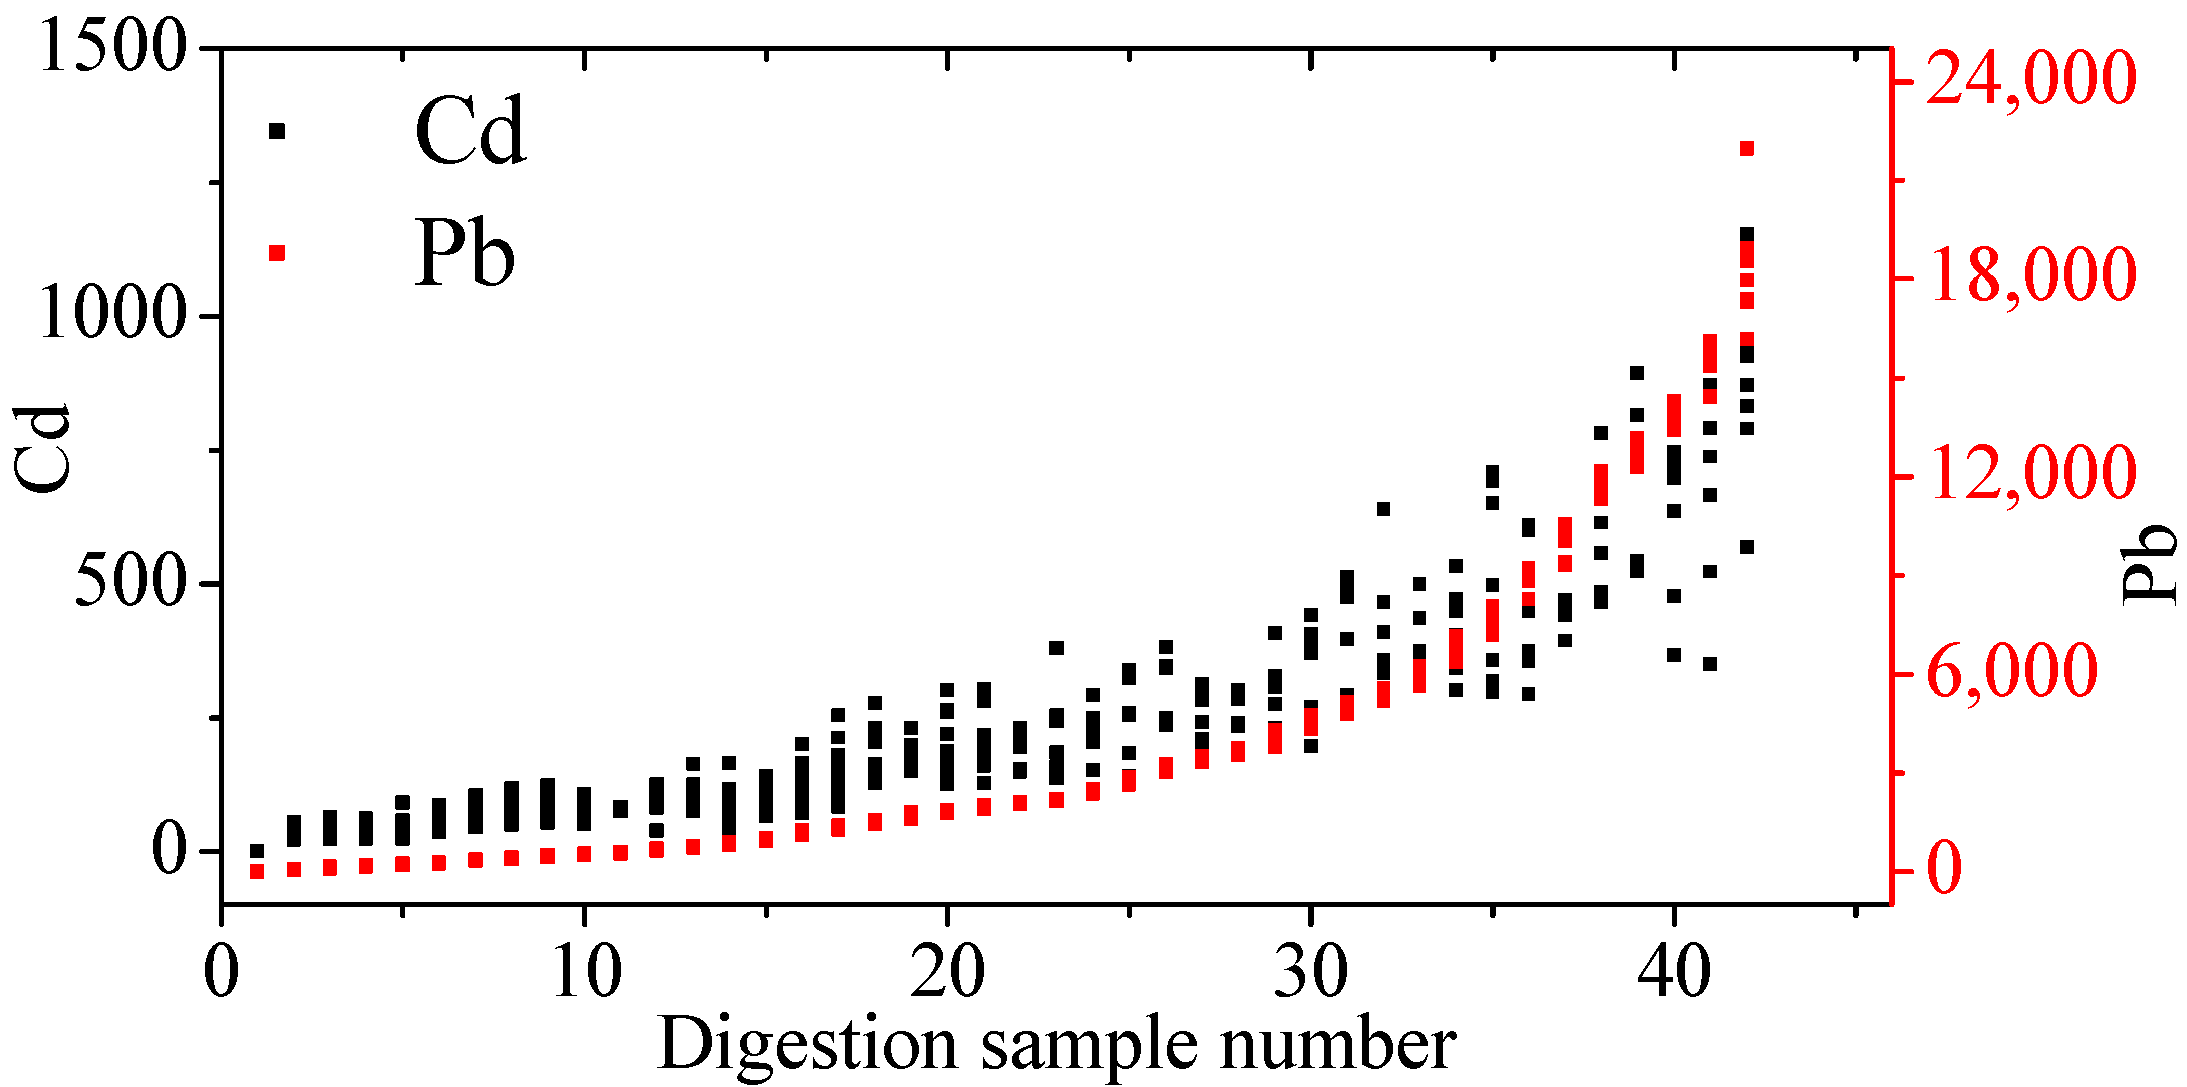
2.2. Sample Preparation

Mixed solutions of lead and cadmium were prepared from their nitrates. First, 0.0644 g of Cd(NO3)2·4H2O and 0.0591 g of Pb(NO3)2 were dissolved in a 250 mL volumetric flask, which was the stock solution. This was then diluted, successively, into 14 gradient heavy metal solutions for soaking leaf samples. For a total of 15 gradient solutions, the specific concentrations of Cd and Pb were shown in the table below (Table 1).
Experiments were performed with leaves from laurel. The leaves were soaked in different concentrations of heavy metal solutions in order to obtain samples for calibration. Specifically, after the leaves were picked, they were cleaned with deionized water and cut into circles with a knife mold, seen in Figure 1. A total of 85 leaves were collected and cut into 750 small round samples. They were, respectively, soaked in 15 solutions of different heavy metal concentrations for 2 days. Then they were taken out, cleaned with deionized water, and pressed between two paper disks into a wooden specimen holder, and, finally, analyzed by LIBS after drying.
The sample detected by LIBS was shown in Figure 2a. Samples were cut into wafers with the diameter of 10 mm. In theory, microscopically, the smaller the sample was cut, the more evenly the heavy metals were distributed. However, if the wafers were too small, it was not conducive to experimental operation. After consideration, the leaves were cut into wafers with 10 mm in diameter. The thickness of the leaf was about 0.34 mm. The diameters of the laser ablated craters were about 0.8 mm. A single pulse would not penetrate the sample. As shown in Figure 2b, each leaf sample was divided into two parts, and the middle part was a circle with a diameter of 6 mm, which was used for ICP-MS detection after microwave digestion. The edge part was removed. This was because heavy metals in the edge of the sample were significantly higher than those in the center after immersion in heavy metals solutions. The area of the central of the sample was small and approximately, the heavy metals were assumed evenly distributed.
After acquiring the LIBS spectra of all samples, sort all of them according to their spectral intensity. Then, these samples were divided into several groups of different concentration of heavy metals, this was because the weight of a single leaf sample was not enough to digest.
In order to obtain the concentration of the heavy metals of the leaf samples by ICP-MS, approximately 0.2 g of each group of the sample was weighed and shredded in the Teflon vessels. Then, 5 mL of 65% HNO3 was added in the Teflon vessels. Microwave digestion was performed according to the procedure in Table 2. After digestion, they were transferred into 25 mL volumetric flasks and diluted with 2% HNO3 to the mark.

2.3. Data Analysis

The original spectrum was fitted by Lorentz to obtain the spectral line intensity of heavy metals. The 12 spectra were taken average as an effective spectrum. The average intensities of Cd atomic line at 228.80 nm and Pb at 405.78 nm were used. The ICP-MS detection result was taken as the abscissa, and the LIBS detection result was taken as the ordinate to establish the calibration curve of microdamage quantitative analysis.

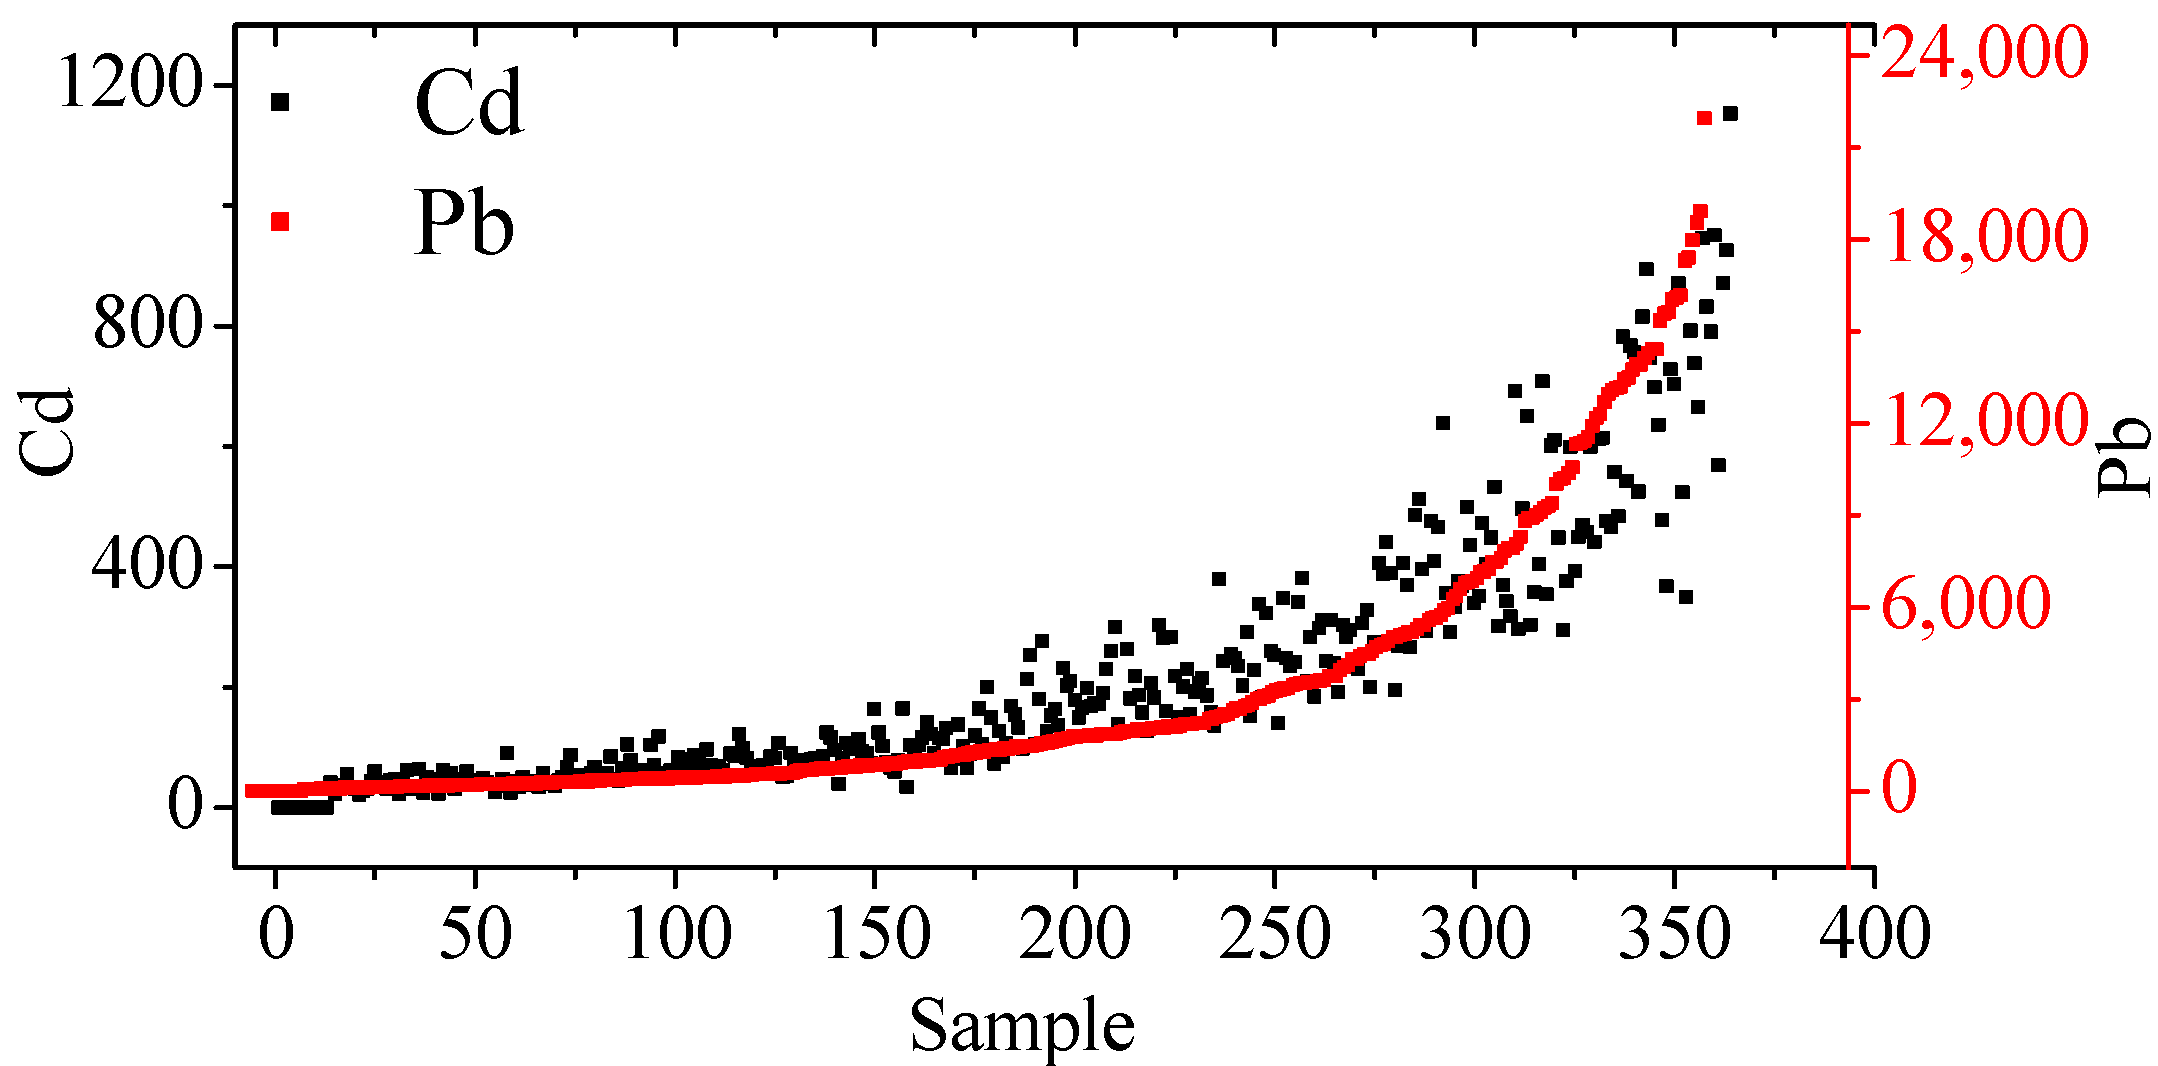
3. Result and Discussion

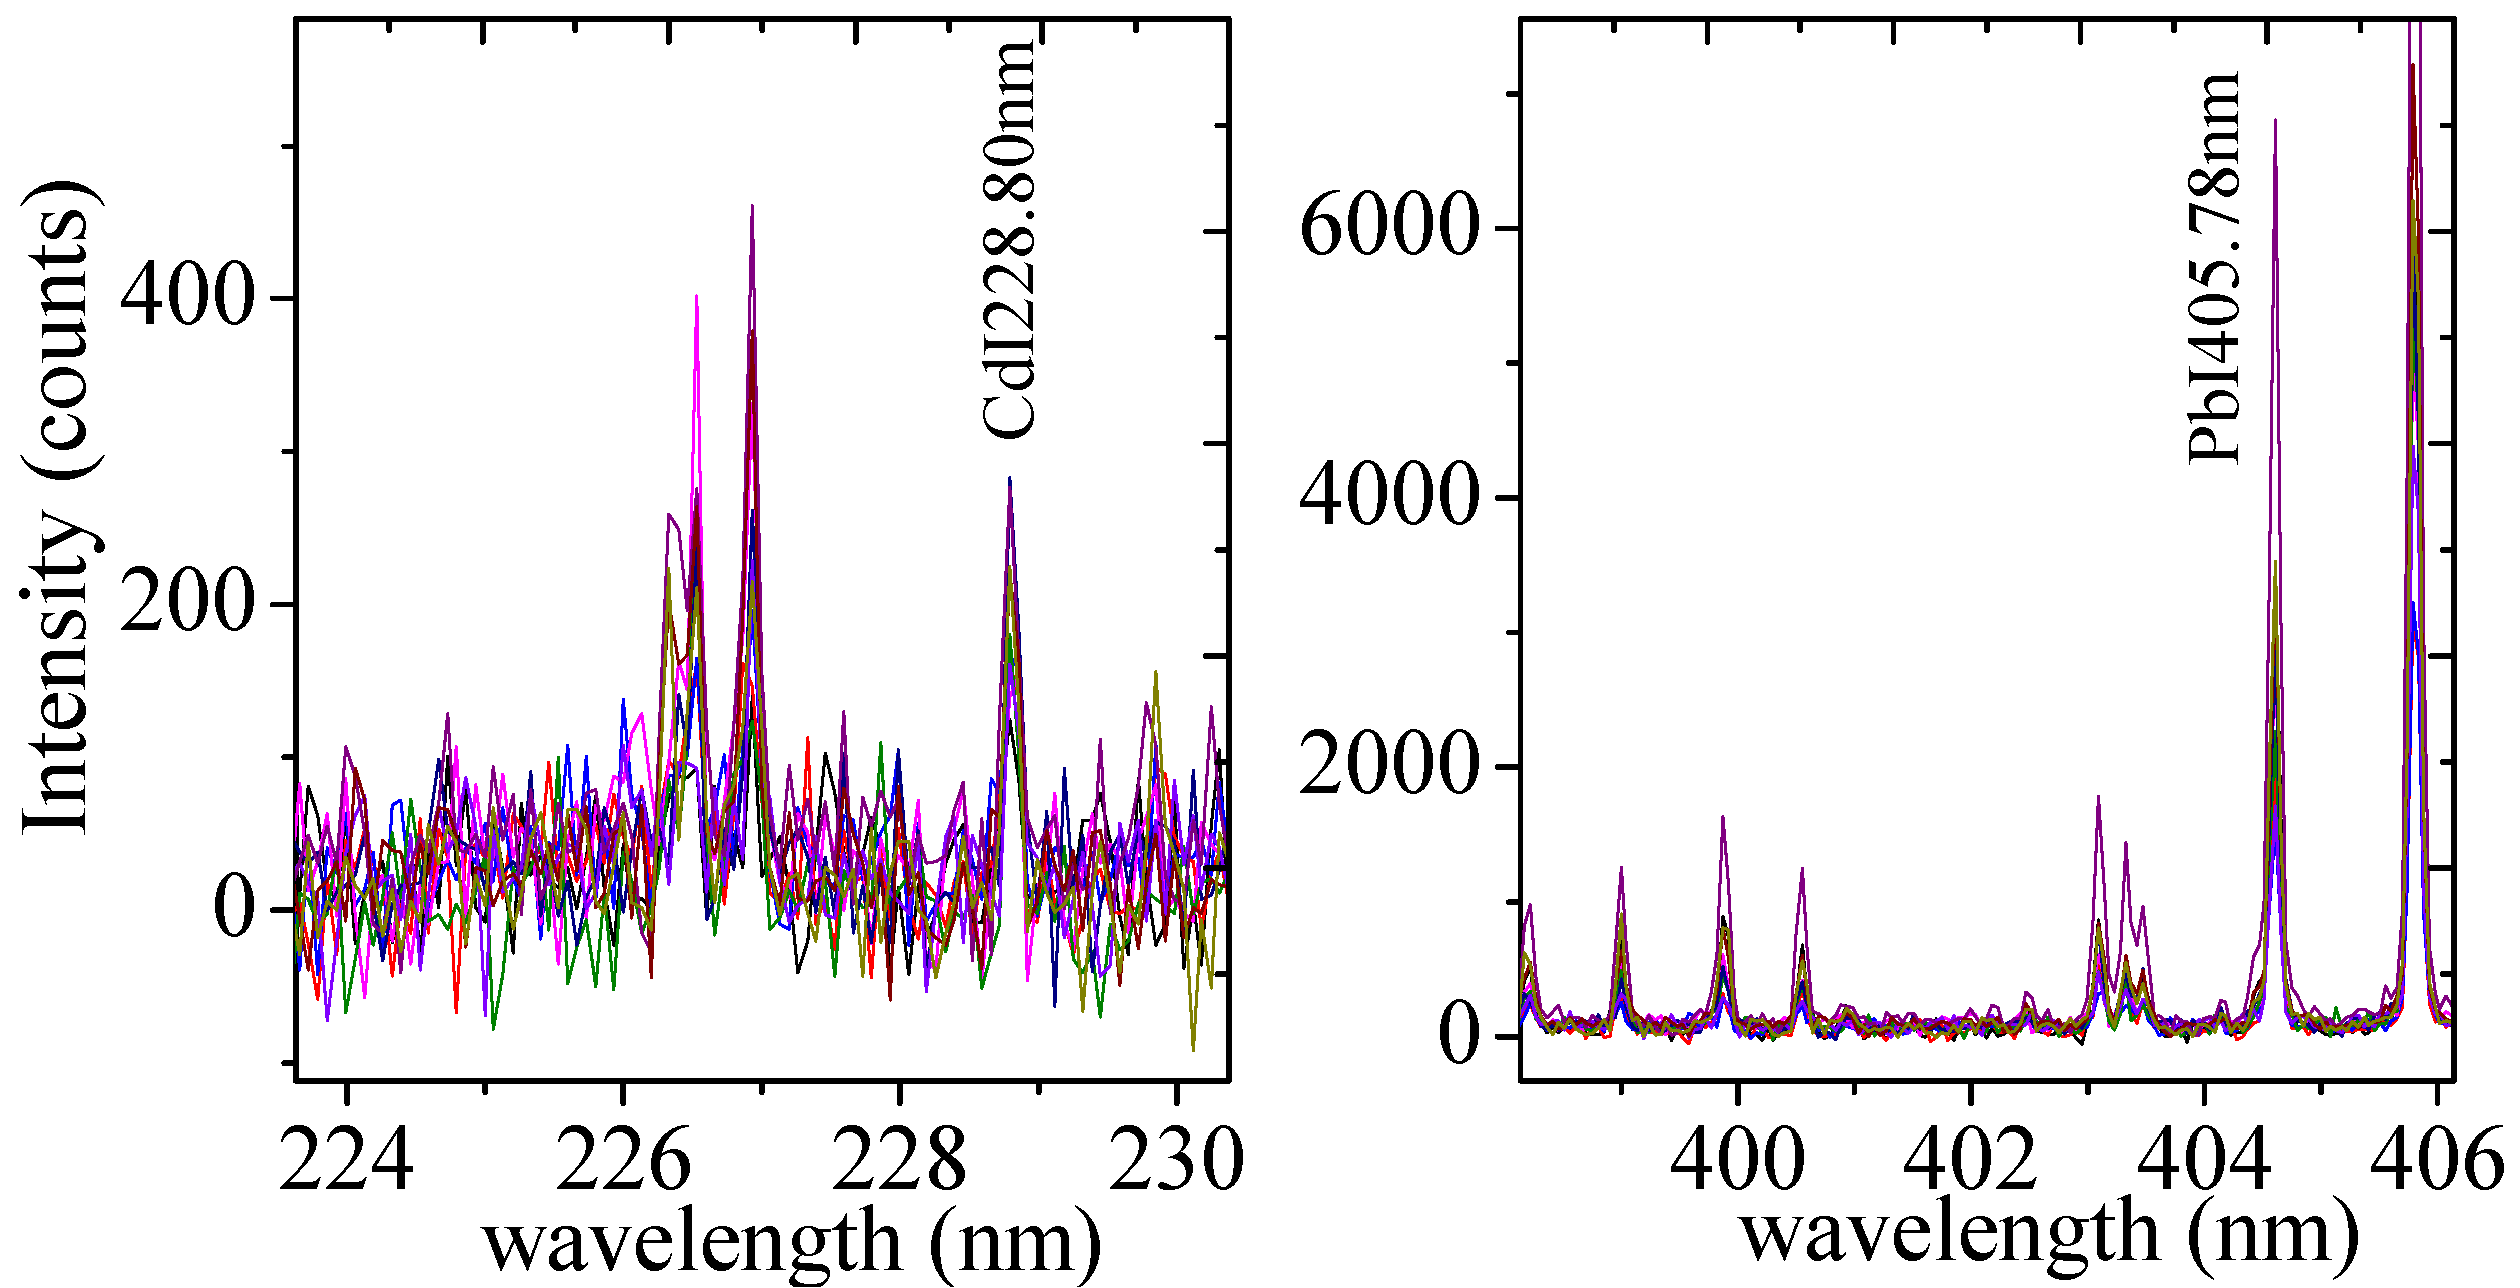
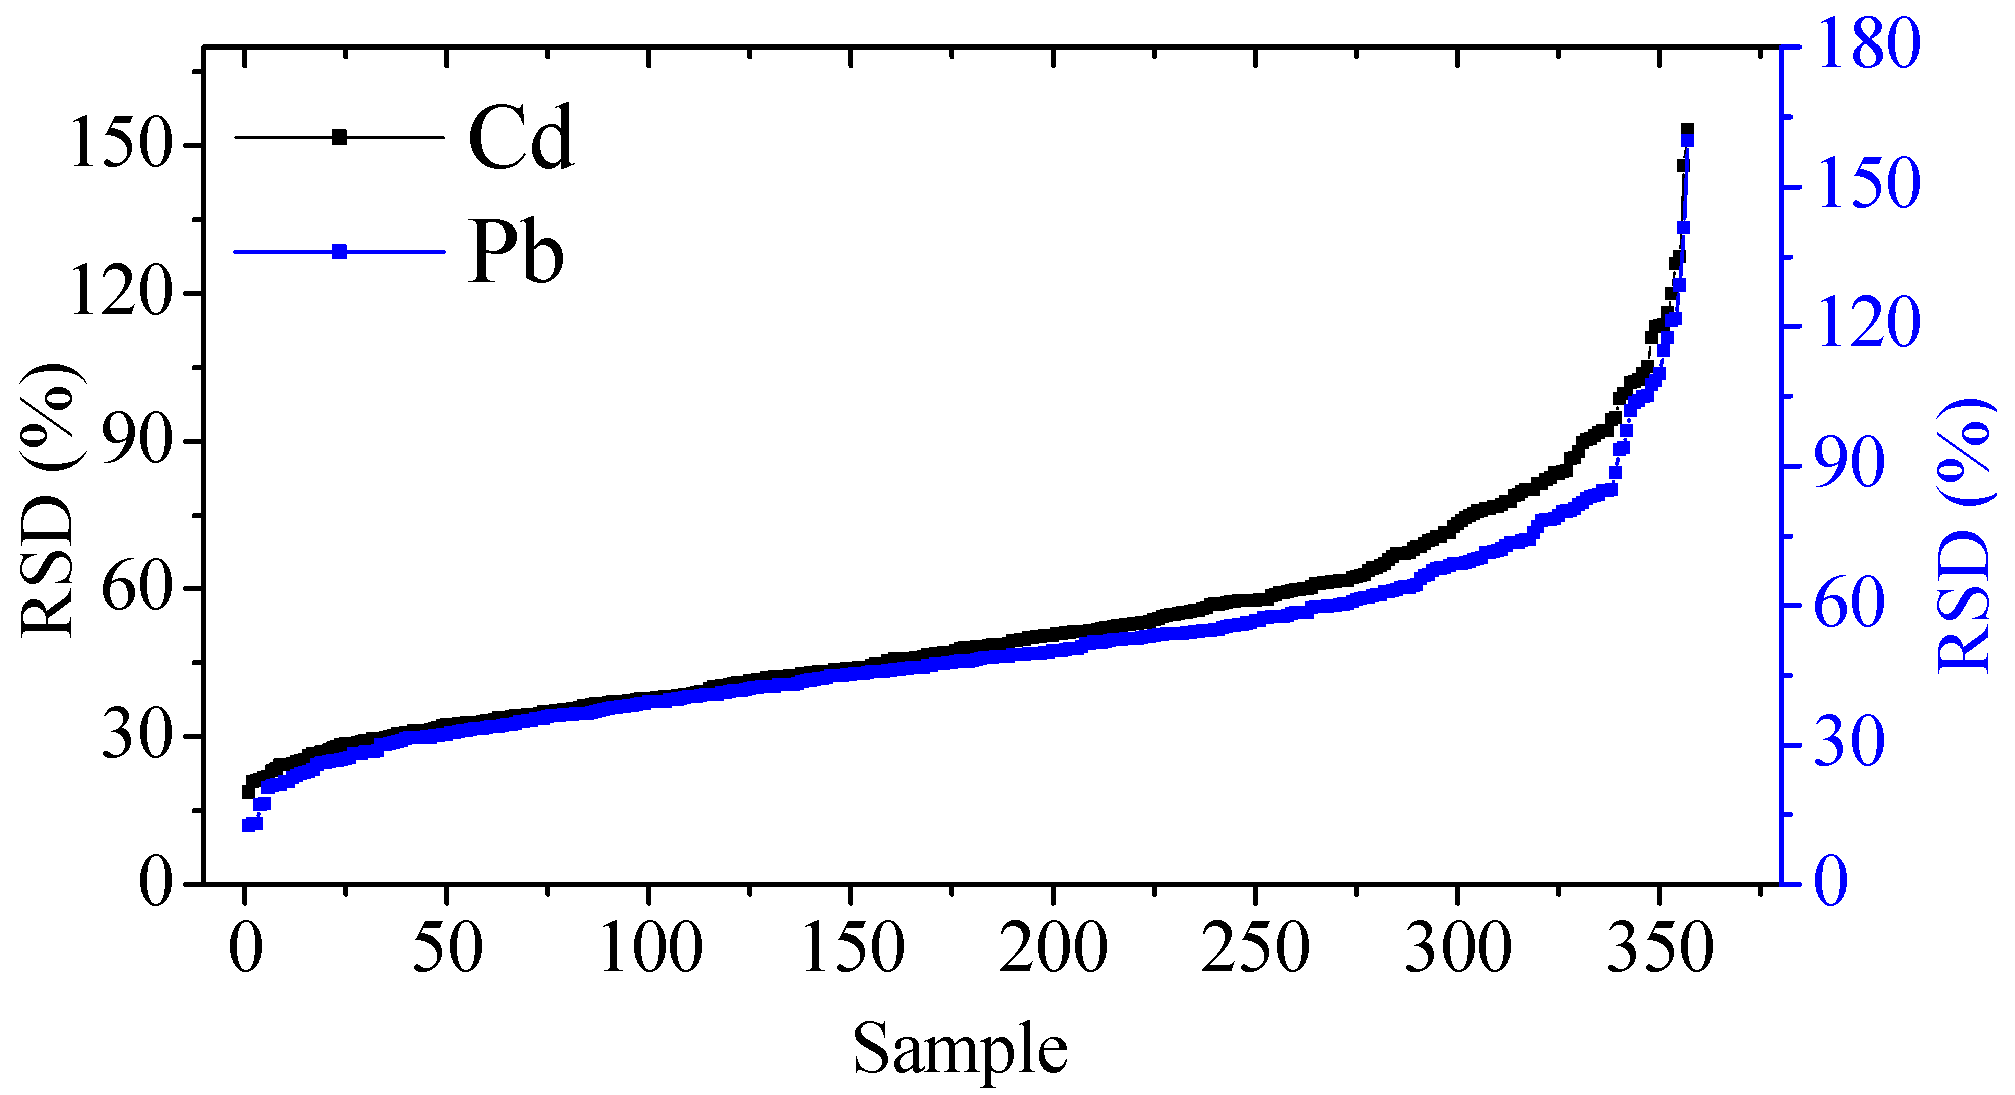
3.1. Spectral Analysis

Qualitative analysis of leaves of laurel by LIBS showed that the leaves mainly contained C, Ca, Mg, Al, Si, Cu, Fe, Mn and Zn. The LIBS spectra of leaves soaked in Cd and Pb solutions were shown in Figure 3. There was no interference of the atomic lines at 228.80 nm of Cd and at 405.78 nm of Pb, and they were chosen as indicator of concentration.
Although a total of 750 wafers were prepared and immersed in heavy metals solutions, the concentrations of No. 1–6 soaking solution were too low that the signals of Cd and Pb were not detected by LIBS, therefore, at last a total of 357 samples were measured by LIBS and used for establishing the calibration curve. The relative standard deviation (RSD) of a single pulse of a sample showed the homogeneity of heavy metal distribution in the sample. The smaller the single-pulse RSD value, the more homogeneity the distribution of heavy metals in the sample. In this experiment, the 12 single-pulse RSD values ranged from 12.7% to 159.8%. The ordering of single-pulse RSD values was shown in Figure 4. The single-pulse RSD of 83 samples were exceeding 60%, that was, the heavy metals were not uniformly distributed in these samples. However, in order to ensure sufficient calibration samples, the results of all 357 samples were retained in this experiment.

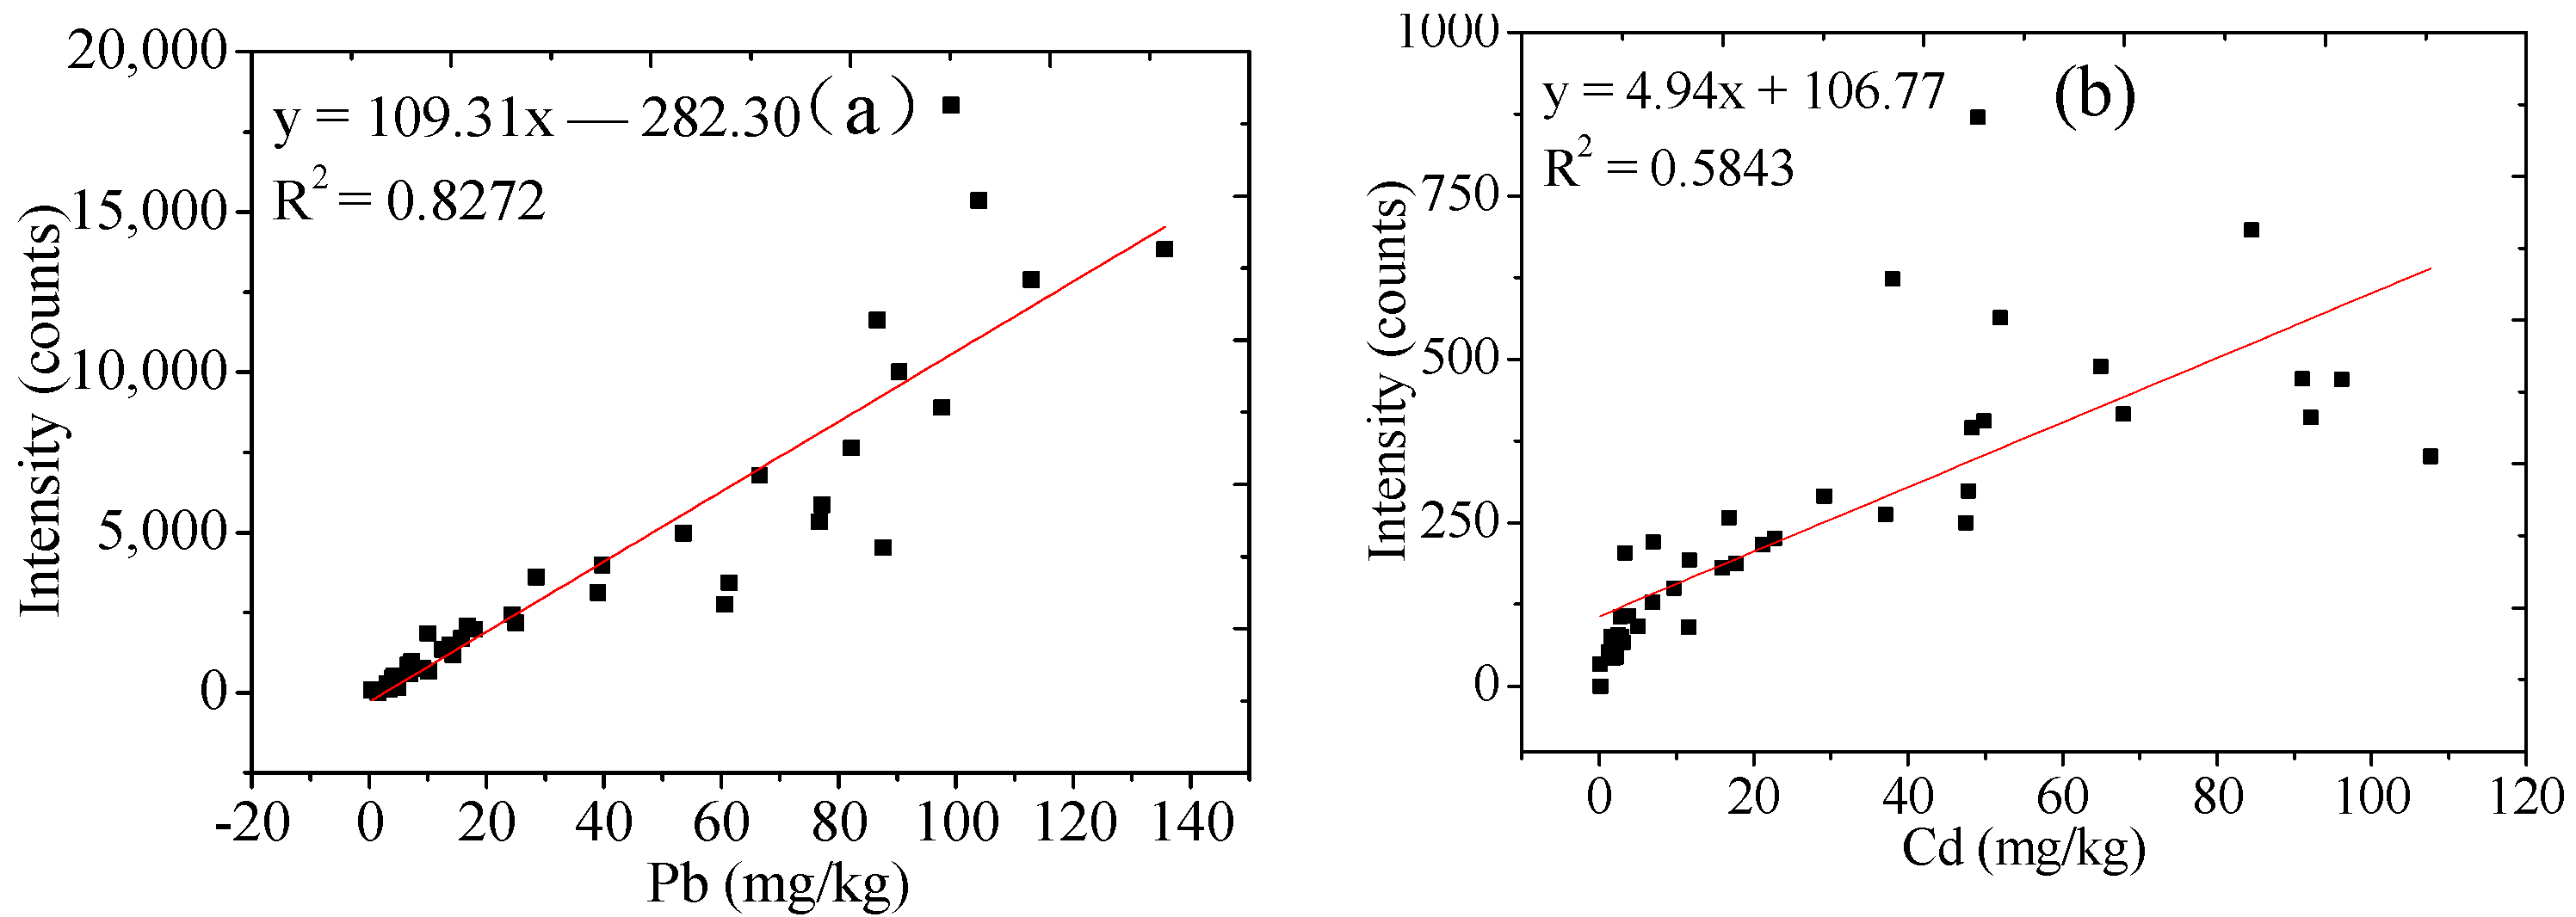
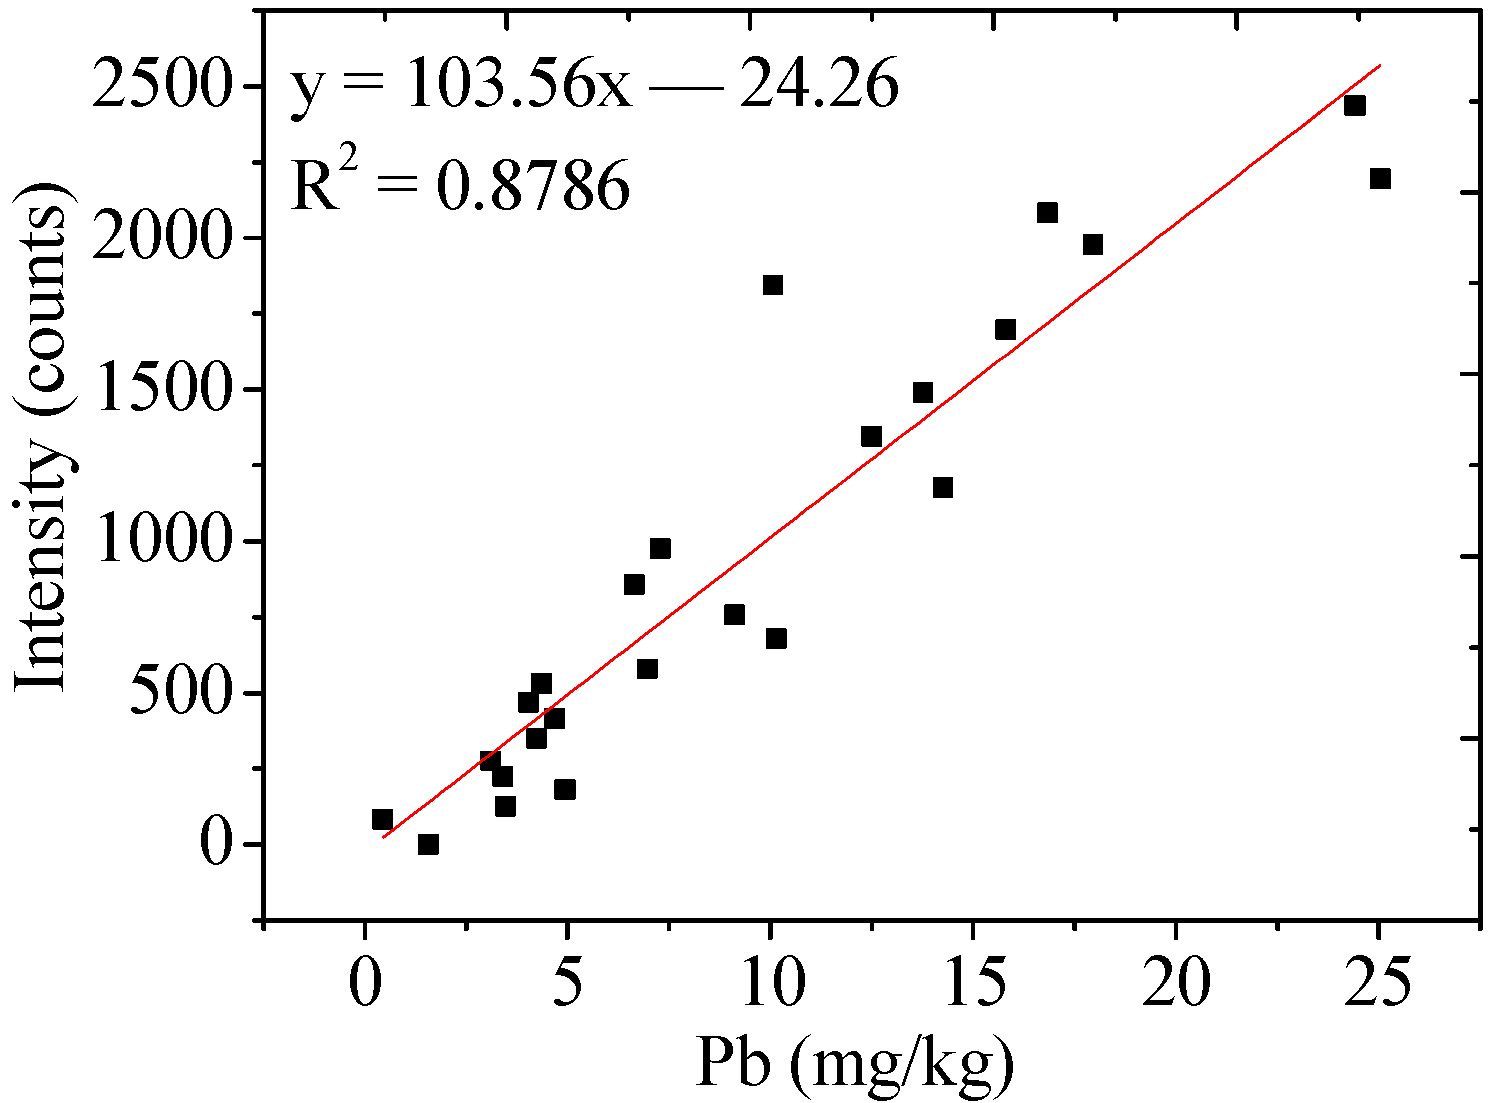
3.2. Calibration Curve Creation

Naturally growing samples such as leaves were microinhomogeneity. Therefore, the heavy metal concentration of all leaves soaked in the same solution were not necessarily the same. What is more, it was worth noting that it was not the leaves immersed in the high-concentration solution that the heavy metal content was high. Therefore, all the samples were sorted according to their spectral intensity, and then divided into several groups.
In this experiment, the spectral intensity of Pb was higher than that of Cd in each sample. All samples were therefore sorted by the spectral intensity of Pb, and the results were shown in Figure 5. From the figure it can be found that the spectral intensity of Cd element was also on the rise as a whole, but there were small fluctuations. The number of high-concentration samples was small. The lower the spectral intensity, the higher the number of samples. Therefore, the partition intervals of the high and the low intensity were not the same. For samples with low spectral intensity, each 10 samples were divided into a group, and for samples with high spectral intensity, each 6 samples were divided into a group. At last, all of these samples were divided into 42 gradients and then digested separately, shown in Figure 6.
The calibration curve of Pb and Cd were shown in Figure 7a,b. The R-squared value of Pb was 0.8272. The lower the content, the more accurate the result, this was because the number of low-concentration samples was larger, and the concentration gradient spacing between the sample groups was small. When fitted the samples with Pb concentration less than 25 mg/kg, the square of R was 0.8786, as shown in Figure 8. Further increase the concentration of heavy metals in the soaking solution, thereby increasing the number of high-concentration samples, can make the data of high-concentration samples more accurate. Since the abscissa of this calibration curve was the concentration of the heavy metal of the sample after drying, and the ordinate was its spectral intensity, the leaves of laurel can be microdamage quantitative analysis with the help of this calibration curve, without grinding and pelleting of the sample to be tested.
Since the samples were sorted according to the spectral intensity of Pb, the linearity of Cd was poor, only 0.5843. This result proved that the method of establishing the microdamage calibration curve was not suitable for two or more elements at the same time. In order to microdamage quantitative analysis of multiple heavy metals by LIBS with the help of this method, it is necessary to establish the calibration curve of each element first, and then microdamage quantitative analysis of the heavy metals by LIBS in the sample simultaneously. This will lead to our next work; applying this method to microdamage quantitative analysis of the heavy metals of more samples of TCM by LIBS.

4. Conclusions

In this study, a calibration method for microdamage quantitative analysis of Pb of laurel leaves by LIBS was successfully established. With the help of this calibration curve, the samples to be tested could be analyzed by LIBS without grinding and pelleting. Although two elements, i.e., Cd and Pb, were experimented simultaneously, all the samples were sorted according to the spectral intensity of Pb, so the linearity of Cd element was poor. In order to further improve the linear relationship, more samples should be prepared and the samples with large single-pulse RSD values can be removed, so that more accurate results can be obtained. This method can better reflect the characteristics of rapid analysis of LIBS. The preliminary results of this experiment indicated that the calibration method could be used in microdamage quantitative analysis of elements in TCM and other naturally grown samples, so as to obtain the distribution information of elements in the sample which might play an important role in plant science.

Author Contributions

Conceptualization, N.Z.; Data curation, L.F. and F.C.; Formal analysis, M.M. and G.Y.; Investigation, X.C.; Validation, N.Z.; Writing—original draft, L.F. All authors will be informed about each step of manuscript processing including submission, revision, revision reminder, etc. All authors have read and agreed to the published version of the manuscript.

Funding

This work was partly supported by the National Natural Science Foundation of China (NNSFC) (Nos. 62001453 and 21735005,) and the Chinese Academy of Science and Technology Service Network Planning (No. KFJ-STS-QYZD-2021-04-001).

Institutional Review Board Statement

Not applicable.

Informed Consent Statement

Not applicable.

Data Availability Statement

Not applicable.

Conflicts of Interest

The authors declare no conflict of interest.

References

  1. Cao, L.; Wang, Y.; Wu, L.; Zhou, J.; Sun, L.; Xu, X. Laser Induced Breakdown Spectroscopy and its Application in the Pharmaceutical Market. Chin. J. Pharm. Anal. 2021, 41, 13–20. [Google Scholar]
  2. Wang, Z.; Afgan, M.S.; Gu, W.; Song, Y.; Wang, Y.; Hou, Z.; Song, W.; Li, Z. Recent Advances in Laser-Induced Breakdown Spectroscopy Quantification: From Fundamental Understanding to Data Processing. Trends Anal. Chem. 2021, 143, 116385. [Google Scholar] [CrossRef]
  3. Zhang, H.; Guo, X.; Long, J.; Long, J.; Pan, H.; Li, Q. Detection and Analysis of Elements in Yam by Laser Induced Spectroscopy. J. Shenyang Ligong Univ. 2019, 38, 87–91. [Google Scholar]
  4. Li, A.; Wang, X.; Xu, X.; He, Y.; Guo, S.; Liu, Y.; Guo, W.; Liu, R. Fast Classification of Tobacco Based on Laser-Induced Breakdown Spectroscopy. Chin. Opt. 2019, 12, 1139–1146. [Google Scholar]
  5. Galiová, M.; Kaiser, J.; Novotný, K.; Samek, O.; Reale, L.; Malina, R.; Páleníková, K.; Liška, M.; Čudek, V.; Kanický, V.; et al. Utilization of laser induced breakdown spectroscopy for investigation of the metal accumulation in vegetal tissues. Spectrochim. Acta Part B At. Spectrosc. 2007, 62, 1597–1605. [Google Scholar] [CrossRef]
  6. Ding, J.; Zhang, D.; Wang, B.; Feng, Z.; Liu, X.; Zhu, J. The Classification of Plant Leaves by Applying Chemometrics Methods on Laser-Induced Breakdown Spectroscopy. Spectrosc. Spectr. Anal. 2021, 41, 606–611. [Google Scholar]
  7. Modlitbová, P.; Novotný, K.; Pořízka, P.; Klus, J.; Lubal, P.; Zlámalová-Gargošová, H.; Kaiser, J. Comparative investigation of toxicity and bioaccumulation of Cd-based quantum dots and Cd salt in freshwater plant Lemna minor L. Ecotoxicol. Environ. Saf. 2018, 147, 334–341. [Google Scholar] [CrossRef] [PubMed]
  8. Guerra, M.B.B.; Adame, A.; de Almeida, E.; De Carvalho, G.G.A.; Brasil, M.A.S.; Santos, D.; Krug, F.J. Direct Analysis of Plant Leaves by EDXRF and LIBS: Microsampling Strategies and Cross-Validation. J. Anal. At. Spectrom. 2015, 30, 1646–1654. [Google Scholar] [CrossRef]
  9. Galiová, M.; Kaiser, J.; Novotny, K.; Hartl, M.; Kizek, R.; Babula, P. Utilization of Laser-Assisted Analytical Methods for Monitoring of Lead and Nutrition Elements Distribution in Fresh and Dried Capsicum annuum L. Leaves. Microsc. Res. Tech. 2011, 74, 845–852. [Google Scholar] [CrossRef] [PubMed]
  10. Zheng, P.; Li, X.; Wang, J.; Zheng, S.; Zhao, H. Quantitative Analysis of Cu and Pb in Coptidis by Reheated Double Pulse Laser Induced Breakdown Spectroscopy, Acta. Phys. Sin. 2019, 68, 125202. [Google Scholar] [CrossRef]
  11. Li, X. Detection of Metal Elements in Artemisia Annua Based on Laser Induced Breakdown Spectroscopy; Chongqing University of Posts and Telecommunications: Chongqing, China, 2020. [Google Scholar]
  12. Liang, J. Research on Danshen (Salcia miltiorrhiza) Traceability and Multivariate Calibration Method Based on Laser Induced Breakdown Spectroscopy Technology and Machine Learning Strategies; Northwest University: Xi’an, China, 2021. [Google Scholar]
  13. Su, L.; Shi, W.; Chen, X.; Meng, L.; Yuan, L.; Chen, X.; Huang, G. Simultaneously and Quantitatively Analyze the Heavy Metals in Sargassum Fusiforme by Laser-Induced Breakdown Spectroscopy. Food Chem. 2021, 338, 127797. [Google Scholar] [CrossRef] [PubMed]
  14. Zhang, X.; Yao, M.; Liu, M.; Lin, Y. Quantitative Analysis of Chromium in Kelp by Laser-Induced Breakdown Spectroscopy. Acta Agric. Univ. Jiangxiensis 2012, 34, 187–190. [Google Scholar]
  15. Yang, L.; Meng, L.; Gao, H.; Wang, J.; Zhao, C.; Guo, M.; He, Y.; Huang, L. Building a Stable and Accurate Model for Heavy Metal Detection in Mulberry Leaves Based on a Proposed Analysis Framework and Laser-Induced Breakdown Spectroscopy. Food Chem. 2021, 338, 127886. [Google Scholar] [CrossRef] [PubMed]
  16. Peng, J.; He, Y.; Zhao, Z.; Jiang, J.; Zhou, F.; Liu, F.; Shen, T. Fast Visualization of Distribution of Chromium in Rice Leaves by Reheating Dual-Pulse Laser-Induced Breakdown Spectroscopy and Chemometric Methods. Environ. Pollut. 2019, 252, 1125–1132. [Google Scholar] [CrossRef] [PubMed]
  17. Ma, M.; Fang, L.; Zhao, N.; Huang, J.; Meng, D.; Pan, C.; Liu, J.; Liu, W. Simultaneous Detection of Heavy Metals in Solutions by Electrodeposition Assisted Laser Induced Breakdown Spectroscopy. J. Laser Appl. 2022, 34, 012021. [Google Scholar] [CrossRef]
Figure 1. Leaf samples soaked in heavy metal solution.
Chemosensors 10 00242 g001
Figure 2. Schematic of sample processing: (a) sample after detected by LIBS and (b) cut into two parts.
Chemosensors 10 00242 g002
Figure 3. Spectra of Cd and Pb in leaves.
Chemosensors 10 00242 g003
Figure 4. The single-pulse RSD values of Cd and Pb.
Chemosensors 10 00242 g004
Figure 5. Sorted samples according to Pb spectral intensity.
Chemosensors 10 00242 g005
Figure 6. Samples divided into 42 groups according to intensity of Pb.
Chemosensors 10 00242 g006
Figure 7. Calibration curve of (a) Pb and (b) Cd.
Chemosensors 10 00242 g007
Figure 8. Calibration curve of low content Pb.
Chemosensors 10 00242 g008
Table 1. The concentrations of Cd and Pb of the 15 gradient solutions (unit: μg/L).
No. of SolutionCdPb
10.000.00
24.697.39
39.3914.79
423.4736.97
546.9473.95
693.87147.89
7234.68369.73
8469.35739.45
9938.71478.9
102346.753697.25
114693.573,94.5
12938714,789
1323,467.536,972.5
1446,93573,945
1593,870147,890
Table 2. Digestion procedure of the leaves sample.
Digestion StepPressure (Pa)Temperature (°C)Time (s)Power (W)
1301002101800
2301001501800
3401401201800
4401401501800
5501801201800
65018018001800
Publisher’s Note: MDPI stays neutral with regard to jurisdictional claims in published maps and institutional affiliations.

