1. Introduction
The continuous increase of the international trade and global economy boosts the demand for sensors and measurement techniques able to detect humidity, especially at low levels, with high stability. Moreover, there is the need of developing devices easy to integrate in sensor networks and distributed measurement systems, which can effectively find an application in a further variety of fields such as agriculture [
1,
2], food industry [
3], clinical, and biological applications [
4] as well as in environmental monitoring. The technological progress and the growing specialization of electronics in the production of miniaturized and low-power devices have made it possible to exploit different sensing techniques based, e.g., on optical methods [
5,
6], mechanical or acoustic phenomena [
7], and on the chemical absorption properties of materials [
8,
9], just to name a few. Among the different mechanisms exploited for humidity sensing, the use of resonant devices and in particular, of quartz crystal microbalances (QCM) combined with hygroscopic materials used for the functionalization of the QCM surface, have become more and more popular due to the advantages of high sensitivity, low cost, and excellent stability. The working principle of these devices exploits the material capability of absorbing/desorbing water molecules from the atmosphere, which implies a change in the functionalized ad-layer characteristics, which in turn affects the resonant behavior of the crystal and is directly reflected in a variation of the quartz resonant frequency. The Sauerbrey equation is usually used to describe the relationship between the variation of the mass of the ad-layer and the modal frequency, as follows:
where
and
are the quartz density and shear modulus, respectively,
A is the area of the electrodes,
fs the modal frequency of the quartz, and
m the mass variation at quartz surface due to the water adsorption. This equation adequately describes rigid mass depositions on the quartz surface, but it is also commonly applied in the case of gas and humidity sensing, relying on the assumption that water and gas molecules are absorbed by the functionalized layer, rigidly deposited on the electrode’s surface [
10] without affecting any other of its mechanical characteristics but its mass. Actually, in the case of humidity sensing, this hypothesis is not always acceptable, since the large water uptake, which involves multilayer adsorption and capillary condensation typical of many hygroscopic porous or nanostructured materials, can induce relevant changes also of other mechanical characteristics.
Recently, a wide variety of humidity-sensitive materials have been deeply investigated by researchers as being promising for sensor realization including metal oxide, polymers, or carbon-based materials [
11,
12,
13]. In particular, a great attention has been focused on carbon-based materials, and, among the nanoscale ones, carbon nanotubes (CNTs) have shown promising performance due to their large specific surface area and hollow geometry. Moreover, their extremely high adsorption capability makes them suitable for designing extremely performant humidity sensors [
14,
15,
16,
17,
18].
In this paper series, we investigated the humidity-sensing properties of single-wall carbon nanotube (SWCNT) networks, exploiting AT-cut quartz crystal microbalances. In order to analyze the humidity-sensing mechanism, the variation of both the resonance frequency and the motional resistance of SWCNT-coated quartz family were monitored, simultaneously and in real time, while varying the relative humidity (RH) level in the range of 10–80%.
As mentioned above, we can exploit the direct relationship (at least for low humidity levels) between frequency variation and adsorbed mass, to investigate the water absorption/desorption mechanism on the sensing film, excluding the effects of complex additional phenomena influencing the measured electrical quantity, as for instance charge transfers in the case of resistive or FET-type sensors. Moreover, the monitoring of the motional resistance of the resonant device, provides additional information on the formation of condensed water.
In this first paper of the series, the physical/chemical phenomena involved in the sensing mechanism are deeply investigated. The paper provides the complete theoretical background needed to interpret the experimental data reported in the following paper ([
19] intended as Part 2 of this paper) and to derive some considerations that can be exploited for the optimization of sensors based on the investigated sensing material or on similar ones.
To provide a complete theoretical framework, two mechanisms are taken into account. The first one is the adsorption, or more generally speaking, the uptake of water on thin films consisting of disordered networks of CNTs, and the second one is the influence of this uptake on the vibrational behavior of QCMs.
The paper is therefore organized as follows: at first, in
Section 2, the water uptake on CNT networks is discussed. Then, in
Section 3, the effect of thin film deposition on the QCM resonant behavior is discussed. In
Section 4, the effect of water adsorption on CNTs’ networks deposited on quartz is discussed. In
Section 5, simulations embedding the model reported in
Section 4 and the mechanisms described in
Section 3 and
Section 5 are used to predict the behavior of a QCM relative humidity (RH) sensor functionalized with the investigated sensing material in terms of resonant frequency and motional resistance. Finally, the conclusions are drawn.
2. Water Adsorption on Nanostructured Carbon-Based Materials: CNTs Networks
Their unique geometrical structures, as well as their chemical inertia, have made CNT-based materials a key component for the realization of new-generation sensors. In particular, they can be counted among the foremost materials for moisture adsorption, due to their large specific surface area and hollow geometry. Generally, carbon atoms provide many π-electron bonds with water molecules. The primary CNTs’ water interaction takes place along the inter-tube spaces formed between adjacent tubes; thus, the natural CNT attitude to form bundles of individual tubes ensures a large amount of useful absorption sites for water interaction. Moreover, the presence of defects or impurities on the CNT surface may provide additional absorption sites. This interaction, named as first-layer absorption [
20,
21,
22], is characterized by the dissociation of water molecules that form hydroxyl ions and a large quantity of chemisorbed strongly bound dissociated water. The adsorbed water in this case forms a first ice-like layer. Accordingly, the absorption behavior at the sensing film interface can be described by the following reversible reaction:
where
are the water vapor molecules,
indicates the absorption sites on the sensing surface and
kA and
k−A, the adsorption and desorption reaction rate, respectively. At higher humidity levels, the amount of absorbed water molecules increases due to the formation of subsequent physiosorbed water layers thanks to the interactions with additional sites
at the adsorbates, as to form a typical multilayer coverage of the film by means of hydrogen bonds [
21,
23,
24,
25]. The resulting reaction can be described as:
where
kB,
k−B are the reaction rate constants and
indicate the physiosorbed water.
The above-mentioned model adequately describes the absorption behavior of water on nanosized-based structures such as CNTs and can be used to model water adsorption at low and moderate RH levels, typically with RH levels below 70%. More in general, this model can be applied also when other gas species (such as VOCs, NO2, CO, etc.) are considered, rewriting a reaction similar to reaction (2) for the gas of interest and describing its adsorption route at the working temperature. As for reaction (3), which describes the formation of a multilayer, usually this is not needed to describe adsorption for typical target gases since they are present in low concentrations, and presumably only adsorption on the film surface described by reaction (2) takes a role, describing the formation of a monolayer of adsorbed molecules.
For higher humidity concentrations, the water uptake becomes very large due to capillary condensation that may occur in the inter-tube empty spaces [
26,
27,
28]. This can also lead to changes in the sensing layer morphological structure and in the adherence with the supporting surface.
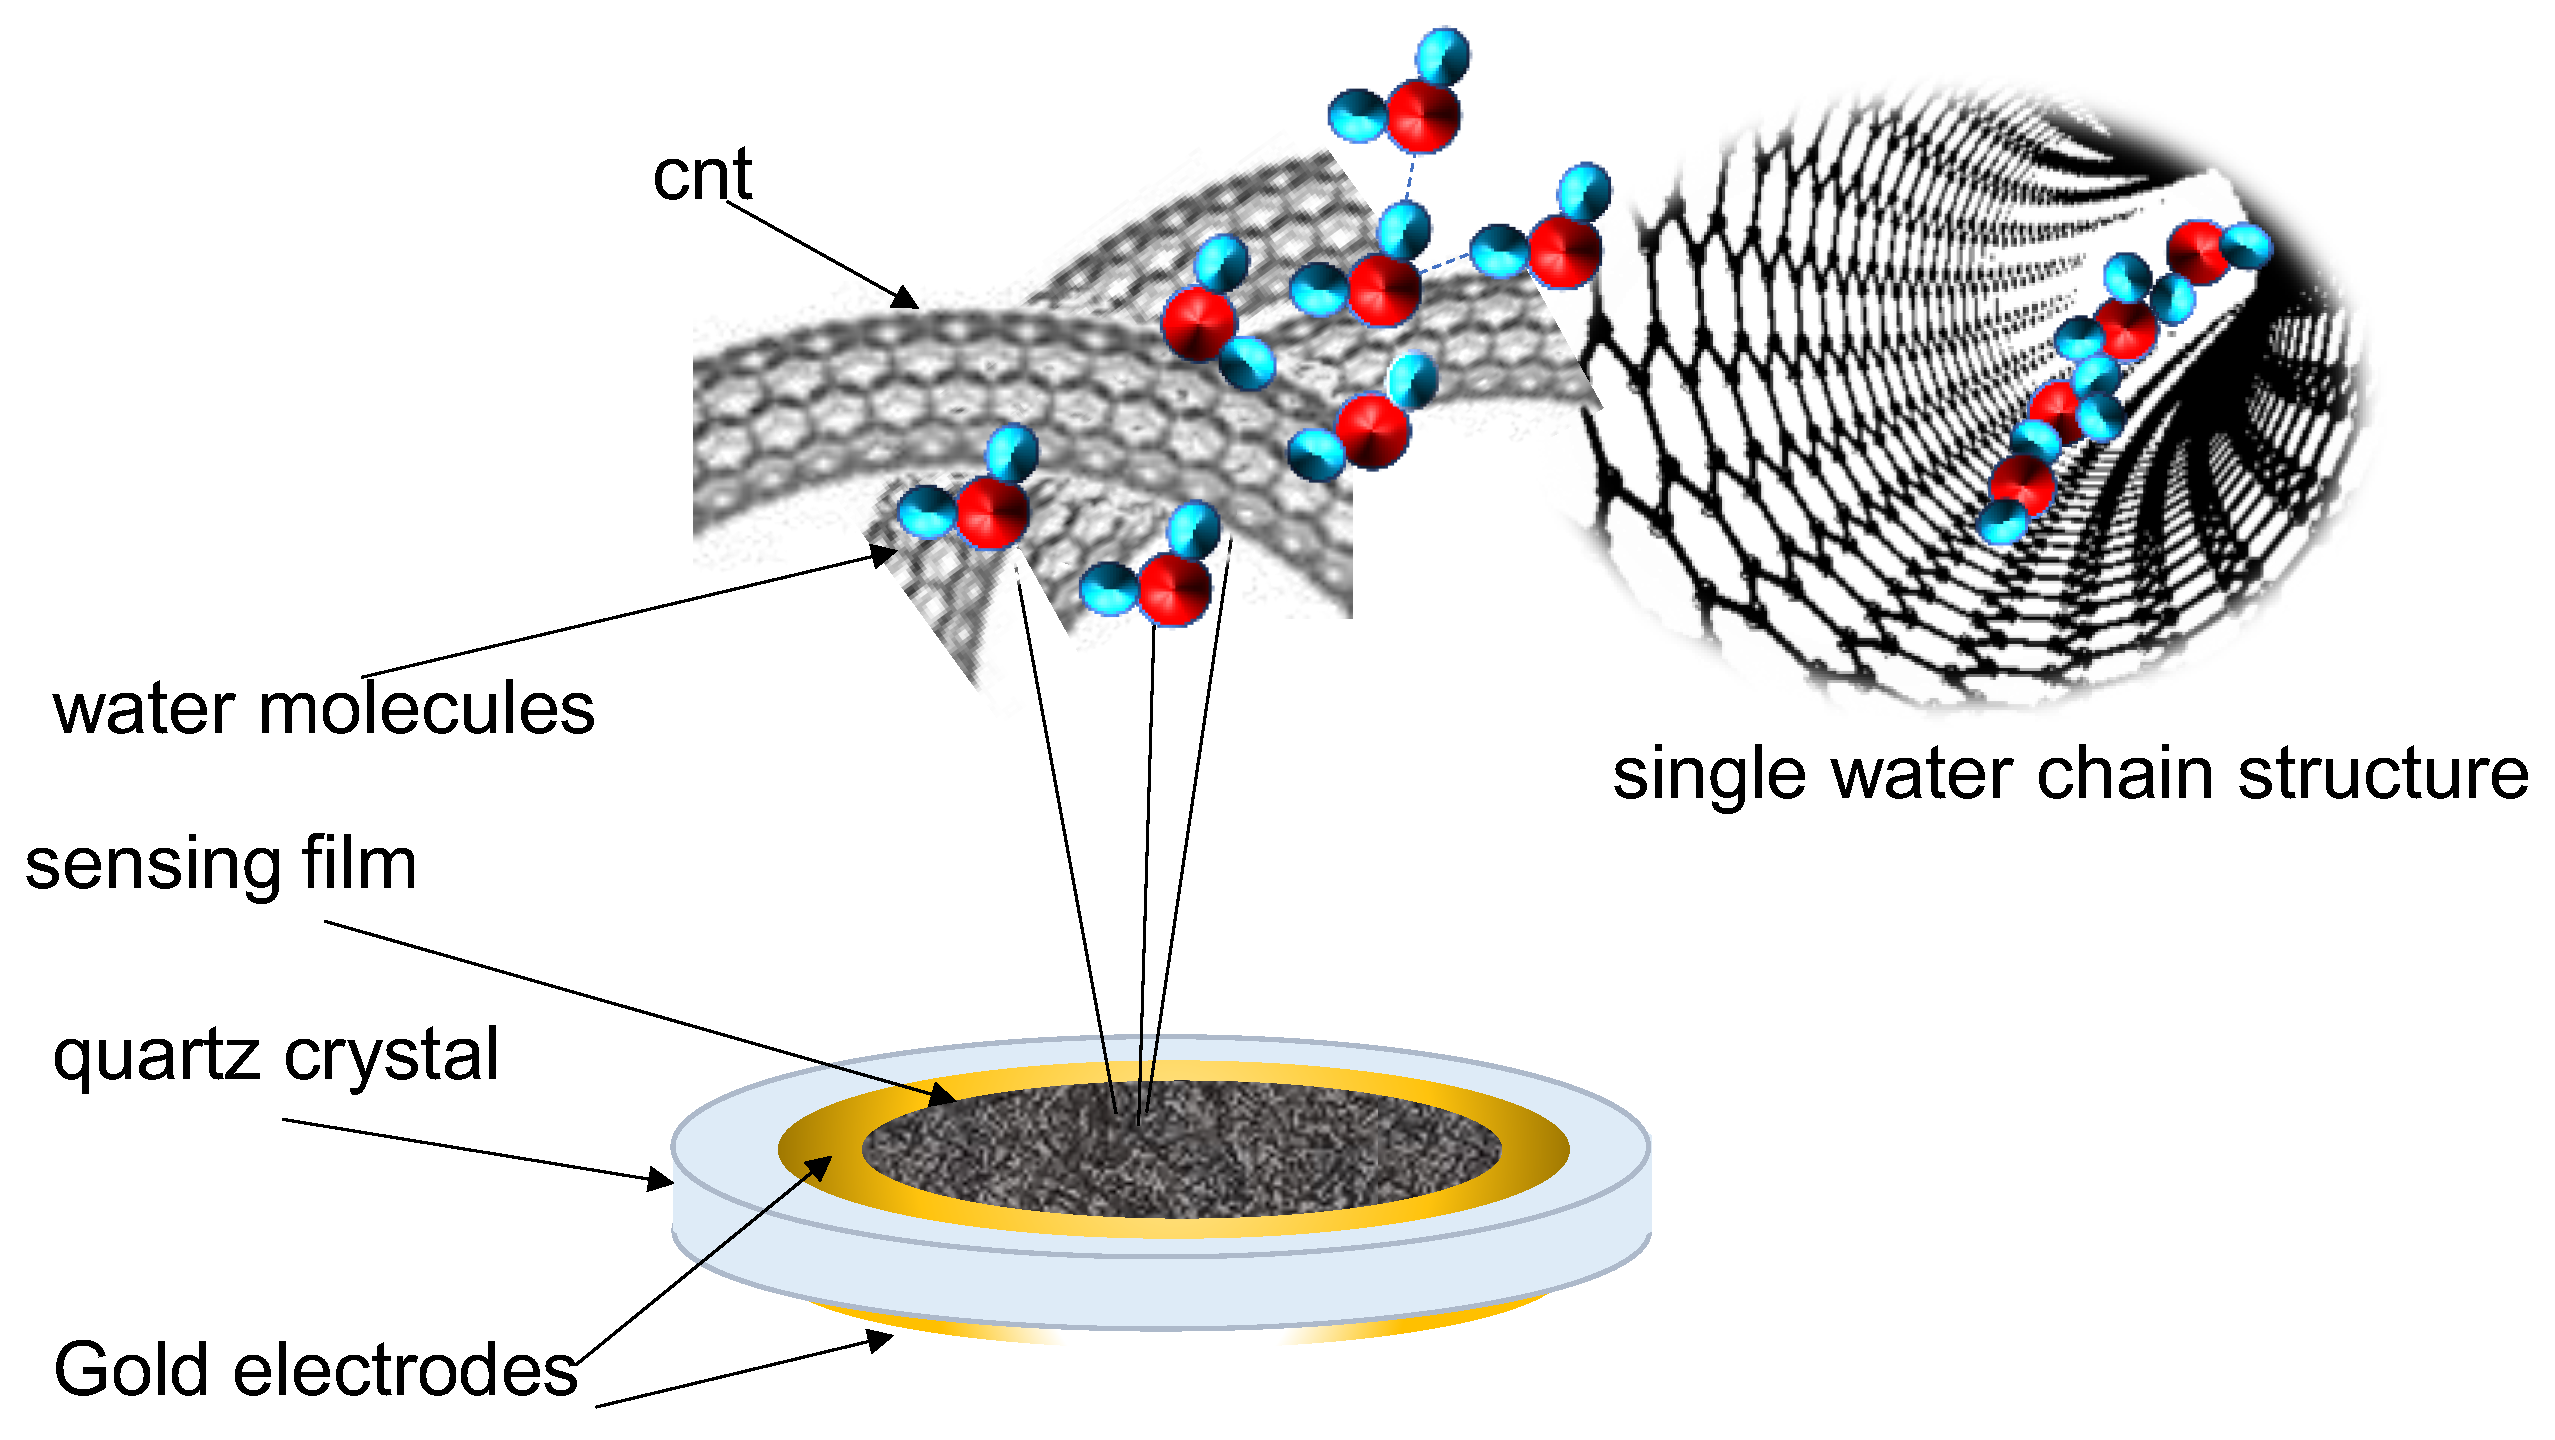
Note that, when water molecules penetrate the CNT’s structure, after absorption on the superficial sites, the water–CNT interaction mechanism may exhibit particular properties. These latter are due to the intrinsically hydrophobic nature of the CNT’s walls that tend to hinder the interaction with water molecules by conveying them towards the center of the tube. In this case, water molecules may take different forms depending on the specific tube diameter and on the operating temperature and pressure. For CNTs operating at RT and with a tube diameter smaller than 1 nm, as in the case of this work, water molecules tend to form ice-like single chains placed at the center of the tube (as schematically depicted in
Figure 1), whereas in the case of a tube with a larger diameter, they may assume more complex structures such as concentric multiple rings forming water-tube structures [
29,
30]. In summary, water adsorption depends greatly on the CNT diameter and length due different adsorbates’ dimensional confinement and proximity to the hydrophobic walls. The dependence of water adsorption on the CNT geometry and film characteristics (and also on temperature) can be accounted for by changing the parameters
K−A and
KA in reaction (2) and
K−B and
KB in reaction (3). In any case, even if with different dynamic and steady state responses, (2) and (3) can always describe chemisorption and physisorption and allow for a qualitative modeling of RH sensing with nanostructured materials at low and medium RH levels.
This is an important aspect when the sensing film characteristics are investigated by means of QCM-based measurements. In this case, the physical changes of material properties such as internal stress (due to layers expansion), stiffness, or viscosity variations, can influence the measurement of the target phenomenon, deviating from the observation of the water mass adsorbed/desorbed by/from the sensing film.
3. QCM Monitoring of Adsorption on Thin Layers
The response of the quartz in the application of interest is derived starting from the model of a pristine quartz. In this discussion, the quartz considered is the one used for the measurements, i.e., an AT-cut quartz, which vibrates in shear thickness mode in air, with active area
A, thickness
t, density
electric permeability
piezoelectric coefficient e
53. Since a gas surrounds the quartz, the boundary conditions for the acoustic field at the quartz surfaces are characterized by a null shear stress. Exploiting these conditions, the mechanical impedance of the quartz can be found, and, in turn, it can be transformed into an electrical impedance due to the piezoelectric electromechanical coupling. In particular, the electrical impedance of the crystal can be written as follows:
where
is the angular frequency,
is the electrical capacitance of the quartz, whereas
, is the shear wave speed in the quartz, and
is the complex shear modulus,
being the shear modulus, and
the viscosity of the quartz.
K is the piezoelectric coupling coefficient.
The expression of the impedance can be expanded around the resonance frequency (where the tangent goes to zero), exploiting the approximation of the tangent , with N a natural number.
The expansion allows for approximating the impedance in Equation (4) with a lumped parameter network, where the quartz is represented by the parallel of the electrical capacitance and an infinite number of motional branches (
N = 1, …, ∞), each represented by a series resonant circuit, i.e., by the following impedance [
31,
32]
where:
Considering only the first branch, with
N = 1, i.e., considering using the quartz close to its first resonant frequency, the impedance in Equation (5) corresponds to the motional branch of a lumped parameter network called Butterworth Van Dyke (BVD) model shown in
Figure 2, which approximates the behavior of the QCM well. In the BVD model, the pure electric branch formed by the capacitance
C0 is in parallel with the motional branch (
L1,
R1, and
C1), which represents the mechanical behavior of the quartz, with impedance
Zm,1 and series resonance frequency:
The QCM functionalized with a sensing layer deposited on top of one of the two electrodes is a quartz in contact with a material supporting shear waves; this situation corresponds to a change of the boundary conditions at one of the quartz surfaces. Therefore, the acoustic field inside the quartz changes, and this is reflected into a transformation of the equivalent circuit model.
Figure 3 describes in a simple way what happens when a layer of a homogeneous attenuating medium with thickness
h, is in contact with the quartz.
Note that the possibility of describing a nanostructured film as a homogeneous layer depends on the average size of microstructures forming the film: if the film is heterogeneous, the accuracy of the ‘homogeneous layer’ model depends on the ratio of the average size of the structures forming the film (from some nanometers, diameter of the tubes, to few microns, length of the tubes, in the case of interest) and the wavelength of the shear wave (in solids, larger than one hundred microns).
The acoustic impedance of the film can be written as follows:
where
and
are the shear stress and displacement, respectively, whereas
, is the complex shear wave speed in the film, and
. The attenuation of the acoustic wave in the film is indicated by
.
This Equation was first derived by Lu and Lewis [
33].
The electric equivalent can be found multiplying the mechanical impedance by the piezoelectric gain such that the equivalent electrical impedance of the film results:
From Equations (8) and (9), it can be seen that the equivalent impedance of the film is proportional to the acoustic impedance of the material forming the film,
, and to the complex tangent of the phase shift across the film. At
, the “film resonance” occurs [
32,
34,
35]. The film resonance is an example of a coupled resonance of the system quartz-film.
Considering always to work at frequencies much lower than the resonance of the film, the imaginary part of the impedance is positive as is the real part. The magnitude of the impedance imaginary part is related to the real part of the complex shear modulus, or equivalently of the wave speed, whereas the real part magnitude is related to the imaginary part of the shear modulus.
In the lumped parameter equivalent network, the impedance of the film is usually approximated by a resistance (for the real part of Zfilm) and an inductance (for the imaginary part of Zfilm), placed in series to the motional branch of the BVD circuit.
It can be seen that in the case that the film viscosity is equal to 0 (purely elastic medium), the electric impedance is a pure positive reactance (until the resonance); therefore, it behaves as an inductive load. Moreover, if the layer is thin, we can approximate the tangent with a first order Taylor expansion, obtaining exactly an inductive behavior with an inductance proportional to the film mass, Mf, i.e., , and .
On the other hand, if the film has a viscous behavior, there is also a resistive component, the magnitude of which depends on the phase of the complex wave speed or equivalently of the complex shear modulus.
We can consider as the limit case a film composed by a Newtonian fluid, where the phase of the complex wave speed can be considered maximum, being equal to 45°. In fact, for such media, we have by definition,, where is the shear strain, , and .
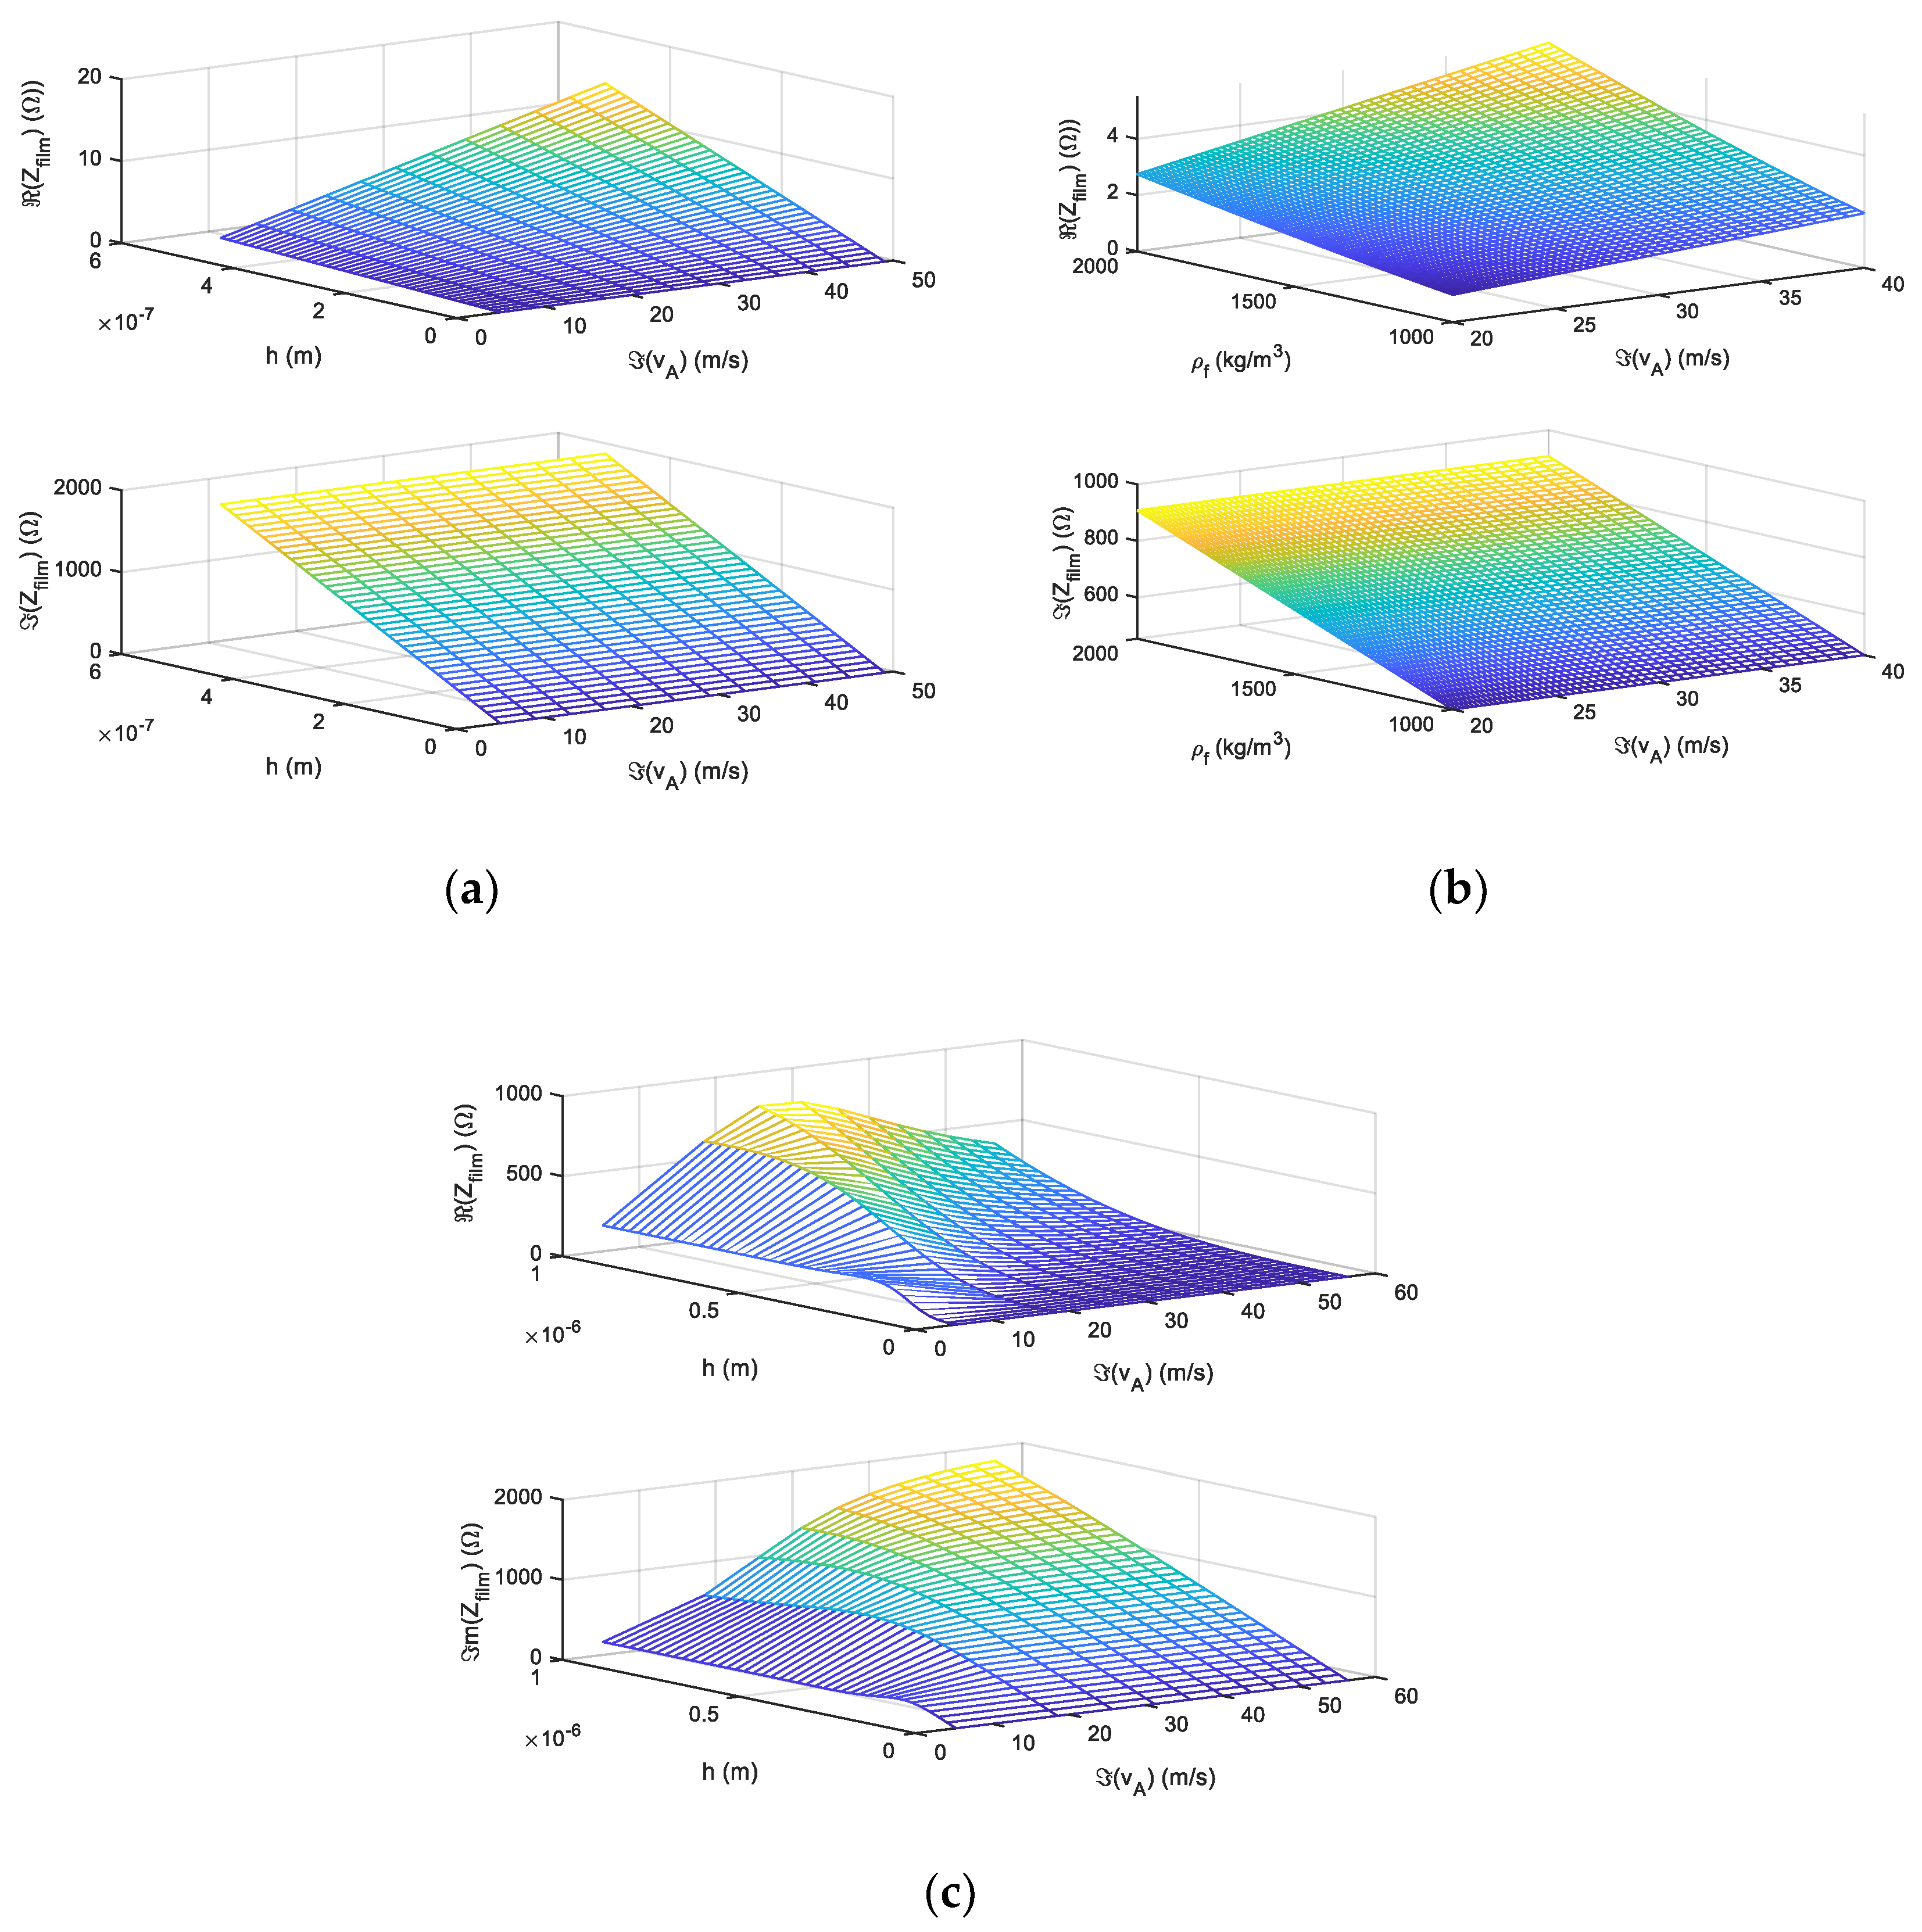
Figure 4a shows the real and imaginary parts of the film impedance for a solid film, with a fixed density and a large shear modulus, which illustrates the behavior of a layer formed by overlapped sheets of graphene [
36], as a function of the acoustic wave attenuation and of the film thickness.
Figure 4b shows the behavior of the film impedance and real and imaginary parts, for a solid film with the same large shear modulus of
Figure 4a, as a function of the attenuation of the wave and of the film density, but for a fixed film thickness.
Figure 4b represents approximately the behavior of a porous film of graphene.
Finally,
Figure 4c shows the impedance of a Newtonian liquid film (assuming the density of water). In the figure, the variation of the impedance is plotted as a function of the thickness layer and of the imaginary part of the speed. The figures show how thickness, density, and viscosity affect the real and imaginary part of the film impedance.
All the reported figures are obtained by calculations considering the characteristics of the QCM used in [
19], intended as part 2 of this paper, and listed therein in detail in the section ‘Material and Method’, which is an AT-cut crystal with a nominal resonance frequency of approximately 10 MHz.
The figures highlight that a large real part is characteristic of those films that behave similarly to Newtonian fluids, with a ratio of the imaginary and real part of the complex shear modulus close to one.
4. QCM Monitoring of Water Adsorption on CNT Networks
Equation (9) and the above figures show that the film impedance loading the quartz depends on the layer thickness h, and the physical properties of the film, and , and in the above theory, the film is considered as a homogeneous layer characterized by these constant parameters.
If the film is not a homogeneous layer, but the inhomogeneities have average sizes much smaller than the wavelength in the film, then the physical properties of the film can assumed to be average values over space.
In solids, at 10 MHz, the wavelength typically is larger than 100 μm, the investigated case where the film consists of a disordered network of SWCNTs made of very small solid parts and voids, the film behaves as a porous medium, which is equivalent to a homogeneous elastic material with a smaller density and shear modulus and a larger attenuation with respect to the compact film made of the solid phase [
37].
It is expected that the physical and morphological properties of the film change due to the exposure to humidity. In fact, the voids at the inter-grain barriers are at first filled with adsorbed ice-like water, which will cause an increase of the density of the film until it can be expected that the film swells, and its thickness also changes. In this regime, the film behaves as a solid elastic thin film and the equivalent impedance is essentially inductive, similarly to what is shown in
Figure 4a,b. Finally, the condensation of water in the nano or micro pores causes the attenuation of the wave to increase significantly, and the average wave speed to reduce. In this regime, when the film is exposed to high humidity levels, the behavior of the impedance gets closer to the one shown in
Figure 4c, for liquid water (Newtonian fluid).
The presence of the film impedance in the equivalent circuit of the QCM modifies the impedance of the motional branch and consequently its resonance. The overall impedance of the quartz can be approximated, as already, said using Equations (5), (6) and (9) and considering the film impedance to be in series with the quartz motional branch one as follows:
In this paper, an oscillator circuit is used to monitor the quartz behaviour, which provides the measurement of the real part of the overall impedance, i.e., the motional resistance,
, and the frequency of the first zero of the impedance phase.
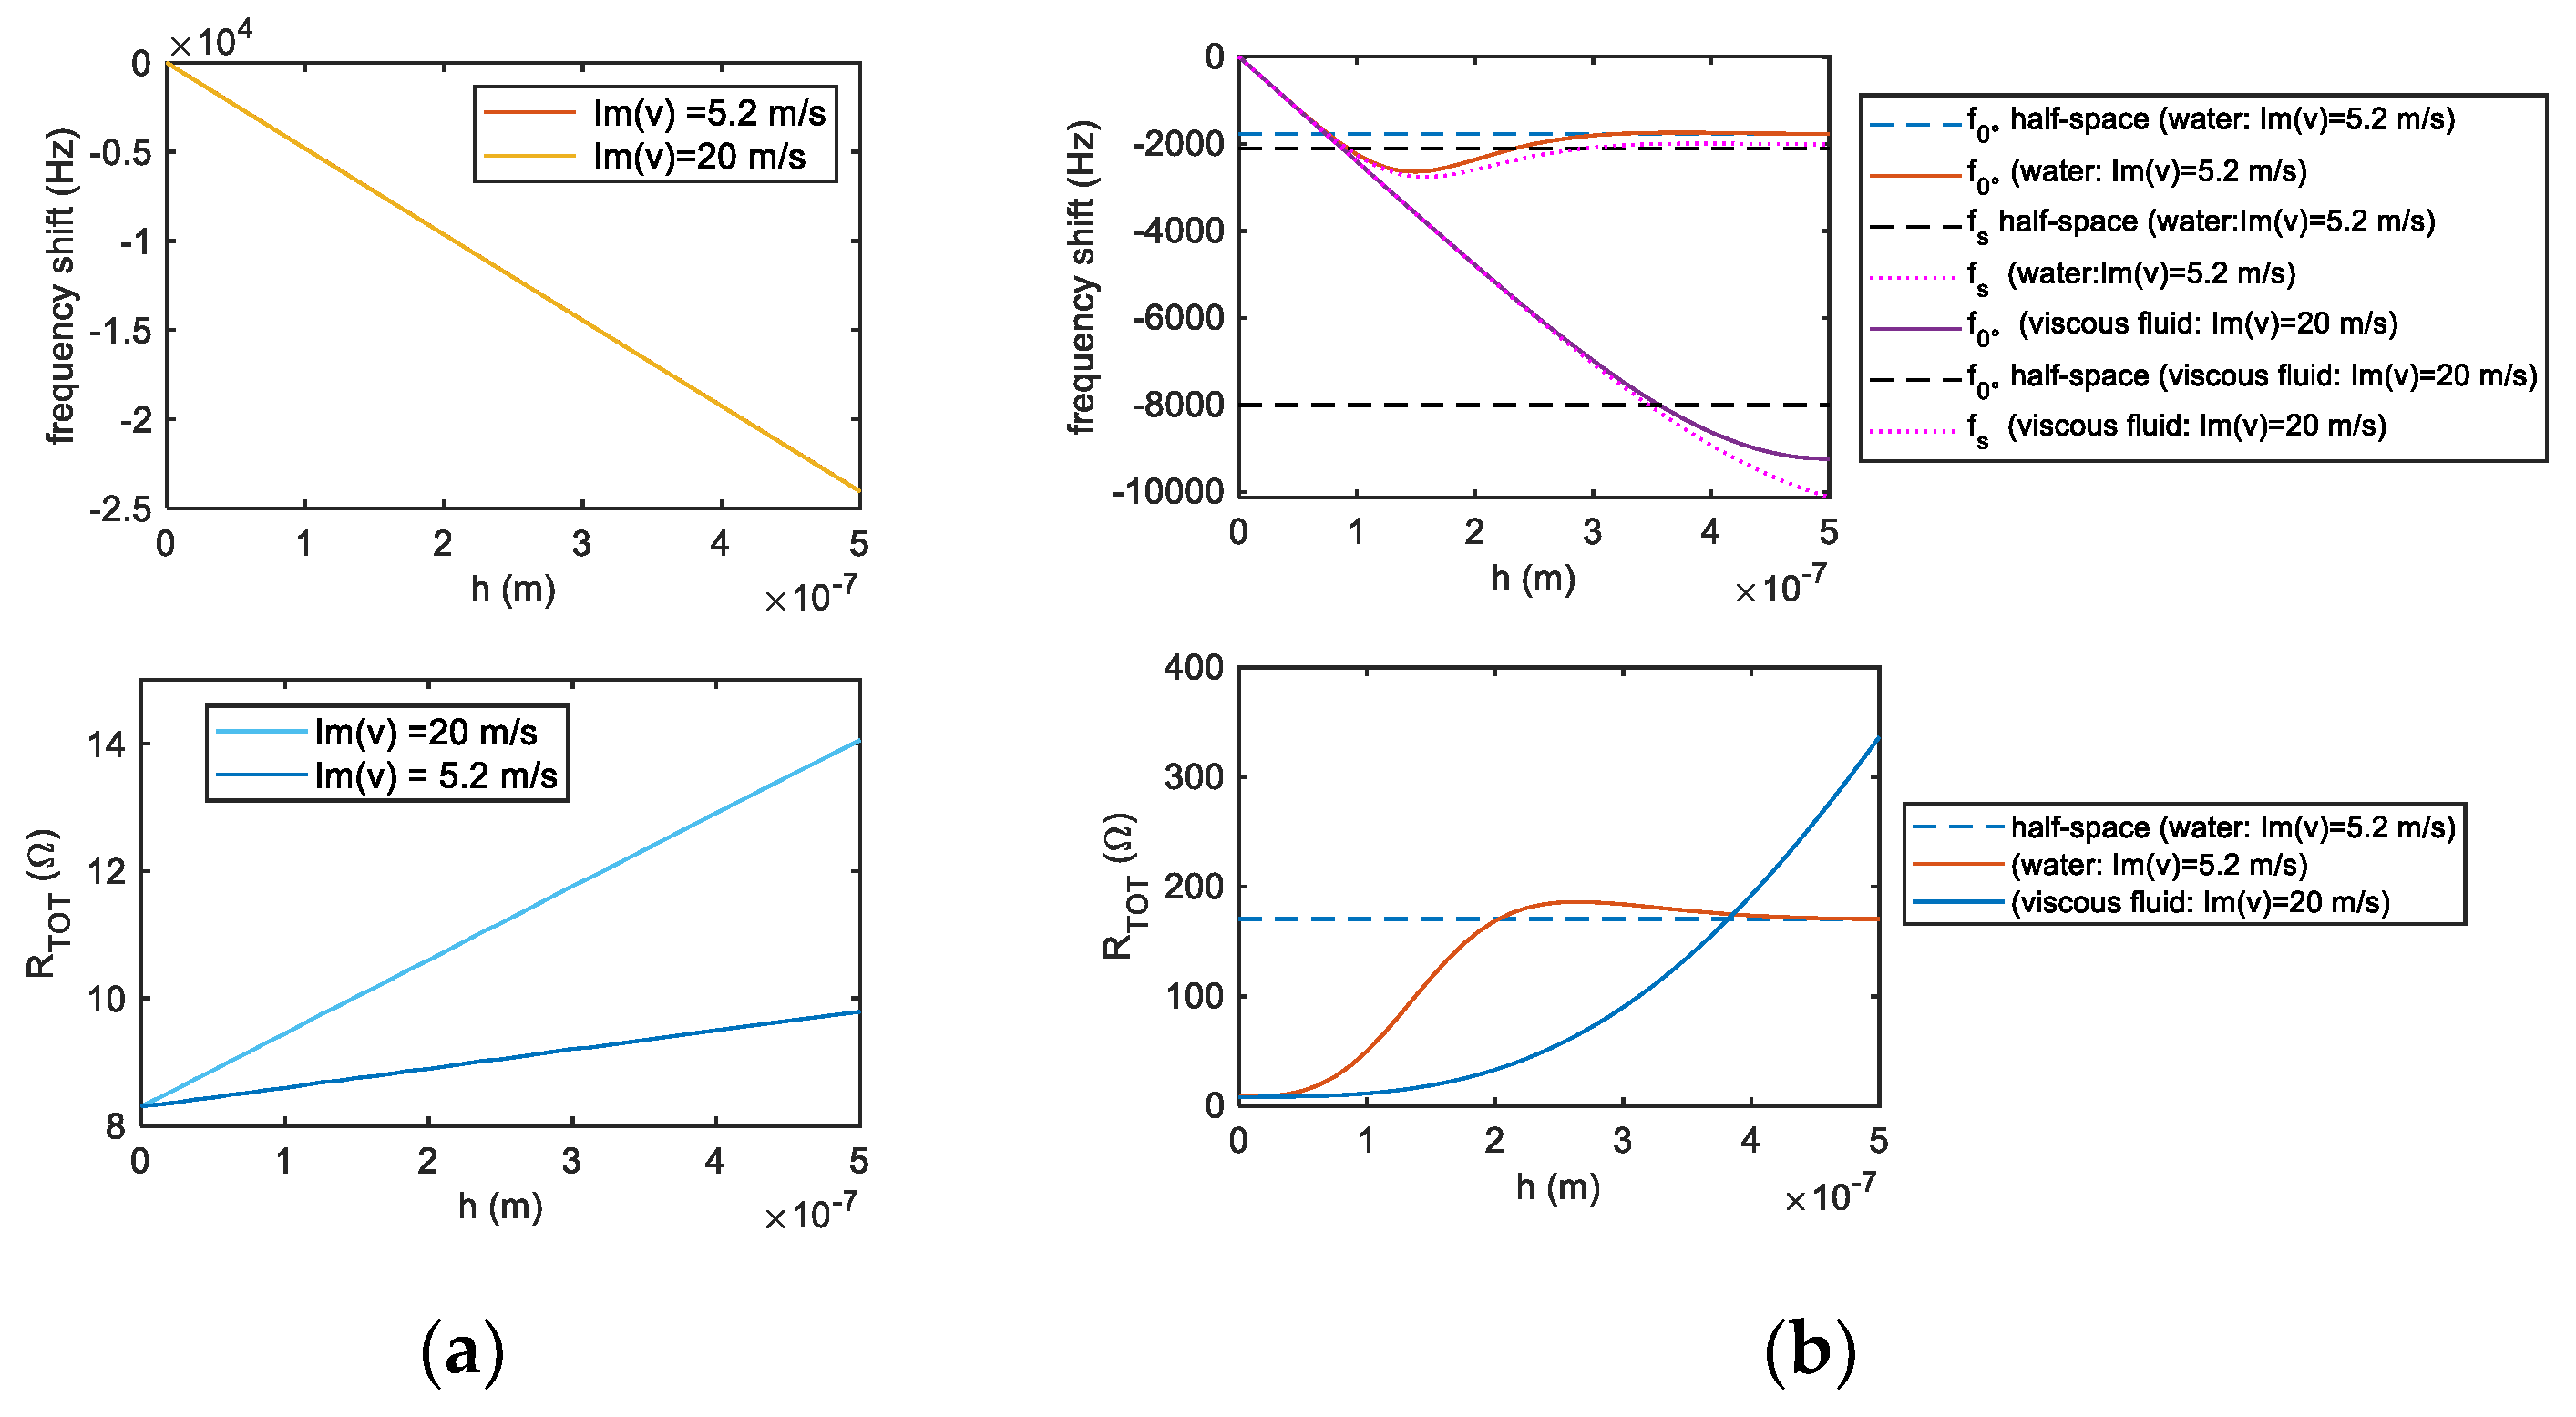
Figure 5a,b shows the effect of the film characteristics on these two parameters, for a solid film with the same characteristics simulated to obtain
Figure 4a and for two selected values of the imaginary part of the speed (as per legend). The zero-phase frequency is plotted as the shift with respect to the one obtained for the pristine quartz.
Figure 5a presents the results obtained for the solid film with properties similar to those of a compact layer of graphene, whereas
Figure 5b shows the results obtained for a Newtonian fluid with the same density of water and two different viscosities, the lower of which coincides with the one of water. It can be seen that for water, a very thin film (thinner than 100 nm) gives rise to a large frequency shift and to a large increase of the motional resistance, whereas for a solid film, large shifts of the frequency are accompanied by small increases of the resistance.
5. Model and Simulation of the QCM–RH Sensor Behavior
Exploiting the above theory, it is possible to predict the behavior of a QCM–RH sensor coated by a SWCNT network from simulations.
In particular, the simulations are aimed at predicting the parameters that will be measured and used in the experimental study presented in [
19], intended as the second part of this paper. These parameters, as already said in the previous section, are f
0°, i.e., the frequency where the QCM impedance is purely real, and R
tot, the motional resistance. Notice that measurements provide the assessment of f
0°, and not of fs, i.e., the series resonance frequency defined by Equation (7) and usually taken as representative of the QCM loading. These two frequencies almost coincide in the case of small dissipation, when R
tot assumes values of a few Ohms, whereas they may differ a lot in the presence of large dissipation, i.e., for large RH values [
38].
Figure 6 shows the simulation results for the QCM used for experiments in [
19], intended as the second paper of this series. In
Figure 6, the behavior of f
0°, and R
tot are plotted as functions of the RH level. The presented results are obtained, according to the theory presented above, in which the increase of the density of the film is considered as representative of the water adsorption, which in turn is assumed proportional to the RH level.
In this framework, the simulation results shown in
Figure 6 correspond to presenting the measured parameters as functions of the increasing film density, accepting as the base assumption of the model that an increase of RH causes a linear increase of the film density. The figures represent qualitatively the sensor responses vs. RH level, or equivalently, the calibration curves.
According to the discussion presented in the previous sections, the simulations shown in
Figure 6 account for a situation in which at first the density increases while the other mechanical parameters remain constant (representing the low RH regime); then, the film thickness is assumed also to increase together with the density (to model the intermediate RH range); and finally, a significant increase of the attenuation in the film is introduced (to describe the massive condensation of water typical of the high RH range).
The block diagram reported in
Figure 7 explains in more detail the procedure adopted in the simulations.
Figure 6a,b shows the measured parameters evaluated for films with different initial thicknesses: h
01, h
02, h
03 (10 nm, 20 nm, and 37.7 nm).
Figure 6a shows the measured parameter, f
0°, and the series resonance frequency, f
s, for comparison.
In contrast,
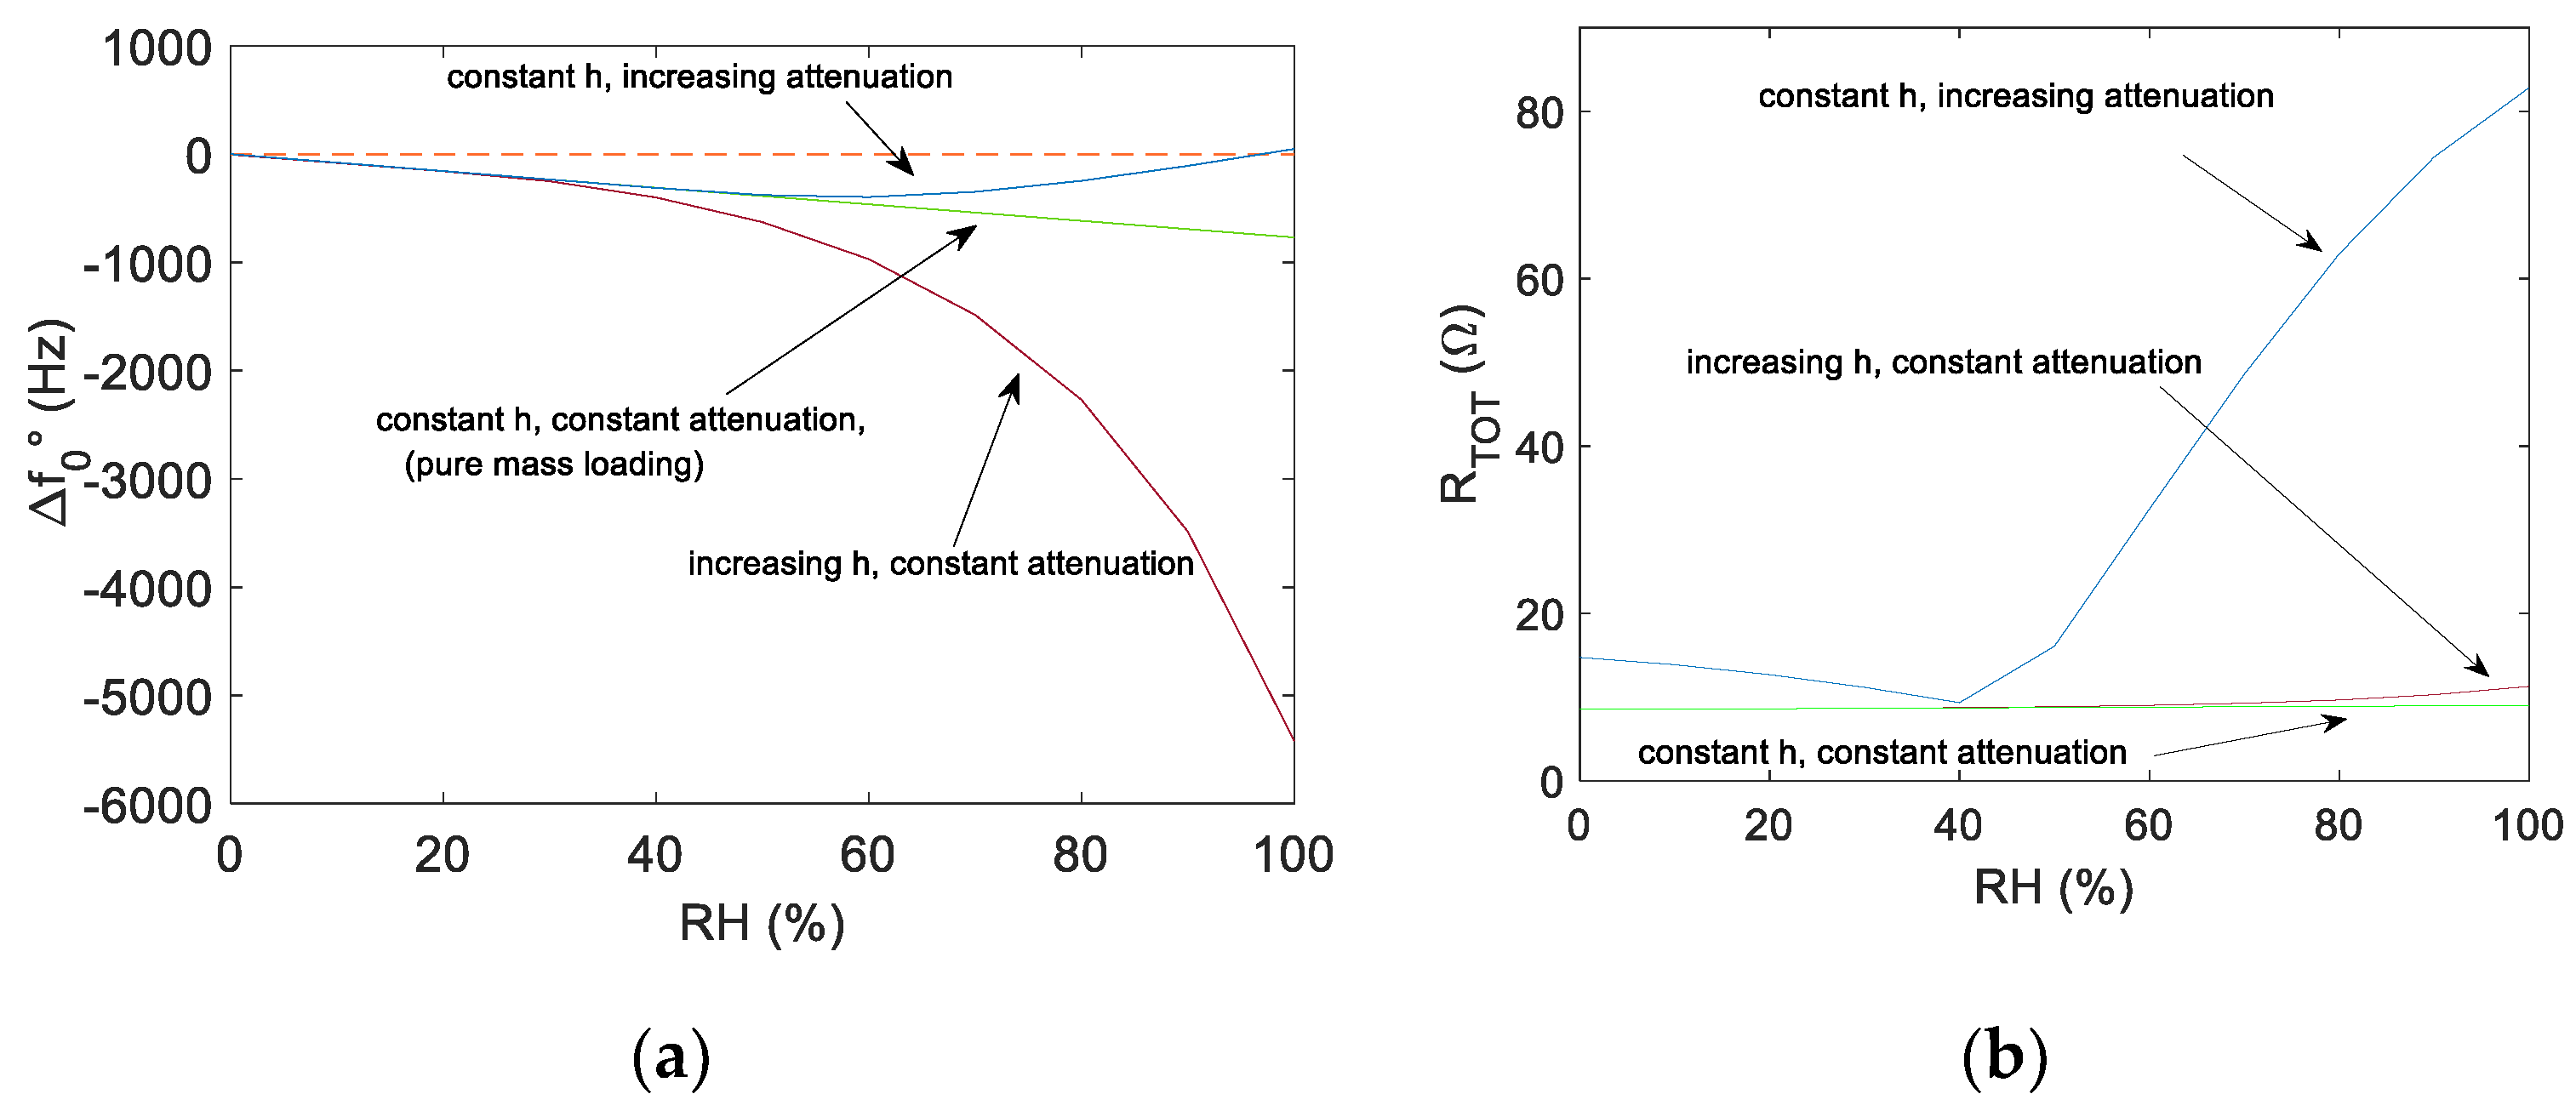
Figure 8 shows the trends of the measured parameters obtained by varying separately, but in the same ranges, the relevant characteristics of the film (thickness and attenuation) and points out their different influence on the sensor response indicating how their combined effect contributes to the overall sensing response.
These figures show that the swelling of the film simulated in the intermediate and high RH ranges is the mechanism hypothesized for enforcing the sensor response in terms of measured frequency shift at high RH. This gives rise to the non-linear sensor response characterized by a large increase of sensitivity as a function of RH observed in nanostructured sensing materials. On the other hand, the large increase of Rtot can be justified by the viscous behavior of water condensed in the pores.
In
Figure 6 and
Figure 7, it can be seen that in some cases at high humidity levels, the measured frequency shift shows a non-monotonous behavior. This has also been observed experimentally for some of the tested QCM sensors, as will be shown in part 2 of this paper [
19].


