Robust and Rapid Detection of Mixed Volatile Organic Compounds in Flow Through Air by a Low Cost Electronic Nose


Department of Electrical Engineering and Computer Science, University of Tennessee, Knoxville, TN 37996, USA
*
Author to whom correspondence should be addressed.
Chemosensors 2020, 8(3), 73; https://0-doi-org.brum.beds.ac.uk/10.3390/chemosensors8030073
Submission received: 14 July 2020
/
Revised: 17 August 2020
/
Accepted: 19 August 2020
/
Published: 21 August 2020
Abstract
:This work aims to detect volatile organic compounds (VOC), i.e., acetone, ethanol and isopropyl alcohol (IPA) and their binary and ternary mixtures in a simulated indoor ventilation system. Four metal-oxide-semiconductor (MOS) gas sensors were chosen to form an electronic nose and it was used in a flow-through system. To speed up the detection process, transient signals were used to extracted features, as opposed to commonly used steady-state signals, which would require long time stabilization of testing parameters. Five parameters were extracted including three in phase space and two in time space. Classifier and regression models based on backpropagation neural network (BPNN) were used for the qualitative and quantitative detection of VOC mixtures. The VOCs were mixed at different ratios; ethanol and isopropyl alcohol had similar physical and chemical properties, both being challenging in terms of obtaining quantitative results. To estimate the amounts of VOC in the mixtures, the Levenberg–Marquardt algorithm was chosen in network training. When compared with the multivariate linear regression method, the BPNN-based model offered better performance on differentiating ethanol and IPA. The test accuracy of the classification was 82.6%. The concept used in this work could be readily translated for detecting closely related chemicals.
1. Introduction
In last few decades, there have been various studies on the detection of volatile organic compounds (VOCs). VOCs are organic chemicals with low boiling points, so their molecules can evaporate from liquid or sublimate from solid form relatively readily. VOCs can be both human-made and naturally occurring, and some have adverse health effects on human. Detection of poisonous and explosive gases emitted from industry productions, indoor environments and biological processes is important for production control, environmental protection as well as human health. According to United States Environmental Protection Agency (EPA), some VOCs may have short-term and long-term adverse health effects such as irritation and headaches, damage to organs or cause cancer [1]. On-site VOC detection devices with high affordability, portability and accuracy are in high demand for many applications. Building materials, home & personal care products, combustion processes (e.g., paint, pressed wood products, cleaners, smoking, cooking) are the most common indoor VOCs sources. Some day-to-day foods such as pressed oil [2] and roasted coffee beans [3] may also contain VOCs. Major outdoor sources include traffic emissions, wood burning, oil & gas extraction and industrial emissions. VOC detection is also finding increasing applications in medical diagnosis, health monitoring and agriculture production and quality assessment. Applications include early cancer detection [4], determination of bacteria type in wound infections [5] or food contamination [6], odor detection [7], etc.
Recently, electronic noses are gaining popularity for on-site recognition of VOCs in practical settings [8,9] Typically, an electronic nose is composed of several gas sensors with different specificities and a suitable pattern recognition algorithm. Many types of gas sensors have been reported for use in electronic noses. Based on their principles of operation, most gas sensors can be classified into following types: electrochemical sensors [10]; chemiresistive sensors including metal oxide semiconductor (MOS) [11] and polymer or nanotube-based gas sensors; capacitive gas sensors [12]; calorimetric sensors [13]; acoustic gas sensors including quartz crystal micro-balance [14,15], surface acoustic wave gas sensors [16]; and optical sensors [17,18,19]. Among these types of sensors, MOS-based sensors are the most studied group of gas sensors with increasing popularity for gas sensing, especially for VOC detection, due to their characteristics such as low cost, short response time, measurement simplicity, durability and long lifetime. Electronic nose with MOS sensors has been used in many fields. A comprehensive review of progress, perspectives; challenges of electronic noses built with MOS sensors can be found in reference [20].
Usually, MOS gas sensors consist of a layer of specific sensing material (metal oxides) deposited on electrodes and an electrically isolated heater under the electrodes. Gas-sensing by metal oxides is based on conductivity changes in the presence of target gases. The MOS layer in a gas sensor is polycrystalline; the depletion regions at grain boundaries are modulated by target analytes—thus leading to a change in the movement of free charge carriers in the sensing materials. At high temperatures, oxygen is adsorbed on the surface of MOS, and donor electrons in the metal oxide are attached onto oxygen. A lack of free electrons reduces electric current flow. In the presence of target VOCs, the MOS sensor reacts with the VOCs, so there is less oxygen at the sensor surface. The electrons once attached to these oxygen molecules are released into the metal oxide, increasing the current flow and decreasing the sensor resistance. As the decrease in the concentration of the surface oxygen is proportional to the target gas concentration in air, the sensor resistance decreases correspondingly, thus realizing the detection of VOCs in air [21]. Because the response and recovery times decrease with temperature, MOS gas sensors usually need to work at elevated temperatures. The required preheat time of MOS sensors is usually more than 24 h if they are not used for a long time.
Gas sensors should be able to identify a specific analyte in a gas mixture. Ideally, a sensor is selective to its target compound with very low or zero cross-sensitivity for other compounds possibly present in its working environment. However, cross-sensitivity to non-target gases is common for gas sensors, and the sensor output will be affected by the presence of non-target gases. When challenged with a mixture of gases with similar chemical characteristics, a single MOS gas sensor is usually not adequate for specific recognition [22]. The selectivity problem of MOS gas sensors could be alleviated by using an array of sensors with different sensitivities along with a pattern recognition algorithm, which is commonly known as an electronic nose. Each sensor in the array has a preferred “target” gas that would yield a higher response than other gas species.
The electronic nose in this work composes of a four-MOS-sensor array to detect acetone and two types of alcohols—ethanol (also known as ethyl alcohol) and isopropyl alcohol (IPA) gases, as well as their random binary and ternary mixtures in air, with applications in the quality assessment of food and beverages. Ethanol and IPA have similar chemical structures, differing by the location of the alcohol group on their structures. Functionally, ethanol is used in alcoholic beverages while IPA is used in disinfectants. Presently, there are few reports of electronic nose systems distinguishing between ethanol and IPA. Employing optically active organic thin films and features extracted from their adsorption spectra, an optical-based electronic nose has been developed to achieve differentiation between alcohols [18,19]. For feature extraction, it needs a complicated operation sequence of pumping/switching between reference and sample gases to obtain several cycles of spectral responses. The optical readout either requires an expensive spectrometer or arrays of light emitting diodes, filters and photodetectors, much more complicated than a MOS gas-sensor-based system. Another effort incorporates a microfluid design with MOS sensors (Figaro® TGS 2602, Arlington Heights, IL, USA), by adding microchannels to sample gas for testing. Using microchannel coatings with different hydrophilicities, this MOS-based electronic nose can separate ketones and alcohols by their polarities, based on features related to their diffusion times through the microchannels [23]. The testing is done with a sealed box with gas introduction, equilibration and purging phases.
In our work, we choose an open air flow design that more closely mimics a real life detection setting. An array of MOS sensors are adopted for their low cost, orthogonal sensitivity, reliability and long-term stability. Correlation coefficient and principal component analysis are used to select sensors. Comparing with other reports, the system in this work has several merits. Most existing electronic noses require a long stabilization phase for the gas sensors prior to detection. To speed up the detection cycle and reduce the power consumption of the MOS sensor array, our electronic nose is based on dynamic measurement and transient feature extraction, to realize near-real-time detection with a turnaround time within one minute. Further, in contrast to most gas measurement setups that require the reaction chamber to be airtight and reach equilibrium after the introduction of a sample gas, our tests are performed with a simulated indoor ventilation system to better simulate a real-life gas monitoring scenario, in which the amount of target gas that reaches the sensor surface in the experiments cannot be precisely controlled. Backpropagation neural network (BPNN) algorithm is applied to achieve quantitative identification of VOC gas samples. Five features extracted from the response signal in time–space and phase space are used in the BPNN-based classification and regression model, which leads to high resolution power in this system. As a result, our electronic nose is capable of differentiating ethanol from IPA and can quantify component gases in a mixture. The performances of the classification and regression are presented and discussed. Differentiating ethanol and IPA demonstrates the detection power of this electronic nose system. The concept used in this work can be readily translated for other challenging tasks of detecting closely related chemicals.
2. Materials and Methods
2.1. Laboratory Setup
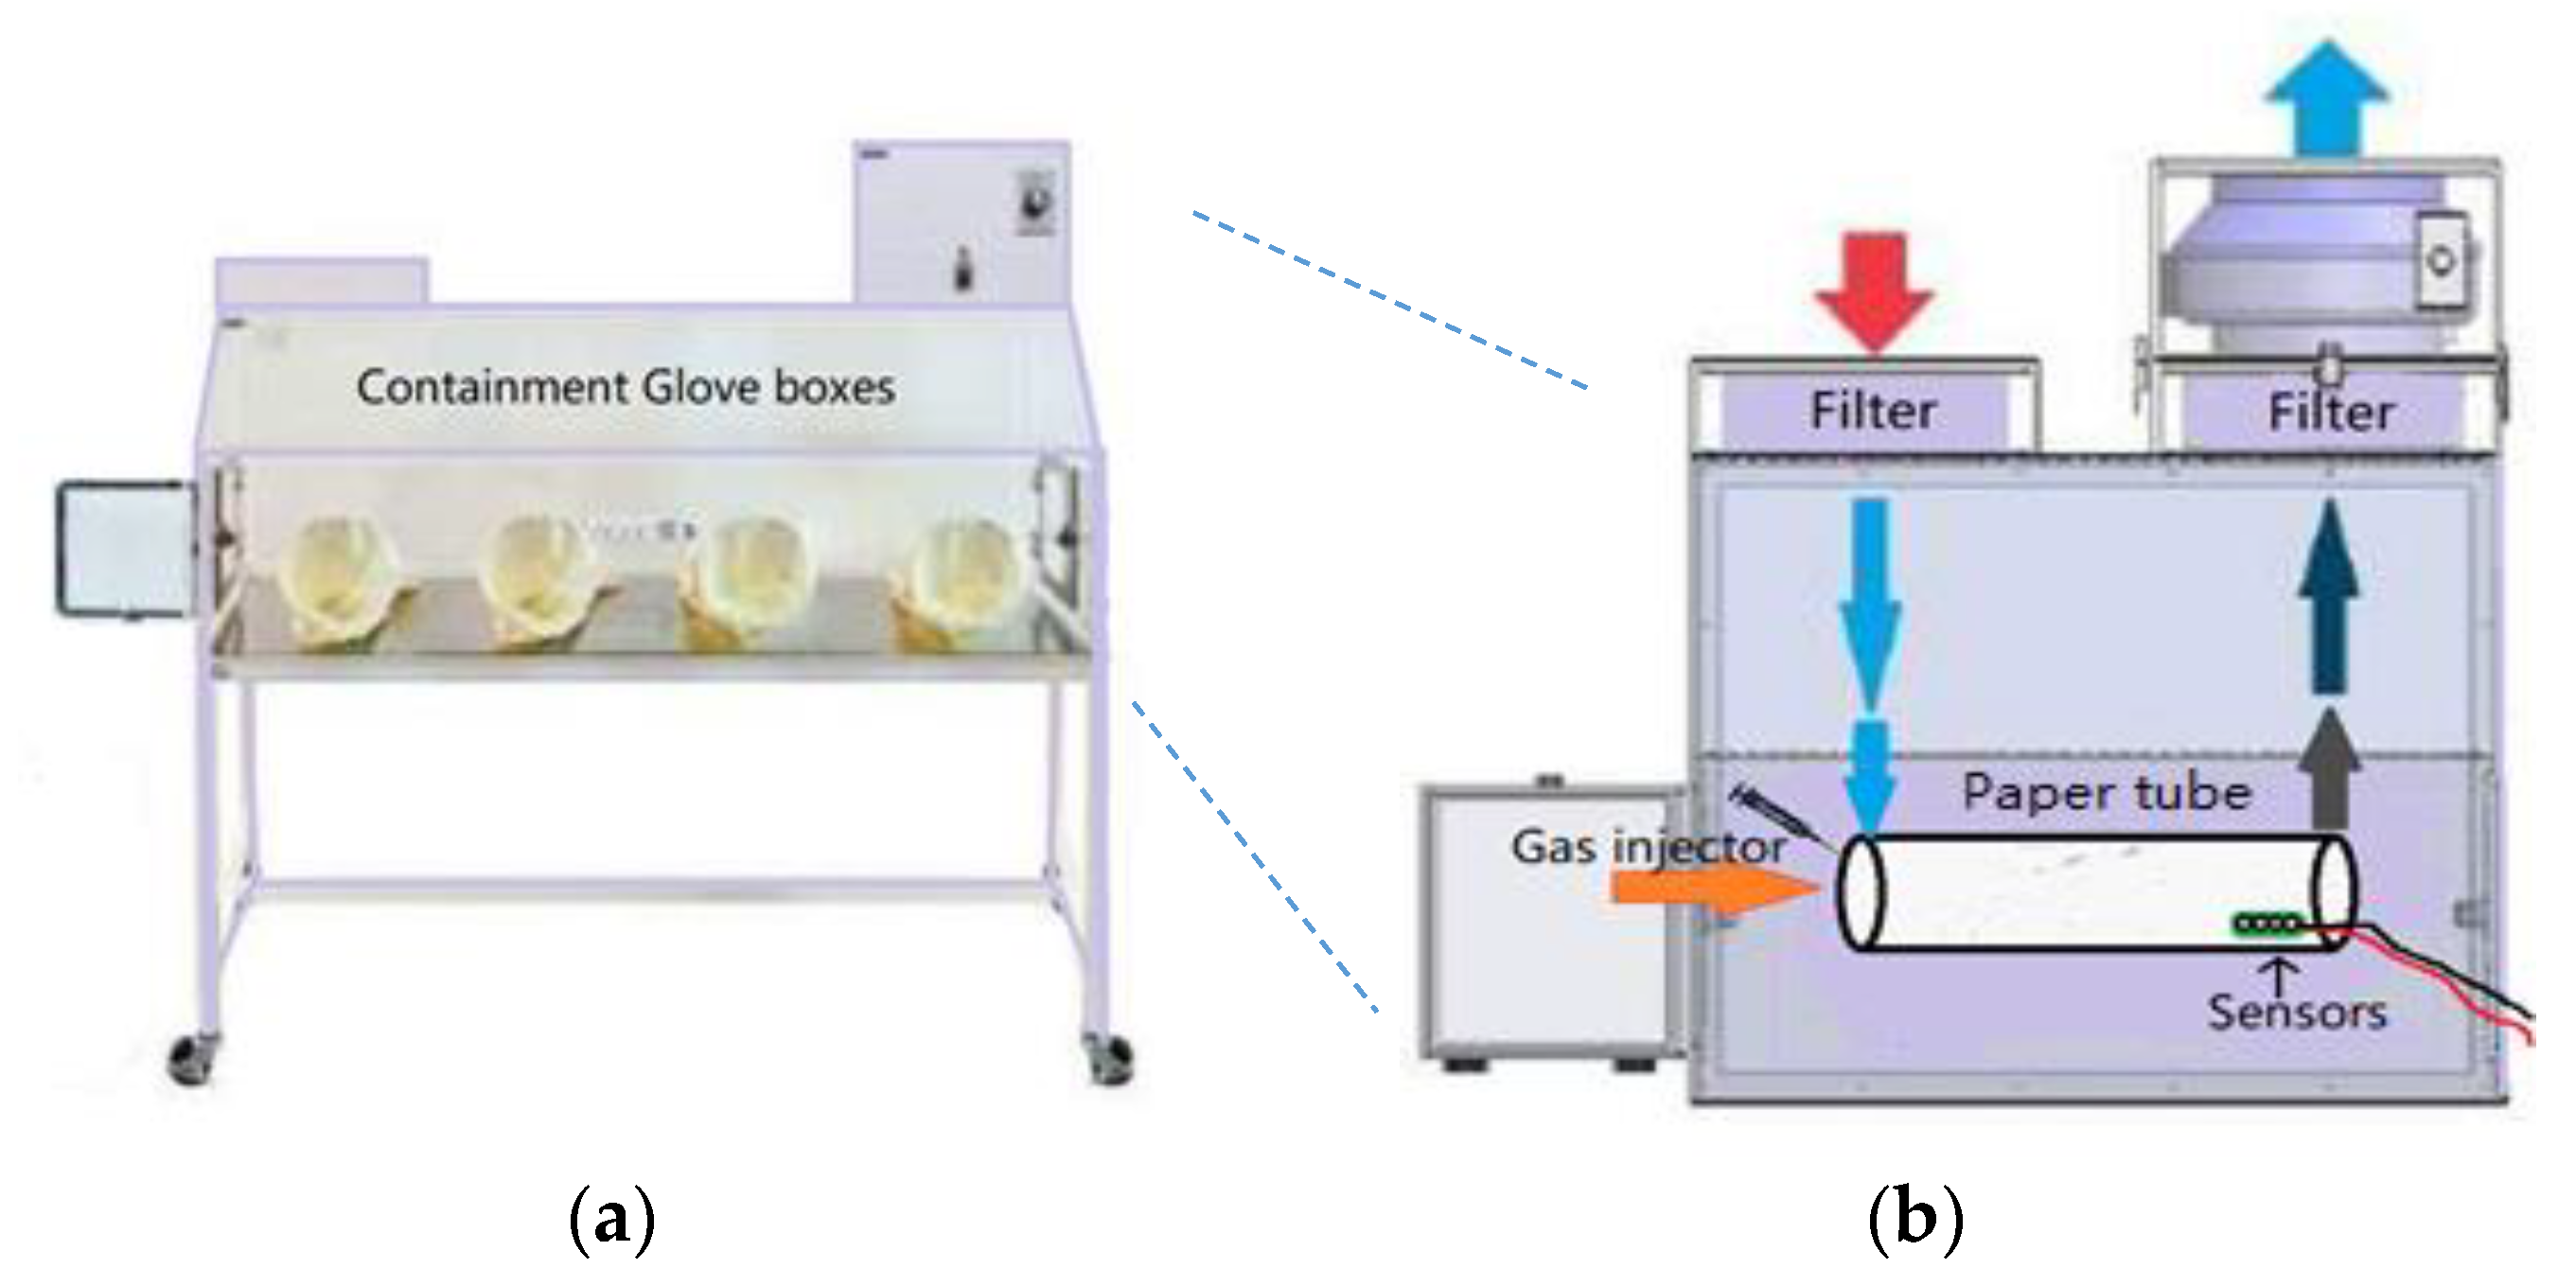
A gas-detection experimental system based on the MOS sensor array was designed. To simulate the air flow environment in an indoor ventilation system, a laboratory glove box was used. Figure 1a shows the CLEATECH® 2300 series containment glove box used in this work. The glove box included an intake & exhaust filter and an adjustable speed 480 cubic feet per minute (CFM) impeller blower unit, which allowed the simulation of different air flow velocity. A paper-made tube (diameter: 12 cm, length: 90 cm) was used to guide the air flow. The sensors were arranged in a line. As shown in Figure 1b, the sensor array was located at the right end of the paper tube in the glove box, and the test gas was added at the left end by a syringe. The right access door of the glove box stayed closed at all times, whereas the left door remained open during the test to simulate a real-life continuous-monitoring situation and to ensure the same air pressure inside and outside the box.
2.2. Selection of Gas Sensors
Several factors were considered when choosing sensors for the array, high sensitivity; fast response; high stability and reusability; low power consumption; low cost; minimum number of sensors. Table 1 shows the operating conditions and electrical characteristics of the HANWEI® MQ series and Figaro® TGS series gas sensors used in this work. These are the widely used low-cost MOS sensors (less than $20) from the two major manufacturers of gas sensors. Figaro® TGS series MOS gas sensors are well known for their long-term stability. Their sensors are reported to have the lowest conductivity fluctuations over long time [24], whereas MQ sensors perform slightly worse than TGS sensors [25]. The specific TGS sensors we chose—the TGS 2600, 2602, 2610 and 2611—have yielded good results in the analysis of relevant VOCs in air [23], in pressed oil [2] and in roasted coffee beans [3]. These sensors had partially overlapping responses with different target preferences and sensitivities, as listed in Table 1, which increases the chance of finding fingerprint features for intended applications.
The packaged sensors operated under room temperature. However, a 5-V DC heater voltage was needed for the inside sensing element to maintain a working temperature at 400 °C. Specific gases reacting with the sensing elements could have led to a change in the sensor resistance; and voltage signals related to these MOS gas sensors were used to indicate the presence of target gases.
Voltage signals of the gas sensors were measured with the ARM® Cortex M0 microcontroller. The sampling rate was set to 100 Hz (i.e., 100 sample points per second). Instead of directly measuring the sensor resistances themselves, the data acquisition board measured the voltage across a load resistor connected in series with the sensor. An increase in the measured voltage was observed when the sensor resistance decreased during the gas reaction. The dynamic range and sensitivity of a MOS sensor readout could be adjusted by changing the series resistance to the sensor. Acetone, ethanol and IPA were used as the model gases here to demonstrate the accuracy and resolution of VOC detection by this system. The sensors were calibrated in a sealed chamber using known VOC gas concentrations, and the dynamic ranges were set from 30 ppm to 3000 pm for the target VOC gases here. The calibration procedure and the measured data (Figure S1) can be found in the Supplementary Material.
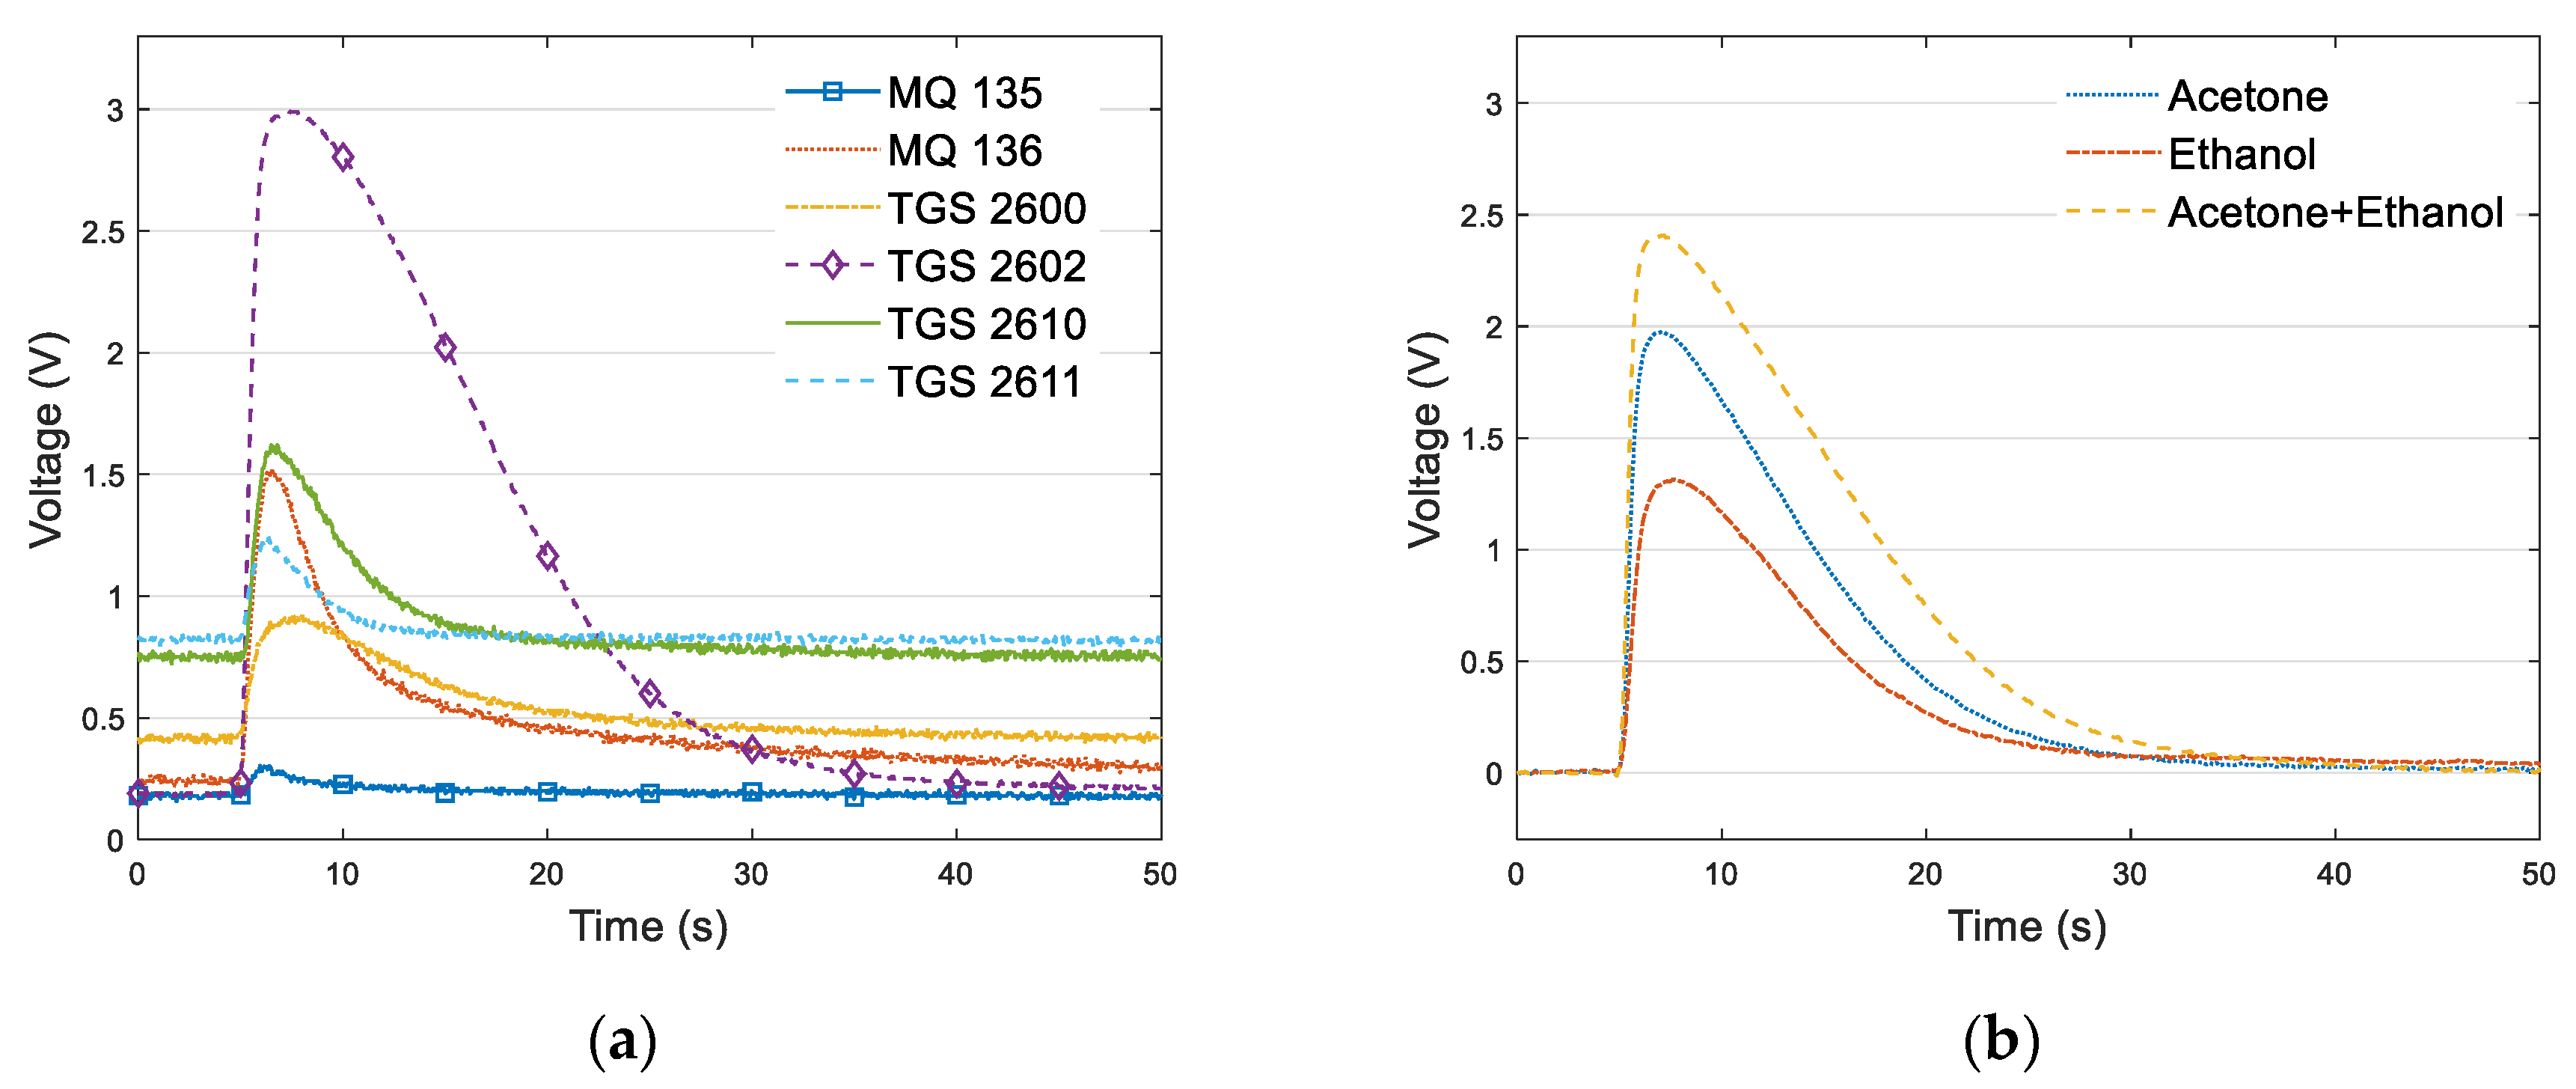
Figure 2a shows voltage signals of the 6 different sensors when 4 mL 8.3% acetone in air was added to the left inlet of the tube shown in Figure 1. Random noise present in the original signal was removed by wavelet denoising. As previously mentioned, MOS gas sensor had a cross-sensitivity characteristic, leading to rather non-ideal selectivity. As reported in ref. [26], when a sensor was exposed to a VOC mixture, the gas with higher reactivity will dominate the reaction with the adsorbed oxygen at the surface of the metal oxide. Taking the response of Figaro® TGS 2602 sensor as an example. As shown in Figure 2b, when testing single gas of acetone (2 mL, 8.3%) or ethanol (10 mL, 1.74%), the peak voltages for the two single gas tests were around 1.2 V and 1.9 V. When the same amounts of the two gases were mixed and tested, the peak value of the mixed gas response was not equal to the sum of the two single gas test outputs. The peak voltage of the VOC mixture was less than 2.5 V, much lower than the combined single gas results. The baselines of the three signals in Figure 2b were removed to highlight the differences in peak values. This indicates that using a single MOS gas sensor or a simple calculation could not recognize VOC mixtures in air; thus, an array of different sensors with pattern recognition algorithm was needed.
Considering the total power consumption of the sensor array, the number of sensors should be minimized. Therefore, correlation coefficients and principal component analysis (PCA) were used next to identify and exclude the sensors with duplicate responses.
2.2.1. Correlation Analysis
Table 2 shows the correlation coefficients between each pair of sensors. The signals used here and in the following PCA section are the same as shown in Figure 2a. The largest correlation coefficient was 0.9855, which happens between MQ 136 and TGS 2610 sensor, followed by the correlation coefficient between TGS 2600 and TGS 2602. The larger a correlation coefficient was, the more similar were the signals of the sensor pair. A close to 1 correlation coefficient means that one of the involved sensors was redundant.
2.2.2. Principal Component Analysis
PCA is a mathematical procedure that transforms a number of correlated variables into a number of principal components (PC) that are uncorrelated or orthogonal to each other. The PC loadings are the correlation coefficients between the variables (signals of the different gas sensors) and factors (principal components) [27].
The first 6 rows of Table 3 are the principal component loadings and the last row is the percentage of the total variance explained by each principal component. It can be seen from the last row that the first principle component (PC1) explained about 96% of the whole information and the second principal component (PC2) explained about 3.8%. The rest four principle components contained less than 0.2% of the information. Thus, we should select sensors based on the first two PCs.
To select a subset of variables (sensors), we should find out which original variables (sensor signals) have the highest correlations with the first two principal components. The maximum three loadings for PC1 and PC2 fall on TGS 2602 (PC1-0.9332), MQ 136 (PC1-0.2510, PC2-0.7081), TGS 2610 (PC1-0.1997, PC2-0.5234) and TGS 2611 (PC2-0.3113). This implies MQ 135 and TGS 2600 were less important for PC1 and PC2 and could possibly be removed without loss of information.
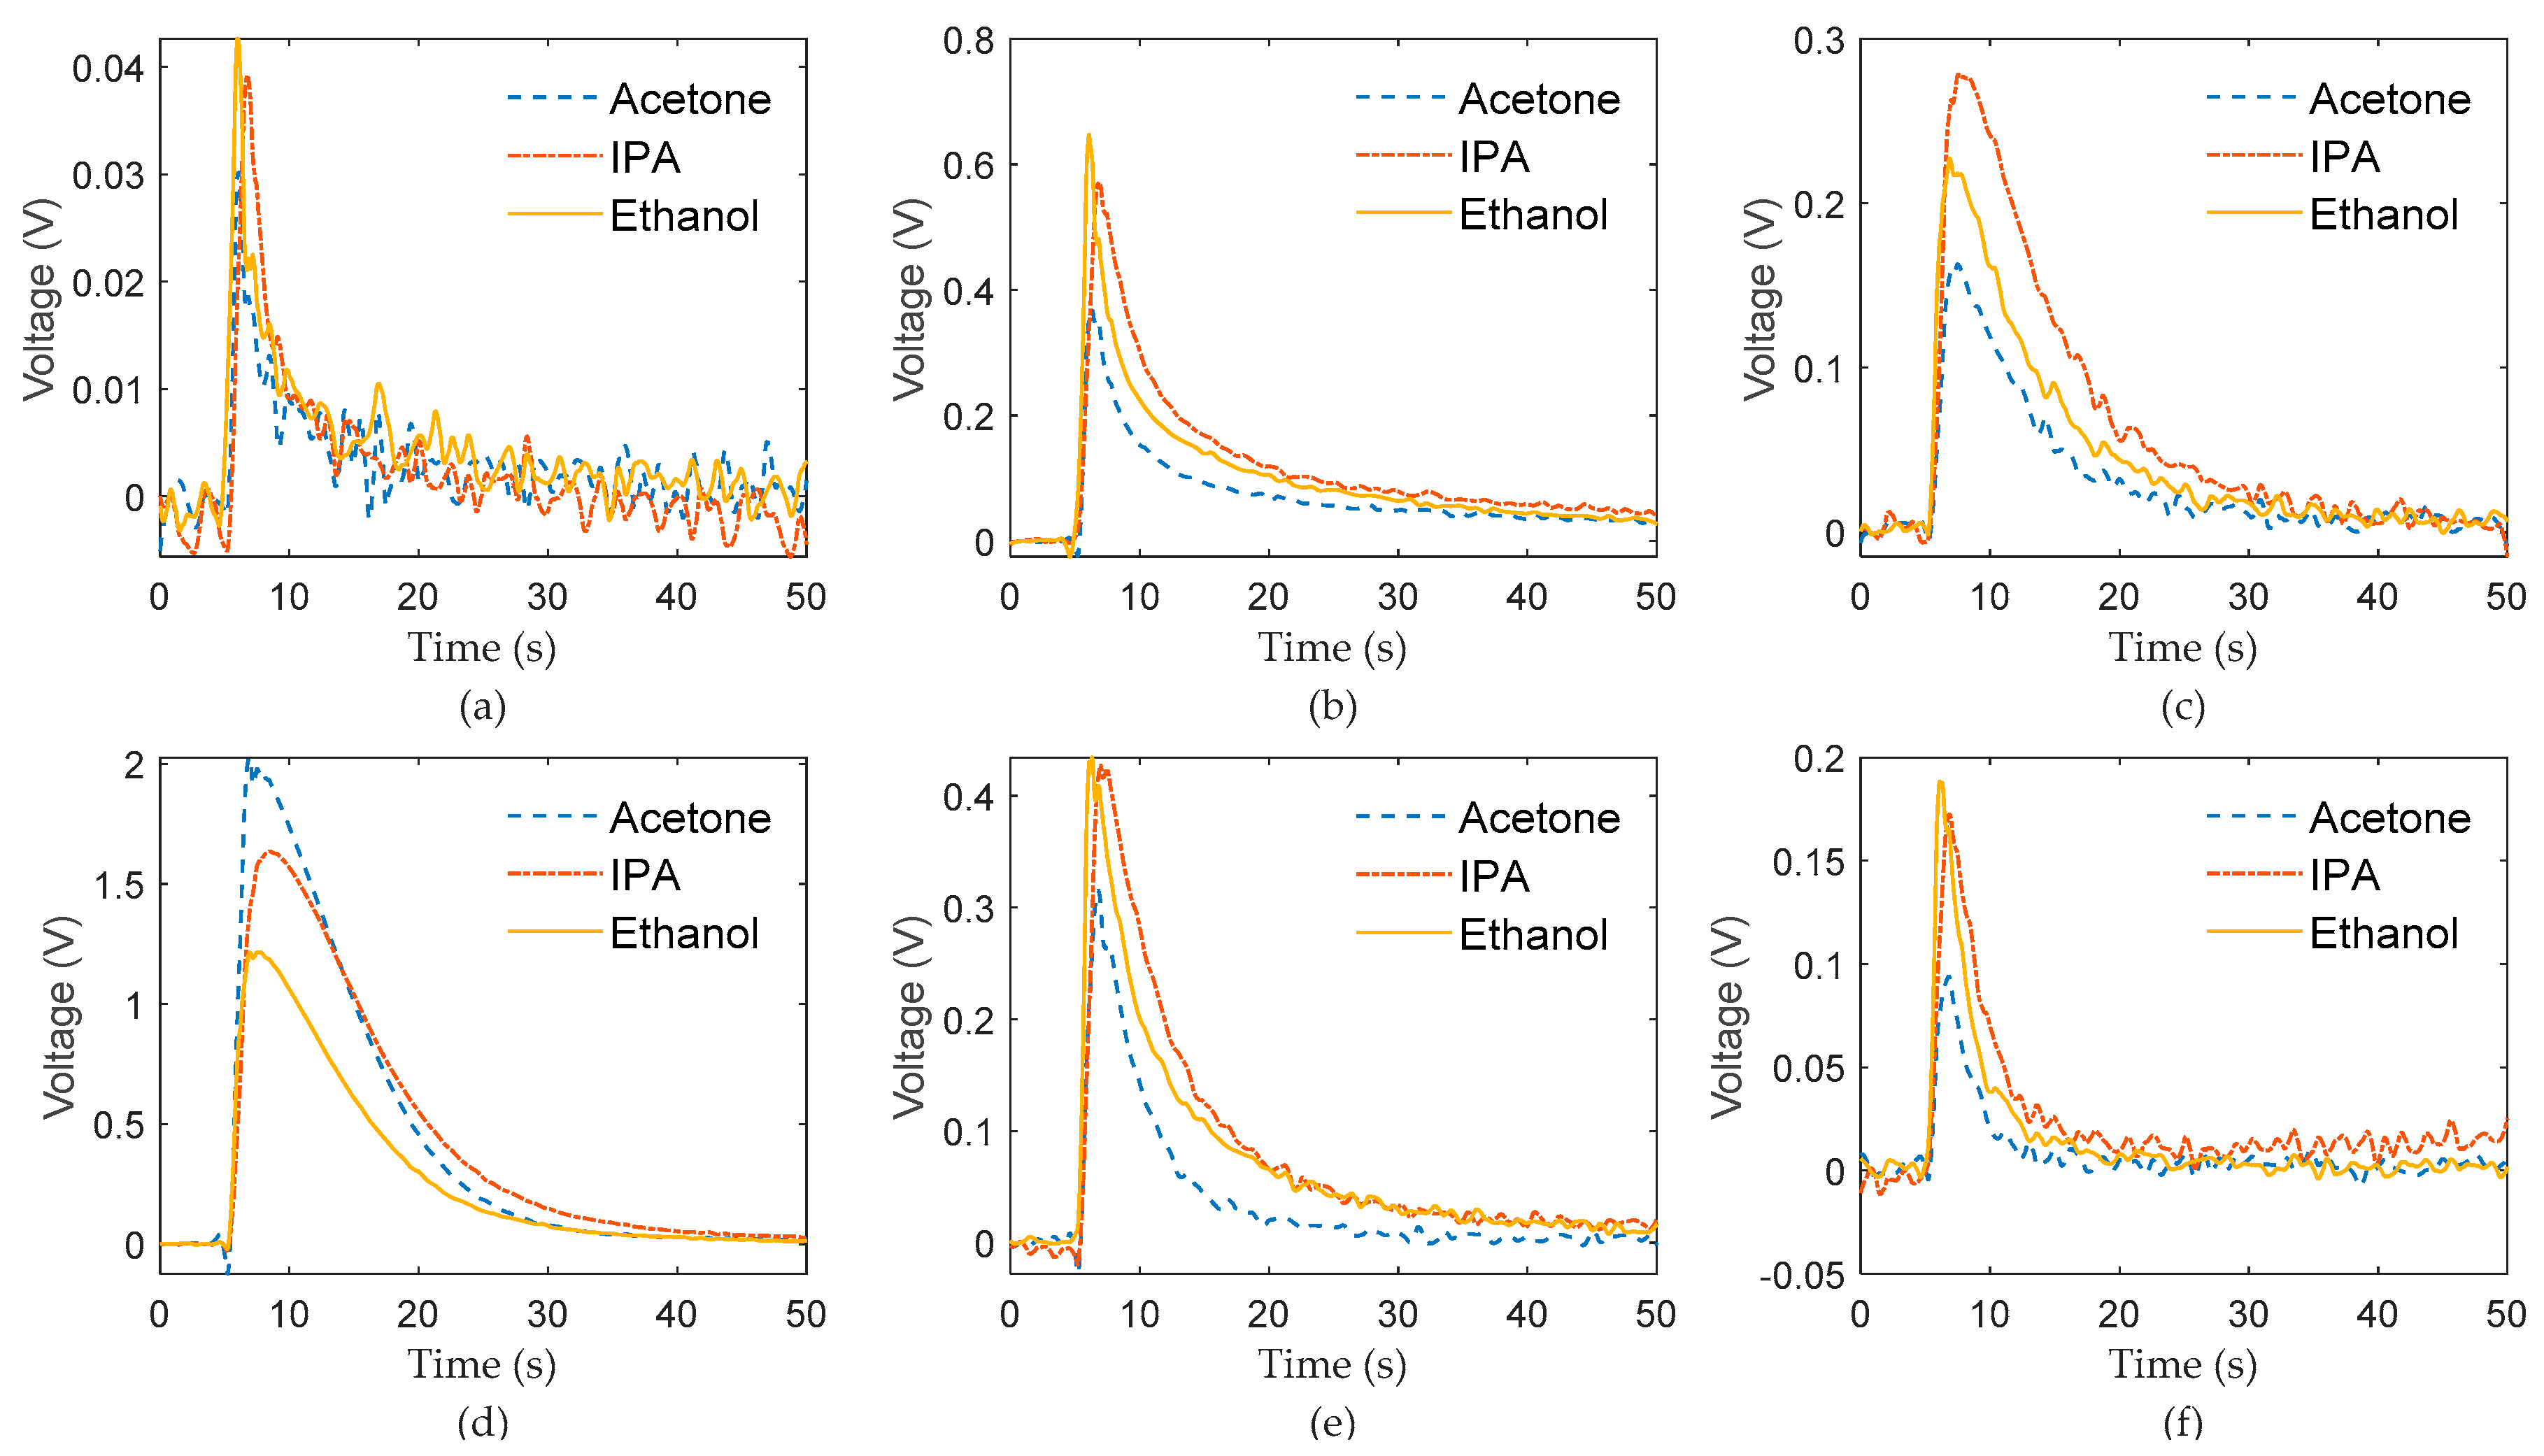
Figure 3 shows the sensor responses to the same amount of acetone, ethanol and IPA. Unlike the other 5 sensors whose responses to ethanol and IPA were larger than its response to acetone, TGS 2602 had a larger response to acetone when the same amount of gas was tested. This means that TGS 2602 was the key sensor to distinguish acetone from ethanol or IPA when used with any other sensors in this array. In contrast, the responses of MQ 135 to all the three gases were very small, while the noise was much larger than other sensors. Combining the above information, MQ 135 and TGS 2600 were removed from the array.
It is well known that the response of a gas sensor fluctuates quite noticeably with environmental parameters and other interferences, which contributes to less than ideal stability of gas sensors, even in a closed sampling system. Therefore, a set of experiments was conducted first, to gauge the day-to-day output variations using the above four sensors chosen for this work. They were tested with 10 mL ethanol in a closed box once per day for 7 days, and the outputs are shown in Figure S2 in the Supplementary Material. With respect to a main signal feature, the signal maximum, the relative standard deviation (RSD) of the four MOS sensors over 7 days were 15.56% (MQ 136), 8.17% (TGS 2602), 28.45% (TGS 2610), and 26.87% (TGS 2611), respectively. This could seriously compromise the repeatability of an MOS-based electronic nose. As such, the adoption of an appropriate pattern recognition algorithm is critical to achieving an acceptable detection repeatability.
2.3. Experimental Sample Acquisition
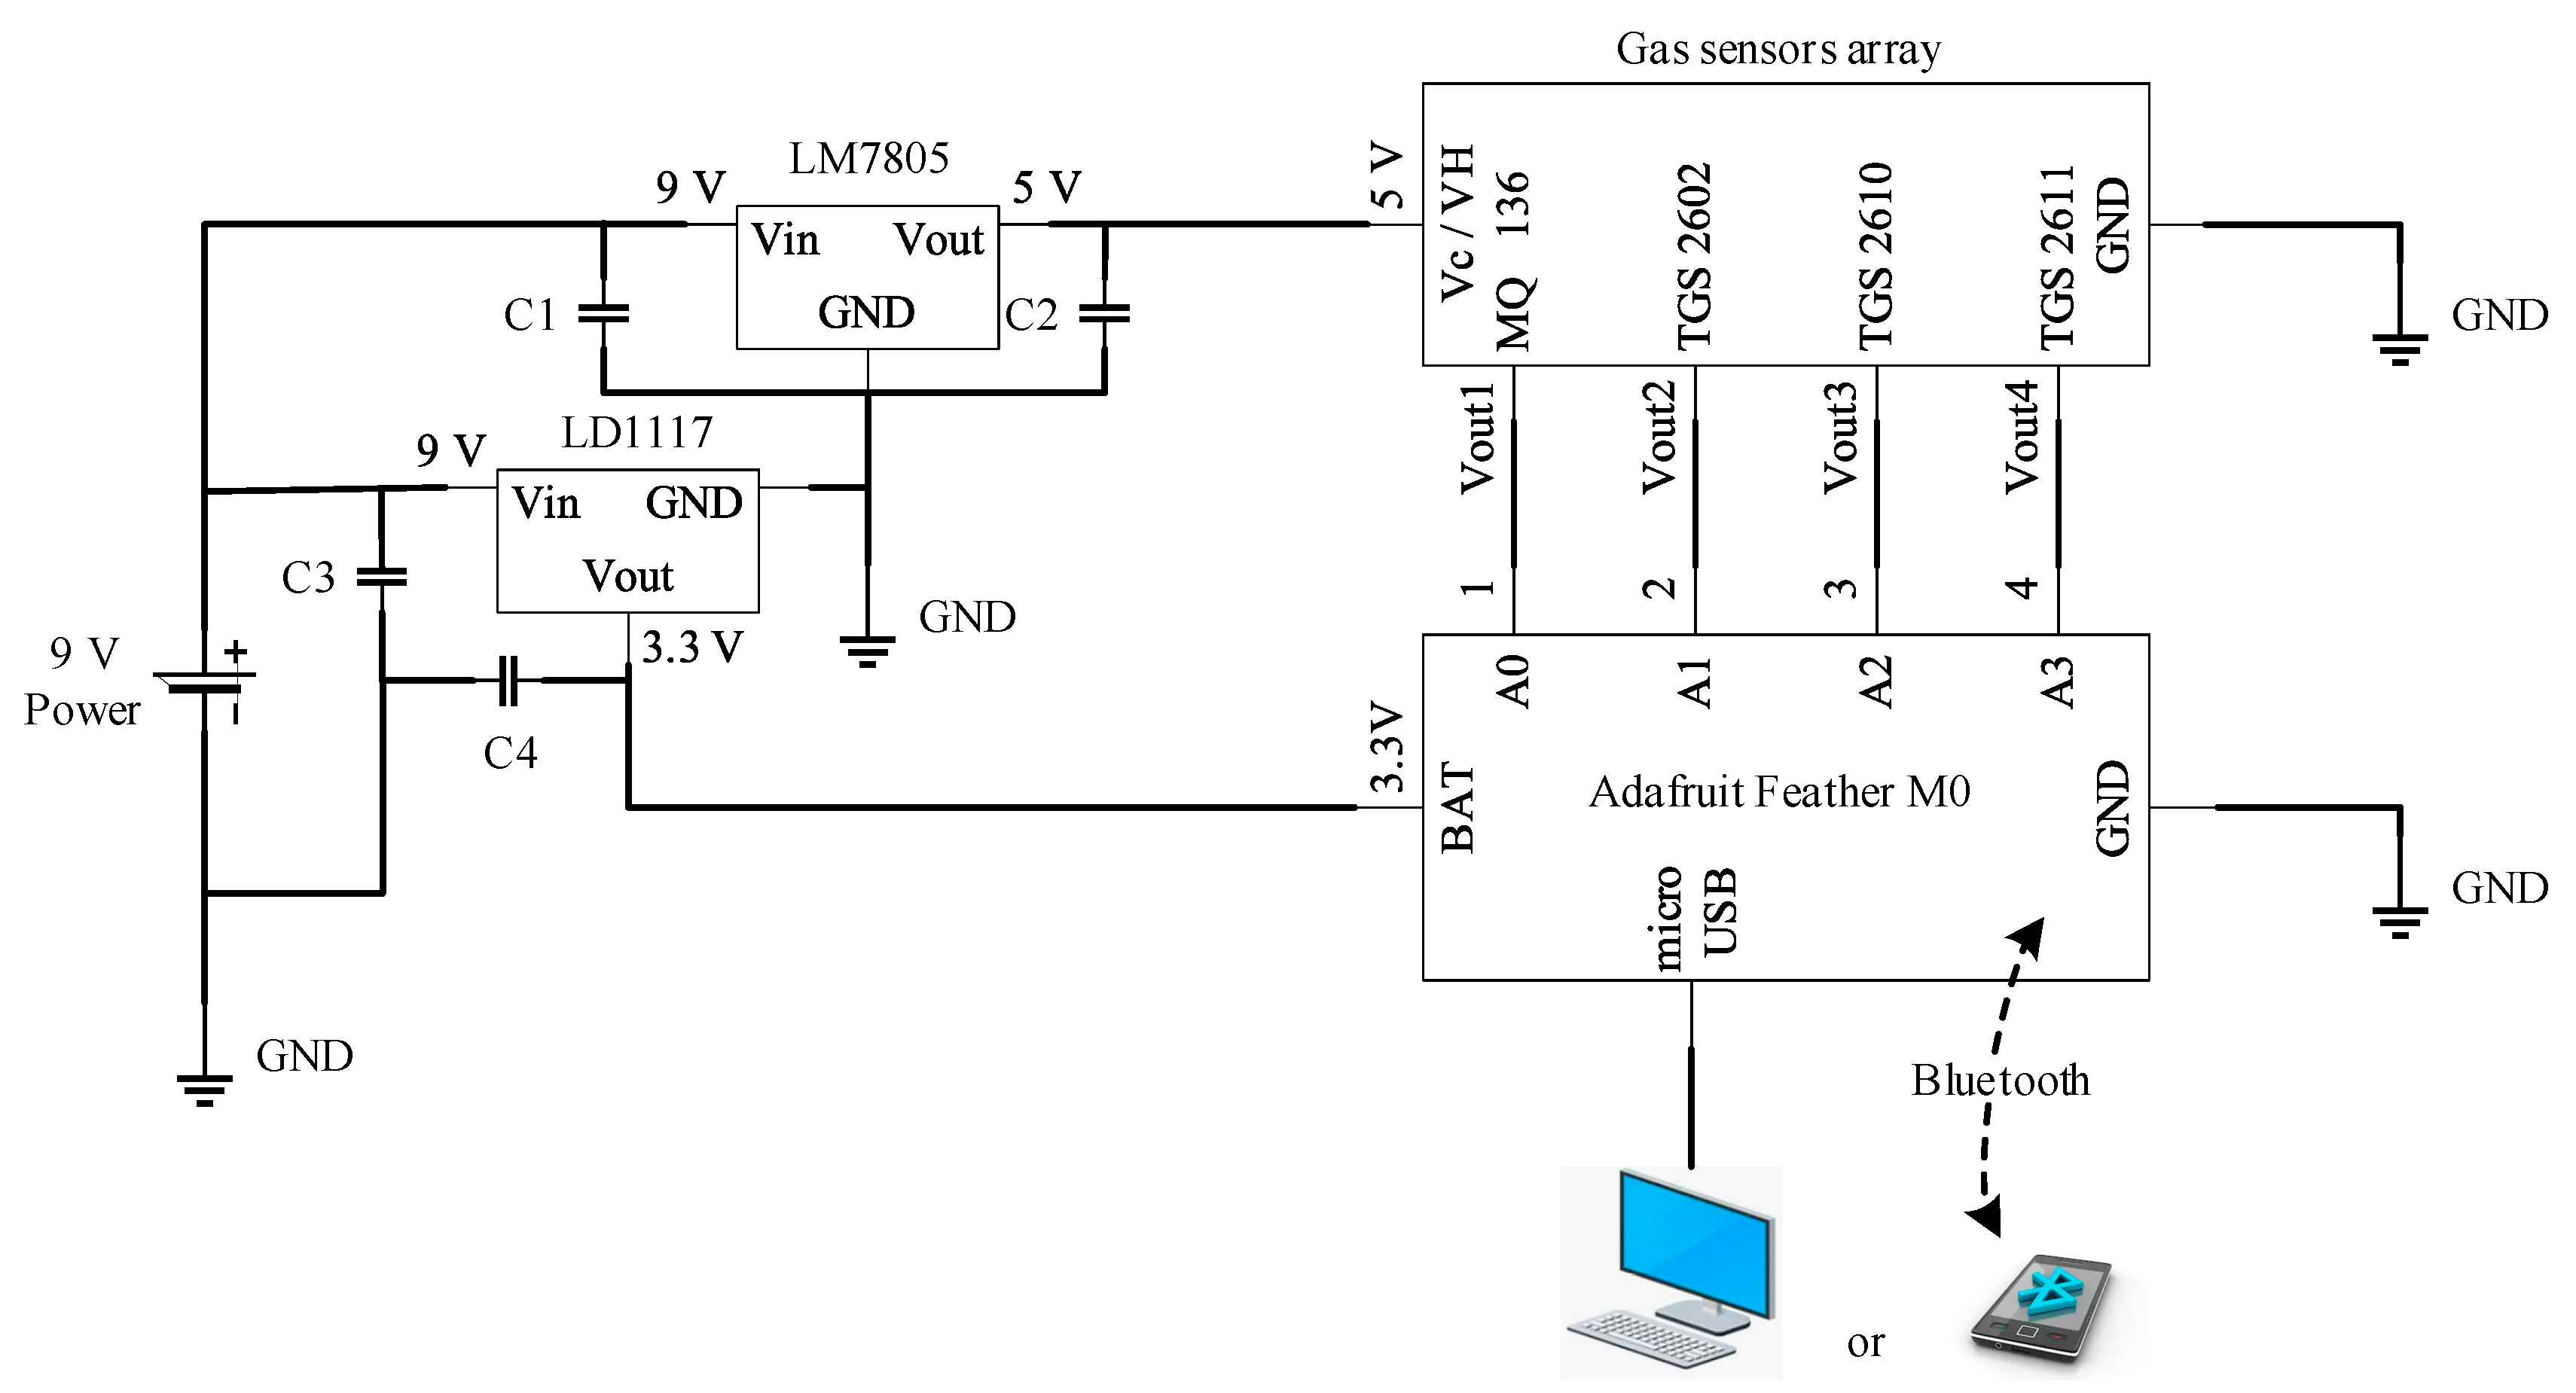
After the above sensor selection process, the MOS gas sensor array contained four different sensors. They were MQ 136, TGS 2602, TGS 2610 and TGS 2611. A low-cost portable signal acquisition system for the sensor array was built based on commercial microcontroller and integrated circuit (IC) chips. Figure 4 is a schematic of the signal acquisition system. The data acquisition process was controlled by an Arduino® Feather M0 Bluefruit microcontroller ($19.95). The whole system was powered by 9 V DC voltage, easily becoming battery powered when necessary. The 9 V voltage was then shifted to 5 V and 3.3 V through a voltage regulator to power the sensor array and the microcontroller. While a commercial electronic nose could cost hundreds of dollars [28], the total price of this system was within one hundred dollars.
Liquid acetone (CH3)2CO, isopropyl alcohol CH3CHOHCH3 (IPA) and ethanol CH3CH2OH used in this work were certified ACS grade purchased from Fisher Scientific (USA). The temperature of the laboratory was kept at 23 ± 1 °C during experiments. The humidity of the environment was kept at 50 ± 5 RH% during the experiments. The original concentrations of acetone, IPA and ethanol gases in a 1-L gas chamber under experimental conditions were 8.3%, 1.71%, 1.74% in air, respectively. Gas samples for tests were extracted from the headspace of the respective liquid solvent container using a syringe operated by hand. When more than one VOC was used, the syringe was shaken for 10 s to get a gas mixture. The air flow in the glovebox remained unchanged during the test by keeping the settings of both the indoor ventilation system and the fan speed of the glovebox the same all the time. As shown in Figure 2a and Figure 3, the response and recovery time of the MOS gas sensors we chose for our test were within 1 min. This enabled a relatively high measurement frequency when continuous monitoring was required.
3. Results
3.1. VOC Mixtures Identification
In a steady-state measurement, signals were obtained after the stimulus was introduced and allowed to reach equilibrium and after all sensors of the electronic nose had reached steady state response. On the other hand, when the stimulus was present only for a short duration, which was usually 20–30 s, the signals obtained were transient signals, and such events could only be captured by transient measurement [29]. Therefore, in this research, transient measurement was chosen to realize near real-time monitoring of VOCs in air.
3.1.1. Feature Extraction
Signals of a gas sensor array depend on the gas chemical information as well as the geometries of the measurement system. Both the design of the measurement system, such as the geometries of the measurement chamber and the arrangement of the sensors in the chamber, and the chemical makeup of the gas flow, would affect the signals obtained. It is clear that not all the information obtained are useful for gas identification. Instead, only a portion of the signal carries relevant chemical information [30]. The main idea of feature extraction is to extract relevant information from the response curve with less redundancy.
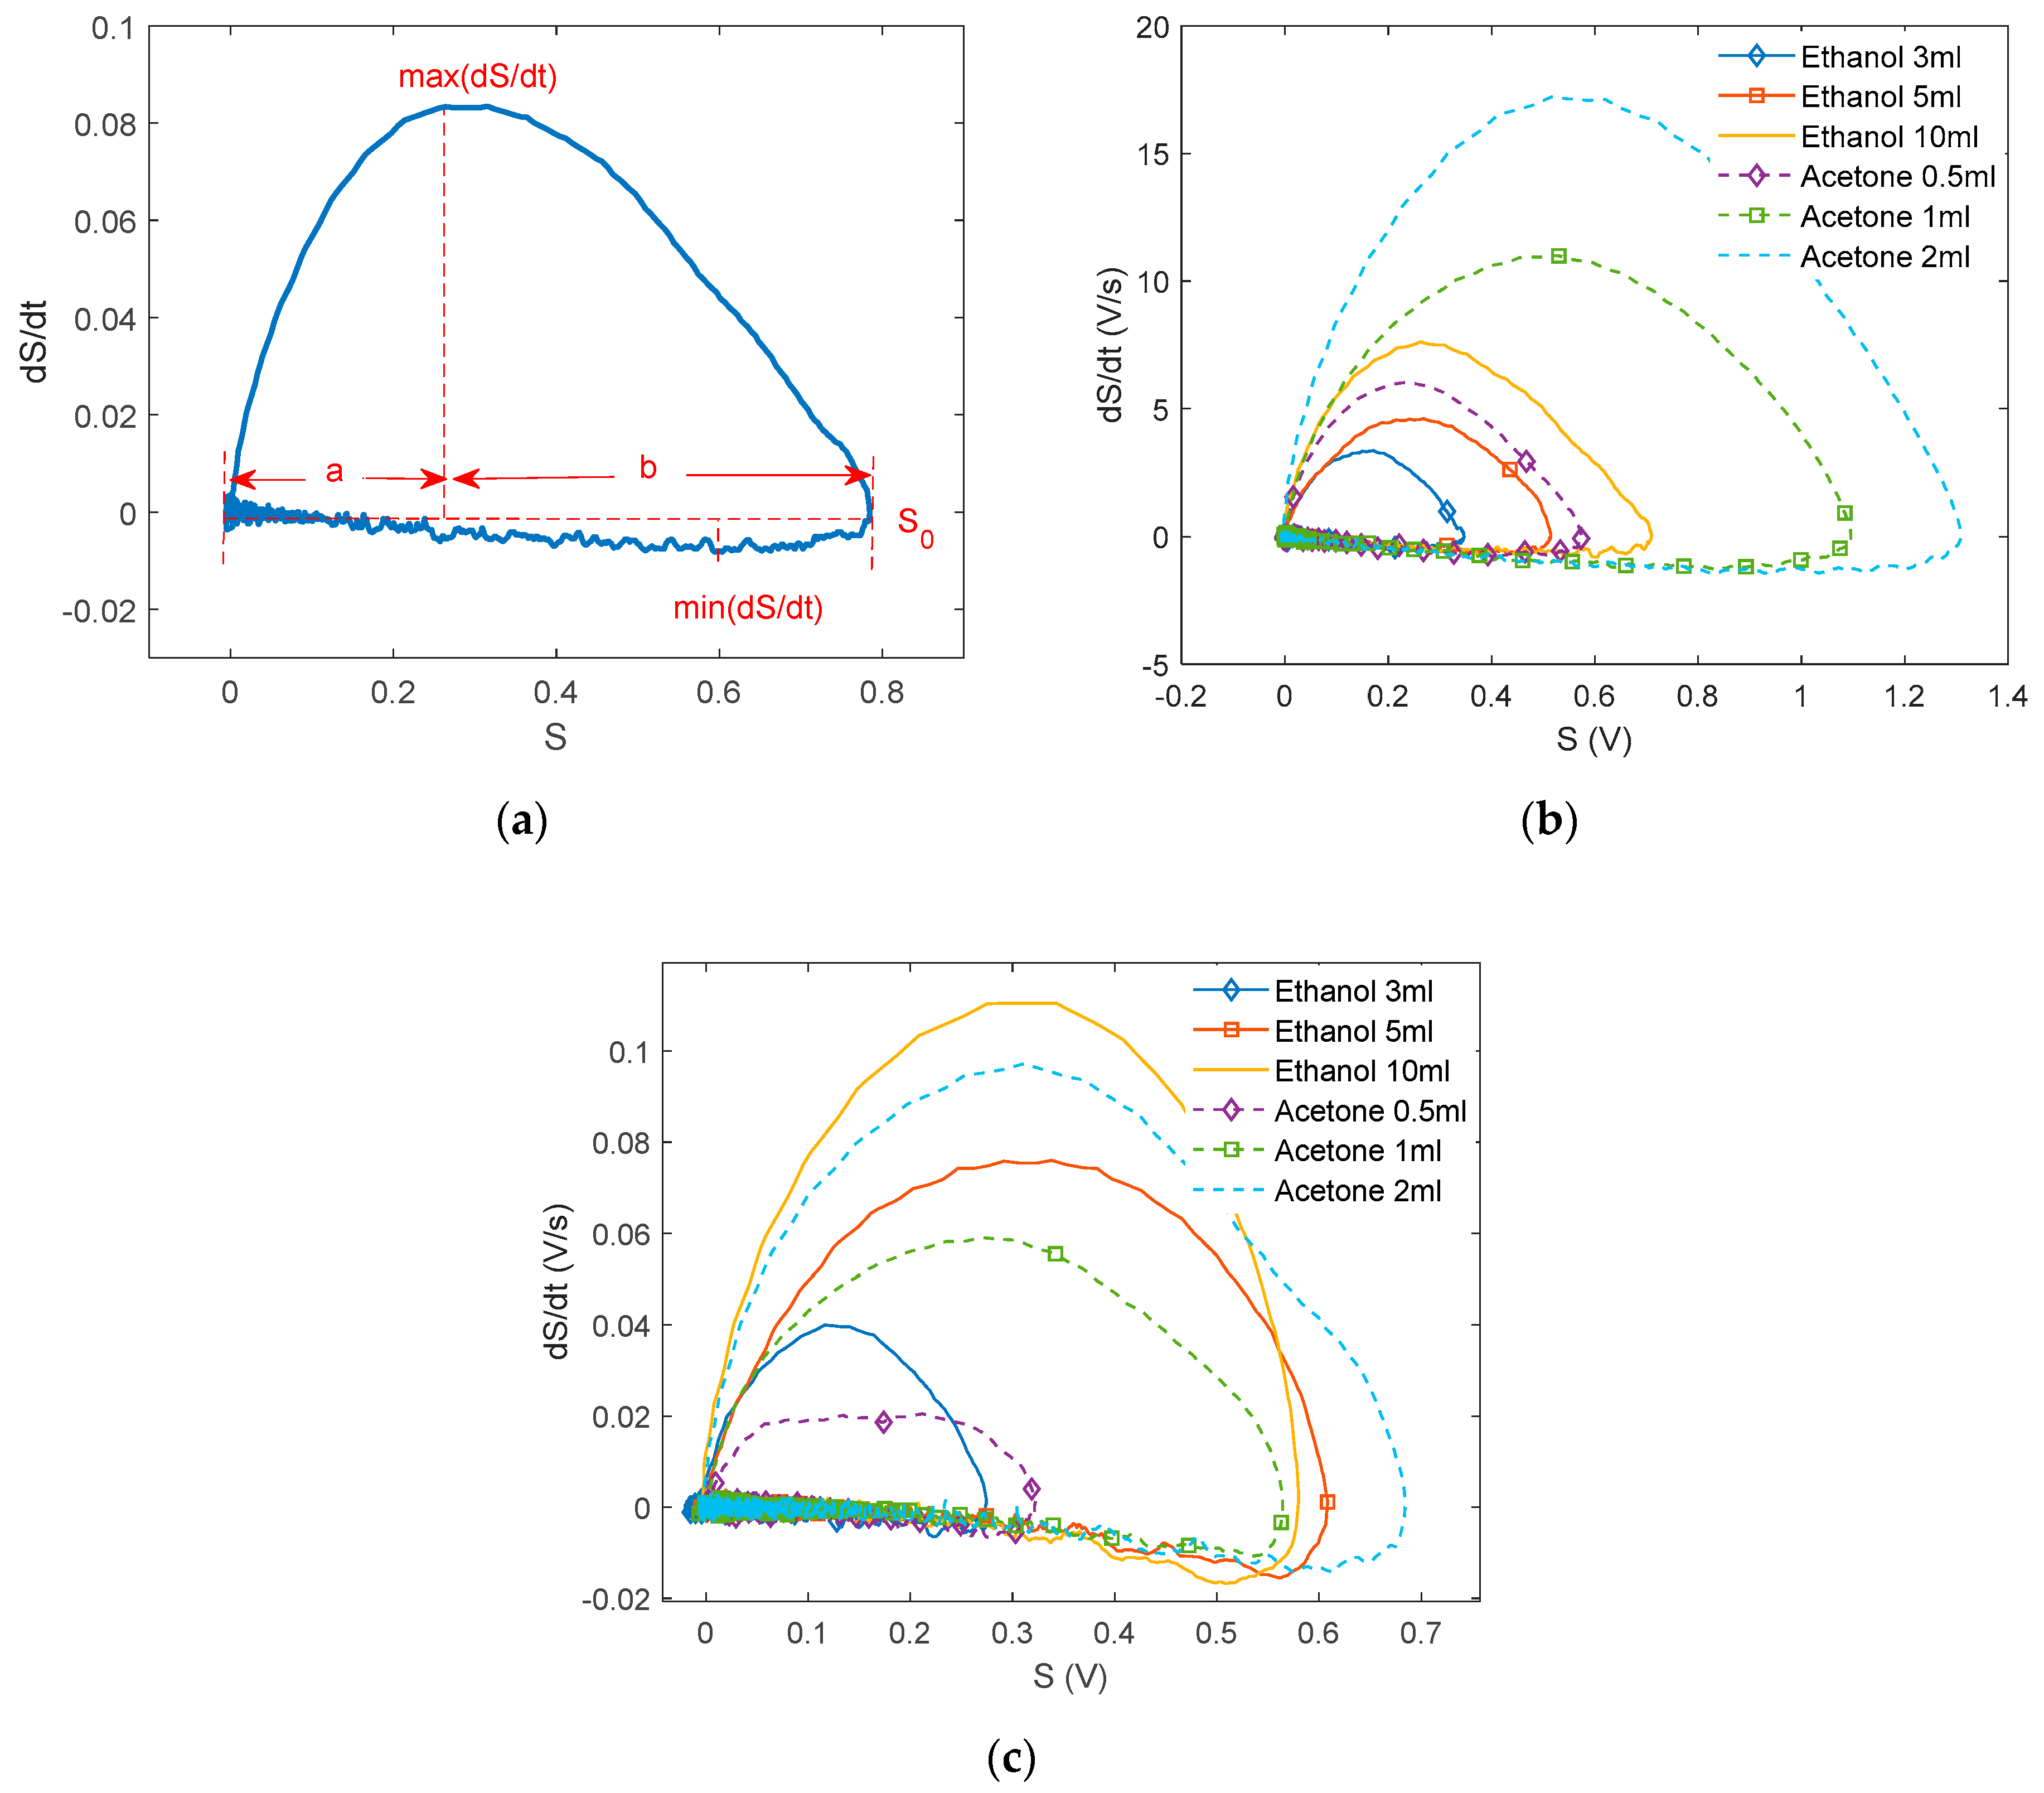
A typical transient response of a gas sensor, a response curve of the TGS 2602 sensor in phase space, is shown in Figure 5a. The obtained transient sensor response is labeled as “S”. The most popular feature obtained from this kind of signal is the signal maximum S0, which is the magnitude difference between its peak and baseline. Besides the signal maximum, the time from the beginning of the signal to its peak TP is also widely used [29]. While the features in time domain is simple and fast to compute, more information can be potentially extracted from the signals using more sophisticated features. The first derivative of the sensor response has been used in literature [31]. As the sensor response S may reflect the concentration level of the adsorbed oxygen, the first derivate signal of S may reflect the concentration change rate of the adsorbed oxygen [31]. Sensor signal behavior in phase space could be represented by an orthonormal basis formed by S and dS/dt signals [30].
Figure 5b,c show the transient signals of the MOS sensors to the three VOC gases. The three parameters extracted are: max (dS/dt), the maximum of the derivative signal; min (dS/dt), the minimum of the derivative signal; a/b, the location of max (dS/dt). The values of the above parameters are determined by the amount of VOC that reached the sensor surface, as shown in Figure 5b, a larger amount of gas will result in a higher max (dS/dt) value. While the shapes of the response curve between ethanol and acetone are similar on TGS 2602, we can notice the difference in shape on MQ 136. In Figure 5c, MQ 136 sensor has flatter response curves to different amounts of acetone gas when compared with its responses to ethanol gas.
3.1.2. Qualitative Identification
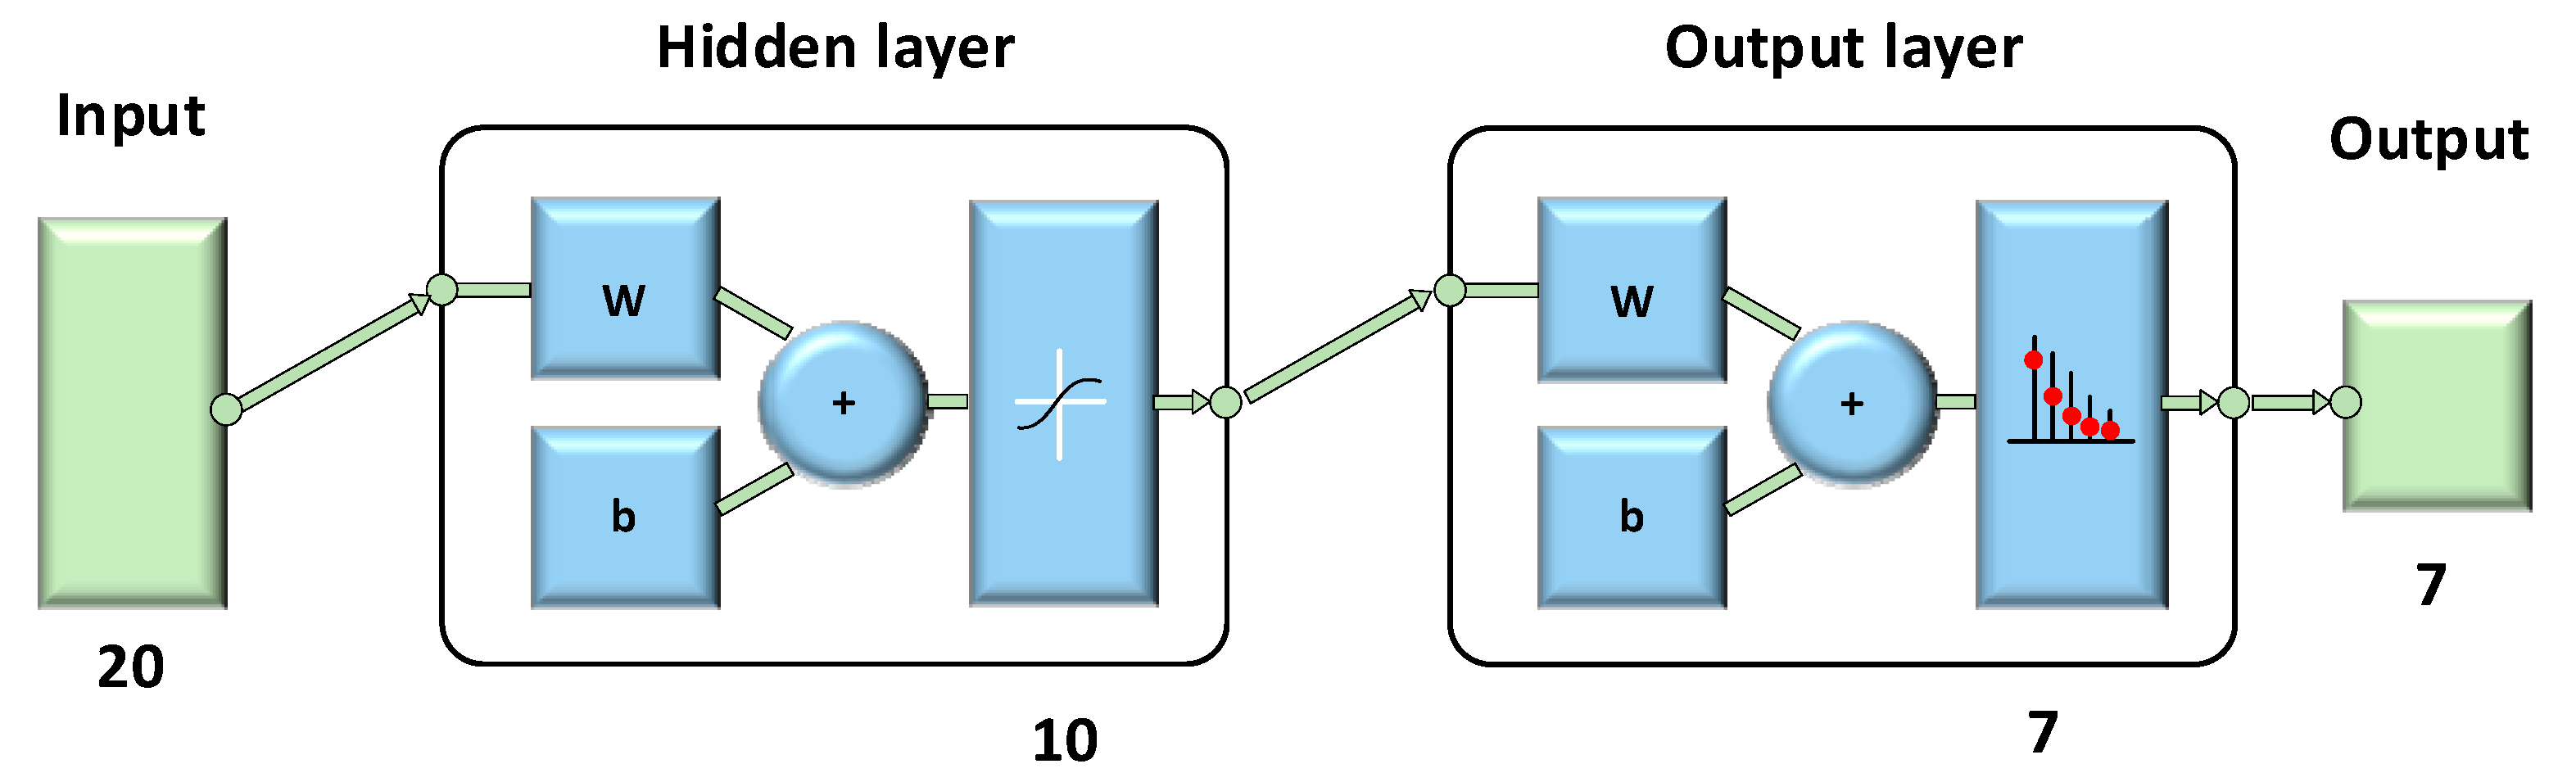
Both ethyl alcohol and isopropyl alcohol are alcoholic compounds with similar physical and chemical properties. Ethyl alcohol is a primary alcohol with -OH attached to the first carbon. Isopropyl alcohol is a secondary alcohol with -OH attached to the second carbon. Ethanol is found in alcoholic drinks while isopropyl is toxic when ingested. Although it is easy to distinguish acetone from the two alcoholic compounds directly by the features we have extracted, the differences between ethanol, IPA, and its mixtures are hard to notice. A backpropagation neural network with one hidden layer and one output layer is used to classify the VOC samples. The use of a single hidden layer guarantees a short training time. The input data of the network has 20 dimensions, which is composed of 5 features for each of the 4 sensors in the array. Figure 6 shows the topological structure of the neural network. The 20 inputs represent the 20-dimensional feature. W and b in the hidden layer and the output layer represent the weights and thresholds of the 10 sigmoid hidden neurons and the 7 softmax output neurons. The seven true or false outputs (with only one to be true at once) give the predicted class of the VOC gas.
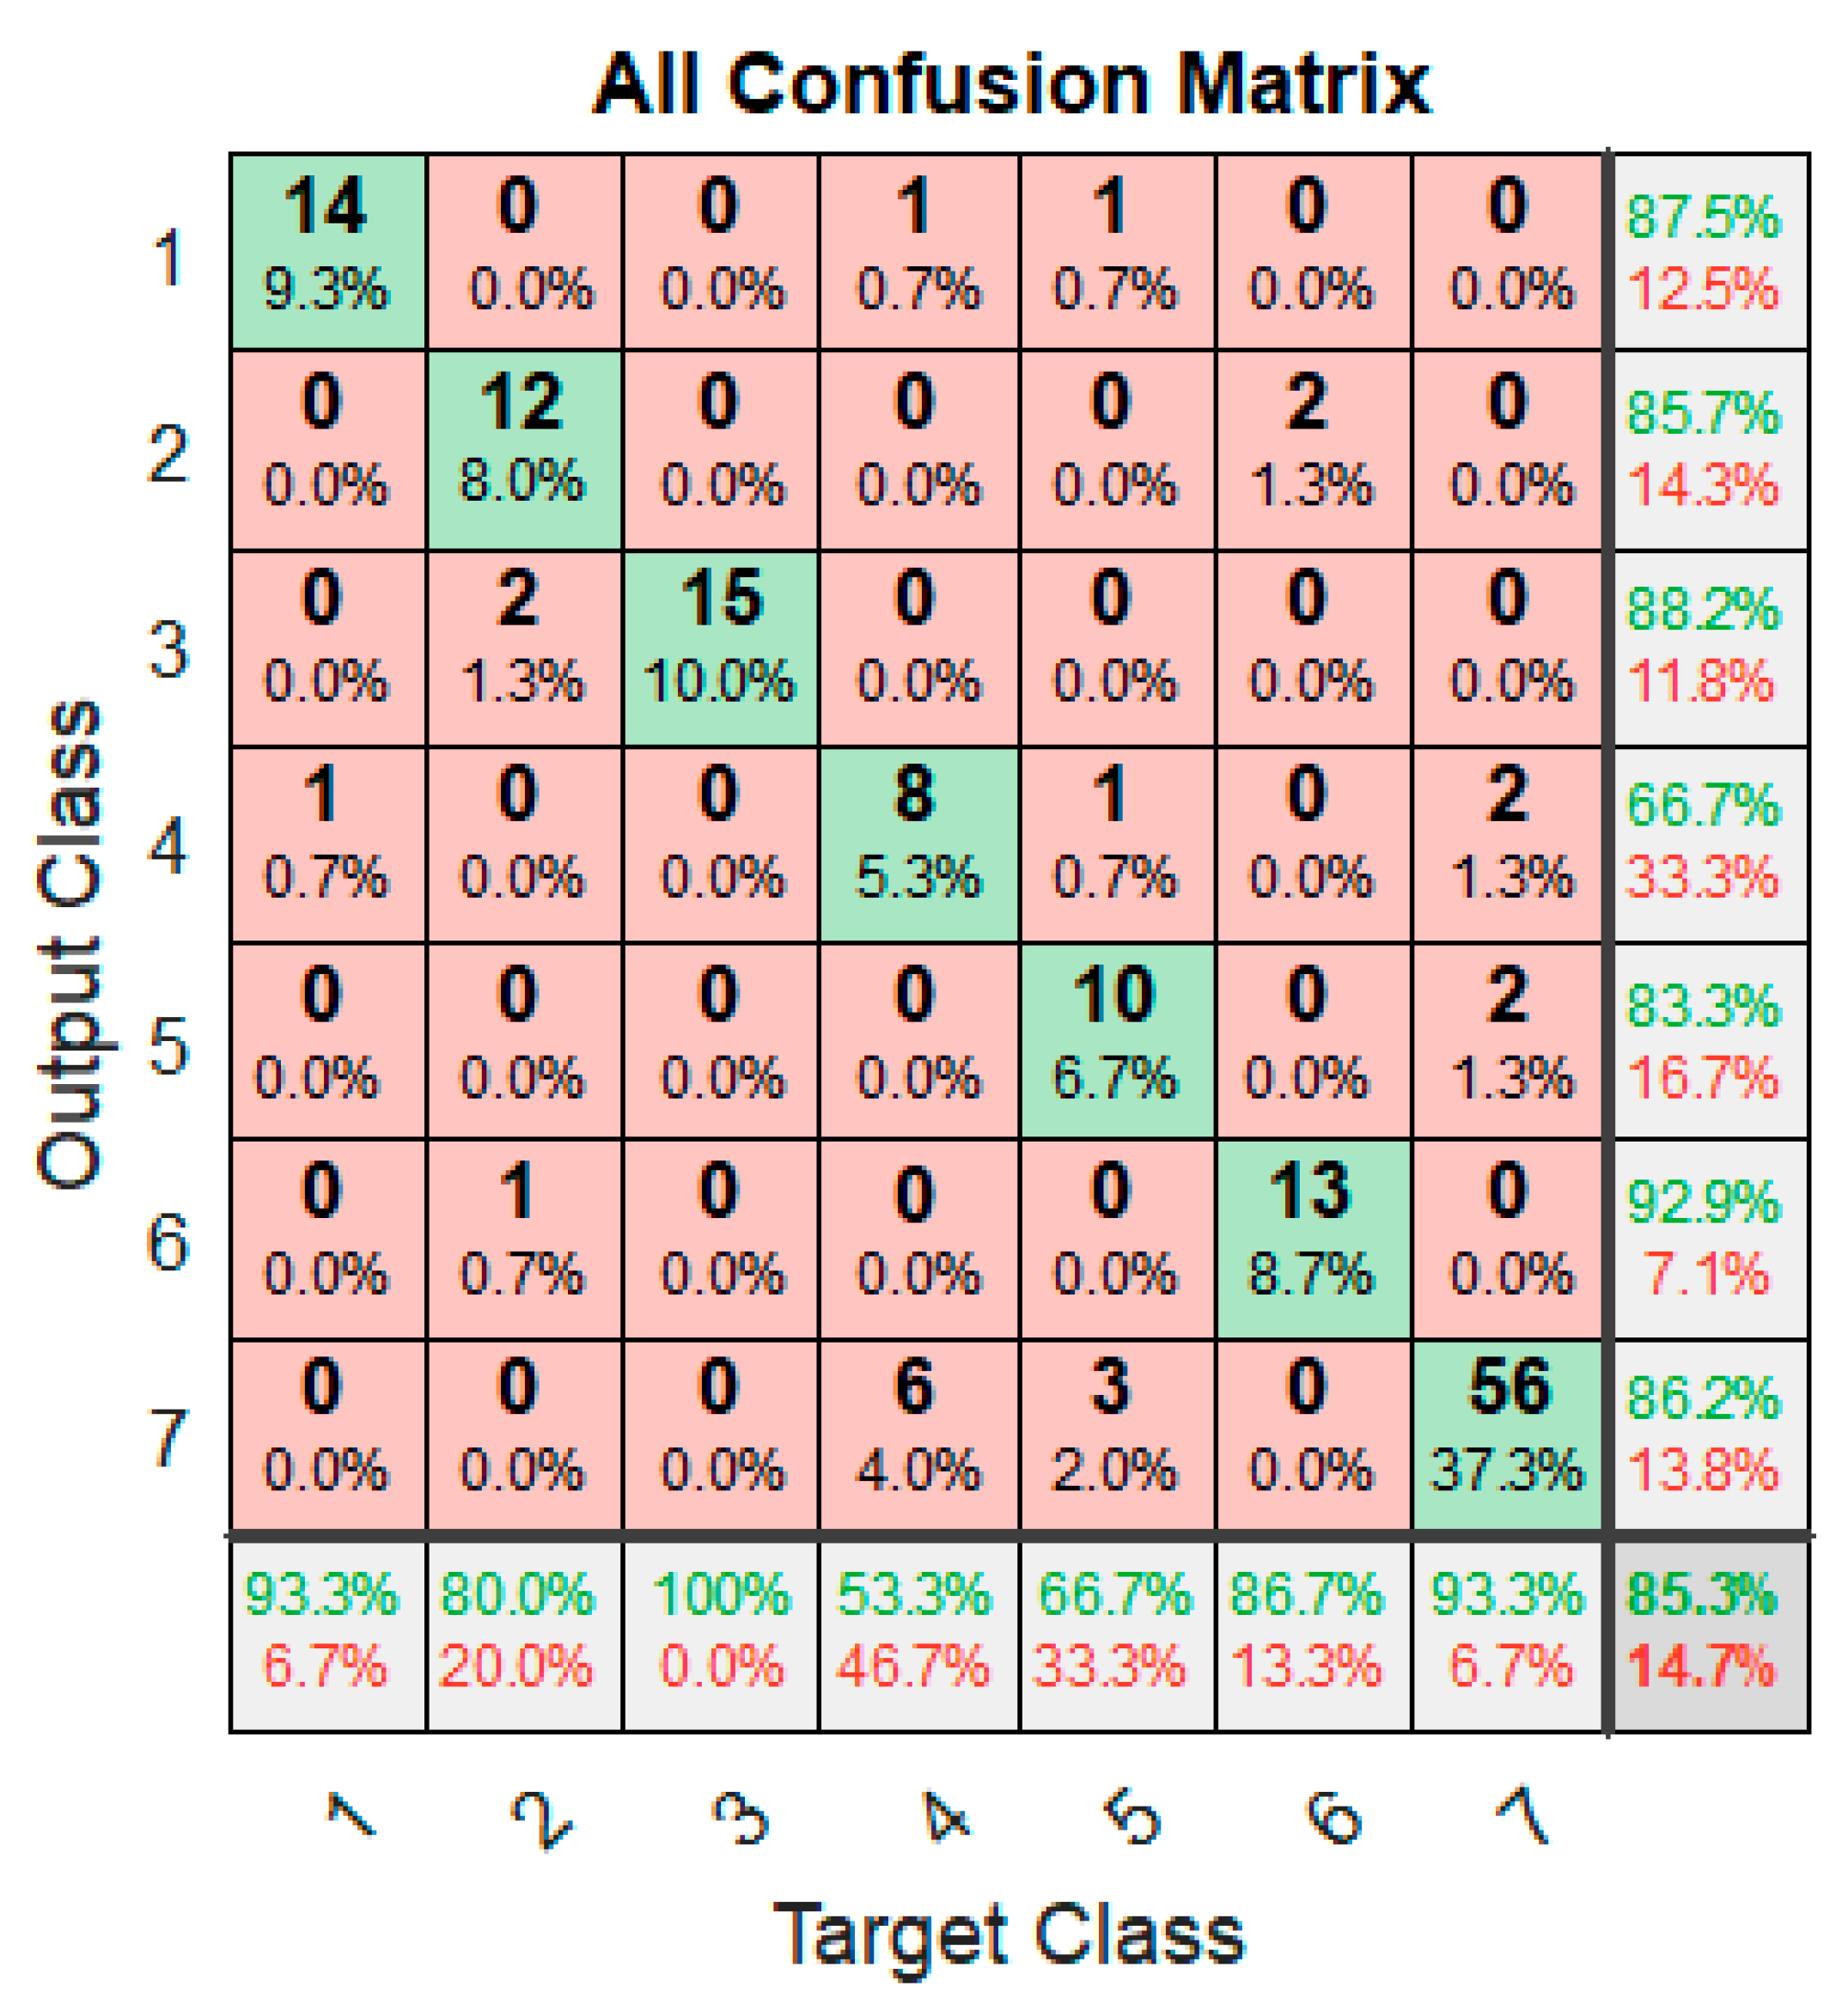
The VOC samples can be divided into 7 classes: single gas of acetone (class 1), ethanol (class 2), IPA (class 3); binary mixture of acetone & ethanol (class 4), acetone & IPA (class 5), ethanol & IPA (class 6); and ternary mixture of acetone, ethanol and IPA (class 7). The single and binary gas has 15 samples for each class and the ternary gas has 60 samples. The total 150 samples are randomly divided into three parts: 70% (104 samples) for training, 15% (23 samples) for validation and 15% (23 samples) for testing. The classification accuracies of training, validation and testing are 85.6%, 87.0% and 82.6%, respectively.
Figure 7 shows the overall confusion matrix of the classifier. The numbers (1 to 7) in both horizontal/vertical axis of the confusion matrix represents seven different target/output classes. The numbers in the diagonal (marked in green color) are the number of correctly predicted samples of each class. Other blocks are wrong predictions. The percentage numbers at the right side and bottom of table indicate the percentage of correct (green) or wrong (red) predictions of that row or column. The overall accuracy is 85.3%.
3.2. Quantitative Identification of VOC Mixture
Regression algorithms aim to model the relationships between the input features and the target output in order to predict an output value for new input data [32]. The target output is called the response variable and the input feature is called the predictor variable. When more than one feature is used in a regression model, the model is called a multivariate regression. Least squares regression is a way to find the best fit curve for a set of data points. It works by minimizing the sum of the squares of the residuals (a residual is the difference between an observed response and the predicted response provided by the model). Depending on whether or not the function giving the residuals is linear, least squares problems fall into two categories: linear least squares and nonlinear least squares. According to Chen et al. [33], nonlinear activation functions in the BPNN are better than linear functions in VOC concentration estimation. Here, multivariate and multioutput regression based on neural network is applied to estimate the amount of each of the three different gases in the binary or ternary gas mixture. The regression network also has 20 inputs, which is the same as the classifier in the above section. Fourteen sigmoid hidden neurons are used in the hidden layer. The output layer has 3 linear neurons. Instead of having 7 true or false output targets, the regression network has 3 numeric targets. The three continuous output parameters are the estimated concentrations of the three VOCs in the tested VOC mixtures.
In this work, 120 samples in total (60 binary mixtures and 60 ternary mixtures) are randomly divided into three groups, with 84 samples for network training, 18 samples for validation and 18 samples for testing. Levenberg–Marquardt (LM) algorithm is applied in the network training to solve the nonlinear least squares problem. Training automatically stops when the mean square error (MSE) of the validation samples starts to increase.
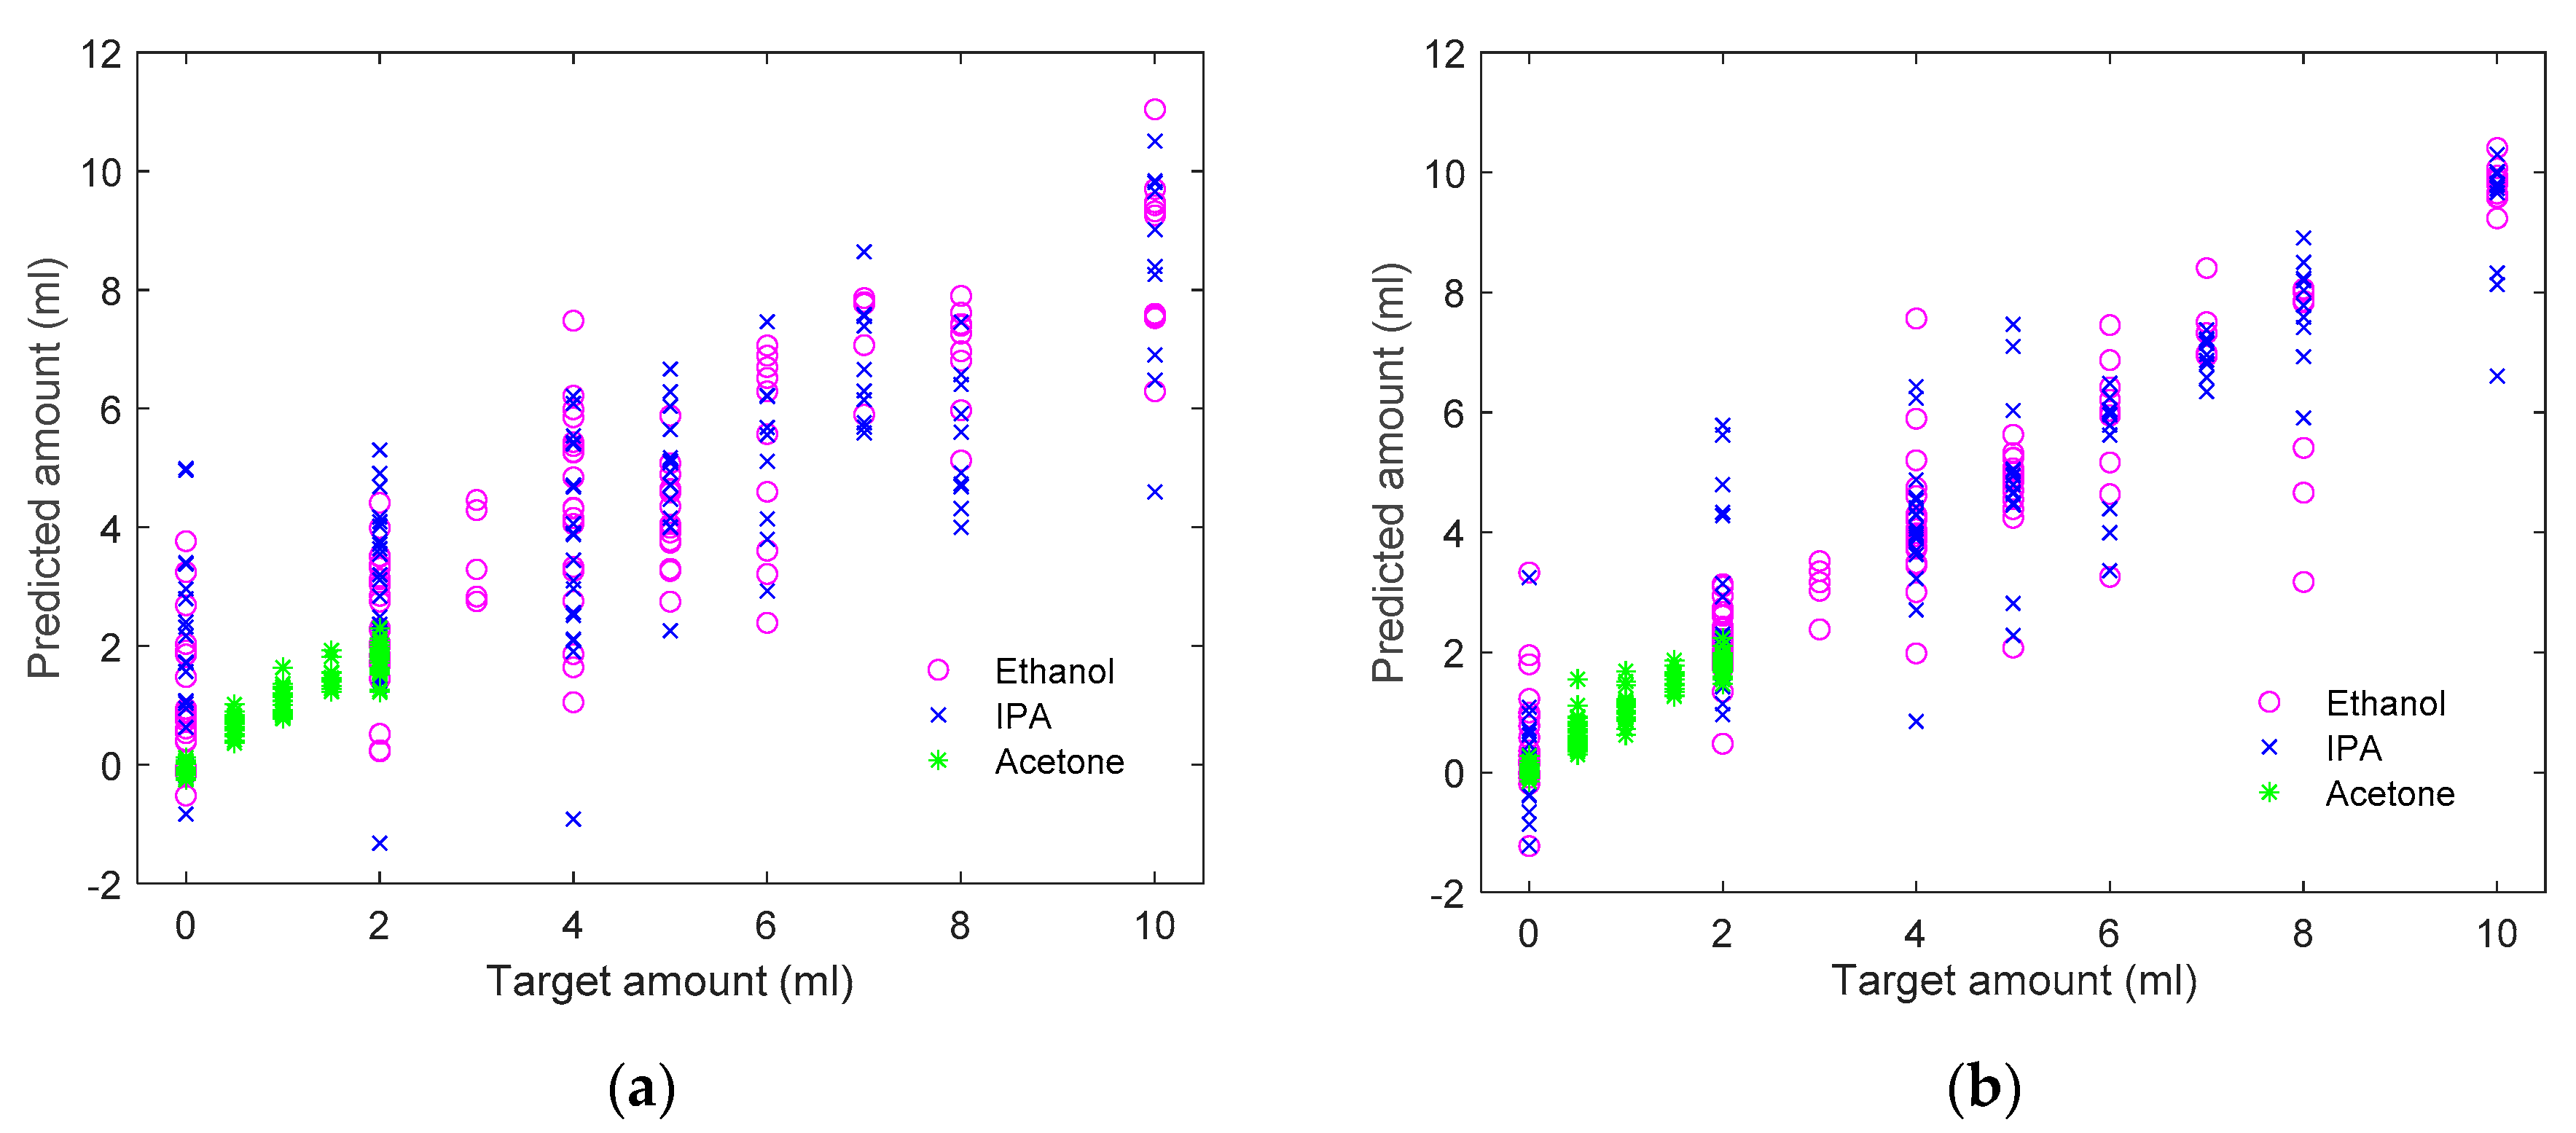
To illustrate the performance of the BPNN detection, Figure 8a,b compares the overall regression result by multivariate linear regression and the BPNN-based regression. In Figure 8, each symbol (‘○’, ‘×’ or ‘❊’) represent a regression point of ethanol, IPA or acetone. It can be seen that the BPNN method offers a lower average error than the linear regression method. MSE of the three VOC gas by BPNN regression is 0.054 mL for acetone (in the range of 0–2 mL), 1.06 mL for ethanol (in the range of 0–10 mL) and 1.33 mL for IPA (in the range of 0–10 mL).
4. Discussion
This work addresses the challenge of detecting and quantifying VOC components in a forced air flow, based on the responses of an array of MOS gas sensors deployed in an open sampling system. As the sensor responses are susceptible to gas dispersion and sensor recovery, most VOC gas-detection methods using MOS sensor array are based on steady-state signals obtained from a closed equilibrated system. As such, the measurement usually has good repeatability. However, it often requires a longer time for data acquisition and a more sophisticated testing procedure and system. The requirement for reaction equilibrium limits the measurement frequency when continuous monitoring is required. In a near real time gas monitoring application, the signal maximum S0 of a transient signal may not accurately represent the amount of target gas due to the limited time for chemical reaction. Further, the requirement for a closed sampling system is not practical for many monitoring applications. Therefore, a sensor array with multiple features and an appropriate algorithm is necessary for accurate detection in this work.
The method of feature extraction in phase space for chemical sensors is first introduced in [30] and has been cited and used by [31], both on steady-state signals. Three phase space parameters of the response curve along with two time space parameters are chosen as the features for pattern recognition in this work. The use of phase space parameter improves the prediction accuracy since the first derivative signal contains information of the dynamic moments. For example, the max (dS/dt) reflects the speed of the reaction.
Qualitative detection of three VOC gases (acetone, ethanol and IPA), as well as its binary and ternary mixtures, has been achieved based on the BPNN classifier. It classifies VOC samples into seven classes, which are the three single gases, three different combinations of the binary mixtures and the ternary mixtures. The VOCs are mixed at different ratios in the mixtures. The validation accuracy reaches 87% on a classification of 150 samples. The performance on distinguishing binary mixture of acetone/ethanol and acetone/IPA is worse in comparison with the performance on the other five classes, whose accuracies are all above 80%.
For quantitative detection of VOC mixtures, multivariate multioutput regression based on BPNN is applied. The MSEs for the three VOC gases are 0.054 mL for acetone (in the range of 0–2 mL), 1.06 mL for ethanol (in the range of 0–10 mL) and 1.33 mL for IPA (in the range of 0–10 mL), respectively. As a comparison, the MSEs of the linear model in Figure 8a for ethanol and IPA estimation are 2.05 mL and 3.6 mL, respectively, which is 93.4% and 170.7% higher than the MSEs by BPNN model. It can be concluded that the performance of the nonlinear method is much better than the linear multivariate regression method, especially for the estimation of ethanol and IPA.
This work presents the design and development of a low-cost electronic nose system to identify three harmful VOC gases in flow through air. The electronic nose system is based on commonly available devices and IC chips, with good availability and affordability. As dynamic monitoring and transient analysis are used, the system can complete a detection cycle within one minute, which also leads to low power consumption in comparison to many other electronic noses. However, similar to other MOS sensor systems, long preheat time of the sensors is still needed to stabilize the baseline, if the sensors are operated for the first time or after a long break. Limited by the repeatability of the MOS sensors themselves and the open sampling system, the regression precision achieved in this study is only around 85%. While this work only involves acetone, IPA, ethanol and their mixtures, the methodology presented here can be readily applied to the development of electronic noses for many other VOC gases and mixtures. MOS sensors are susceptible to ambient variations such as humidity. Since the gas sensors are expected to be directly exposed to the environment without control over ambient parameters, a database and a feedback system for environmental factors will need to be developed as the next step. Together with the portable and low power hardware design, the system is expected to find applications in environmental monitoring and medical diagnostics.
Supplementary Materials
The following are available online at https://0-www-mdpi-com.brum.beds.ac.uk/2227-9040/8/3/73/s1, Calibration procedure. Figure S1: Calibration curves of the sensor TGS 2602 for different concentrations of (a) IPA, (b) Acetone, and (c) Ethanol. Figure S2: The output curves of (a) MQ 136, (b) TGS 2602, (c) TGS 2610, (d) TGS 2611 over a period of 7 days.
Author Contributions
Conceptualization, J.W.; methodology, J.W. and J.H.; software, J.H.; validation, J.W. and J.H.; formal analysis, J.H.; investigation, J.H.; resources, J.W.; data curation, J.H.; writing—original draft preparation, J.H.; writing—review and editing, J.W and J.H.; visualization, J.H.; supervision, J.W.; project administration, J.W.; funding acquisition, J.W. All authors have read and agreed to the published version of the manuscript.
Funding
This research was funded by US Department of Agriculture National Institute of Food and Agriculture (Grant No. 2017-67007-26150) and University of Tennessee Institute for Secure and Sustainable Environment.
Conflicts of Interest
The authors declare no conflict of interest.
References
- United States Environmental Protection Agency (EPA). Volatile Organic Compounds’ Impact on Indoor Air Quality. Available online: https://www.epa.gov/indoor-air-quality-iaq/volatile-organic-compounds-impact-indoor-air-quality (accessed on 2 December 2019).
- Rusinek, R.; Siger, A.; Gawrysiak-Witulska, M.; Rokosik, E.; Malaga-Toboła, U.; Gancarz, M. Application of an electronic nose for determination of pre-pressing treatment of rapeseed based on the analysis of volatile compounds contained in pressed oil. Int. J. Food Sci. Technol. 2020, 55, 2161–2170. [Google Scholar] [CrossRef]
- Marek, G.; Dobrzański, B., Jr.; Oniszczuk, T.; Combrzyński, M.; Ćwikła, D.; Rusinek, R. Detection and Differentiation of Volatile Compound Profiles in Roasted Coffee Arabica Beans from Different Countries Using an Electronic Nose and GC-MS. Sensors 2020, 20, 2124. [Google Scholar] [CrossRef] [PubMed]
- Oakley-Girvan, I.; Davis, S.W. Breath based volatile organic compounds in the detection of breast, lung, and colorectal cancers: A systematic review. Cancer Biomark. 2018, 21, 29–39. [Google Scholar] [CrossRef]
- Luo, H.; Jia, P.; Qiao, S.; Duan, S. Enhancing electronic nose performance based on a novel QPSO-RBM technique. Sens. Actuators B Chem. 2018, 259, 241–249. [Google Scholar] [CrossRef]
- Ezhilan, M.; Nesakumar, N.; Babu, K.a.; Srinandan, C.S.; Rayappan, J.B.B. A Multiple Approach Combined with Portable Electronic Nose for Assessment of Post-harvest Sapota Contamination by Foodborne Pathogens. Food Bioprocess Technol. 2020, 13, 1193–1205. [Google Scholar] [CrossRef]
- Wu, H.; Siegel, M. Odor-based incontinence sensor. In Proceedings of the IEEE Instrumentation and Measurement Technology Conference, Baltimore, MD, USA, 1–4 May 2000; pp. 63–68. [Google Scholar]
- Łagód, G.; Duda, S.M.; Majerek, D.; Szutt, A.; Dołhańczuk-Śródka, A. Application of Electronic Nose for Evaluation of Wastewater Treatment Process Effects at Full-Scale WWTP. Processes 2019, 7, 251. [Google Scholar] [CrossRef] [Green Version]
- Blanco-Rodríguez, A.; Camara, V.F.; Campo, F.; Becherán, L.; Durán, A.; Vieira, V.D.; de Melo, H.; Garcia-Ramirez, A.R. Development of an electronic nose to characterize odours emitted from different stages in a wastewater treatment plant. Water Res. 2018, 134, 92–100. [Google Scholar] [CrossRef]
- Weppner, W. Solid-state electrochemical gas sensors. Sens. Actuators A Phys. 1987, 12, 107–119. [Google Scholar] [CrossRef]
- Dey, A. Semiconductor metal oxide gas sensors: A review. Mater. Sci. Eng. B 2018, 229, 206–217. [Google Scholar] [CrossRef]
- Ishihara, T.; Matsubara, S. Capacitive Type Gas Sensors. J. Electroceram. 1998, 2, 215–228. [Google Scholar] [CrossRef]
- Miura, N.; Minamoto, H.; Sakai, G.; Yamazoe, N. New-type calorimetric gas sensor using temperature characteristics of piezoelectric quartz crystal fitted with noble metal catalyst film. Sens. Actuators B Chem. 1991, 5, 211–217. [Google Scholar] [CrossRef]
- Wang, L.; Gao, J.; Xu, J. QCM formaldehyde sensing materials: Design and sensing mechanism. Sens. Actuators B Chem. 2019, 293, 71–82. [Google Scholar] [CrossRef]
- Wang, L.; Wu, Y.; Li, G.; Xu, H.; Gao, J.; Zhang, Q. Superhydrophobic n-octadecylsiloxane (PODS)-functionalized PDA-PEI film as efficient water-resistant sensor for ppb-level hexanal detection. Chem. Eng. J. 2020, 399, 125755. [Google Scholar] [CrossRef]
- Ricco, J.; Martin, S.J.; Zipperian, T.E. Surface acoustic wave gas sensor based on film conductivity changes. Sens. Actuators A Phys. 1985, 8, 319–333. [Google Scholar] [CrossRef]
- Töpfer, T.; Petrov, K.P.; Mine, Y.; Jundt, D.; Curl, R.F.; Tittel, F.K. Room-temperature mid-infrared laser sensor for trace gas detection. Appl. Opt. 1997, 36, 8042–8049. [Google Scholar] [CrossRef]
- Kladsomboon, S.; Lutz, M.; Pongfay, T.; Kerdcharoen, T. An optical artificial nose system for odor classifications based on LED arrays. In Proceedings of the 8th Electrical Engineering/Electronics, Computer, Telecommunications and Information Technology (ECTI) Association of Thailand—Conference 2011, Khon Kaen, Thailand, 17–19 May 2011; pp. 145–148. [Google Scholar]
- Thepudom, T.; Kladsomboon, S.; Pogfay, T.; Tuantranont, A.; Kerdcharoen, T. Portable optical-based electronic nose using dual-sensors array applied for volatile discrimination. In Proceedings of the 2012 9th International Conference on Electrical Engineering/Electronics, Computer, Telecommunications and Information Technology; Institute of Electrical and Electronics Engineers (IEEE), Phetchaburi, Thailand, 16–18 May 2012; pp. 1–4. [Google Scholar]
- Park, S.Y.; Kim, Y.; Kim, T.; Eom, T.H.; Kim, S.Y.; Jang, H.W. Chemoresistive materials for electronic nose: Progress, perspectives, and challenges. InfoMat 2019, 1, 289–316. [Google Scholar] [CrossRef] [Green Version]
- Figaro USA, Inc. Operating Principle-MOS Type. Available online: http://www.figarosensor.com/technicalinfo/principle/mos-type.html. (accessed on 3 December 2019).
- Xu, Y.; Zhao, X.; Chen, Y.; Zhao, W. Research on a Mixed Gas Recognition and Concentration Detection Algorithm Based on a Metal Oxide Semiconductor Olfactory System Sensor Array. Sensors 2018, 18, 3264. [Google Scholar] [CrossRef]
- Paknahad, M.; McIntosh, C.; Hoorfar, M. Selective detection of volatile organic compounds in microfluidic gas detectors based on “like dissolves like”. Sci. Rep. 2019, 9, 161. [Google Scholar] [CrossRef]
- Romain, A.; Nicolas, J. Long term stability of metal oxide-based gas sensors for e-nose environmental applications: An overview. Sens. Actuators B Chem. 2010, 146, 502–506. [Google Scholar] [CrossRef] [Green Version]
- Honeycutt, W.T.; Ley, M.T.; Materer, N.F. Precision and Limits of Detection for Selected Commercially Available, Low-Cost Carbon Dioxide and Methane Gas Sensors. Sensors 2019, 19, 3157. [Google Scholar] [CrossRef] [Green Version]
- Zhao, L.; Li, X.; Wang, J.; Yao, P.; Akbar, S.A. Detection of Formaldehyde in Mixed VOCs Gases Using Sensor Array with Neural Networks. IEEE Sensors J. 2016, 16, 1. [Google Scholar] [CrossRef]
- Introduction to Principal Components and FactorAnalysis. Available online: ftp://statgen.ncsu.edu/pub/thorne/molevoclass/AtchleyOct19.pdf (accessed on 1 January 2020).
- PK Safety. Search/Multi-gas. Available online: https://pksafety.com/search.php?search_query=multi-gas§ion=product. (accessed on 3 August 2020).
- Carmel, L.; Levy, S.; Lancet, D.; Harel, D. A feature extraction method for chemical sensors in electronic noses. Sens. Actuators B Chem. 2003, 93, 67–76. [Google Scholar] [CrossRef]
- Martinelli, E.; Falconi, C.; D’Amico, A.; Di Natale, C. Feature Extraction of chemical sensors in phase space. Sens. Actuators B Chem. 2003, 95, 132–139. [Google Scholar] [CrossRef]
- S Zhang, S.; Xie, C.; Hu, M.; Li, H.; Bai, Z.; Zeng, D. An entire feature extraction method of metal oxide gas sensors. Sens. Actuators B Chem. 2008, 132, 81–89. [Google Scholar] [CrossRef]
- Bali, R.; Sarkar, D. R Machine Learning by Example; Packt Publishing: Birmingham, UK, 2016. [Google Scholar]
- Chen, Z.; Zheng, Y.; Chen, K.; Li, H.; Jian, J. Concentration Estimator of Mixed VOC Gases Using Sensor Array with Neural Networks and Decision Tree Learning. IEEE Sens. J. 2017, 17, 1884–1892. [Google Scholar] [CrossRef]
Figure 1.
(a) A picture of the glove box used in this work, (b) a schematic of the experimental system for flow through gas detection.
Figure 1.
(a) A picture of the glove box used in this work, (b) a schematic of the experimental system for flow through gas detection.

Figure 2.
(a) Responses of the 6 metal-oxide-semiconductor (MOS) sensors toward acetone; (b) single and mixed gas response curve of TGS 2602.
Figure 2.
(a) Responses of the 6 metal-oxide-semiconductor (MOS) sensors toward acetone; (b) single and mixed gas response curve of TGS 2602.

Figure 3.
Response curves of (a) MQ 136, (b) MQ 136, (c) TGS 2600, (d) TGS 2602, (e) TGS 2610, (f) TGS 2611 to different VOCs: 2 mL of 8.3% acetone (in air); 10 mL of 1.71% IPA (in air); 10 mL of 1.74% ethanol (in air).
Figure 3.
Response curves of (a) MQ 136, (b) MQ 136, (c) TGS 2600, (d) TGS 2602, (e) TGS 2610, (f) TGS 2611 to different VOCs: 2 mL of 8.3% acetone (in air); 10 mL of 1.71% IPA (in air); 10 mL of 1.74% ethanol (in air).

Figure 4.
Schematic of the microcontroller-based signal acquisition system.

Figure 5.
(a) Representative response curve of a MOS sensor and its extracted parameters in phase space; and using (b) TGS 2602, (c) MQ 136, the obtained response curve to different amounts of ethanol and acetone in phase space. Solid line represents ethanol; dotted line represents acetone.
Figure 5.
(a) Representative response curve of a MOS sensor and its extracted parameters in phase space; and using (b) TGS 2602, (c) MQ 136, the obtained response curve to different amounts of ethanol and acetone in phase space. Solid line represents ethanol; dotted line represents acetone.

Figure 6.
Diagram of the neural network.

Figure 7.
Confusion matrix of classification results.

Figure 8.
Target versus predicted amount of gas in VOC mixture (a) multivariate linear regression (b) backpropagation neural network (BPNN).
Figure 8.
Target versus predicted amount of gas in VOC mixture (a) multivariate linear regression (b) backpropagation neural network (BPNN).


Table 1.
Gas sensors in the array.
| Sensor | Price | Response | Work Condition | Electrical Characteristic |
|---|---|---|---|---|
| MQ 135 | $2.86 | Ammonia, nitrogen oxide, alcohols, aromatic compounds, sulfide and smoke. | VC, VH: 5 ± 0.1 V PH ≤ 800 mW | RS: 30–200 kΩ (100 ppm NH3) α ≤ 0.65 (200/50 NH3) |
| MQ 136 | $18.7 | Hydrogen sulfide gas, organic vapor including sulfur. | VC, VH: 5 ± 0.1 V PH ≤ 800 mW | RS: 30–200 kΩ (10 ppm H2S) α ≤ 0.65 (20/5 H2S) |
| TGS 2600 | $3.50 | Gaseous air contaminants, methane, carbon monoxide, isobutane, ethanol, hydrogen | VC, VH: 5 ± 0.2 V PH: 210 mW | RS: 10–90 kΩ (in air) β = 0.3–0.6 (10 ppm H2/air) |
| TGS 2602 | $6.61 | VOCs, ammonia, hydrogen sulfide, toluene, ethanol, etc., air contaminants | VC, VH: 5 ± 0.2 V PH: 280 mW | RS: 10–100 kΩ (in air) β = 0.15–0.5 (10 ppm EtOH/air) |
| TGS 2610 | $12 | Butane, LP gas, propane, methane, hydrogen, general hydrocarbons | VC, VH: 5 ± 0.2 V PH: 280 mW | RS: 1–10 kΩ (in 1800 ppm isobutane) β = 0.45–0.62 (3000 ppm/1000 ppm isobutane) |
| TGS 2611 | $7.63 | Methane, natural gas, hydrogen | VC, VH: 5 ± 0.2 V PH = 280 ± 25 mW | RS: 0.68–6.8 kΩ (in 5000 ppm methane) β = 0.60 ± 0.06 (9000 ppm/3000 ppm methane) |
VC—circuit voltage; VH—heater voltage; PH—heater power consumption; RS—sensor resistance; α—concentration slope rate; β—change ratio of Rs.
Table 2.
Correlation coefficient between sensors.
| Sensor | MQ 135 | MQ 136 | TGS 2600 | TGS 2602 | TGS 2610 | TGS 2611 |
|---|---|---|---|---|---|---|
| MQ 135 | 1 | – | – | – | – | – |
| MQ 136 | 0.9499 | 1 | – | – | – | – |
| TGS 2600 | 0.8363 | 0.9067 | 1 | – | – | – |
| TGS 2602 | 0.7794 | 0.8321 | 0.9702 | 1 | – | – |
| TGS 2610 | 0.9174 | 0.9855 | 0.9325 | 0.8447 | 1 | – |
| TGS 2611 | 0.9408 | 0.9692 | 0.7998 | 0.6987 | 0.9409 | 1 |
Table 3.
Principal component analysis of the sensor array.
| PC | PC1 | PC2 | PC3 | PC4 | PC5 | PC6 |
|---|---|---|---|---|---|---|
| MQ 135 | 0.0193 | 0.0563 | −0.1183 | 0.0855 | −0.1215 | 0.9800 |
| MQ 136 | 0.2510 | 0.7081 | -0.4392 | −0.2516 | 0.4228 | −0.0243 |
| TGS 2600 | 0.1441 | 0.0892 | 0.5017 | −0.5653 | 0.6273 | 0.0810 |
| TGS 2602 | 0.9332 | −0.3415 | −0.0739 | −0.0302 | −0.0776 | −0.0147 |
| TGS 2610 | 0.1997 | 0.5234 | 0.6608 | −0.2286 | −0.4441 | 0.0107 |
| TGS 2611 | 0.0722 | 0.3113 | −0.3152 | 0.7461 | −0.4580 | −0.1792 |
| EXP | 96.0152 | 3.8214 | 0.1293 | 0.0185 | 0.0116 | 0.0040 |
EXP: explained.
© 2020 by the authors. Licensee MDPI, Basel, Switzerland. This article is an open access article distributed under the terms and conditions of the Creative Commons Attribution (CC BY) license (http://creativecommons.org/licenses/by/4.0/).
Share and Cite
MDPI and ACS Style
Huang, J.; Wu, J. Robust and Rapid Detection of Mixed Volatile Organic Compounds in Flow Through Air by a Low Cost Electronic Nose. Chemosensors 2020, 8, 73. https://0-doi-org.brum.beds.ac.uk/10.3390/chemosensors8030073
AMA Style
Huang J, Wu J. Robust and Rapid Detection of Mixed Volatile Organic Compounds in Flow Through Air by a Low Cost Electronic Nose. Chemosensors. 2020; 8(3):73. https://0-doi-org.brum.beds.ac.uk/10.3390/chemosensors8030073
Chicago/Turabian StyleHuang, Jiamei, and Jayne Wu. 2020. "Robust and Rapid Detection of Mixed Volatile Organic Compounds in Flow Through Air by a Low Cost Electronic Nose" Chemosensors 8, no. 3: 73. https://0-doi-org.brum.beds.ac.uk/10.3390/chemosensors8030073
Note that from the first issue of 2016, this journal uses article numbers instead of page numbers. See further details here.