Fabrication of a 3D-Printed Porous Junction for Ag|AgCl|gel-KCl Reference Electrode


Department of Chemistry, Ateneo de Manila University, Quezon City 1108, Philippines
*
Author to whom correspondence should be addressed.
Chemosensors 2020, 8(4), 130; https://0-doi-org.brum.beds.ac.uk/10.3390/chemosensors8040130
Submission received: 11 October 2020
/
Revised: 17 November 2020
/
Accepted: 20 November 2020
/
Published: 13 December 2020
(This article belongs to the Special Issue Printed Chemical Sensors)
Abstract
:Fused filament fabrication (FFF) is a 3D printing method that is attracting increased interest in the development of miniaturized electrochemical sensor systems due to its versatility, low cost, reproducibility, and capability for rapid prototyping. A key component of miniaturized electrochemical systems is the reference electrode (RE). However, reports of the fabrication of a true 3D-printed RE that exhibits stability to variations in the sample matrix remain limited. In this work, we report the development and characterization of a 3D-printed Ag|AgCl|gel-KCl reference electrode (3D-RE). The RE was constructed using a Ag|AgCl wire and agar-KCl layer housed in a watertight 3D-printed acrylonitrile butadiene styrene (ABS) casing. The novel feature of our electrode is a 3D-printed porous junction that protects the gel electrolyte layer from chloride ion leakage and test sample contamination while maintaining electrical contact with the sample solution. By tuning the 3D printing filament extrusion ratio (k), the porosity of the junction was adjusted to balance the reference electrode potential stability and impedance. The resulting 3D-RE demonstrated a stable potential, with a potential drift of 4.55 ± 0.46 mV over a 12-h period of continuous immersion in 0.1 M KCl, and a low impedance of 0.50 ± 0.11 kΩ. The 3D-RE was also insensitive to variations in the sample matrix and maintained a stable potential for at least 30 days under proper storage in 3 M KCl. We demonstrate the application of this 3D-RE in cyclic voltammetry and in pH sensing coupled with electrodeposited iridium oxide on a gold electrode. Our method offers a viable strategy for 3D printing a customizable true reference electrode that can be readily fabricated on demand and integrated into 3D-printed miniaturized electrochemical sensor systems.
1. Introduction
Due to the increased demand for decentralized health, food, and environmental monitoring, there is a growing interest in the development of low-cost miniaturized sensors [1]. In particular, miniaturized electrochemical sensors, such as potentiometric or voltammetric sensors, are attractive methods for decentralized sensing applications due to their sensitivity, selectivity, reproducibility, ease-of-use, and portability [2]. Advances in digital additive manufacturing technologies such as 3D printing have also led to improvements in the accessibility and cost-effectiveness of these miniaturized, integrated electrochemical sensors [3,4,5]. With 3D printing, custom miniaturized electrochemical sensors can be rapidly prototyped and fabricated reproducibly on demand with inexpensive equipment and materials [5].
A major challenge in the development of integrated electrochemical sensor systems is the miniaturization, manufacturability, and stability of the reference electrode. In two- and three-electrode electroanalytical setups, the reference electrode maintains a constant potential to control and/or measure the potential of the working electrode (WE) [6]. The ideal reference electrode is repeatable, maintains a stable potential for the duration of the device operation, and is insensitive to variations in the sample matrix [7,8]. While research focus is typically placed on the sensing element in a miniaturized electrochemical sensor, the reference electrode also plays a key role in determining the reproducibility and accuracy of the sensor measurements. The successful fabrication of a stable, reproducible miniaturized reference electrode is therefore vital in guaranteeing the accuracy and robustness of any miniaturized electrochemical sensor [7].
The most common reference electrode is the Ag|AgCl|Cl− electrode because of its ease of construction, stability, safety, and relatively low cost [7]. In its most basic construction, the traditional macroscopic Ag|AgCl|Cl− reference electrode is a AgCl-coated Ag wire that is immersed in a solution of fixed chloride ion activity, typically a filling solution of 3 M or saturated KCl [8]. The wire and electrolyte solution are traditionally contained in a glass housing with a porous glass or ceramic junction that facilitates electrical contact between the reference and the sample solution. The potential of the Ag|AgCl|Cl− reference electrode is dependent on the chloride ion activity in direct contact with the Ag|AgCl wire, so maintaining the chloride ion activity in the internal filling solution is one of the key factors in maintaining a stable, reproducible reference potential [7,8].
Most of the reference electrodes integrated into miniaturized electrochemical systems, however, are pseudo-reference electrodes (pREs)—that is, they do not contain an internal electrolyte solution. A common pRE, for example, is a bare Ag|AgCl wire or film, which can be readily fabricated using various methods [9,10,11]. While pREs are simple in construction, they have limited applicability in complex sample matrices [12]: the Ag|AgCl electrode is in direct contact with the sample solution, so its potential is susceptible to variations in chloride ion activity and interferences from other electrolytes and redox species [8]. Systems that use a pRE can only be reliably applied if an internal standard redox couple is integrated into the analysis and/or if the sample matrix is well-characterized and constant [9,13].
To develop more stable miniaturized reference electrodes, research has been dedicated to various approaches to maintain a constant internal electrolyte activity while maintaining electrical contact with the sample solution. Early approaches attempted to miniaturize the construction of conventional macroscopic reference electrodes on a silicon chip by integrating a miniaturized cavity to house an internal liquid electrolyte solution. Electrical contact with the sample solution was established via a micro-etched silicon porous frit [14] or a pinhole junction [15]. Further developments replaced the liquid internal filling solution with a solid-state filling solution such as an electrolyte-infused polymer gel with the aim of minimizing electrolyte concentration changes due to evaporation of the small volume of solution [13,16]. These gel reference electrodes exhibited potentials that are comparable to conventional liquid-filled electrodes and are also less sensitive to changes in temperature and pressure [17]. They also avoid the problems with liquid solution leakage and orientation-dependent storage and usage. The gel electrolyte layer can be as simple as an agar-KCl layer, although the potential stability of such a system tends to be limited due to the rapid diffusion of chloride ions from the electrolyte layer to the sample solution [13,16,17]. To minimize potential drift, solid-state electrolyte layers can involve more complex polymer cocktails [18,19] that can also incorporate ionophores to minimize electrolyte diffusion from the membrane to the sample solution [20]. Alternatively, to protect the gel-KCl electrolyte layer, a second porous membrane coating can be applied to separate the electrolyte layer from the sample and to slow the diffusion of the chloride ion [21,22]. Another strategy is to fabricate a pinhole or diaphragm junction to protect the agar-KCl electrolyte layer from the sample solution [17,23].
Many of the methods used to fabricate miniaturized reference electrodes involve complex photolithography techniques, but the same architectures can be adapted using the more accessible 3D printing method instead. The most affordable and accessible 3D printing method is fused filament fabrication (FFF), which utilizes a temperature-controlled nozzle to deposit a semimolten thermoplastic material in a layer-by-layer fashion [3]. FFF has been applied in the fabrication of electrochemical cells, accessories, and lab-on-a-chip systems using commercially available 3D printers and thermoplastic filaments such as acrylonitrile butadiene styrene (ABS) and polylactic acid (PLA) [24,25,26,27,28,29]. Electrodes can also be 3D printed using PLA or ABS filament mixed with carbon black, graphite, graphene, or carbon nanotubes. Using both conductive and nonconductive filaments, electrochemical cells with integrated working electrodes, counter electrodes, and reference electrodes have been fabricated and applied for the analysis of metal ions and pharmaceuticals [26,27,28,30,31]. Most 3D-printed reference electrodes reported in the literature, however, are bare or Ag|AgCl-coated carbon-based pREs, which do not exhibit potential stability with changes in the sample matrix [11,26,28,32]. The first true 3D-printed reference electrode that exhibited matrix-independent potential stability was reported by Lewenstam et al., who 3D printed a poly(vinyl chloride) (PVC) filament loaded with KCl as the solid-state electrolyte layer in a Ag|AgCl|Cl− reference electrode [33]. However, the fabrication of the electrode required a customized 3D printer to deposit the KCl-PVC composite due to the incompatibility of the custom filament with typical FFF 3D printers.
Fabricating the polymer–electrolyte layer of a reference electrode via 3D printing can be challenging, but 3D printing can also be used to fabricate other key components of a true reference electrode. Specifically, there are currently no reports of taking advantage of the inherent porous property of FFF 3D-printed objects to fabricate a porous junction. Since objects fabricated through FFF are built layer-by-layer, they are known to be porous depending on the slicing and printing parameters, such as wall geometry and thickness, G-code defined wall structure, filament extrusion ratio, and printing layer thickness [34,35]. Various postprocessing treatments such as hot or cold solvent vapor treatment of FFF-printed parts have also been developed to fill in voids between print layers and to improve the surface finish [36,37,38]. Thus, by controlling the printing parameters and postprocessing treatments, a 3D-printed object can be designed to be nonporous or porous; we propose that a reference electrode casing, for example, can be fabricated to be watertight [39], whereas the porosity of a 3D-printed junction can be adjusted to control internal electrolyte ion diffusion while maintaining electrical contact between the internal reference electrolyte and the sample.
In this work, we present the development and characterization of a 3D-printed Ag|AgCl|Cl− reference electrode. Our proposed reference electrode is constructed using a watertight 3D-printed ABS casing, which houses a Ag|AgCl wire and an agar-KCl layer. Contact between the reference electrode and the sample solution is facilitated through a 3D-printed porous junction. We show how we tuned the 3D printing parameters to optimize the porosity of the junction to balance reference electrode potential stability and impedance. The 3D-printed reference electrode was evaluated for short-term and long-term potential stability as well as stability in various sample solutions. Our results indicate that a stable, reproducible true reference electrode can be readily 3D printed using relatively low-cost and widely available hardware and materials. Our reference electrode can also be customized, fabricated reproducibly on demand, and integrated into a complete 3D-printed electrochemical system for various sensing applications in complex media.
2. Materials and Methods
2.1. Materials and Instrumentation
All aqueous solutions were prepared from analytical grade reagents and deionized (DI) water (>18 MΩ cm) purified through a Barnstead EasyPure LF compact ultrapure water system (Thermo Fisher Scientific, Inc., Waltham, MA, USA). NaHCO3 and pH buffers (pH 4.00, pH 7.00, and pH 10.00) were purchased from Scharlau (Scharlab, S.L., Barcelona, Spain). IrCl3·xH2O and starch from potato (soluble) were purchased from Sigma-Aldrich (St. Louis, MO, USA). Na2HPO4·2H2O was purchased from Chemline (Chemline Scientific Corporation (Quezon City, Philippines)). NaH2PO4·H2O was purchased from Loba Chemie Laboratory Reagents and Fine Chemicals (Mumbai, India). K3[Fe(CN)6] and KBr were purchased from J.T. Baker Chemical Co. (Thermo Fisher Scientific, Inc., Waltham, MA, USA) 30% H2O2, KCl, K2CO3, and KNO3 were purchased from Merck (Darmstadt, Germany). Anhydrous Na2SO4 was purchased from Ajax Finechem Pty. Ltd (Thermo Fisher Scientific, Inc., Waltham, MA, USA). Oxalic acid dihydrate was purchased from Himedia (Mumbai, India). Isopropyl alcohol and NaCl were purchased from RCI Labscan, Ltd (Bangkok, Thailand). Acetone and absolute ethanol were purchased from Pharmaco-Aaper (Greenfield Global USA Inc., Brookfield, CT, USA). Analytical grade glacial acetic acid, 70% HNO3, 36% HCl, and NaOH pellets were purchased from Macron Fine Chemicals (Avantor, Randor, PA, USA). Granulated agar was purchased from BBL Difco (Becton, Dickinson and Company, Franklin Lakes, NJ, USA). SU-8 ink (SU-8 2002) was purchased from MicroChem (Kayaku Advanced Materials, Inc., Westborough, MA, USA). Polyethylene naphthalate (PEN) film (Teonex Q65HA) was purchased from Dupont Teijin Films (DTF Singapore, DuPont Company Pte Ltd., Singapore). High-purity gold coin (99.9%) was purchased from a jeweler’s shop and analyzed with an XRF (Horiba, Ltd., Kyoto, Japan) for purity.
3D printing was conducted using a dual-extruder Flashforge Creator Pro 3D printer (Zhejiang Flashforge 3D Technology Co., Ltd., Jinhua, China). A 1.75 mm white acrylonitrile butadiene styrene (ABS) filament was purchased from 3D Puzzle Box (Quezon City, Philippines). Inkjet printing of gold electrodes were done in Microfab Jetlab 4xl (MicroFab Inc., Plano, TX, USA) using a 60-micron jetting device (MJ-AT-01–60).
Microwave hydrolysis and synthesis were done using a laboratory microwave synthesizer flexiWAVE (Milestone Srl, Sorisole (BG), Italy). Centrifugation was done using Sorvall Legend X1R (Thermo Fisher Scientific, Inc., Waltham, MA, USA). Ultrasonic dispersion of nanoparticles was conducted in a Q500 ultrasonic processor with a cup horn attachment (Qsonica, Newtown, CT, USA).
Potentiostatic electrochemical impedance spectroscopy (EIS) and galvanostatic electrodeposition were conducted using a Gamry Interface 5000E potentiostat/galvanostat (Warminster, PA, USA). Open-circuit potential measurements and voltammetric analysis were conducted using a Rodeostat Model 10 V Potentiostat with a seven-channel multiplexer installed (IORodeo, Pasadena, CA, USA). The potentiostat was controlled through a Python-based interface (potentiostat package version 0.0.4). Electrochemical data were filtered with the Savitzky–Golay filter for data smoothening [40]. Unless otherwise indicated, potentials were measured with respect to a saturated calomel electrode (SCE) from Shanghai INSEA Scientific Instrument Co., Ltd. (Shanghai, China). pH measurements and ORP (oxidation/reduction potential) readings were obtained using a Eutech pH 700 pH meter (Thermo Fisher Scientific, Inc., Waltham, MA, USA).
2.2. Fabrication of 3D-RE Components
The model of the 3D-printed reference electrode (3D-RE) casing was designed in AutoDesk 123D Design software. The 3D-RE casing incorporated a 7.0 mm × 7.5 mm × 3.5 mm cavity to hold the Ag|AgCl wire and the internal gel electrolyte. A 3.5 mm × 3.5 mm opening in the cavity facilitates the contact of the internal gel electrolyte and the sample. Surrounding the opening is also a 7.0 mm × 7.5 mm × 0.80 mm recess to fit a 3D-printed porous junction. The 3D-RE casing and the junction are 3D-printed separately using different 3D printing parameters and postprocessing.
The design files (STL) were exported to FlashPrint version 3.21.0 software to control the G-code slicing and 3D printing parameters of the 3D model. Unless otherwise indicated, 3D models were sliced with a perimeter shell count of 2 and 100% infill, which ensures that the filament is deposited throughout the entire internal volume of the model with minimal G-code generated gaps within the internal structure. The 3D-RE casings were sliced with a 0.18 mm layer height and an extrusion ratio (k) of 1.10. The 3D-printed junctions, on the other hand, were vertically oriented and sliced with variable extrusion ratios (k = 0.85, 0.95, and 1.05) and a fixed layer height of 0.40 mm. G-code files were then exported to the 3D printer. 3D printing was conducted with an ABS filament using a 0.4 mm nozzle, a nozzle temperature of 215 °C, platform temperature of 105 °C, base print speed of 30 mm/s, and retraction length of 1.3 mm.
After 3D printing, the RE casing was postprocessed using acetone vapor smoothening. Here, approximately 10 mL of acetone was heated to 80 °C in a loosely covered 100 mL beaker. The casings were suspended in the beaker for approximately 5 min and were then allowed to cool and solidify for 30 min prior to further handling.
The 3D-printed junctions, on the other hand, were water bath sonicated in 3 M KCl for 30 min to expedite the displacement of air bubbles in the junction pores with electrolyte solution. The junctions were then assembled and fused onto the RE compartment using an ABS slurry (1:1 weight ratio of ABS filament dissolved in acetone).
2.3. Water Absorption Study
To estimate the open porosity of the FFF 3D-printed junctions and casing walls, water absorption studies were conducted using 7.0 mm × 7.5 mm × 0.80 mm 3D-printed samples [39]. The size of our test specimen corresponds to the dimensions of the printed junctions and the dimensions of the rear wall of the 3D-RE casing cavity. Five replicate print samples were evaluated per test case. After 3D printing, specimens were kept in a desiccating cabinet for at least 24 h and were then weighed to obtain their dry masses (mdry). The 3D-printed filament density was estimated by dividing the dry mass by the expected model volume (42 mm3). The samples were then immersed in DI water and water bath sonicated for 30 min to expedite the displacement of air bubbles in the specimen pores. The immediate surfaces of the samples were patted dry with lint-free tissue to remove excess water on the surface of the specimens. Samples were then weighed to obtain their wet mass (mwet). The % water absorption was calculated using Equation (1). Water absorption corresponds to the ratio of the mass of water absorbed to the dry mass of the 3D-printed specimen.
2.4. 3D-RE Assembly
Ag wire with 0.4 mm diameter was polished with 50 μm alumina powder and immersed in 0.1 M HNO3 for 10 s to remove surface oxides. The wire was then sonicated in deionized water and cut to 15 mm pieces. A coating of AgCl was formed at the surface of the Ag wire by immersing the wire in commercial bleach [41]. An immersion time of 30 min was sufficient to form a stable, thick coating of AgCl. The Ag|AgCl wire was then rinsed three times with DI water, air dried, then inserted into the 3D-RE casing. The wire was sealed into the electrode compartment with ABS slurry.
To form the internal gel electrolyte layer, 2% wt. agar was prepared in 3 M KCl saturated with AgCl [13,23]. While at 80 °C, 180 μL of the agar solution was injected into the inner reference electrolyte compartment and allowed to cool and solidify. Care was taken to avoid the presence of air bubbles in the gel. The 3D-REs were then conditioned in 3 M KCl for at least 24 h before use.
2.5. Characterization of 3D-RE
The potential stabilities of the 3D-REs were analyzed by measuring the open circuit potential (OCP) of a two-electrode setup, in which the 3D-RE was connected to the WE terminal of the potentiostat and the master reference electrode, which was a commercial standard calomel electrode (SCE), was connected to the RE terminal. To evaluate the potential drift of the fabricated electrodes, the OCP between the 3D-RE and the master RE was measured in 0.1 M KCl aqueous solution over a period of 12 h, with OCP measurements taken every 10 min. The long-term potential stability of the RE was also tested by measuring the OCP of the 3D-printed electrodes for a period of 10 min in 0.1 M KCl daily for 30 days. Electrodes were stored in 3 M KCl when not in use.
Reference electrode impedance was measured using potentiostatic EIS in 0.1 M KCl electrolyte solution [8]. The evaluated RE was connected to the WE terminal of the potentiostat, a Pt wire connected to the CE terminal, and a SCE connected to the RE terminal. An EIS scan was ran from 100 kHz to 0.5 Hz, with an applied DC potential set as zero versus the OCP and an AC waveform of 5 mV amplitude.
The potential stabilities of the 3D-RE in various electrolyte solutions were evaluated, in separate 10−4, 10−3, 10−2, 10−1, and 1 M solution of each of KCl, NaCl, KNO3, NaNO3, Na2SO4, and KBr. The effect of sample solution pH was also tested by measuring the potential stability of the reference electrode in 0.1 M standard buffer solutions at pH 3, 7, and 11 (phosphate buffers), pH 5 (acetate buffer), and pH 9 (carbonate buffer), whereas pH 2 and pH 12 solutions were also prepared using HCl and NaOH, respectively.
2.6. Application of 3D-RE
The 3D-RE was also tested as a RE in two different applications. First, it was tested as the reference electrode in the cyclic voltammetry (CV) of 4 mM ferricyanide in 0.1 M KCl solution using a carbon paste electrode as the WE and Pt wire as CE at a potential scan range of +0.80 V to −0.20 V and scan rate of 100 mV/s. Voltammograms were compared to those recorded using a Ag|AgCl pRE and the commercial SCE.
Second, the 3D-RE was tested as the reference electrode for potentiometric pH measurements using an inkjet-printed gold with electrodeposited iridium oxide (IrOx|Au) pH sensor (Figure S1). The synthesis, formulation, and inkjet printing of the Au ink to fabricate the Au electrode were achieved following previous work [42]. Here, the Au electrode is made of a 1-mm diameter circle connected to a contact pad with 250-μm conducting line. The conducting line was then covered with an SU-8 dielectric that was then dried at 100 °C and cured with UV light for 1 min. Alternatively, covering the conducting line with a generic, clear nail polish also works as effectively.
The synthesis and electrodeposition of iridium oxide was adapted from the protocols of Zea [43] and Marzouk [44]. The electrodeposition solution was prepared by combining 75 mg iridium (III) chloride hydrate, 0.5 mL 30% H2O2, and 250 mg oxalic acid dihydrate to 50 mL deionized water with 30 min intervals between each addition of reagent. The solution is then titrated with dry potassium carbonate until the pH reached 10.5. This solution was then allowed to age for 4 days wherein the solution turned from a yellow-green hue to a deep blue color. Prior to electrodeposition of the iridium oxide solution, the inkjet-printed Au electrode was electrochemically cleaned following the study of Fischer [45]. This was done by performing a cyclic potential scan (−0.4 to 1.4 V, 100 mV/s scan rate) in a dilute sulfuric acid solution (0.050 M). The electrodeposition solution was then galvanostatically electrodeposited onto cleaned inkjet-printed Au electrodes with 1 mA/cm2 of current for 10 min. The electrodeposited iridium oxide electrodes were then conditioned in a pH 7.00 buffer for 24 h.
To test the IrOx pH sensor using the 3D-RE, the electrodeposited iridium oxide electrode and reference electrode were immersed together in different pH buffers and the potential readings were acquired using a pH meter in the ORP mode (IrOx electrode connected to the signal terminal and Ag|AgCl electrode connected to the ground terminal of the BNC connector in the pH meter). The potential reading was allowed to stabilize, as indicated by a “Ready” indicator (~15 s of constant reading) in the pH meter before the value was recorded. Potential readings for the different pH buffers were compared to those recorded against a Ag|AgCl pRE and the commercial SCE.
Unless otherwise indicated, data are presented as the mean ± standard deviation.
3. Results and Discussion
3.1. Fabrication of 3D-RE
The method for fabricating the 3D-printed reference electrode (3D-RE) is illustrated in Figure 1a. Two main components of the reference electrode are 3D printed: the casing and the junction, while the other components are readily fixed into the assembled 3D-RE body. Since the 3D-RE was designed for application in aqueous samples, we selected ABS filament as our printing material because of its resistance to degradation during prolonged water exposure [46]. This is an important consideration since the 3D-RE is meant to be stored for extended periods of time in aqueous electrolyte solution. Other water-resistant filaments, such as PLA, can also be applied, although PLA has been shown to be more prone to pore and crack formation upon extended exposure to water [47]. An additional advantage of ABS filament is that 3D-printed objects can be postprocessed using well-established solvent treatment methods to smoothen and seal the surface [38], granting an additional means of control over the properties of the 3D-printed samples.
A cross-section of the 3D-RE showing the internal architecture of the electrode is shown in Figure 1b. A photograph of assembled 3D-REs is also shown in Figure 1c: a 3D-RE without a junction installed (Figure 1c(i)) reveals the internal structure of the electrode, which includes a Ag|AgCl wire and agar-KCl. This reference electrode structure maintains the basic operating principle of a macroscopic Ag|AgCl|Cl− reference electrode, which is based on the following half-cell reaction:
AgCl(s) + e− ⇌ Ag(s) + Cl−(aq)
The potential of the half-cell is determined by the Nernst equation,
where E° is the standard reduction potential, R is the universal gas constant, T is the absolute temperature, F is Faraday’s constant, and is the activity of the chloride ion in the electrolyte solution. Since the potential of the Ag|AgCl|Cl− electrode is dependent on chloride ion activity (3), traditional macroscopic reference electrodes contain an internal electrolyte of known chloride ion activity, which is separated from the sample solution with a porous junction. Like this basic electrode structure, the 3D-RE also contains an internal electrolyte, but in the form of a gel to improve robustness of the electrolyte layer. We selected agar as the gelling agent since it is low-cost, widely accessible, and has proven use in Ag|AgCl|Cl− reference electrodes [13,21,23,48]. Contact between the gel-KCl layer and the sample solution is limited through the 3D-printed porous junction, so the 3D-RE casing must be watertight to ensure that electrical contact is facilitated only through the porous junction. Thus, to fabricate the casing and junction with their contrasting property requirements, these components were 3D printed separately using different printing parameters and postprinting treatments, and then assembled into a single 3D-RE body.
3.1.1. Fabrication of 3D-RE Casing
Since the 3D-printed reference electrode (3D-RE) casing will be stored and applied in aqueous solutions, it is imperative that the walls of the casing exhibit minimal water absorption. FFF 3D-printed objects tend to be porous with gaps formed between print layers; nevertheless, printing parameters can be optimized to control porosity so that the 3D-RE casing is as watertight as possible [34,35,37]. In previous work by Gordeev et al., it was shown that the most significant parameter that affects the porosity of FFF 3D-printed objects is the extrusion ratio (k), or how much filament is fed through the nozzle [34]. A higher extrusion ratio results in an increased amount of filament exuded through the nozzle, which in turn leads to fewer air gaps between layers. Another parameter that affects porosity is layer height [35]. Previous work also showed that lower layer thicknesses resulted in fewer air gaps between print layers due to the tendency for the nozzle to compress the exuded filament to fill a smaller print volume, resulting in fewer voids [35,49]. With these factors in mind, we opted to print the 3D-RE casing with the lowest possible layer height on our 3D printer (0.18 mm) and with the highest possible extrusion ratio (k = 1.10) that can be used without observing sample shape deformation from excess filament [34].
Even with careful printing parameter selection, however, solution can still seep between the sample’s microcavities, potentially contaminating subsequent samples and degrading the lifetime of the object [36]. To further ensure that the 3D-RE casing is watertight, we applied acetone vapor smoothening as a surface treatment to seal the air gaps between print layers [38]. This method is a postprocessing technique used for FFF 3D-printed ABS objects in which acetone vapors are condensed on the surface of the 3D-printed object. The treatment results in the softening of the outer polymer layers, minor flow, and solidification of the polymer layers to form a surface with a smoother, less porous texture that also results in lower water absorption [38].
Figure 2 shows optical microscope images of 3D-printed samples before (a) and after (b) acetone vapor treatment. The layered texture that is characteristic of FFF 3D-printed objects (Figure 1a) is no longer observable after surface treatment, as evident in Figure 2b. Water absorption tests also showed that the sample without surface treatment exhibited a water adsorption of 1.84% ± 0.58% (n = 5), while the surface-treated sample did not increase in mass after prolonged sonication and immersion in water, suggesting no observable water absorption. Even after 1 week of immersion in water, the surface-treated sample did not exhibit observable water absorption and was therefore effectively watertight. This result indicates that acetone vapor smoothening can serve as an effective treatment for fabricating watertight compartments and accessories.
3.1.2. Fabrication of 3D-Printed Junction
The RE junction has the important role of limiting the diffusion of the chloride ion from the internal electrolyte layer while maintaining sufficient ionic conduction between the internal electrolyte and the sample. For miniaturized reference electrodes, even small amounts of chloride ion leakage can result in significant changes in chloride ion activity due to the small volume of the internal electrolyte layer. This decrease in internal electrolyte chloride ion activity results in a shift in RE potential towards more a positive potential, as indicated by Equation (3). The level of porosity in the RE junction should therefore sufficiently limit the diffusion of the chloride ion. However, there is a trade-off between minimizing chloride ion leakage and minimizing RE impedance. A junction of lower porosity can slow chloride ion diffusion, but this requires more restricted electrolyte flow, which in turn results in higher electrolyte resistance [23]. High RE impedance can result in potentiostat oscillation and/or overloads and noisy voltammograms [8]. It was therefore of interest in this work to control the porosity of the 3D-printed junction to sufficiently limit chloride ion leakage and to maintain an adequately low junction impedance for electroanalytical applications in aqueous solutions.
In contrast to the 3D-RE casing that was optimized for watertightness, the 3D-RE junction must be porous to a certain extent to permit electrical contact between electrolyte interfaces. Since we wanted to ensure that the junction was sufficiently porous, we explored a printing parameter set that would maximize porosity. Specifically, we limited the print layer height to 0.40 mm, which is the highest print layer height possible on our 3D printer, and started with a low extrusion ratio of k = 0.85. Extrusion ratios lower than 0.85 tended to be fragile to print and handle. In addition, since the porosity of FFF 3D-printed objects originates primarily from the gaps between the vertically stacked print layers, we printed the junction as a thin wall so that the vertically stacked layers served as the interface of the junction. The horizontal thickness of the junction wall was also set to two layers, which was the thinnest wall that we could print and handle robustly. We preferred a thin junction to maintain a compact form factor for the 3D-RE, and to ensure that there are fewer layers to transverse for ionic conduction.
To explore different levels of porosity, we varied the extrusion ratio to three different levels (k = 0.85, 0.95, and 1.05) while keeping the other parameters constant, as extrusion ratio has been reported to be the most significant factor affecting FFF 3D-printed specimen porosity given the same sample geometry [34]. As an initial study to characterize the 3D-printed junctions, we examined optical microscope images of the 3D-printed junctions fabricated with the same printing parameters but different extrusion ratios (k = 0.85, 0.95, and 1.05), as shown in Figure 3. While there appears to be no visible differences between the surfaces of the specimens printed with k = 0.95 and 1.05, samples printed with k = 0.85 exhibit observable gaps between print layers, which can be related to the decreased amount of filament exuded from the nozzle when printing each layer, resulting in some imperfections in the interlayer adhesion. We made a similar observation when we 3D printed the same specimens with different 3D printers and filaments (Figure S2). For the samples printed with k = 0.95 and 1.05, it is likely that they also present similar interlayer gaps, but at a smaller scale that is not visible at the current magnification range.
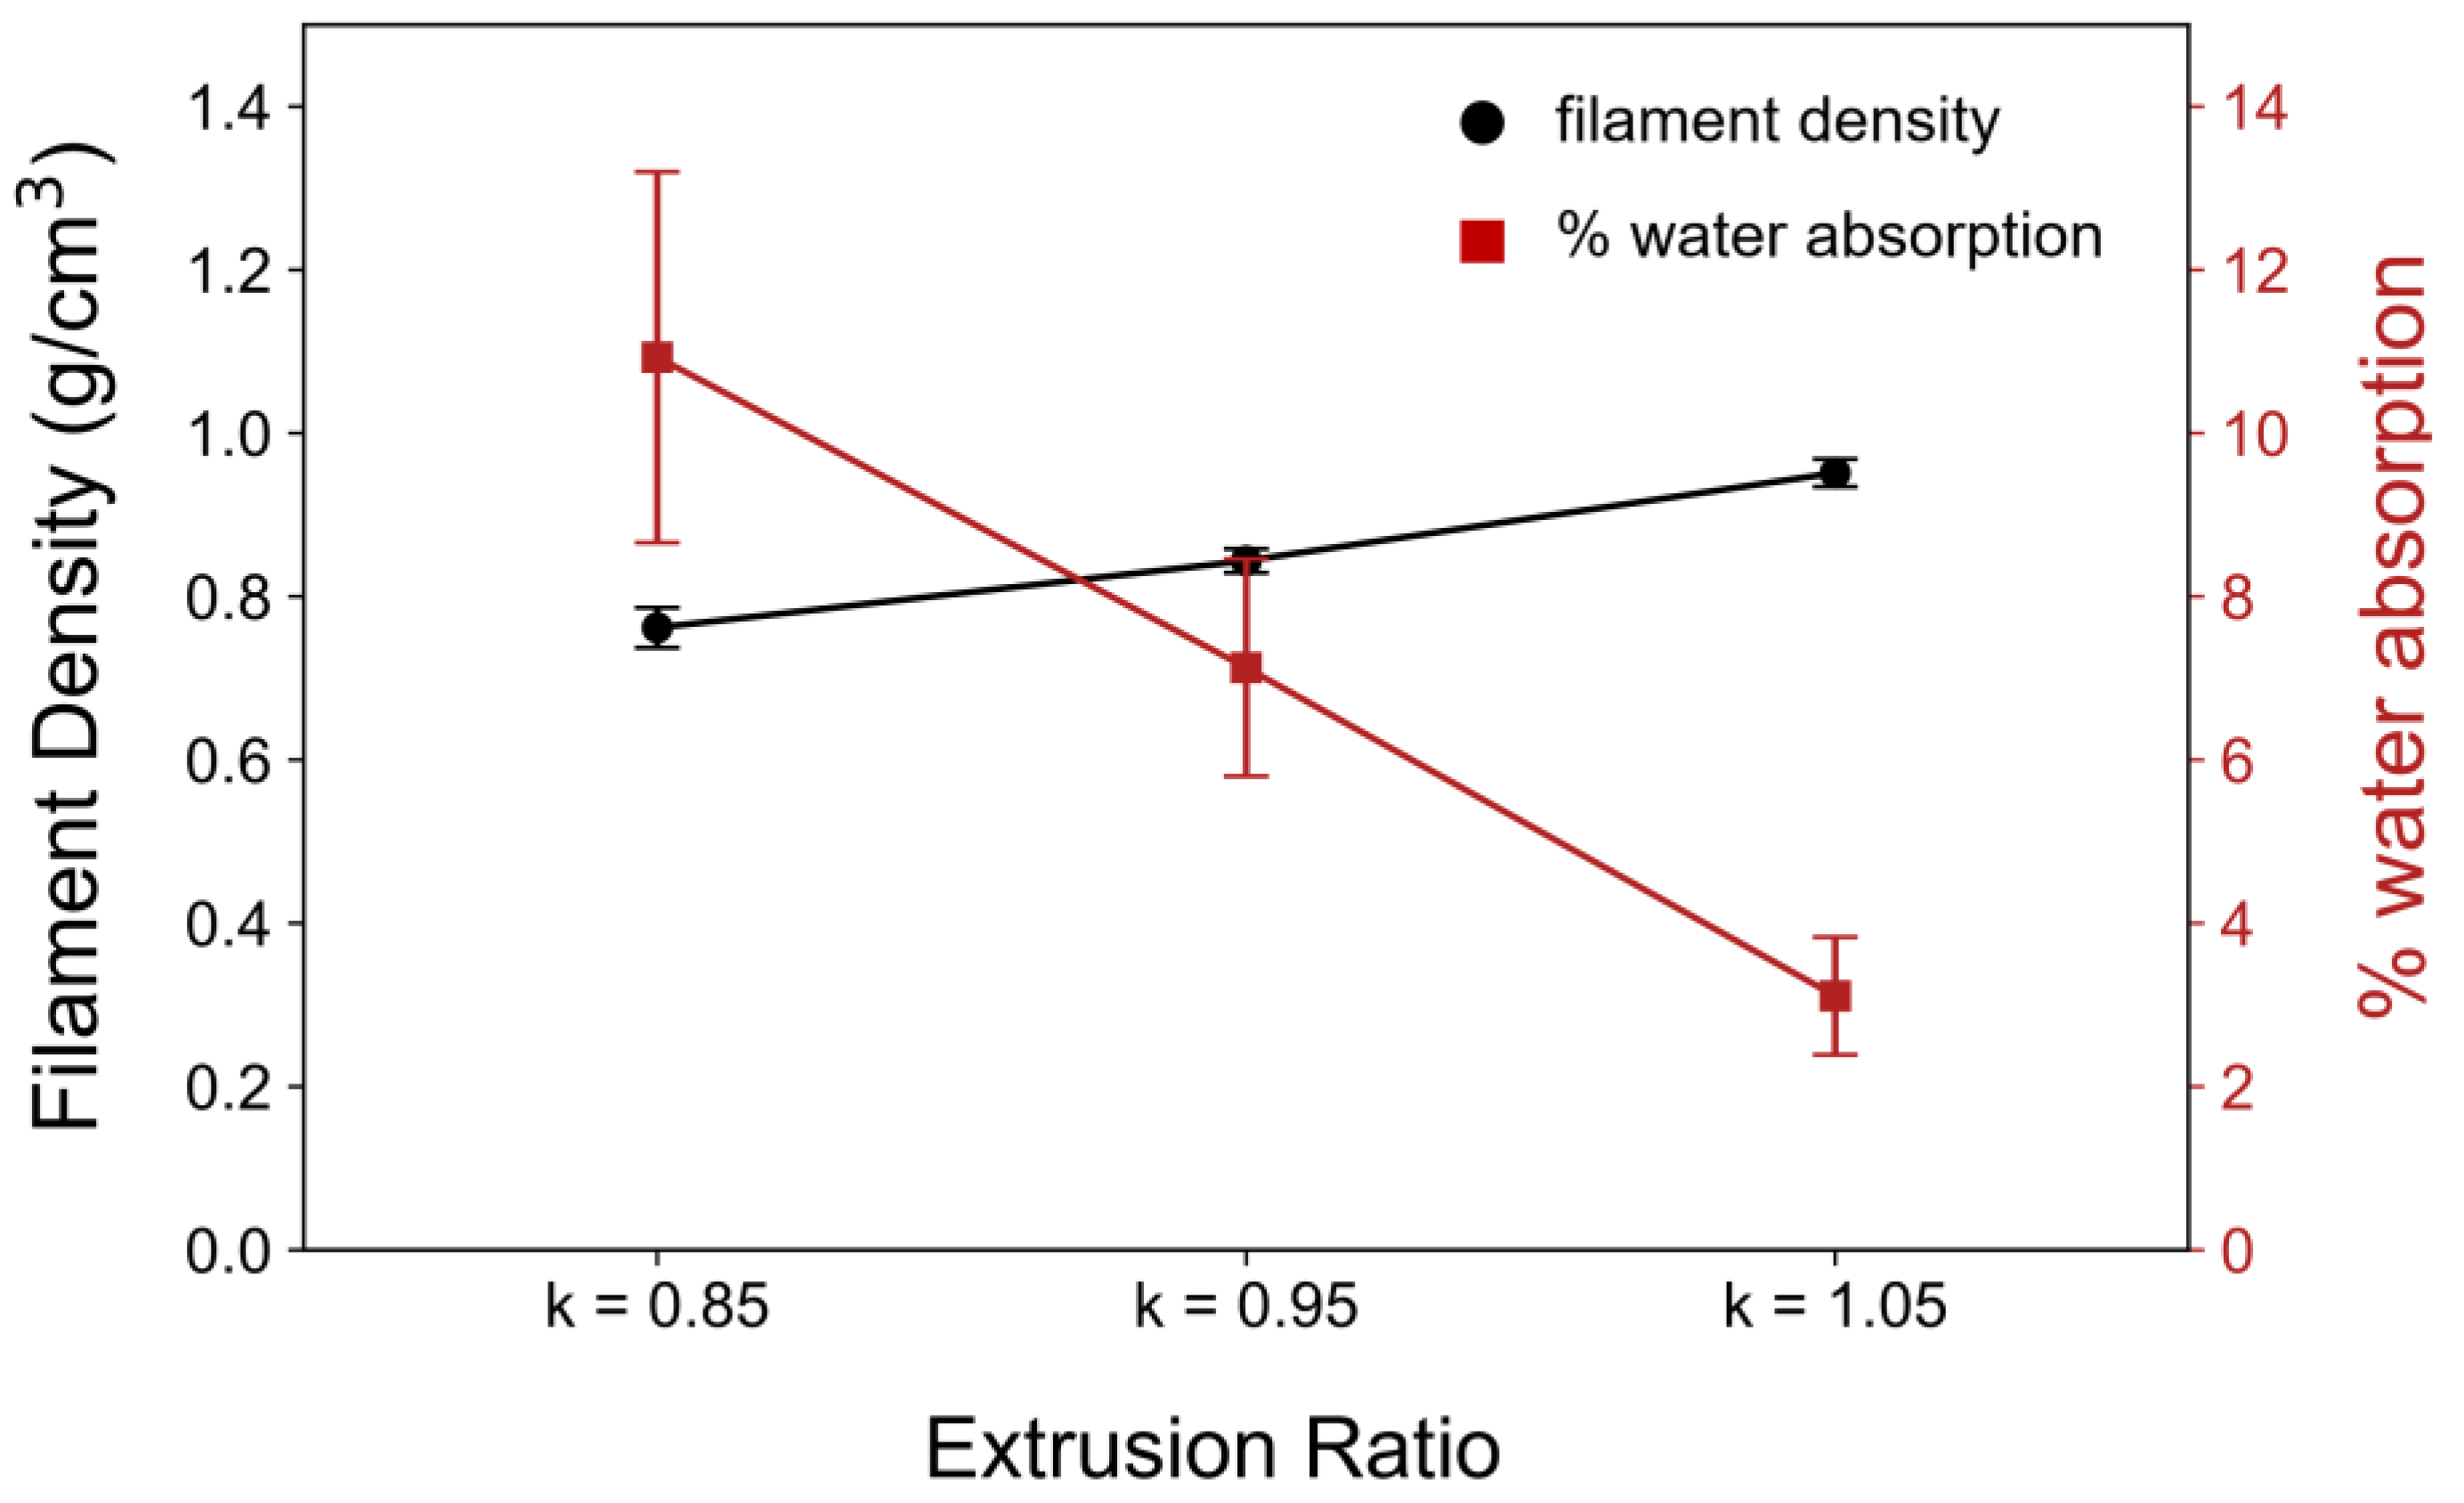
For further characterization, we estimated the junctions’ open porosities using the water absorption method, in which water is used to displace any air in the open pores of the sample of interest. Five replicate 3D-printed samples were evaluated per extrusion ratio. As expected, we observed decreased water absorption in samples 3D printed with increasing extrusion ratio, as plotted in Figure 4. Estimation of the filament density, which is the mass of filament used to 3D print a sample per unit volume of the sample model (7.0 mm × 7.5 mm × 0.8 mm) also shows that with higher extrusion ratio, more filament is used to fill the sample volume. Notably, measurements of filament density yielded relatively low % CV (percent coefficient of variation) at 1.74% to 3.22%, whereas measurements of water absorption exhibited high % CV of around 20% per case. These results suggest that the amount of filament deposited during 3D printing is reproducible even at different extrusion ratios, but the interlayer structure that gives rise to different levels of open porosity can exhibit greater deviation. The high deviation in the water absorption measurements may also be due to the variations in the accessibility of the pores to water displacement.
The possibility that trapped air in the 3D-printed junction could block ionic conduction pathways emphasizes the need to sufficiently displace entrapped air with electrolyte. Thus, prior to installation, junctions were sonicated in 3 M KCl, and the fully assembled electrodes were also conditioned for at least 24 h in same solution. To determine whether the open pores form continuous open pathways throughout the junction for sufficient electrolyte flow between solution interfaces in the 3D-RE and to optimize that level of electrolyte flow, we evaluated the electrochemical properties of the 3D-REs with various junctions installed, as described in the next subsection.
3.2. Optimization of 3D-RE Junction Porosity
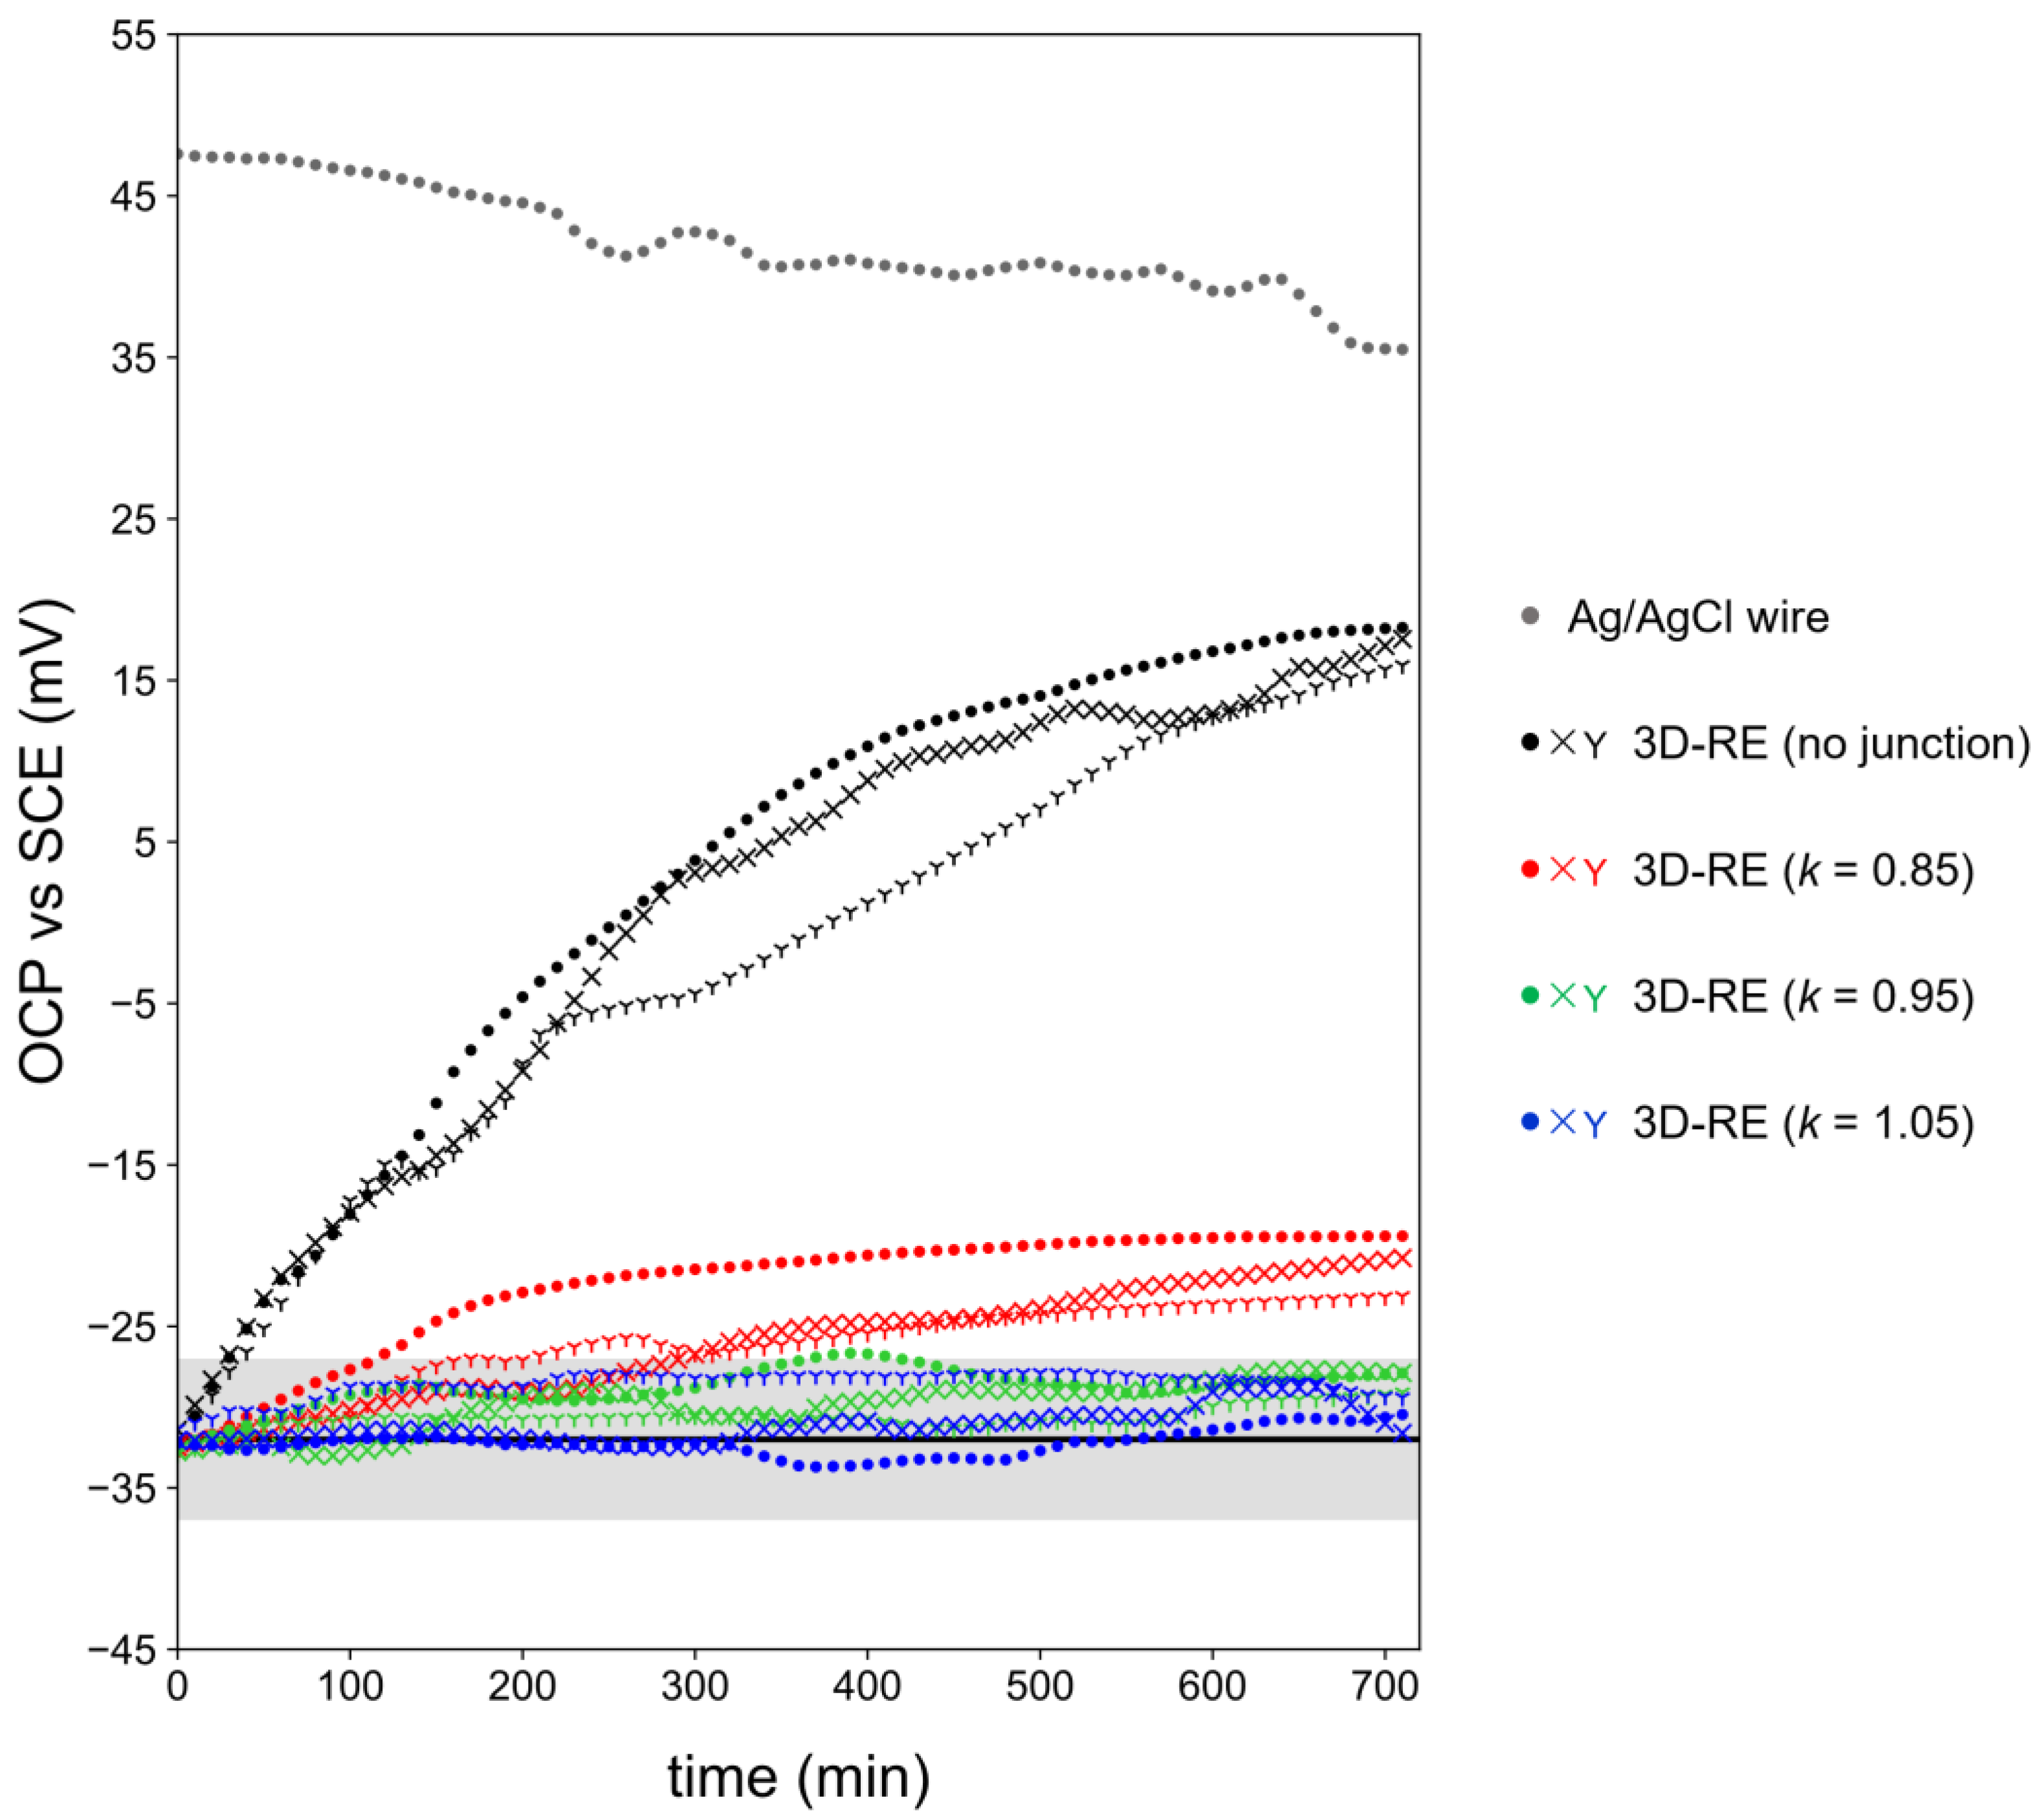
To determine the optimum 3D printing extrusion ratio of the 3D-printed porous junction, we fabricated reference electrodes with different junctions and evaluated their performance. For comparison, we also prepared a 3D-RE with no junction—that is, the gel electrolyte layer is in direct contact with the sample solution (Figure 1c(i)). We initially assessed the ability of each junction to slow chloride ion leakage by monitoring the open-circuit potential (OCP) of the 3D-RE versus a commercial SCE in 0.1 M KCl over a 12-h period. For short-term analyses, the potential drift of the RE should remain within ±2 mV within 5 min, and for more long-term applications, a potential drift within ±5 mV is acceptable [23]. Figure 5 shows the OCP vs. time of the 3D-REs. At the start, all of the 3D-REs exhibited OCPs of −32.6 ± 0.5 mV, which is consistent with the expected literature OCP of a Ag|AgCl|3 M KCl electrode vs. SCE [8]. Over time, however, the potentials of the 3D-REs increased. The 3D-RE without a junction exhibited the fastest increase in potential, which reflects the fast rate of chloride ion diffusion: potential drift exceeded 2 mV after 30 min and 5 mV after 40 min. Over a 12-h period, this RE exhibited a potential drift of 50.2 ± 1.2 mV. Addition of a junction led to improvements in potential stability. As expected, junctions 3D printed with higher extrusion ratios resulted in lower potential drifts due to decreased junction porosity. Over 12 h, the 3D-RE with a k = 0.85 junction exhibited a potential drift of 11.5 ± 2.3 mV, whereas the 3D-RE with a k = 0.95 junction exhibited an acceptable potential drift of 4.6 ± 0.5 mV. The electrode with a junction of k = 1.05 exhibited the highest potential stability with a potential drift of 1.4 ± 1.1 mV over a 12-h period of continuous measurement.
In Figure 5, we also show the OCP of a bare Ag|AgCl wire as a pseudo-reference electrode (pRE) for comparison. The Ag|AgCl wire is in direct contact with the 0.1 M KCl solution, so its equilibrium potential is related to the activity of the chloride ion in the sample solution. We note that the OCP of the Ag|AgCl wire tends to decrease with time due to the increased chloride ion activity in solution from the Cl− leakage from the SCE used during the experiment.
The second factor to optimize for the 3D-RE junction is RE impedance. Many potentiostat manufacturers recommend that the impedance of a reference electrode should not exceed 1 kΩ in order to minimize potentiostat oscillations and/or overloads [8,50,51]. A high reference electrode impedance can disturb the potentiostat’s negative feedback system that controls the potential between the reference and working electrodes by slowing its response rate and destabilizing the system towards oscillation [6,51]. Figure 6 shows the Bode plots of the different 3D-REs and a commercial SCE for comparison. The Bode plots of the complete set of electrode replicates are shown in Figure S3. For reference electrodes, the phase angle should be at or near 0° at high frequencies, and the impedance measured at this high frequency corresponds to the RE resistance [8]. As expected, the 3D-RE with no junction exhibited the lowest RE resistance at 114 ± 6 Ω since the gel electrolyte layer is in direct contact with the sample solution. 3D-REs with printed junctions demonstrate higher resistances that are consistent with their junction porosity: the observed RE resistance increased with decreased porosity in the expected order: Zk=0.85 < Zk=0.95 < Zk=1.05. The results are also consistent with the observed potential drifts: 3D-REs exhibiting lower potential drifts exhibit higher impedances. Thus, while the 3D-RE with a k = 1.05 junction exhibited the most stable potential, it also exhibited the highest RE resistance at 1.0 ± 0.2 kΩ, which exceeds the ideal limit for a reference electrode. The 3D-RE with k = 0.95, however, exhibited an acceptable potential drift of 4.6 ± 0.5 mV and an impedance of 0.50 ± 0.11 kΩ. This observed resistance is comparable to that of the commercial SCE, which has a measured resistance of 0.66 kΩ. We therefore selected k = 0.95 as the optimum 3D-printed junction printing parameter.
We also note that since the 3D-RE compartment and junction were fabricated separately and later joined together with ABS slurry, we tested a control to ensure that electrical contact between 3D-RE and sample solution was established primarily through the fabricated junction pores and not through defects between the compartment–junction joint. Our control consisted of a 3D-RE with an acetone vapor treated junction that is joined to the RE compartment in the same manner as the test 3D-REs. Since acetone vapor treatment seals the junction pores, any observed electrical contact between the RE and the sample solution would have to be due to any joint defects. However, upon application of the control 3D-RE as a reference electrode, we immediately observed potentiostat oscillations, suggesting excessively high RE resistance, indeed suggesting that electrical contact in the test 3D-RE was primarily due to the junction pores with negligible contribution from the joint between the compartment and junction.
While we were interested primarily in the high-frequency impedance of the reference electrodes to estimate their resistances, investigation of the low-frequency response can also yield interesting insights and notable limitations. A major difference between the 3D-RE and the commercial SCE is their respective phase shifts at lower frequencies. While the phase shift of the SCE is close to zero throughout the frequency range, the 3D-REs exhibit phase shifts of around −30° to −50° at low frequency. This difference in behavior can be attributed to the differences in internal electrolyte structure of the commercial SCE and the 3D-RE. While the SCE has an aqueous inner electrolyte, the 3D-RE’s electrolyte is trapped in agar, so ions in the 3D-RE have lower mobilities [52]. Thus, the 3D-RE inner gel electrolyte structure exhibits more significant capacitive and diffusional control in its electrode impedance at low frequencies [23]. Our EIS results are similar to those reported by Hassel et al., who compared the spectra of a commercial Ag|AgCl|Cl− electrode to that of a capillary agar-based Ag|AgCl|Cl− electrode. While the impedance of the commercial RE was mostly frequency-independent, the agar-based RE exhibited a low-frequency phase shift of −25° [48]. Since the 3D-RE exhibits phase shifts at lower frequencies, use of the 3D-RE as a RE for impedance measurements at these frequencies may result in artifacts in the spectra [48]. Nevertheless, since the 3D-RE exhibits near-ideal frequency-independent behavior at a localized frequency range (103–105 Hz), the 3D-RE may be applied as an RE at this range [23,48,53].
3.3. Characterization of Optimized 3D-RE
The optimized 3D-RE with a junction printed with k = 0.95 was further studied for its long-term potential stability. Figure 7 shows the daily measurement of OCP vs. SCE of three 3D-REs (represented by different symbols) over a period of 30 days in 0.1 M KCl. Results indicate that the electrodes can maintain a potential within ±5 mV for at least 30 days when the electrode is properly stored in a maintaining 3 M KCl solution. Regular calibration can account for the small potential shifts for more accurate analyses. Further studies can be done to assess longer shelf-life stability of the 3D-RE.
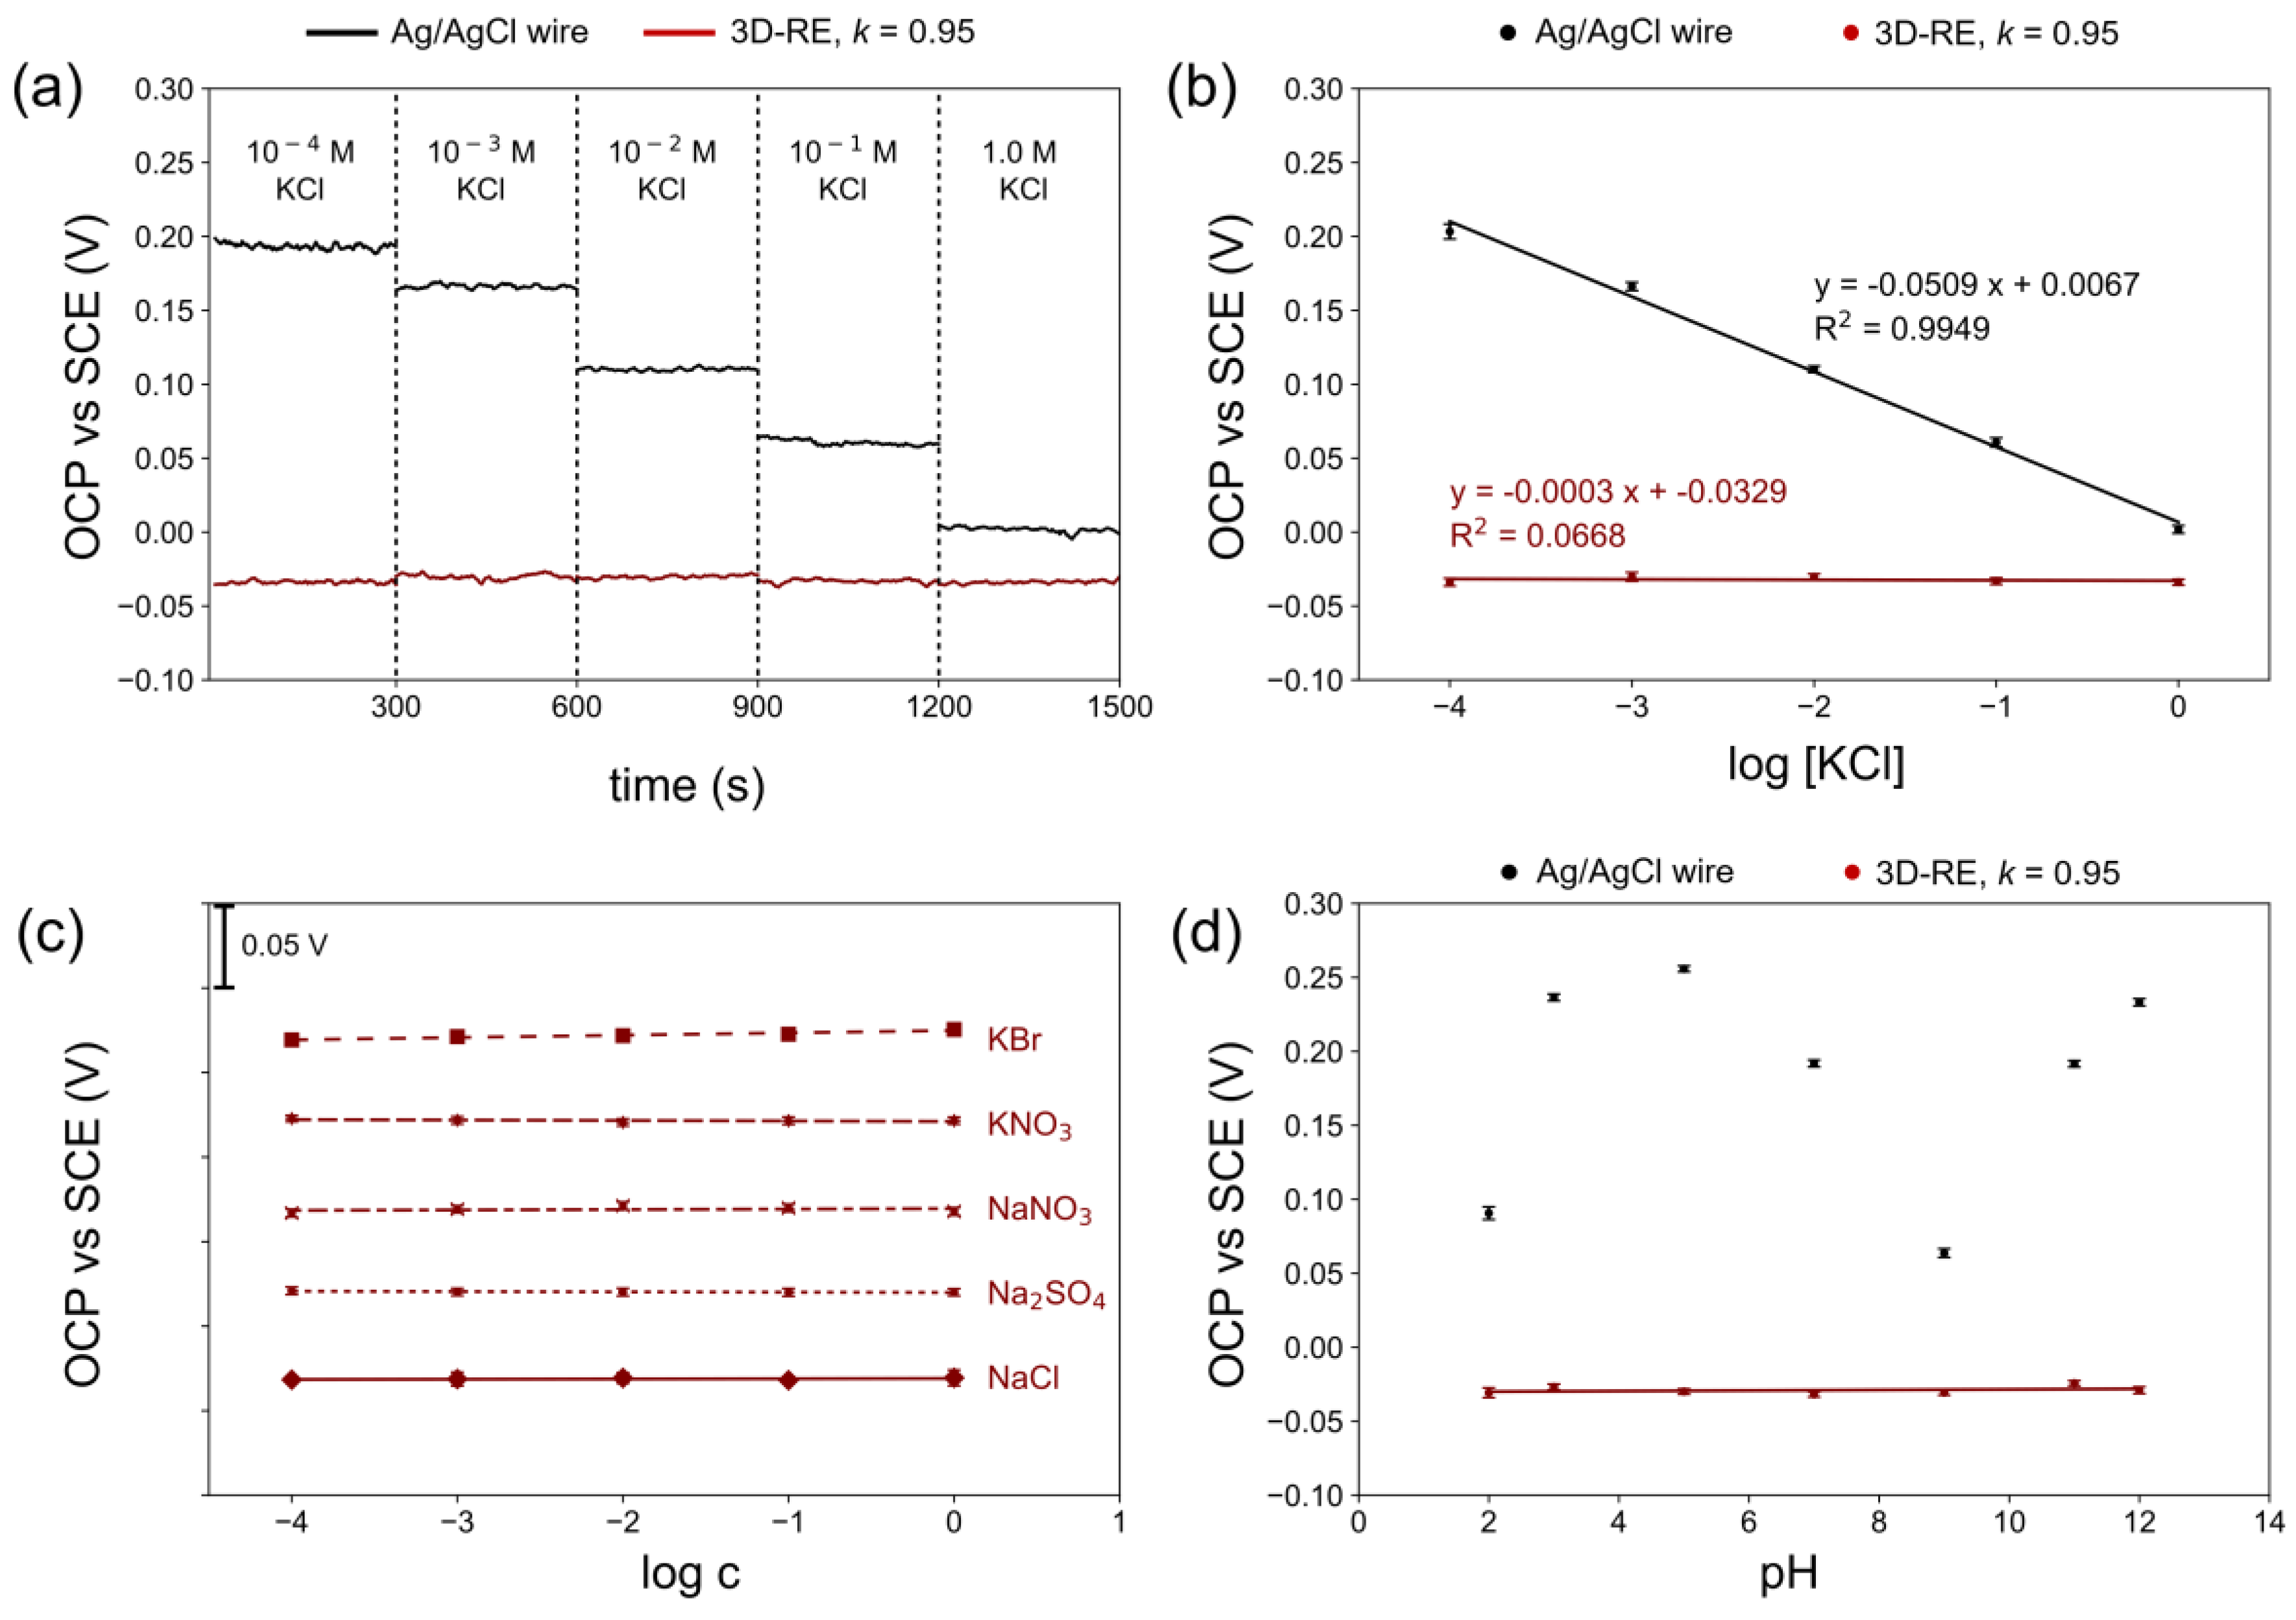
The ability of a reference electrode to maintain a constant potential regardless of the sample matrix is an important property to consider. To assess the potential stability of the 3D-RE in different matrices, we monitored the potential of the 3D-RE and Ag|AgCl pRE while immersed in a range of concentrations (10−4 to 1 M) of various electrolytes. Figure 8a shows the potential of the 3D-RE and Ag|AgCl pRE over time with increases in KCl concentration after every 5 min. With changes in solution chloride ion activity, the potential of the pRE decreases while the potential of the 3D-RE remains constant and dependent only on the chloride ion activity of its gel electrolyte layer. Figure 8b converts the potential response of the 3D-RE and pRE as a function of the logarithm of KCl concentration. Here, the Ag|AgCl pRE demonstrates Nernstian behavior, as it now essentially behaves as an indicator electrode of the second kind due to its sensitivity to Cl− activity.
Similar experiments were conducted with different electrolyte solutions (NaCl, NaNO3, KNO3, Na2SO4, KBr) and solutions at different pH levels. Figure 8c shows the Nernst plots of the potential response of the 3D-RE in different concentrations of the respective electrolyte. For clarity, each plot was offset by multiples of 0.05 V to prevent plot overlaps. The Nernst plots demonstrate the stability of the 3D-RE potential to different electrolyte solutions. Complete Nernst plots and equations for both the 3D-RE and Ag|AgCl pRE in each electrolyte solution are shown in Figure S4. Figure 8d shows the potential response of the 3D-RE and the Ag|AgCl pRE in solutions adjusted to a wide range of pH levels. While the pRE potential varies significantly, the 3D-RE demonstrates a stable potential regardless of solution pH. These results demonstrate the suitability of the 3D-RE over a pRE to serve as a reference electrode in applications that deal with samples of variable matrices.
3.4. Application of Optimized 3D-RE
To test the performance of the optimized 3D-RE for electroanalytical applications, the 3D-RE was applied as the RE in the cyclic voltammetry of a redox couple standard, as well as the RE in potentiometric pH measurements.
Figure 9 shows the voltammograms of 4 mM ferricyanide in 0.1 M KCl using the 3D-RE as a reference electrode. Voltammograms recorded using the commercial SCE and Ag|AgCl wire pRE are also shown for comparison. The observed difference between the cathodic peak potentials (Epc) in the voltammograms recorded using the SCE and the 3D-RE is −32.7 ± 0.9 mV, which is consistent with the measured OCP vs. SCE of the 3D-RE in 0.1 M KCl. This suggests that the potential of the 3D-RE remains insensitive to the presence of a redox couple in solution such as ferro-/ferricyanide. The difference between peak potentials observed for the SCE and the Ag|AgCl pRE, on the other hand, is 92.5 ± 2.9 mV, which is much higher than the observed OCP vs. SCE of the pRE in 0.1 M KCl (see Figure 5). The difference between the expected potentials may be due to the sensitivity of the pRE to the presence of the redox couple in solution.
Figure 10 shows the potential responses of the IrOx|Au electrode measured against the 3D-RE, Ag|AgCl pRE, or commercial SCE when immersed in various standard pH buffers. The IrOx|Au pH sensor demonstrated linear super-Nernstian response when measured against a commercial SCE (Figure 10a). The linear super-Nernstian response coincides well with most literature data, which report sensitivity levels of −80 to −70 mV/pH [43,54,55,56] and consistently high R2 (> 0.99) [54,55,56] for IrOx-based pH sensors coupled with true reference electrodes. In contrast, the IrOx|Au electrode response measured against a Ag|AgCl pRE demonstrated sub-Nernstian response with poorer linearity (Figure 10b), which can be attributed to the potential instability of the pRE when exposed to the different standard pH buffers. This result agrees with the data collected by Huang et al. (R2 ~ 0.95 and sensitivity of ~51 mV/pH) [57], wherein they used an evaporated silver and electrochemically anodized silver chloride as an Ag|AgCl pseudo-reference electrode for their flexible IrOx-based pH sensor. This result highlights the importance of using a stable reference electrode: the performance of a good indicator electrode can be limited by the performance of the reference electrode.
Finally, when the response of the IrOx|Au electrode was measured against the 3D-RE, the system exhibited a linear super-Nernstian response (Figure 10c) that is highly comparable to the sensor response when measured against the commercial SCE. The responses using the different reference electrodes are only offset by a constant potential that corresponds to the difference in potentials between the SCE and 3D-RE. Unlike the Ag|AgCl pRE, the 3D-RE exhibits a stable potential that makes it promising for use as reference electrode for potentiometric sensor measurements.
3.5. Outlook
The 3D-RE can be readily customized to suit the application of interest. The 3D-RE casing, for example, can be incorporated into a watertight 3D-printed electrochemical cell along with other 3D-printed electrodes for an all-in-one, fully integrated system. Other shapes and sizes can also be adapted. Most commercial 3D printers have sufficient resolution to fabricate 3D-RE casings as small as 3 mm × 3 mm × 3 mm, but the minimum size that the 3D-RE can adapt is limited by other considerations such as the volume of the gel electrolyte. The potential stability of 3D-REs with smaller form factors may be negatively affected by a smaller volume of the gel electrolyte, which becomes more sensitive to chloride ion leakage due to the limited supply of chloride ion [23]. Previous work by Huang et al. studied the effect of different volumes of gel-KCl on the potential stability of packaged Ag|AgCl|gel-KCl reference electrodes and found that a volume of at least 3.39 µL can yield a stable potential over 30,000 s [23]. On the other hand, if an even smaller form factor is desired, the trade-off to consider is whether the expected lower potential stability is tolerable for the target application.
The 3D-RE in this work was designed for use in aqueous solutions. For applications that involve organic solvents, however, the current 3D-RE setup may not be compatible because the 3D-printed ABS components can decompose or dissolve when exposed to organic solvents such as acetonitrile, methanol, and dimethyl sulfoxide [46,58]. The current gel electrolyte layer is also aqueous-based with KCl as the electrolyte, so factors such solvent cross-contamination and the differences in KCl solubility and mobility in the organic solvent should be considered [8,59]. The 3D-RE can be adapted for use in organic solvents by changing the 3D printing material and modifying the gel electrolyte layer. Nylon, for example, is a possible FFF 3D printing filament that has excellent stability in many organic solvents [46,60]. To further improve compatibility, the gel electrolyte layer can also be modified using an electrolyte that is also soluble in the organic solvent of interest [8,59]. An alternative strategy to adapt aqueous-based reference electrode for use in organic solvents is to use a double junction filled with electrolyte with near-equal mobilities in both the aqueous and nonaqueous solvents [8,59]. Using a solvent-compatible filament, a double junction can be readily 3D printed.
The current 3D-RE fabrication method involves multiple 3D-printed parts that need to be processed and assembled. To simplify the fabrication, an interesting avenue to explore for future studies is to 3D print a porous body that serves as both the casing and the junction. Here, the internal gel electrolyte is housed in a porous casing, and electrolyte flow between the internal electrolyte and sample solution can occur through all walls of the porous body. In this design, the porosity of the casing should be adjusted to ensure that excessive chloride ion leakage is avoided since electrolyte can now leak out from all walls of the 3D-RE body. This simplified fabrication strategy can also make it easier to design and fabricate more complex reference electrode structures, such as a double-junction electrode. The flexibility and capability of 3D printing for customization and rapid prototyping opens many possible design modifications to the basic architecture of the 3D-RE described in this work.
4. Conclusions
In this work, we have demonstrated one of the first successful fabrications of a true 3D-printed Ag|AgCl|Cl− reference electrode that exhibits low impedance and potential stability in various sample matrices. The novel feature of our reference electrode is the 3D-printed porous junction, which serves to bridge the internal gel electrolyte layer and the sample solution, and to protect the internal gel electrolyte layer from sample contamination and chloride ion leakage. Here, we utilized the porous property of FFF-printed objects that is typically viewed as a defect and tuned this property to serve a key function in our fabricated reference electrode. The assembly of the miniaturized reference electrode is simple and low-cost, and it requires commonly encountered laboratory materials. The reference electrode casing and junction can also be readily fabricated in less than 10 min using a commercial desktop 3D printer and commercially available ABS filament. The developed 3D-printed reference electrode has the potential to be readily fabricated on demand to serve as a reference for use in traditional laboratory-based electrochemical analyses or as an integrated reference in 3D-printed electrochemical sensor systems. It is our aim that our simple but elegant approach to fabricating a true reference electrode can broaden the application of 3D-printed electrochemical sensor systems to more complex samples that require a stable, matrix-independent reference electrode potential.
Supplementary Materials
The following are available online at https://0-www-mdpi-com.brum.beds.ac.uk/2227-9040/8/4/130/s1, Figure S1: Photographs of inkjet-printed gold electrodes (a) before and (b) after IrOx electrodeposition, Figure S2: Optical microscope images of 3D-printed junctions fabricated with 0.40 mm layer height and extrusion ratios k = 0.85, 0.95, or 1.05 using different 3D-printers and polymer filaments, Figure S3: Bode plots of 3D-REs fabricated in three different batches (each replicate shown in either red, green, or blue) with (a) no junction, (b) 3D-printed junction with k = 0.85, (c) 3D-printed junction with k = 0.95, and (d) 3D-printed junction with k = 1.05. For reference, the bode plot of a commercial SCE (in grey) is also included in each plot. Impedance spectra were recorded in 0.1 M KCl, Figure S4: Nernst plots showing Ag|AgCl pseudoreference electrode and 3D-RE OCP dependence on the logarithm of concentration of different electrolytes or pH conditions.
Author Contributions
Conceptualization: S.M.S.-T. and E.P.E.; methodology: S.M.S.-T. and L.P.G.; investigation: S.M.S.-T. and L.P.G.; software: S.M.S.-T.; validation: S.M.S.-T.; formal analysis: S.M.S.-T., L.P.G., and E.P.E.; data curation: S.M.S.-T. and L.P.G.; visualization: S.M.S.-T. and L.P.G.; writing—original draft: S.M.S.-T. and L.P.G.; writing—review and editing: S.M.S.-T., L.P.G., and E.P.E.; supervision: E.P.E.; resources: E.P.E.; project administration: E.P.E.; funding acquisition: E.P.E. All authors have read and agreed to the published version of the manuscript.
Funding
This research was funded by the Philippine Commission for Higher Education’s Philippine-California Advanced Research Institutes Project (CHED-PCARI, Grant No. IIID58) and the School of Science and Engineering at the Ateneo de Manila University. The authors also acknowledge support for publication costs from the Rizal Library Open Access Journal Publication Grant.
Acknowledgments
The authors thank Gilbert Yu for lending his lab’s Gamry potentiostat. The authors would also like to thank the Arete Makerspace and the Department of Electronics, Computer, and Communications Engineering of Ateneo de Manila University for lending their 3D printers to print additional 3D-printed porous junctions. The authors also acknowledge Ralph Joseph Adarlo and Mark Anthony Luzano for their assistance in using the 3D printers.
Conflicts of Interest
The authors declare no conflict of interest.
References
- Dincer, C.; Bruch, R.; Costa-Rama, E.; Fernández-Abedul, M.T.; Merkoçi, A.; Manz, A.; Urban, G.A.; Güder, F. Disposable Sensors in Diagnostics, Food, and Environmental Monitoring. Adv. Mater. 2019, 31. [Google Scholar] [CrossRef]
- Zhang, W.; Wang, R.; Luo, F.; Wang, P.; Lin, Z. Miniaturized electrochemical sensors and their point-of-care applications. Chin. Chem. Lett. 2020, 31, 589–600. [Google Scholar] [CrossRef]
- Ambrosi, A.; Pumera, M. 3D-printing technologies for electrochemical applications. Chem. Soc. Rev. 2016, 45, 2740–2755. [Google Scholar] [CrossRef] [PubMed] [Green Version]
- Cardoso, R.M.; Mendonça, D.M.H.; Silva, W.P.; Silva, M.N.T.; Nossol, E.; da Silva, R.A.B.; Richter, E.M.; Muñoz, R.A.A. 3D printing for electroanalysis: From multiuse electrochemical cells to sensors. Anal. Chim. Acta 2018, 1033, 49–57. [Google Scholar] [CrossRef]
- O’Neil, G.D. Toward single-step production of functional electrochemical devices using 3D printing: Progress, challenges, and opportunities. Curr. Opin. Electrochem. 2020, 20, 60–65. [Google Scholar] [CrossRef]
- Bard, A.J.; Faulkner, L.R. Electrochemical Methods: Fundamentals and Applications; Wiley: New York, NY, USA, 2012; Volume 2, ISBN 9780123813749. [Google Scholar]
- Waleed Shinwari, M.; Zhitomirsky, D.; Deen, I.A.; Selvaganapathy, P.R.; Jamal Deen, M.; Landheer, D. Microfabricated reference electrodes and their biosensing applications. Sensors 2010, 10, 1679–1715. [Google Scholar]
- Smith, T.J.; Stevenson, K.J. Reference electrodes. In Handbook of Electrochemistry; Zoski, C.G., Ed.; Elsevier: Amsterdam, The Netherlands, 2007; ISBN 9780444519580. [Google Scholar]
- Sophocleous, M.; Atkinson, J.K. A review of screen-printed silver/silver chloride (Ag/AgCl) reference electrodes potentially suitable for environmental potentiometric sensors. Sens. Actuators A Phys. 2017, 267, 106–120. [Google Scholar] [CrossRef] [Green Version]
- Da Silva, E.T.S.G.; Miserere, S.; Kubota, L.T.; Merkoçi, A. Simple on-plastic/paper inkjet-printed solid-state Ag/AgCl pseudoreference electrode. Anal. Chem. 2014, 86, 10531–10534. [Google Scholar] [CrossRef]
- Rohaizad, N.; Mayorga-Martinez, C.C.; Novotný, F.; Webster, R.D.; Pumera, M. 3D-printed Ag/AgCl pseudo-reference electrodes. Electrochem. Commun. 2019, 103, 104–108. [Google Scholar] [CrossRef]
- Inzelt, G.; Lewenstam, A.; Scholz, F. Pseudo-reference Electrodes. In Handbook of Reference Electrodes; Springer: Berlin/Heidelberg, Germany, 2013; pp. 331–332. [Google Scholar] [CrossRef]
- Huang, I.-Y.; Huang, R.S. Fabrication and characterization of a new planar solid-state reference electrode for ISFET sensors. Thin Solid Films 2002, 406, 255–261. [Google Scholar] [CrossRef]
- Smith, R.L.; Scott, D.C. An Integrated Sensor for Electrochemical Measurements. IEEE Trans. Biomed. Eng. 1986, BME-33, 83–90. [Google Scholar] [CrossRef]
- Suzuki, H.; Hirakawa, T.; Sasaki, S.; Karube, I. Micromachined liquid-junction Ag/AgCl reference electrode. Sens. Actuators B Chem. 1998, 46, 146–154. [Google Scholar] [CrossRef]
- Criscuolo, F.; Galfione, M.; Carrara, S.; De Micheli, G. All-solid-state Reference Electrodes for analytical applications. In Proceedings of the 2019 8th International Workshop Advances Sensors Interfaces, IWASI, Otranto, Italy, 13–14 June 2019; pp. 66–69. [Google Scholar] [CrossRef]
- Guth, U.; Gerlach, F.; Decker, M.; Oelßner, W.; Vonau, W. Solid-state reference electrodes for potentiometric sensors. J. Solid State Electrochem. 2009, 13, 27–39. [Google Scholar] [CrossRef]
- Lingenfelter, P.; Bartoszewicz, B.; Migdalski, J.; Sokalski, T.; Bućko, M.M.; Filipek, R.; Lewenstam, A. Reference electrodes with polymer-based membranes—Comprehensive performance characteristics. Membranes 2019, 9, 161. [Google Scholar] [CrossRef] [Green Version]
- Guinovart, T.; Crespo, G.A.; Rius, F.X.; Andrade, F.J. A reference electrode based on polyvinyl butyral (PVB) polymer for decentralized chemical measurements. Anal. Chim. Acta 2014, 821, 72–80. [Google Scholar] [CrossRef]
- Bananezhad, A.; Jović, M.; Villalobos, L.F.; Agrawal, K.V.; Ganjali, M.R.; Girault, H.H. Large-scale fabrication of flexible solid-state reference electrodes. J. Electroanal. Chem. 2019, 847, 113241. [Google Scholar] [CrossRef]
- Liao, W.Y.; Chou, T.C. Fabrication of a planar-form screen-printed solid electrolyte modified Ag/AgCl reference electrode for application in a potentiometric biosensor. Anal. Chem. 2006, 78, 4219–4223. [Google Scholar] [CrossRef]
- Zhou, B.; Bian, C.; Tong, J.; Xia, S. Fabrication of a miniature multi-parameter sensor chip for water quality assessment. Sensors 2017, 17, 157. [Google Scholar] [CrossRef] [Green Version]
- Huang, I.-Y.; Wang, S.-H.; Chu, C.-C.; Chiu, C.-T. Improved solid-state planar Ti/Pd/Ag/AgCl/KCl-gel microreference electrode by silicon cap sealing package. J. Micro/Nanolithography MEMS MOEMS 2009, 8, 033050. [Google Scholar] [CrossRef]
- Cardoso, R.M.; Kalinke, C.; Rocha, R.G.; dos Santos, P.L.; Rocha, D.P.; Oliveira, P.R.; Janegitz, B.C.; Bonacin, J.A.; Richter, E.M.; Munoz, R.A.A. Additive-manufactured (3D-printed) electrochemical sensors: A critical review. Anal. Chim. Acta 2020, 1118. [Google Scholar] [CrossRef]
- O’Neil, G.D.; Ahmed, S.; Halloran, K.; Janusz, J.N.; Rodríguez, A.; Terrero Rodríguez, I.M. Single-step fabrication of electrochemical flow cells utilizing multi-material 3D printing. Electrochem. Commun. 2019, 99, 56–60. [Google Scholar] [CrossRef]
- Katseli, V.; Economou, A.; Kokkinos, C. Single-step fabrication of an integrated 3D-printed device for electrochemical sensing applications. Electrochem. Commun. 2019, 103, 100–103. [Google Scholar] [CrossRef]
- Katseli, V.; Thomaidis, N.; Economou, A.; Kokkinos, C. Miniature 3D-printed integrated electrochemical cell for trace voltammetric Hg(II) determination. Sens. Actuators B Chem. 2020, 308, 127715. [Google Scholar] [CrossRef]
- Katseli, V.; Economou, A.; Kokkinos, C. A novel all-3D-printed cell-on-a-chip device as a useful electroanalytical tool: Application to the simultaneous voltammetric determination of caffeine and paracetamol. Talanta 2020, 208, 120388. [Google Scholar] [CrossRef]
- Walgama, C.; Nguyen, M.P.; Boatner, L.M.; Richards, I.; Crooks, R.M. Hybrid paper and 3D-printed microfluidic device for electrochemical detection of Ag nanoparticle labels. Lab Chip 2020. [Google Scholar] [CrossRef]
- João, A.F.; Squissato, A.L.; Richter, E.M.; Muñoz, R.A.A. Additive-manufactured sensors for biofuel analysis: Copper determination in bioethanol using a 3D-printed carbon black/polylactic electrode. Anal. Bioanal. Chem. 2020, 2755–2762. [Google Scholar] [CrossRef] [Green Version]
- Rocha, D.P.; Squissato, A.L.; da Silva, S.M.; Richter, E.M.; Munoz, R.A.A. Improved electrochemical detection of metals in biological samples using 3D-printed electrode: Chemical/electrochemical treatment exposes carbon-black conductive sites. Electrochim. Acta 2020, 335, 1–11. [Google Scholar] [CrossRef]
- Richter, E.M.; Rocha, D.P.; Cardoso, R.M.; Keefe, E.M.; Foster, C.W.; Munoz, R.A.A.; Banks, C.E. Complete Additively Manufactured (3D-Printed) Electrochemical Sensing Platform. Anal. Chem. 2019, 91, 12844–12851. [Google Scholar] [CrossRef]
- Lewenstam, A.; Bartoszewicz, B.; Migdalski, J.; Kochan, A. Solid contact reference electrode with a PVC-based composite electroactive element fabricated by 3D printing. Electrochem. Commun. 2019, 109, 106613. [Google Scholar] [CrossRef]
- Gordeev, E.G.; Galushko, A.S.; Ananikov, V.P. Improvement of quality of 3D printed objects by elimination of microscopic structural defects in fused deposition modeling. PLoS ONE 2018, 13. [Google Scholar] [CrossRef]
- Habeeb, H.A.; Alkahari, M.R.; Ramli, F.R.; Hasan, R.; Maidin, S. Strength and porosity of additively manufactured PLA using a low cost 3D printing. In Proceedings of the Mechanical Engineering Research Day, Melaka, Malaysia, 31 March 2016; Volume 1, pp. 69–70. [Google Scholar]
- McCullough, E.J.; Yadavalli, V.K. Surface modification of fused deposition modeling ABS to enable rapid prototyping of biomedical microdevices. J. Mater. Process. Technol. 2013, 213, 947–954. [Google Scholar] [CrossRef]
- Garg, A.; Bhattacharya, A.; Batish, A. On Surface Finish and Dimensional Accuracy of FDM Parts after Cold Vapor Treatment. Mater. Manuf. Process. 2016, 31, 522–529. [Google Scholar] [CrossRef]
- Garg, A.; Bhattacharya, A.; Batish, A. Chemical vapor treatment of ABS parts built by FDM: Analysis of surface finish and mechanical strength. Int. J. Adv. Manuf. Technol. 2017, 89, 2175–2191. [Google Scholar] [CrossRef]
- Leite, M.; Varanda, A.; Ribeiro, A.R.; Silva, A.; Vaz, M.F. Mechanical properties and water absorption of surface modified ABS 3D printed by fused deposition modelling. Rapid Prototyp. J. 2018, 24, 195–203. [Google Scholar] [CrossRef]
- Savitzky, A.; Golay, M.J.E. Smoothing and Differentiation of Data by Simplified Least Squares Procedures. Anal. Chem. 1964. [Google Scholar] [CrossRef]
- Warner Instruments: Chloriding Ag/AgCl Electrodes. Available online: https://www.warneronline.com/sites/default/files/2018-09/Chloriding%20Ag-AgCl%20electrodes%20%28090728%29.pdf (accessed on 4 January 2020).
- Bacalzo, N.P.; Go, L.P.; Querebillo, C.J.; Hildebrandt, P.; Limpoco, F.T.; Enriquez, E.P. Controlled Microwave-Hydrolyzed Starch as a Stabilizer for Green Formulation of Aqueous Gold Nanoparticle Ink for Flexible Printed Electronics. ACS Appl. Nano Mater. 2018, 1, 1247–1256. [Google Scholar] [CrossRef]
- Zea, M.; Moya, A.; Fritsch, M.; Ramon, E.; Villa, R.; Gabriel, G. Enhanced Performance Stability of Iridium Oxide-Based pH Sensors Fabricated on Rough Inkjet-Printed Platinum. ACS Appl. Mater. Interfaces 2019. [Google Scholar] [CrossRef]
- Marzouk, S.A.M.; Ufer, S.; Buck, R.P.; Johnson, T.A.; Dunlap, L.A.; Cascio, W.E. Electrodeposited iridium oxide pH electrode for measurement of extracellular myocardial acidosis during acute ischemia. Anal. Chem. 1998. [Google Scholar] [CrossRef]
- Fischer, L.M.; Tenje, M.; Heiskanen, A.R.; Masuda, N.; Castillo, J.; Bentien, A.; Émneus, J.; Jakobsen, M.H.; Boisen, A. Gold cleaning methods for electrochemical detection applications. Microelectron. Eng. 2009, 86, 1282–1285. [Google Scholar] [CrossRef]
- Erokhin, K.S.; Gordeev, E.G.; Ananikov, V.P. Revealing interactions of layered polymeric materials at solid-liquid interface for building solvent compatibility charts for 3D printing applications. Sci. Rep. 2019, 9, 1–14. [Google Scholar] [CrossRef]
- Tang, T.O.; Simon, G.P. Biodegradation of 3D-printed polylactic acid milliprojections under physiological conditions. J. Appl. Polym. Sci. 2020, 137, 1–15. [Google Scholar] [CrossRef]
- Hassel, A.W.; Fushimi, K.; Seo, M. An agar-based silversilver chloride reference electrode for use in micro-electrochemistry. Electrochem. Commun. 1999, 1, 180–183. [Google Scholar] [CrossRef]
- Zhang, J.; Yang, B.; Fu, F.; You, F.; Dong, X.; Dai, M. Resistivity and its anisotropy characterization of 3D-printed acrylonitrile butadiene styrene copolymer (ABS)/carbon black (CB) composites. Appl. Sci. 2017, 7, 20. [Google Scholar] [CrossRef] [Green Version]
- Gamry Instruments Measuring the Impedance of Your Reference Electrode. Available online: https://www.gamry.com/application-notes/instrumentation/measuring-the-impedance-of-your-reference-electrode/ (accessed on 1 January 2020).
- Metrohm Autolab B.V. Autolab Application Note EC02: Reference Electrodes and Their Usage. Available online: https://www.metrohm-autolab.com/download/Applicationnotes/Autolab_Application_Note_EC02.pdf (accessed on 7 November 2020).
- Menzel, J.; Frąckowiak, E.; Fic, K. Agar-based aqueous electrolytes for electrochemical capacitors with reduced self-discharge. Electrochim. Acta 2020, 332. [Google Scholar] [CrossRef]
- Lee, J.S. Use of a charcoal salt bridge to a reference electrode in an alkaline solution. J. Electroanal. Chem. 2020, 859, 113872. [Google Scholar] [CrossRef]
- Marzouk, S.A.M. Improved electrodeposited iridium oxide pH sensor fabricated on etched titanium substrates. Anal. Chem. 2003. [Google Scholar] [CrossRef]
- Shahrestani, S.; Ismail, M.C.; Kakooei, S.; Beheshti, M.; Zabihiazadboni, M.; Zavareh, M.A. Iridium Oxide pH Sensor Based on Stainless Steel Wire for pH Mapping on Metal Surface. IOP Conf. Ser. Mater. Sci. Eng. 2018, 328. [Google Scholar] [CrossRef]
- Rouhi, J.; Kakooei, S.; Ismail, M.C.; Karimzadeh, R.; Mahmood, M.R. Development of iridium oxide sensor for surface pH measurement of a corroding metal under deposit. Int. J. Electrochem. Sci. 2017. [Google Scholar] [CrossRef]
- Huang, W.D.; Cao, H.; Deb, S.; Chiao, M.; Chiao, J.C. A flexible pH sensor based on the iridium oxide sensing film. Sens. Actuators A Phys. 2011, 169, 1–11. [Google Scholar] [CrossRef]
- Kelco Chemical Compatibility Chart: ABS. Available online: http://www.kelco.com.au/wp-content/uploads/2009/02/abs-chemical-compatibility-guide.pdf (accessed on 7 November 2020).
- Pine Research Overview of Reference Electrodes and Alternative Reference Electrodes Brief Discussion about Standard and Pseudo Reference Electrodes. Available online: https://pineresearch.com/shop/wp-content/uploads/sites/2/2016/10/DRK10053-Overview-of-Reference-Electrode-Operation-and-Alternative-Reference-Electrodes-REV001.pdf (accessed on 7 November 2020).
- CP Lab Safety Nylon Chemical Compatibility. Available online: https://www.calpaclab.com/nylon-chemical-compatibility-chart/ (accessed on 7 November 2020).
Figure 1.
Design and fabrication of 3D-printed reference electrode (3D-RE). (a) Scheme illustrating the fabrication process of the 3D-RE. (b) Cross-section of the 3D-RE. (c) Photograph of assembled 3D-RE (i) without a junction installed and (ii) with a junction installed.
Figure 1.
Design and fabrication of 3D-printed reference electrode (3D-RE). (a) Scheme illustrating the fabrication process of the 3D-RE. (b) Cross-section of the 3D-RE. (c) Photograph of assembled 3D-RE (i) without a junction installed and (ii) with a junction installed.

Figure 2.
Optical microscope images of 3D-printed specimen (a) before and (b) after surface treatment (acetone vapor smoothening).
Figure 2.
Optical microscope images of 3D-printed specimen (a) before and (b) after surface treatment (acetone vapor smoothening).

Figure 3.
Optical microscope images of 3D-printed junctions printed with a layer height of 0.40 mm and different extrusion ratios of (a) k = 0.85, (b) k = 0.95, and (c) k = 1.05.
Figure 3.
Optical microscope images of 3D-printed junctions printed with a layer height of 0.40 mm and different extrusion ratios of (a) k = 0.85, (b) k = 0.95, and (c) k = 1.05.

Figure 4.
Filament density and % water absorption of 3D-printed specimen fabricated with 0.40 mm layer height and different extrusion ratios (k = 0.85, 0.95, and 1.05). For each case, five printed specimens were evaluated. Data are plotted as the mean ± s.d.
Figure 4.
Filament density and % water absorption of 3D-printed specimen fabricated with 0.40 mm layer height and different extrusion ratios (k = 0.85, 0.95, and 1.05). For each case, five printed specimens were evaluated. Data are plotted as the mean ± s.d.

Figure 5.
Potential stability of 3D-printed reference electrodes (3D-REs) with junctions printed using different extrusion ratios (k = 0.85, 0.95, 1.05). Open-circuit potential (OCP) measurements vs. saturated calomel electrode (SCE) were taken every 10 min over a 12-h period in 0.1 M KCl. 3D-REs from three separate fabrication batches were used for each type of electrode. The black solid line corresponds to a potential of −32 mV, while the shaded region corresponds to the acceptable OCP drift region of ± 5 mV. For comparison, potential stabilities of a 3D-RE without a junction and a Ag|AgCl wire pseudo-reference electrode are also shown.

Figure 6.
Bode plots of 3D-REs with 3D-printed junctions fabricated using variable extrusion ratios (k = 0.85, 0.95, 1.05). For comparison, the Bode plots of a 3D-RE with no junction and a commercial SCE are also shown. Impedance spectra were recorded in 0.1 M KCl.
Figure 6.
Bode plots of 3D-REs with 3D-printed junctions fabricated using variable extrusion ratios (k = 0.85, 0.95, 1.05). For comparison, the Bode plots of a 3D-RE with no junction and a commercial SCE are also shown. Impedance spectra were recorded in 0.1 M KCl.

Figure 7.
Long-term potential stability of 3D-RE with k = 0.95 (n = 3) over 30 days of daily OCP vs. SCE measurements in 0.1 M KCl. Different symbols represent different fabricated 3D-REs. The black solid line corresponds to the mean starting potential, while the shaded region corresponds to the acceptable OCP drift region of ± 5 mV from the starting potential [23,51].

Figure 8.
Potential stability of 3D-RE (k = 0.95) and a Ag|AgCl wire pseudoreference electrode in various sample matrices. (a) Open-circuit potential (OCP) measurements over time with KCl concentration varied after every 5 min. (b) Nernst plot showing OCP dependence on the logarithm of KCl concentration. (c) Nernst plots showing 3D-RE OCP dependence on the logarithm of concentration of different electrolytes. Plots are offset by 0.05 V between each plot for clarity. (d) OCP responses at different pH. In (b–d), data are plotted as the mean of measurements from three electrode replicates ± the standard deviation.

Figure 9.
Cyclic voltammograms of 4 mM ferricyanide in 0.1 M KCl recorded using a carbon paste working electrode, Pt wire counter electrode, and different reference electrodes (commercial SCE, 3D-RE (k = 0.95), and Ag|AgCl pseudoreference electrode).
Figure 9.
Cyclic voltammograms of 4 mM ferricyanide in 0.1 M KCl recorded using a carbon paste working electrode, Pt wire counter electrode, and different reference electrodes (commercial SCE, 3D-RE (k = 0.95), and Ag|AgCl pseudoreference electrode).

Figure 10.
Potential responses (n = 3) of iridium oxide (IrOx) electrodeposited on inkjet-printed Au electrode (IrOx|Au) in various standard pH buffers and the corresponding linear regression plots. Responses were measured against different reference electrodes: (a) commercial SCE, (b) Ag|AgCl pseudoreference electrode, and (c) 3D-RE (k = 0.95). For the linear regression equations, y = OCP in mV and x = pH.

Publisher’s Note: MDPI stays neutral with regard to jurisdictional claims in published maps and institutional affiliations. |
© 2020 by the authors. Licensee MDPI, Basel, Switzerland. This article is an open access article distributed under the terms and conditions of the Creative Commons Attribution (CC BY) license (http://creativecommons.org/licenses/by/4.0/).
Share and Cite
MDPI and ACS Style
Sibug-Torres, S.M.; Go, L.P.; Enriquez, E.P. Fabrication of a 3D-Printed Porous Junction for Ag|AgCl|gel-KCl Reference Electrode. Chemosensors 2020, 8, 130. https://0-doi-org.brum.beds.ac.uk/10.3390/chemosensors8040130
AMA Style
Sibug-Torres SM, Go LP, Enriquez EP. Fabrication of a 3D-Printed Porous Junction for Ag|AgCl|gel-KCl Reference Electrode. Chemosensors. 2020; 8(4):130. https://0-doi-org.brum.beds.ac.uk/10.3390/chemosensors8040130
Chicago/Turabian StyleSibug-Torres, Sarah May, Lance P. Go, and Erwin P. Enriquez. 2020. "Fabrication of a 3D-Printed Porous Junction for Ag|AgCl|gel-KCl Reference Electrode" Chemosensors 8, no. 4: 130. https://0-doi-org.brum.beds.ac.uk/10.3390/chemosensors8040130
Note that from the first issue of 2016, this journal uses article numbers instead of page numbers. See further details here.