Article

Fully Printed Disposable IoT Soil Moisture Sensors for Precision Agriculture

1
Department of Graphic Arts and Photophysics, University of Pardubice, 532 10 Pardubice, Czech Republic
2
Department of Materials and Technology, University of West Bohemia, 306 14 Pilsen, Czech Republic
3
Centre for Organic Chemistry, 533 54 Rybitví, Czech Republic
4
Crop Research Institute, 161 06 Prague, Czech Republic
*
Author to whom correspondence should be addressed.
Submission received: 27 October 2020 / Revised: 3 December 2020 / Accepted: 4 December 2020 / Published: 6 December 2020
(This article belongs to the Special Issue Printed Chemical Sensors)

Abstract

:
Digitization of industrial processes using new technologies (IoT—Internet of Things, IoE—Internet of Everything), including the agriculture industry, are globally gaining growing interest. The precise management of production inputs is essential for many agricultural companies because limited or expensive sources of water and nutrients could make sustainable production difficult. For these reasons, precise data from fields, plants, and greenhouses have become more important for decision making and for the proper dosage of water and nutrients. On the market are a variety of sensors for monitoring environmental parameters within a precise agricultural area. However, the high price, data storage/transfer functionality are limiting so cost-effective products capable to transfer data directly to farmers via wireless IoT networks are required. Within a given scope, low-price sensor elements with an appropriate level of sensor response are required. In the presented paper, we have developed fully printed sensor elements and a dedicated measuring/communicating unit for IoT monitoring of soil moisture. Various fabrication printing techniques and a variety of materials were used. From the performed study, it is obvious that fully printed sensor elements based on cheap and environmentally friendly carbon layers printed on the wood substrate can compete with conventionally made sensors based on copper.

1. Introduction

The rapid progress of sensor technology and data processing in connection with the development of the internet is now driving the global development of intelligent products. Great efforts are being made to find new ways of producing interconnected electronic sensor systems on a large scale. These systems will enable massive data collection for the subsequent management of industrial and social processes at a new quality level. In general, these objectives aim, in particular, to increase the efficiency, economy, safety, and long-term sustainability of the technological existence of human society.
Great expectations are placed on the concepts of printed hybrid electronics [1], which promises energy and material-efficient additive production of electronics and sensors. It is also of great interest thanks to the constantly evolving material base, which includes new forms of eco-friendly, biodegradable, biocompatible, and recycled materials [2,3,4,5]. These aspects pave the way for the large-scale manufacturing and widespread use of printed wireless sensor systems with minimal environmental impact [6,7].
The rapid progress of sensor technology and data processing in connection with the development of the internet is now driving the global development of intelligent products. In recent years, this trend has also been rapidly growing in the agricultural sector as a so-called precision agriculture concept [8,9,10]. New technologies are being implemented both in animal production [11,12] and plant production [13,14]. The obtained data are used to increase efficiency and productivity in agriculture to promote better animal welfare and greater environmental friendliness. The rapid development of the Internet of Things (IoT) concept has great potential for progress in this area. IoT technologies can help assess soil, plant, or animal status, as well as atmospheric conditions [9,15].
One of the most important soil properties for agriculture is soil water content (soil moisture). The thermogravimetric method is a well-known and widely used standard procedure for calibrating soil moisture content [16]. It is based on the drying of a soil sample in an oven at 110 ± 5 °C for at least 24 h and measuring the weight of the sample before and after drying [17]. Unfortunately, this method is time-consuming and can only be performed in a laboratory.
There are many other techniques to determine soil moisture content, including nuclear, electromagnetic, tensiometric, or optical methods combined with remote sensing [18]. Among these, sensors using dielectric (electromagnetic) techniques are widely used to measure soil water content thanks to their suitability for automated measurement, sufficiently high accuracy, water content measuring range, and easy installation [16,19,20]. Using dielectric methods, soil properties can be investigated in the time domain or the frequency domain. Time-domain reflectometry (TDR) and time-domain transmission (TDT) are the most commonly used time methods; frequency domain reflectometry (FDR) and capacitance measurements are the most commonly used frequency methods [18]. The principle of dielectric methods is based on the difference between the dielectric constants of air (εr ≈ 1) and water (εr ≈ 80). The presence of water in the soil changes its permittivity and also modifies the electrical capacity of the soil-sensor [16,20,21,22].
In literature, many studies are dealing with the development of soil moisture sensors for precision agriculture. Most of them are based on a conventional technological approach using rigid printed circuit board materials or stainless-steel rod waveguides. For IoT usage, many of them are able to transfer obtained data using a communication method (radio transmission, cellular, low power wireless networks, etc.) [23,24,25,26]. However, the widespread deployment of sensors and other electronic data acquisition devices also requires a coherent and responsible approach to the entire life cycle of these systems. Especially in agricultural applications, it is necessary to minimize the possible environmental impact associated with, for example, the installation of sensors directly into the soil. Their construction and material composition should primarily minimize the potential risk of contaminating the environment with any undesirable substances. Simultaneously, the design, manufacture, use, and subsequent disposal at the end of their life should respect the principles of the circular economy. The design of the sensor units should thus allow the reusability of components and, in the case of damage, the easy replacement of the main parts. In this respect, additive manufacturing utilizing material- and energy-efficient printing techniques can help to achieve these requirements in terms of cheap and environmentally friendly sensors.
Towards low-cost production, Shirahama et al. [27] presented sensors for the monitoring of moisture at various depths of soil. They used copper coated PET (poly(ethylene terephthalate)), where they patterned the capacitive soil moisture sensor by etching. For easier installation into the soil, the PET sensor element was wound onto a PVC pipe. Further enhancement was published in a subsequent paper [28], where the sensors were equipped with NTC (Negative Temperature Coefficient) thermistors for temperature measurement. Dean at al. [29] made a capacitive sensor, where the interdigital structures were fabricated by conventional PCB technique by etching from copper and then overprinted with an insulating solder mask. The sensor elements exhibited linear dependence with R2 = 0.959 during calibration in the range 0–32% of the volumetric water content (VWC). The PCB-based sensors used in real plant measurements, and for two depths of sensing area, were published by Shigeta [30]. From the point of view of low-cost and material-efficient manufacturing processes, present research efforts are focused on the development of sensors fabricated by printing technologies [31,32,33] or by additive technologies (3D printing, microdispensing). Kim et al. [32] published a paper-based silver capacitive sensor for soil moisture measurement. Despite promising results, the paper material used does not allow for comfortable installation of the sensors in real conditions and it is not suitable for long-term stable sensors.
To the best of our knowledge, there has been no published solution considering a combination of easily replaceable printed sensor elements together with a dedicated measuring unit with IoT capabilities simplifying data sharing and storage. In our study, we focus on fully printed capacitive sensor elements as a substitution for conventional copper-based sensors. The main goal was to develop a fully additively produced probe for measuring soil moisture without the need to mount any other components, leading to inexpensive, material-, and energy-efficient production. Such probes will allow for easy replacement and represent a promising path towards the efficient and sustainable use of material resources. The development of low-cost replaceable, or even recyclable sensor elements fabricated by high throughput printing technologies will enable the wide deployment of these sensors for large-scale monitoring of agricultural production.

2. Materials and Methods

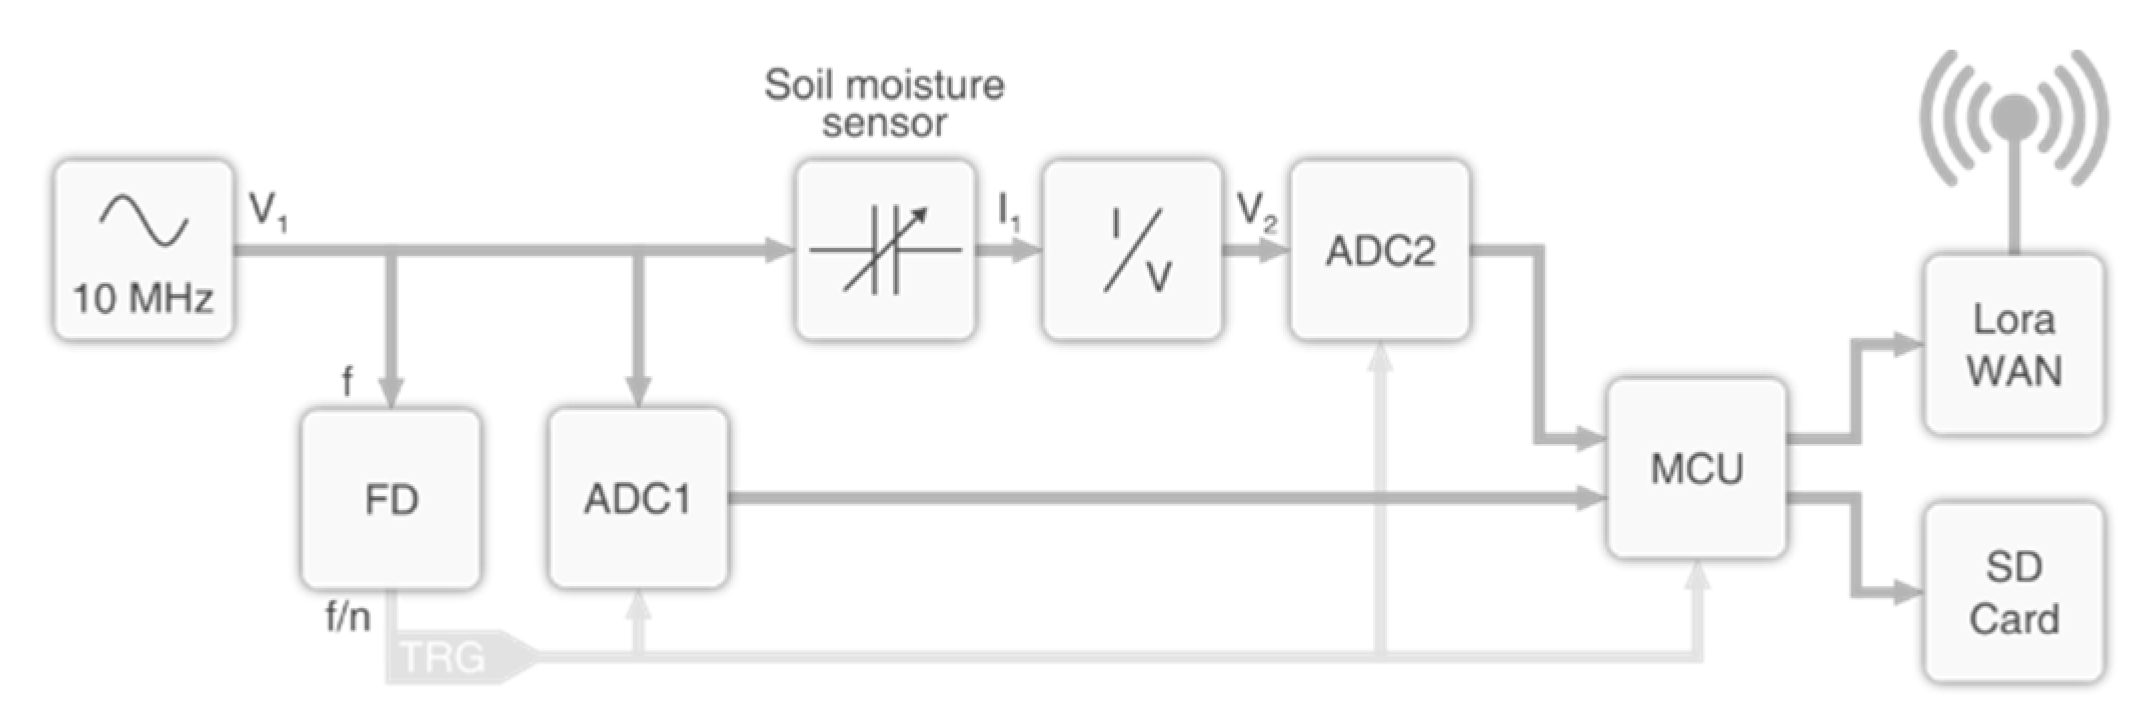
2.1. IoT Sensor System for Precision Agriculture

The main objective of this work was to implement an IoT system for precision agriculture based on wireless data transmission using the LoRaWAN (Long Range Wide Area Network) low power wireless network (LPWAN). The system will allow the measurement of the humidity and temperature of the microclimate above ground together with the measurement of soil moisture and temperature at two different depths. The data are transmitted wirelessly to the local gateway and stored in a database on the server for further analytical use.
The sensor elements are connected to the autonomous sensor unit which processes and sends the acquired data through the IoT network. The electronic unit consists of evaluation circuits, a data transmission module, and power management with a battery. The unit is hermetically sealed in a housing resistant to external weather conditions. A sensor module for measuring the temperature and relative humidity of the microclimate is connected externally. The soil probe is designed as a planar plate with sensor elements placed in two measurement zones which enable the measurement of the soil moisture at two different depths (0–15 cm; 15–30 cm). The design and substrate of the sensor element are advantageous for the easy assembly of the electronic unit and the soil probe and their possible replacement. This approach will allow the efficient and rapid prototyping of new sensor versions. For wireless communication, the LoRaWAN network is used, which allows for the easy commissioning of its own communication infrastructure.
The IoT electronic device (Figure 1) is designed as a complex impedance meter which directly samples the excitation voltage V and the current I flowing through the electrical dipole (measuring electrode located in the soil).
The signal source (crystal oscillator circuit) generates an alternating harmonic voltage V1. The current I2 through the sensor element is converted to the voltage V2 in a current to voltage converter (I/V). Both signals (the excitation voltage V1 and the output voltage V2) then enter a pair of two-step flash analog-to-digital converters ADC1175 (ADC1 and ADC2). To achieve a cost-efficient solution, high-speed AD converters are not used for signal sampling. Instead, the undersampling method is applied, when the signal is sampled with a frequency significantly lower than the original waveform. Having the V1 frequency of 10 MHz, the sampling frequency is set to approximately 1 250 255 Hz resulting in normalized frequency of approx. −0.003 π, thus giving approx. 613 samples per period of sampled signal. The original voltage and current waveforms are subsequently reconstructed in the microcontroller unit STM32L4 MCU from a large number of obtained samples. The lower frequency is generated by the frequency divider (FD) from the excitation signal by multiplying the crystal oscillator frequency with fractional multiplier PLL (Phase-locked Loop) and then dividing by integer factor. This signal then serves as a trigger to synchronize sampling between the ADCs and the MCU.
The resulting impedance Z of the sensor element is then calculated from the reconstructed signals as the ratio between voltage V and current I using the formula:
Z = V I   ( Ω ) .
The phase shift φ of the voltage and current signal is determined from the detection of signal zero crossings. The sensor element capacity CP is calculated according to the admittance model of a capacitor from the imaginary part of admittance Y ¯ (reciprocal of impedance Z) as follows [34]:
Y ¯ = 1 Z = G + j B = 1 R P + j ω C P
| Y | = G 2 + B 2
G = 1 R P = | Y | c o s φ
B = ω C P = | Y | s i n φ
where | Y | is the magnitude of admittance (Ω), G is conductance (S), B is susceptance (S), RP is soil resistance (Ω), and CP is the soil probe capacity (F). The measured data are stored on the internal SD memory card in the IoT unit and sent by a communication module via LoRaWAN to the remote server.

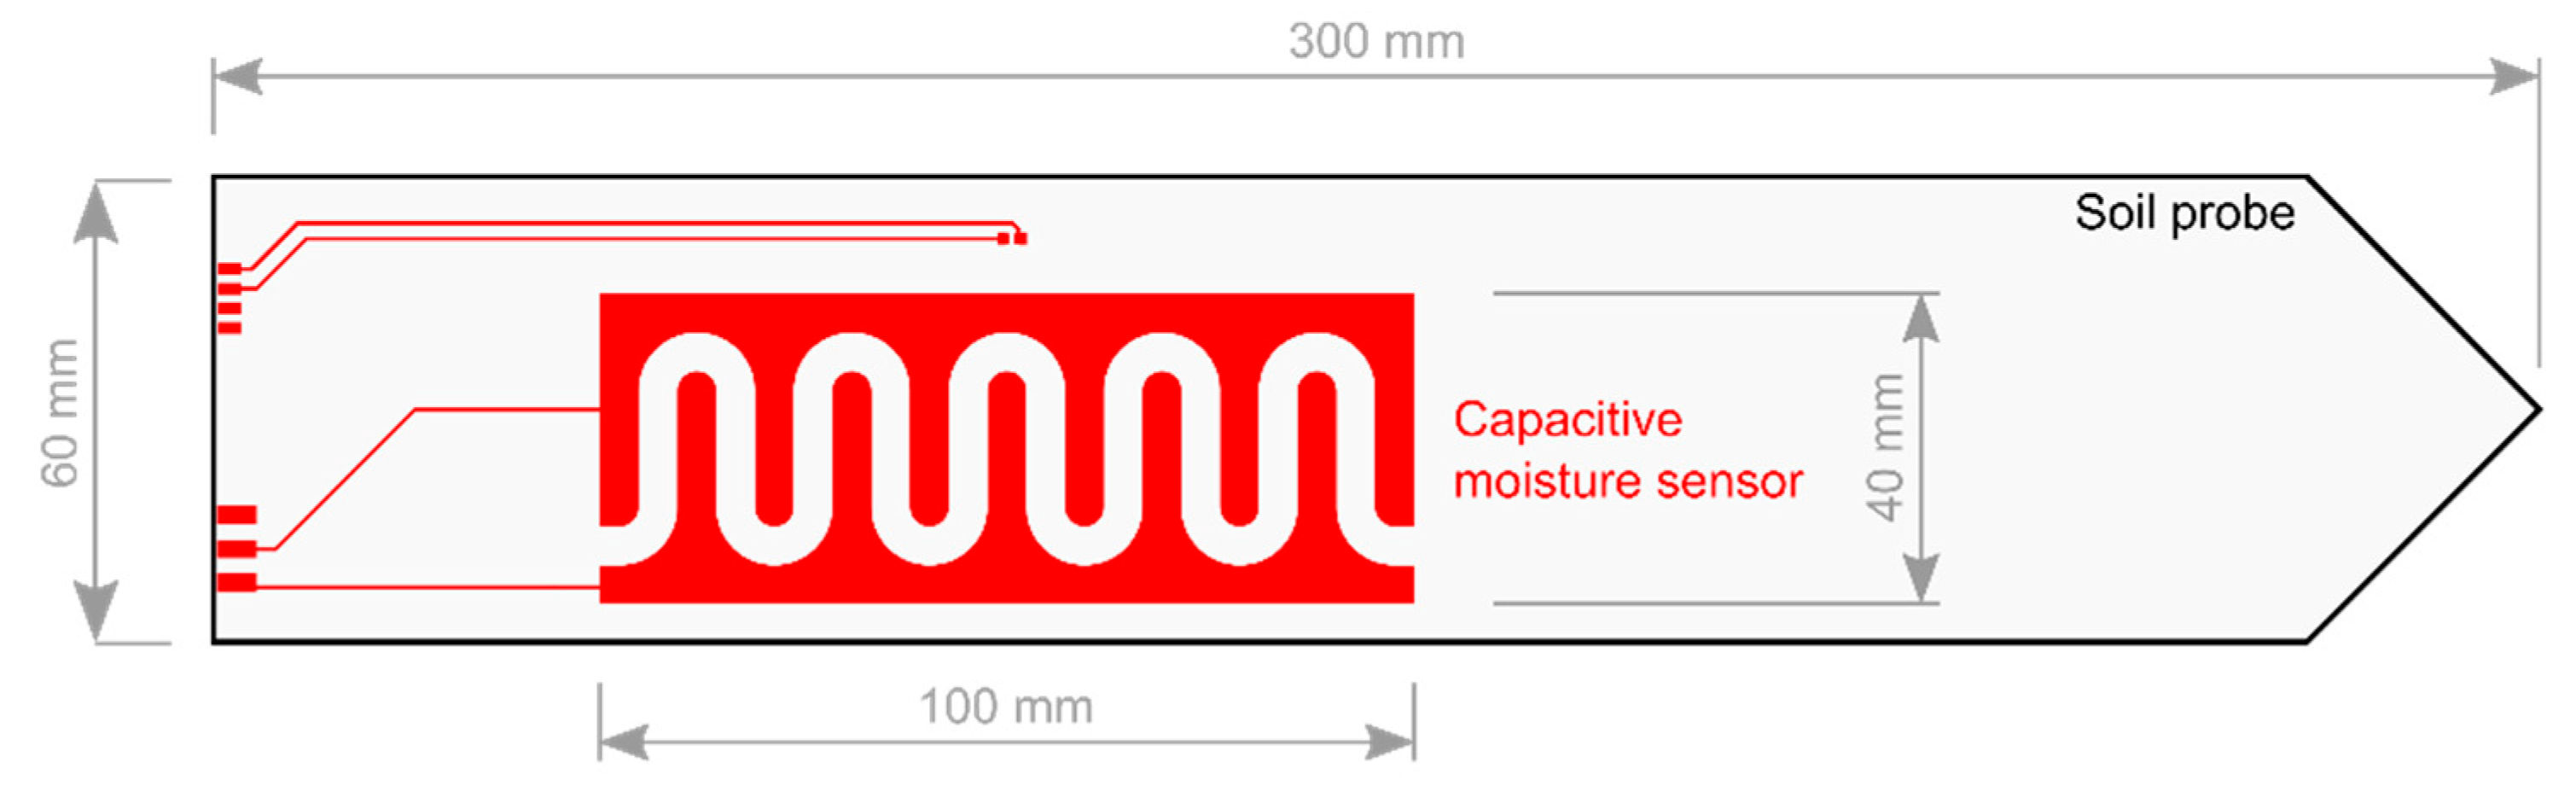
2.2. Printed Sensors

The soil probe for moisture measurement was designed as a planar board with a capacitive sensor element consisting of interdigitated electrodes of 100 mm length (Figure 2). In this paper, the sensor element is situated in the upper part of the soil probe, but its construction is prepared for two-zone measurement in the future. The probe also contains interconnections for the assembly of a discrete thermistor next to the soil moisture sensor for soil temperature measurement.
All sensors in the current phase of development were fabricated on planar glass–epoxy substrates (FR4), which allowed for comfortable installation into the soil thanks to their mechanical properties (Figure 3c). This standard substrate allowed the proper comparison of all fabricated sensors within the evaluation phase of this study. During the development of the probes for soil moisture measurement, four types of capacitive sensor elements were fabricated on FR4 substrates: the first type chemically etched from copper foil, the second type printed from silver paste, and the last two types printed from carbon-based material. Copper was chosen as the reference material due to its great electrical conductivity. These sensor elements were structured by conventional photolithography. Silver paste was chosen as a printable alternative to etched Cu with reasonable conductivity. These sensor elements were printed by screen printing (AGS—Ag Screen Printed). Finally, carbon paste was the material of choice for environmentally friendly types of sensor elements, which were fabricated in two different thicknesses: the thinner using screen printing (CSP—Carbon Screen Printed) and the thicker using the microdispensing technique (CMD—Carbon Microdispensing). The final mechanical protection and electrical insulation of the sensor elements were realized in two versions: an organic solder mask applied during the standard printed circuit board manufacturing process on copper elements; and a spray-coated polyurethane layer on printed elements with subsequent drying (25 °C/24 h).
The AGS sensor elements were printed using a stencil based on SAATI PES mesh with the mesh count of 120 threads per centimeter (thr./cm) and the CSP sensor elements were printed with a stencil using SAATI PES mesh with 77 thr./cm. The sensors were printed on the EKRA E1 printing machine. The snap-off was set to 2 mm and flooding and printing speed were 60 mm/s and 100 mm/s, respectively.
The thick carbon-based sensor elements (CMD) were printed with the microdispensing technique using the nScrypt printing machine. The printing pressure was 250 kPa and printing speed 300 mm/minute with a spacing of path lines of 400 μm. All screen-printed layers (AGS, CSP) were dried in a Memmert UF55 hot air oven at 120 °C for 30 min; the thicker microdispensed layers (CMD) were dried at 120 °C for 60 min.
AGS sensor elements were screen-printed using silver-based paste (Dupont 5029) with a solid content of silver flakes of approximately 75% wt. The mean size of silver flakes was 6 μm (determined by SEM). For the printing of carbon-based sensors, the own developed solvent-borne ink formulation based on graphene nanoplatelets (GNP) and small particles of carbon black was used. The mean size of GNP was 7 μm (determined by SEM). The typical solid content of carbon particles was 35–38% wt. The rheology behavior of carbon-based ink allowed for high-quality printing of tested sensors with both screenprinting (CSP) and microdispensing (CMD). Within the proposed study, the microdispensing technique is meant as a digital prototyping tool for the possible future mass production of sensors using stencil printing, which allows the printing of the required thickness of the sensing layer.
In addition to the above-mentioned preparation of sensor elements on glass–epoxy substrates, the concept of a fully environmentally sustainable soil probe was also verified in this study. For this purpose, a modification of the CMD sensor was prepared, which was printed directly onto a blank of a wooden plank made of spruce wood instead of a glass–epoxy substrate. This variant is hereinafter referred to as CMD/Plank (Figure 3d).
The thickness of all sensing element layers was measured using an Olympus LEXT OLS5000 laser scanning confocal microscope (Olympus Corporation, Tokyo, Japan) by direct measurement of their 3D profiles. The surface morphology of the realized layers was studied using a Phenom ProX scanning electron microscope (SEM, Phenom-World BV, Eindhoven, The Netherlands).

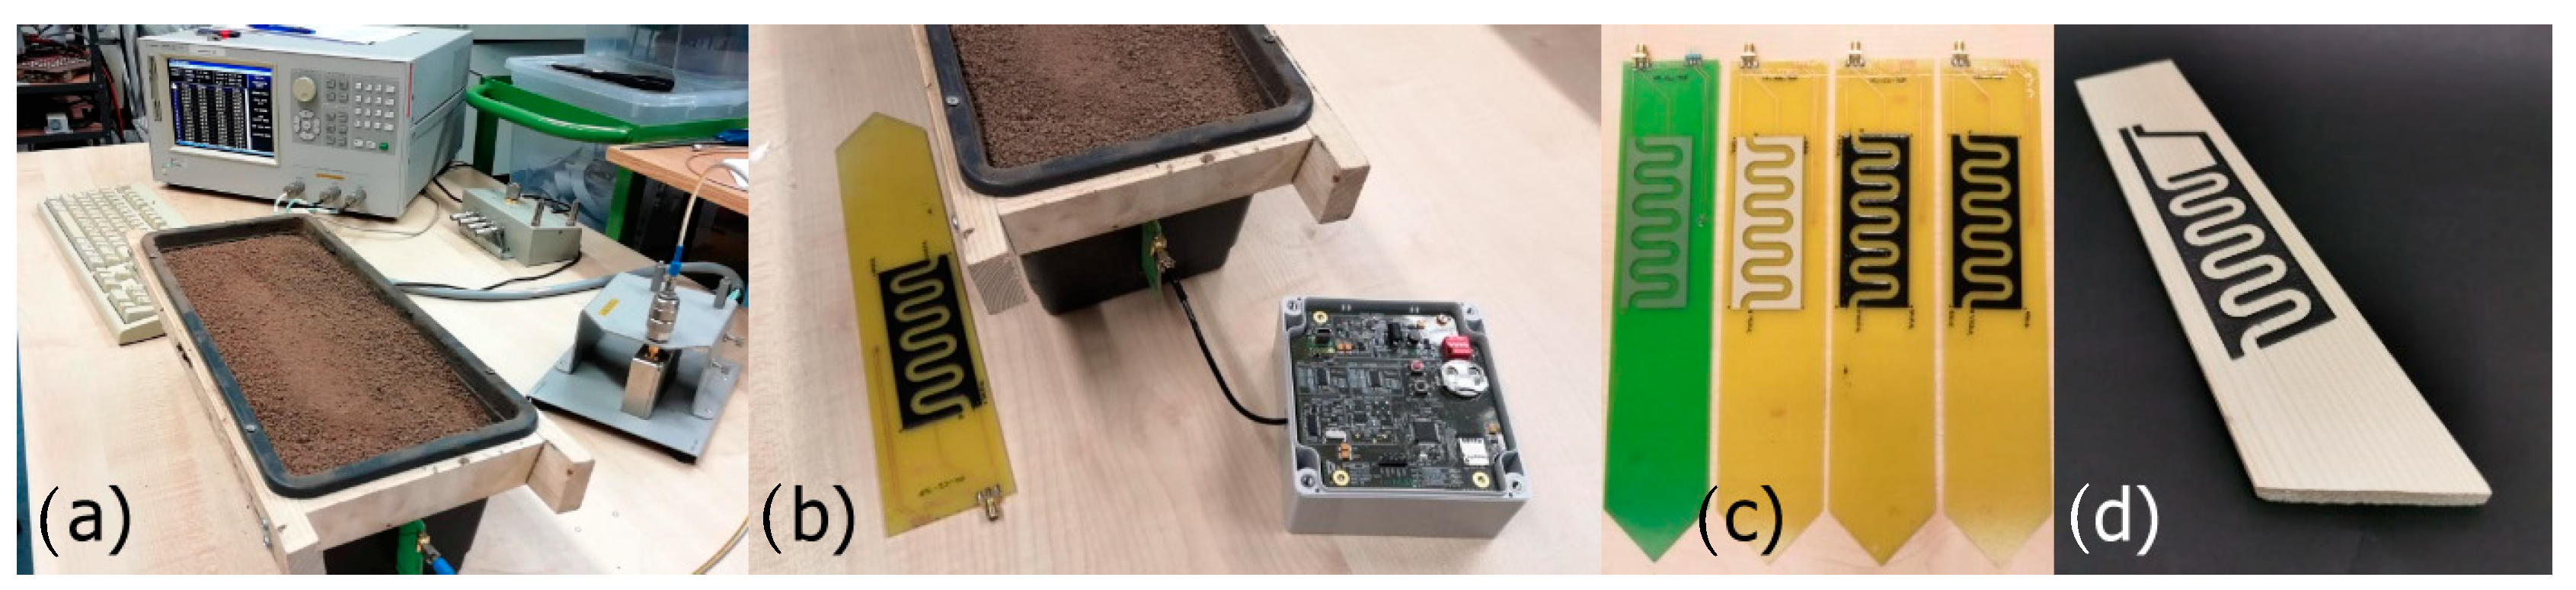
2.3. Soil Sensor Testing and Calibration Procedure

An analysis of the electrical response of capacitive sensors to different levels of soil moisture was performed in laboratory prepared soil samples of the type Luvisol [35] /modal Luvisol—according to the Czech Taxonomic Soil Classification System [36]/(specific weight 1350 kg·m−3; porosity 45%) and in soil samples of the type Chernozem [35]/modal Chernozem—according to the Czech Taxonomic Soil Classification System [36]/(specific weight 1450 kg·m−3; porosity 35%). The soil was sieved through a 2 mm sieve and dried at 105 °C for 24 h in a hot air oven to remove residual water. After drying, a precisely defined amount of water was added to the soil samples and thoroughly mixed together to homogenize the soil moisture. The exact values of the volume water content of the prepared samples were determined gravimetrically.
Plastic box containers (dimensions 350 mm × 145 mm × 135 mm) with an inner volume of 5500 cm3 were used for the measurements. The soil was put into the container and compacted to achieve the appropriate specific weight. The sensor was inserted into the container with the soil and its electrical response to soil moisture was recorded. Impedance measurements of all soil probes were performed with the Agilent 4287A RF LCR Meter (Figure 3a) and also with the developed IoT measurement unit (Figure 3b).
Soil probes were first connected to the LCR meter and then to the IoT unit via a coaxial cable through an SMA connector and measured by AC sinusoidal voltage waveform at 10 MHz. The sensor element capacity CP was determined according to the admittance (parallel) capacitor model using formula (5). The measurement was repeated 10 times for each type of sensor and the average values, standard deviations and coefficients of variation were calculated. These values were further statistically analyzed to assess the calibration curves, i.e., capacitance to soil water content for each type of sensor.
All statistical analyses were performed in Statistica 13 (TIBCO Software Inc.), QC Expert 3.3 Pro (TriloByte Statistical Software, Ltd.), and NCSS 12 Statistical Software (NCSS, LLC). The graphical outputs were prepared in Origin 9.0 (OriginLab Corp.). The techniques of exploratory analysis of one-dimensional data, and linear regression—construction of a regression model by regression triplet were used for statistical analysis [37]. The regression model search procedure consisted of the following steps: (1) model design, (2) preliminary data analysis (multicollinearity, heteroscedasticity, autocorrelation, and influence points), (3) estimation of parameters by classic least squares method, followed by testing of the parameter significance by Student’s t-test, mean quadratic prediction error, and Akaik’s information criterion, (4) regression diagnostics—identification of influential points and verification of least squares method assumption, (5) refined model construction. The parameters of the refined models were estimated using (a) least squares method at inconstant variability, (b) generalized least squares method at autocorrelation, (c) conditioned least squares method at restricted parameters, (d) method of rationalized values at multicollinearity, (e) enhanced least squares method, and (f) robust methods for other than normal data and data outlaid and extreme values [37]. Statistical significance was tested at a significance level of p = 0.05.

3. Results and Discussion

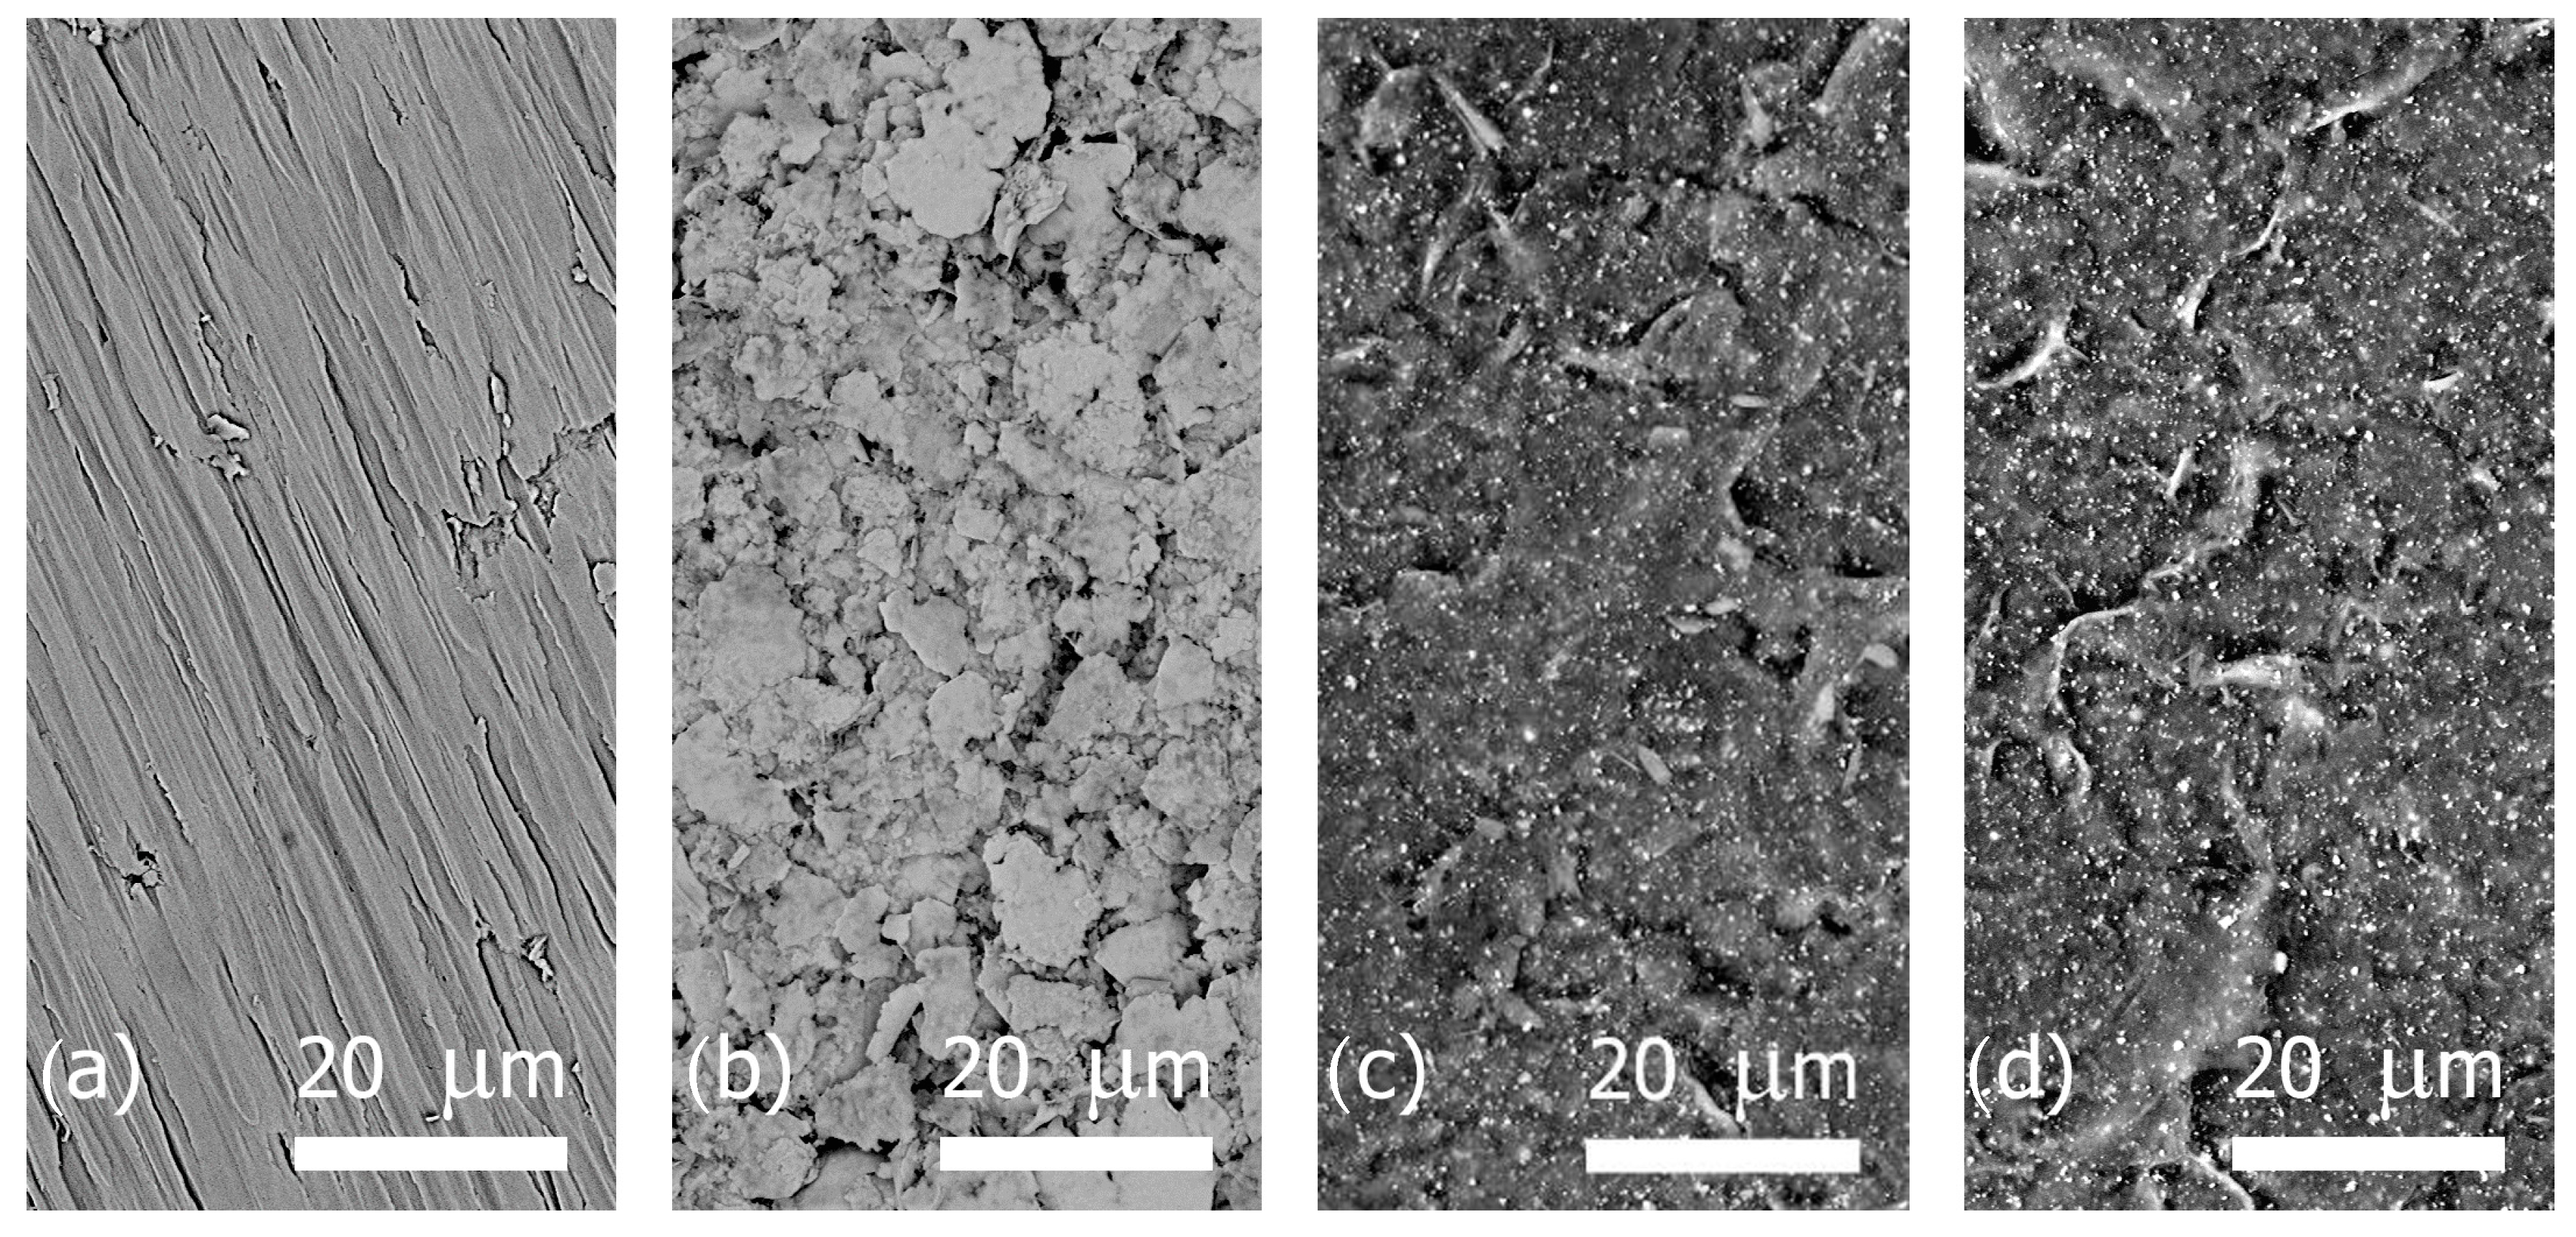
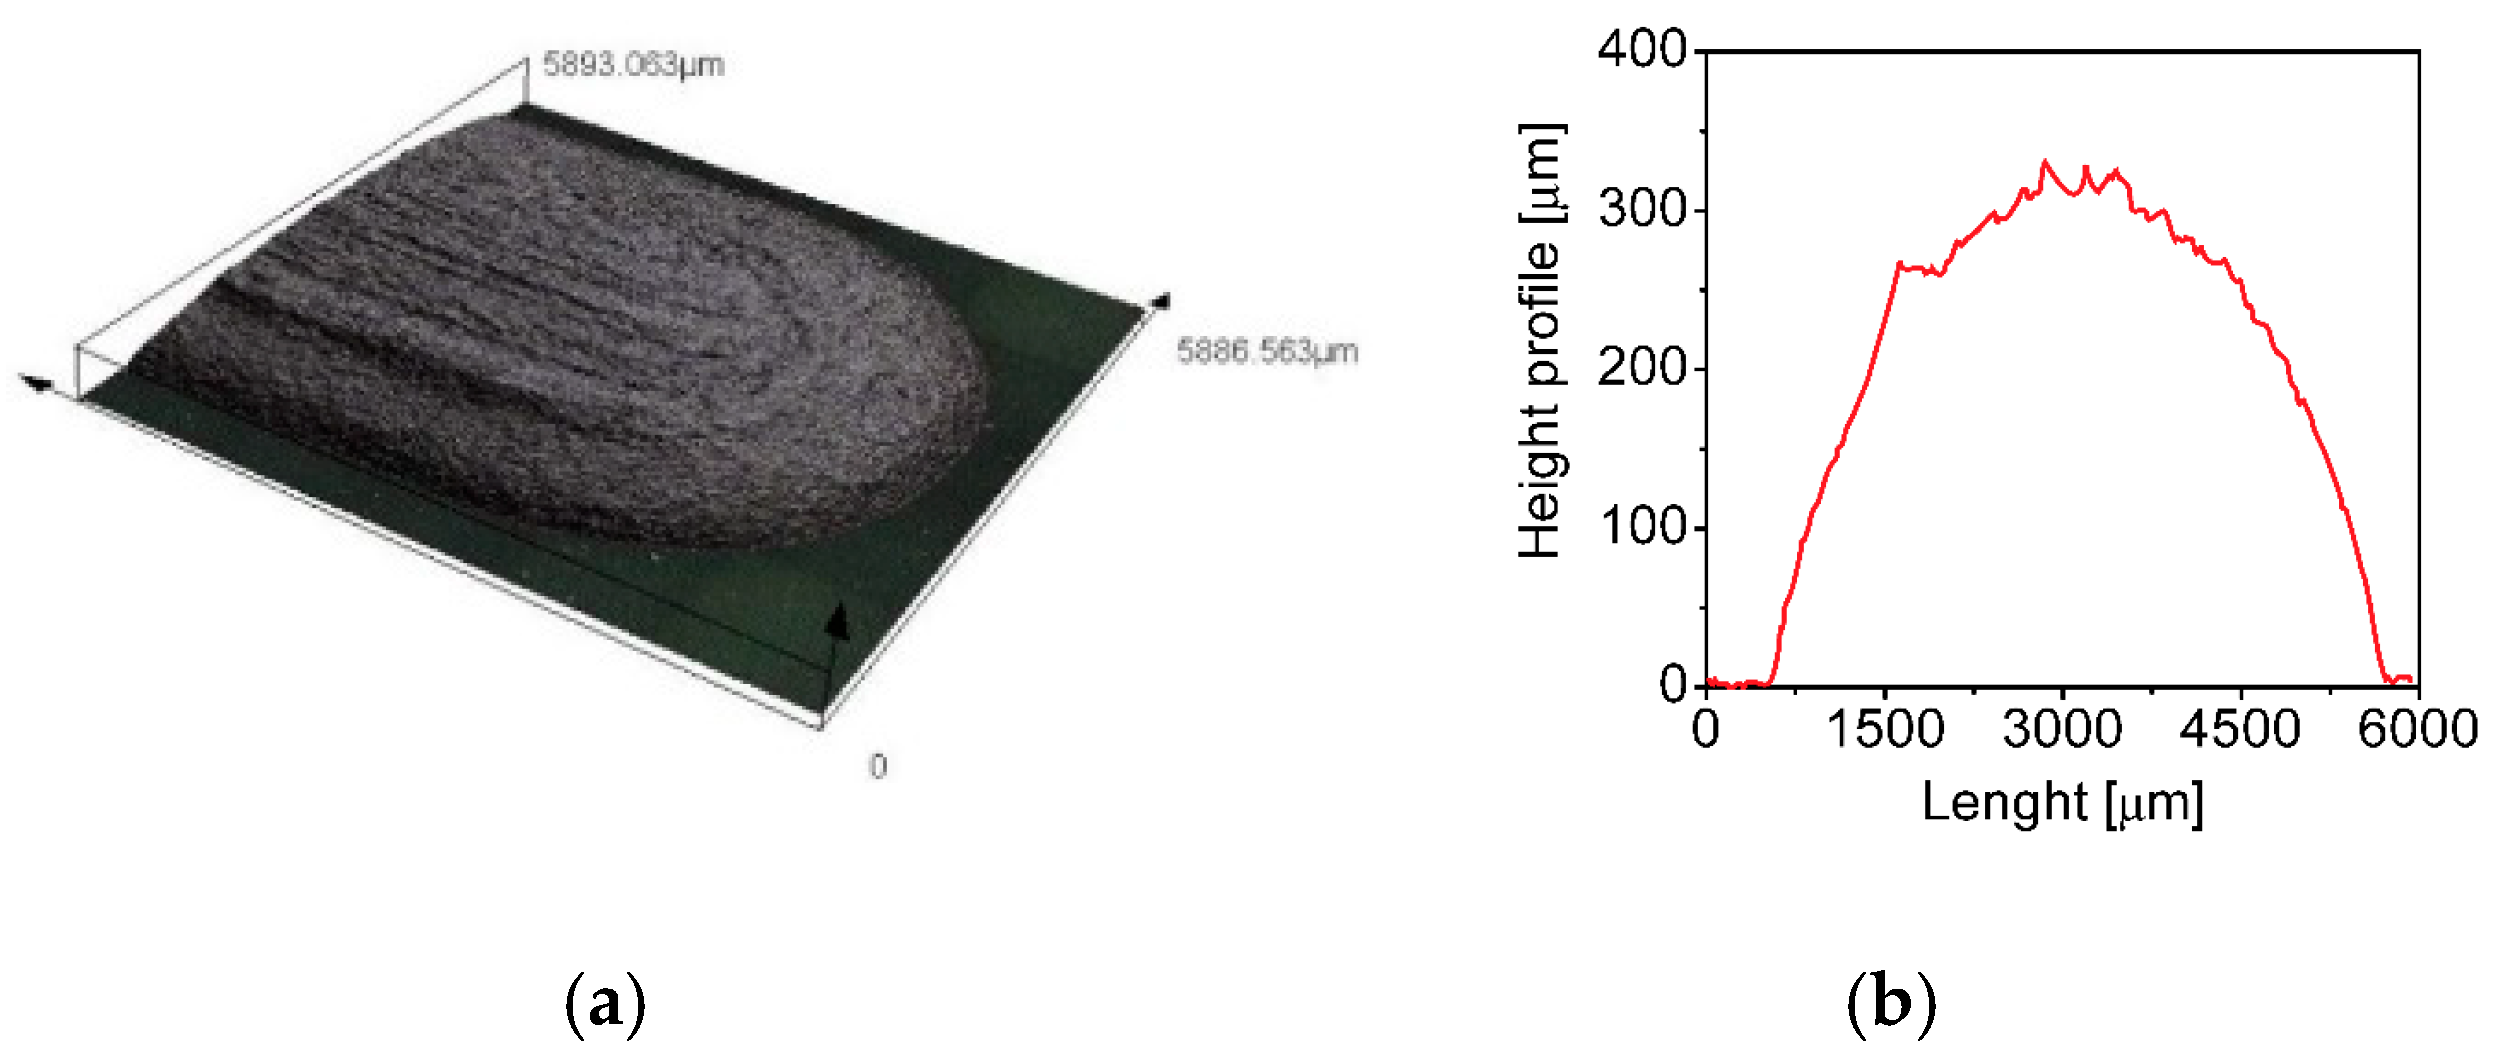
3.1. Electrical and Optical Analysis of Sensor Elements

The surfaces of all layers were analyzed by SEM (Figure 4). Figure 4a shows a compact copper foil layer without particulate arrangement. The AGS silver layer consists of silver flake particles with main size distribution of 5—8 μm (Figure 4b). As a result that the CMD and CSP were printed from the same ink formulation, the layers seems very similar. The microphotography clearly shows that the carbon layers are formed by a mixture of GNP and globular carbon particles (Figure 4c,d).
The sheet resistance and resistivity of all sensor elements were estimated using a four-point technique with a Keithley 2010 digital multimeter (Table 1).
There are differences in electrical resistivity in the range of several orders of magnitude among all conductive layers, which affects the sensor characteristics, as is discussed later. The data in Table 1 also confirm that the thickness of CMD layers (Figure 5) is much higher than for CSP, which is the reason for lower sheet resistance. The difference in resistivity calculated for CSP and CMD layers (which are printed from the same carbon paste) could be affected by different particle arrangements at different layer thicknesses. Probably, the setting of layers during drying influenced the interparticle contact.

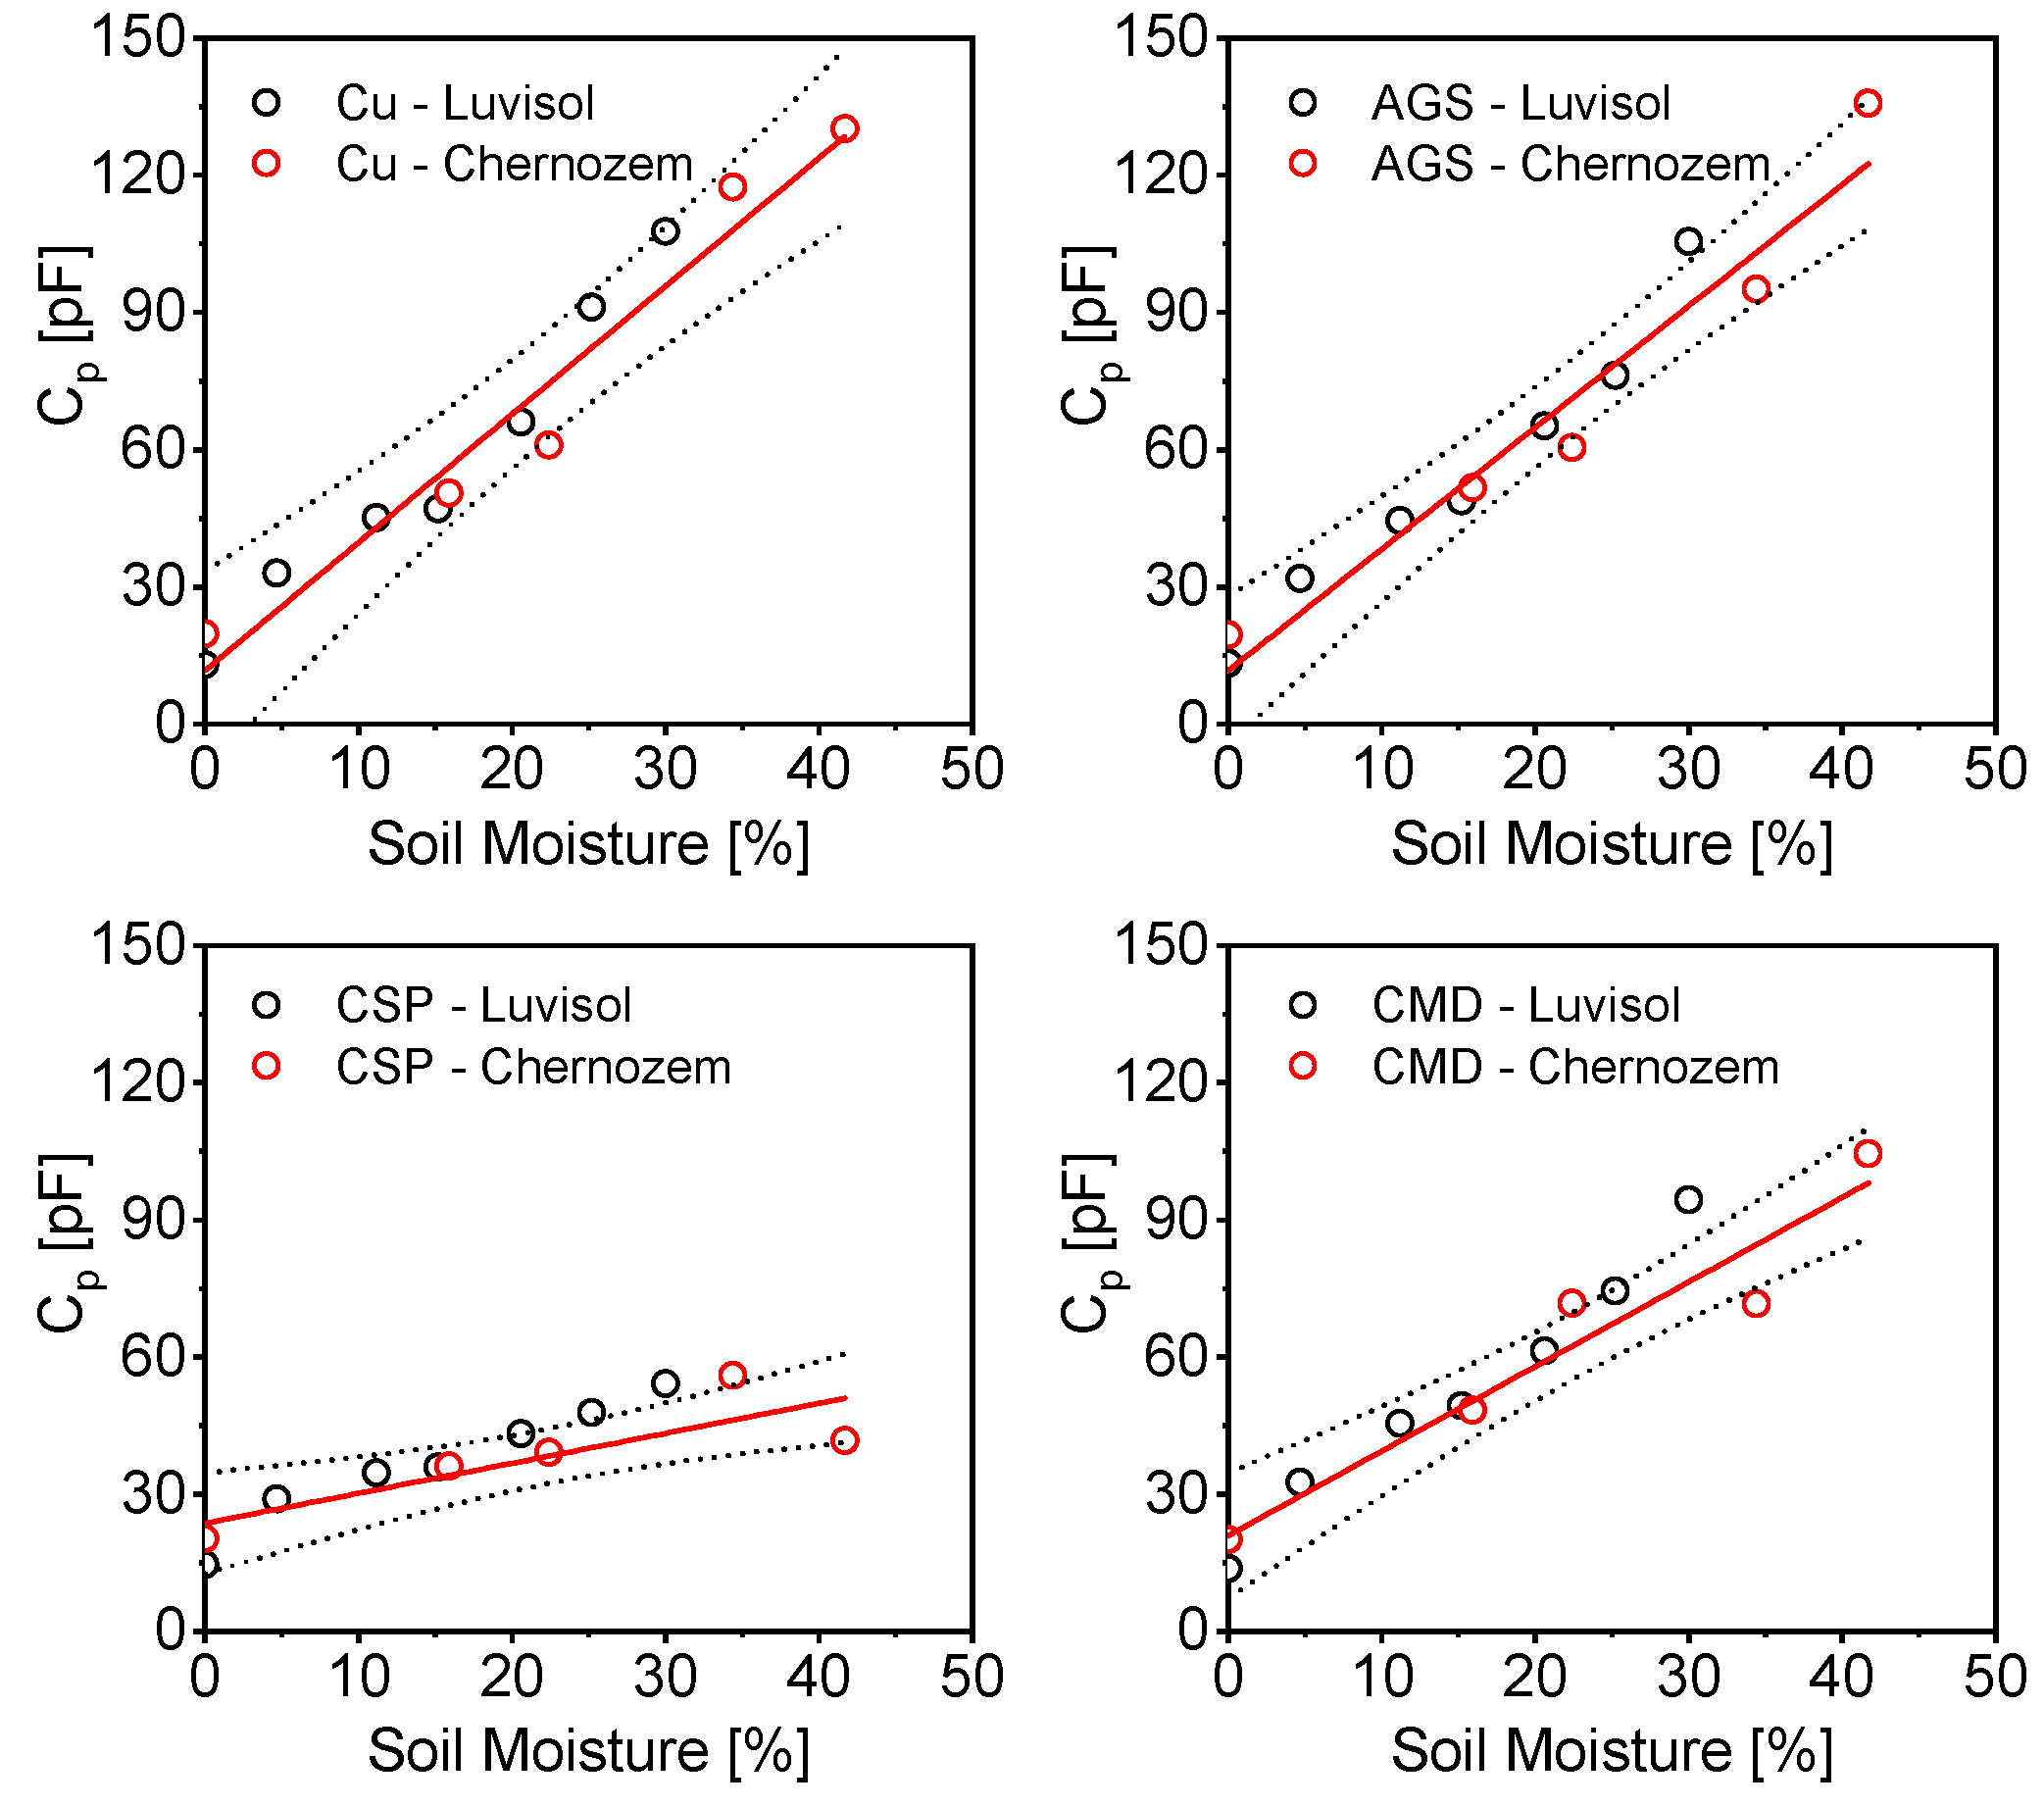
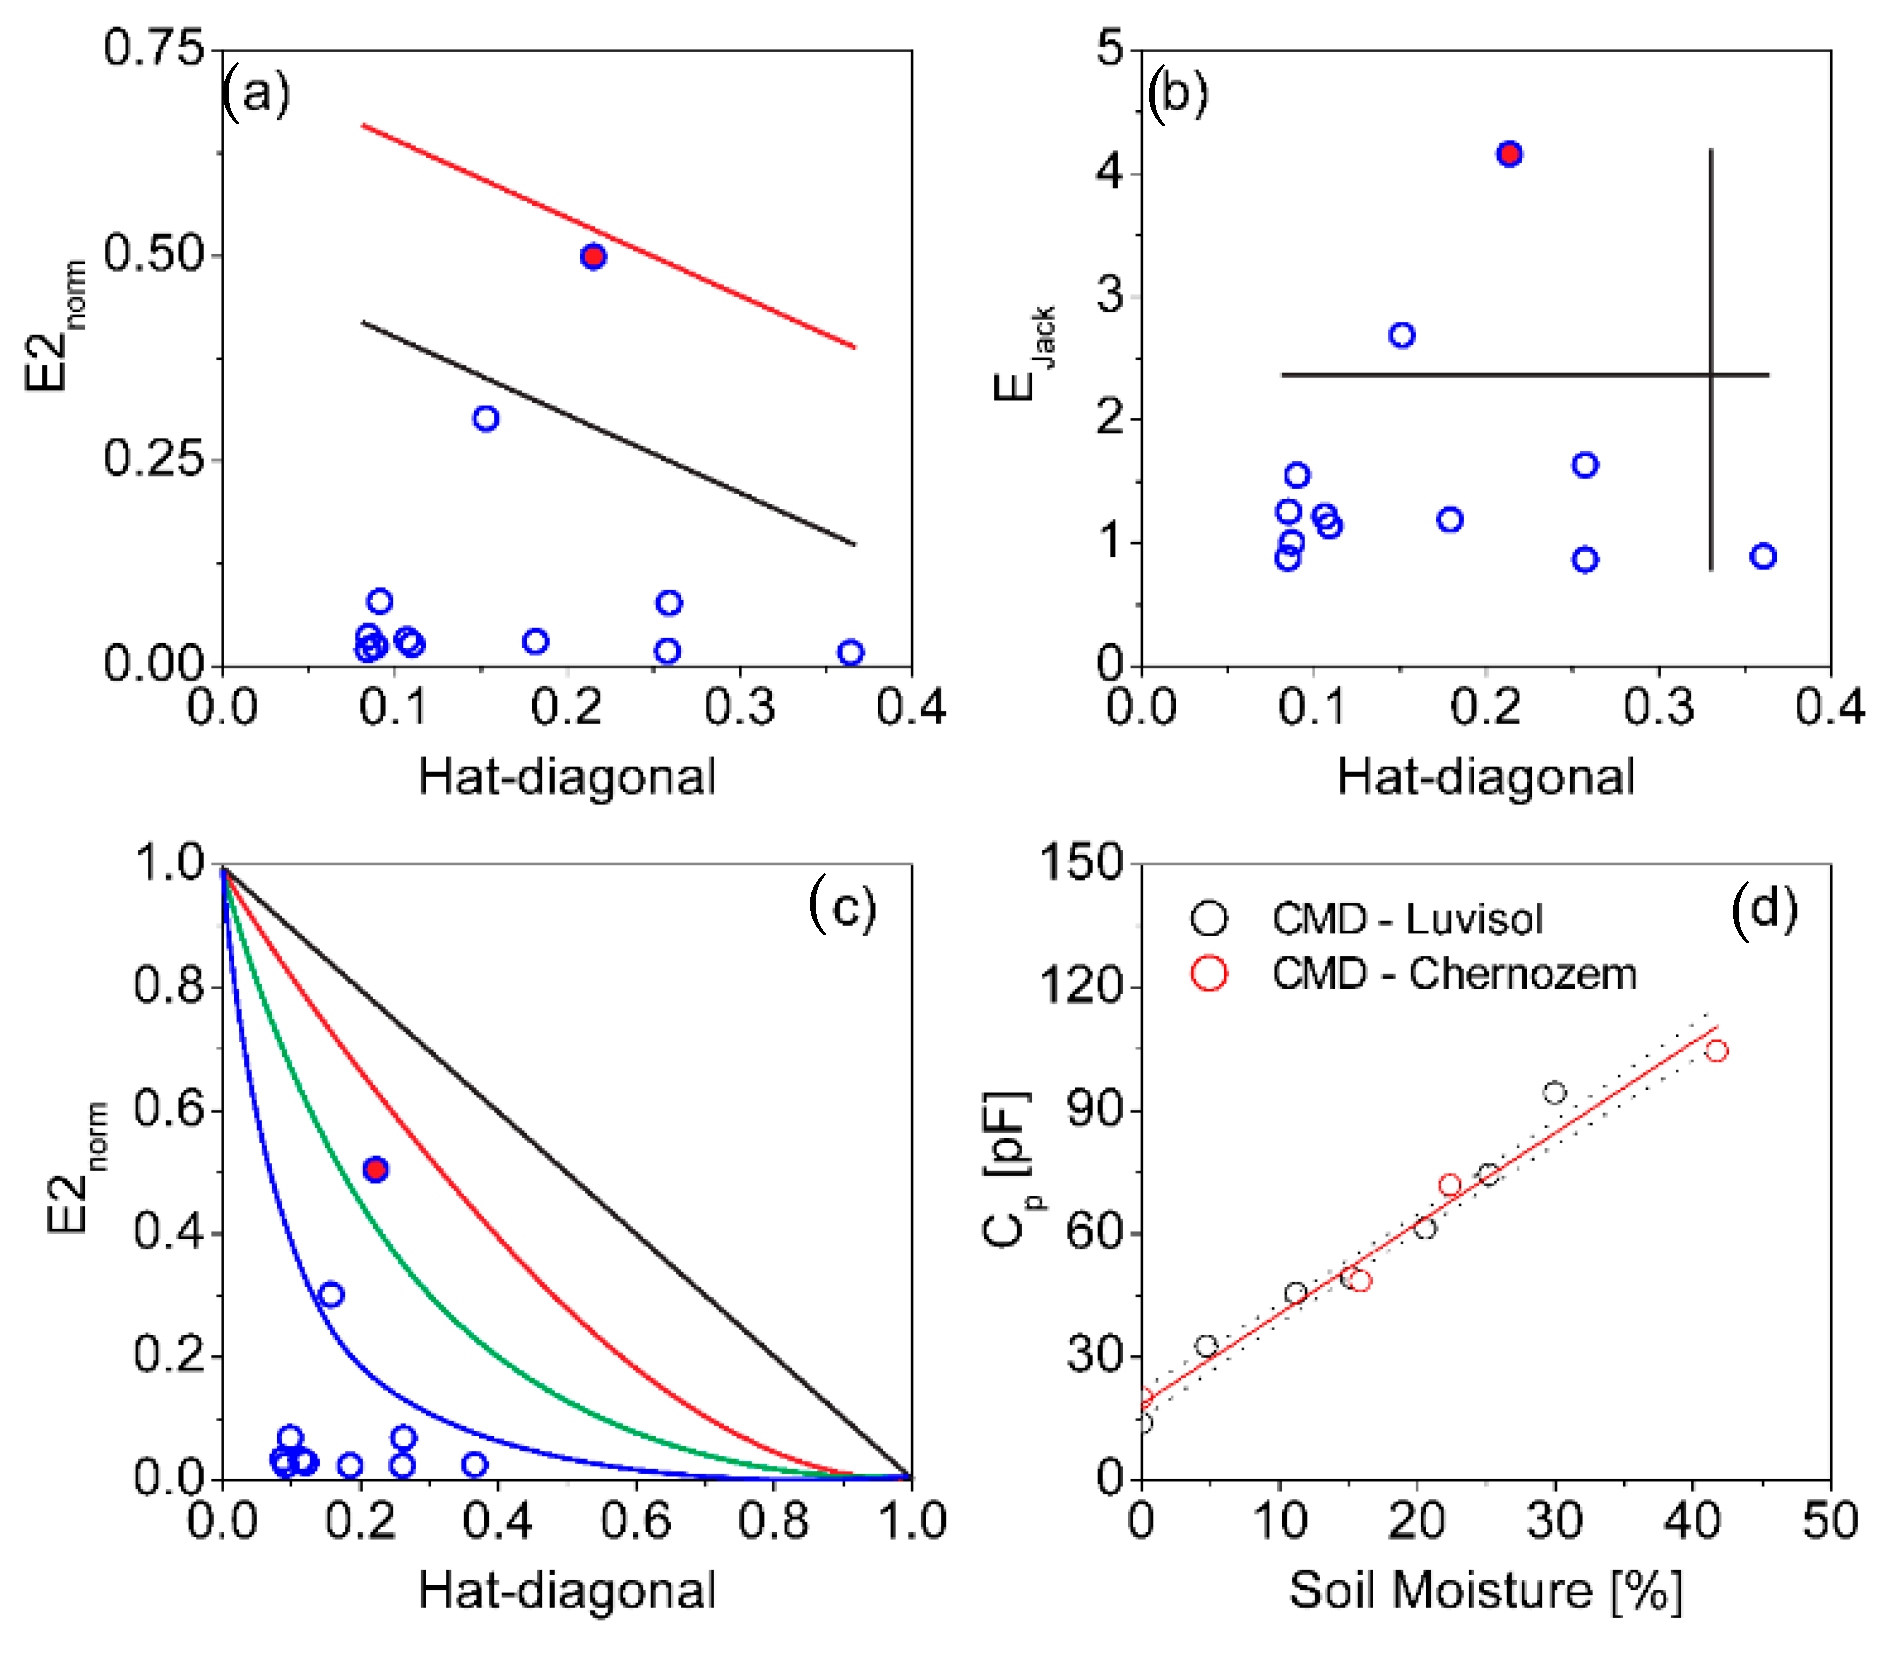
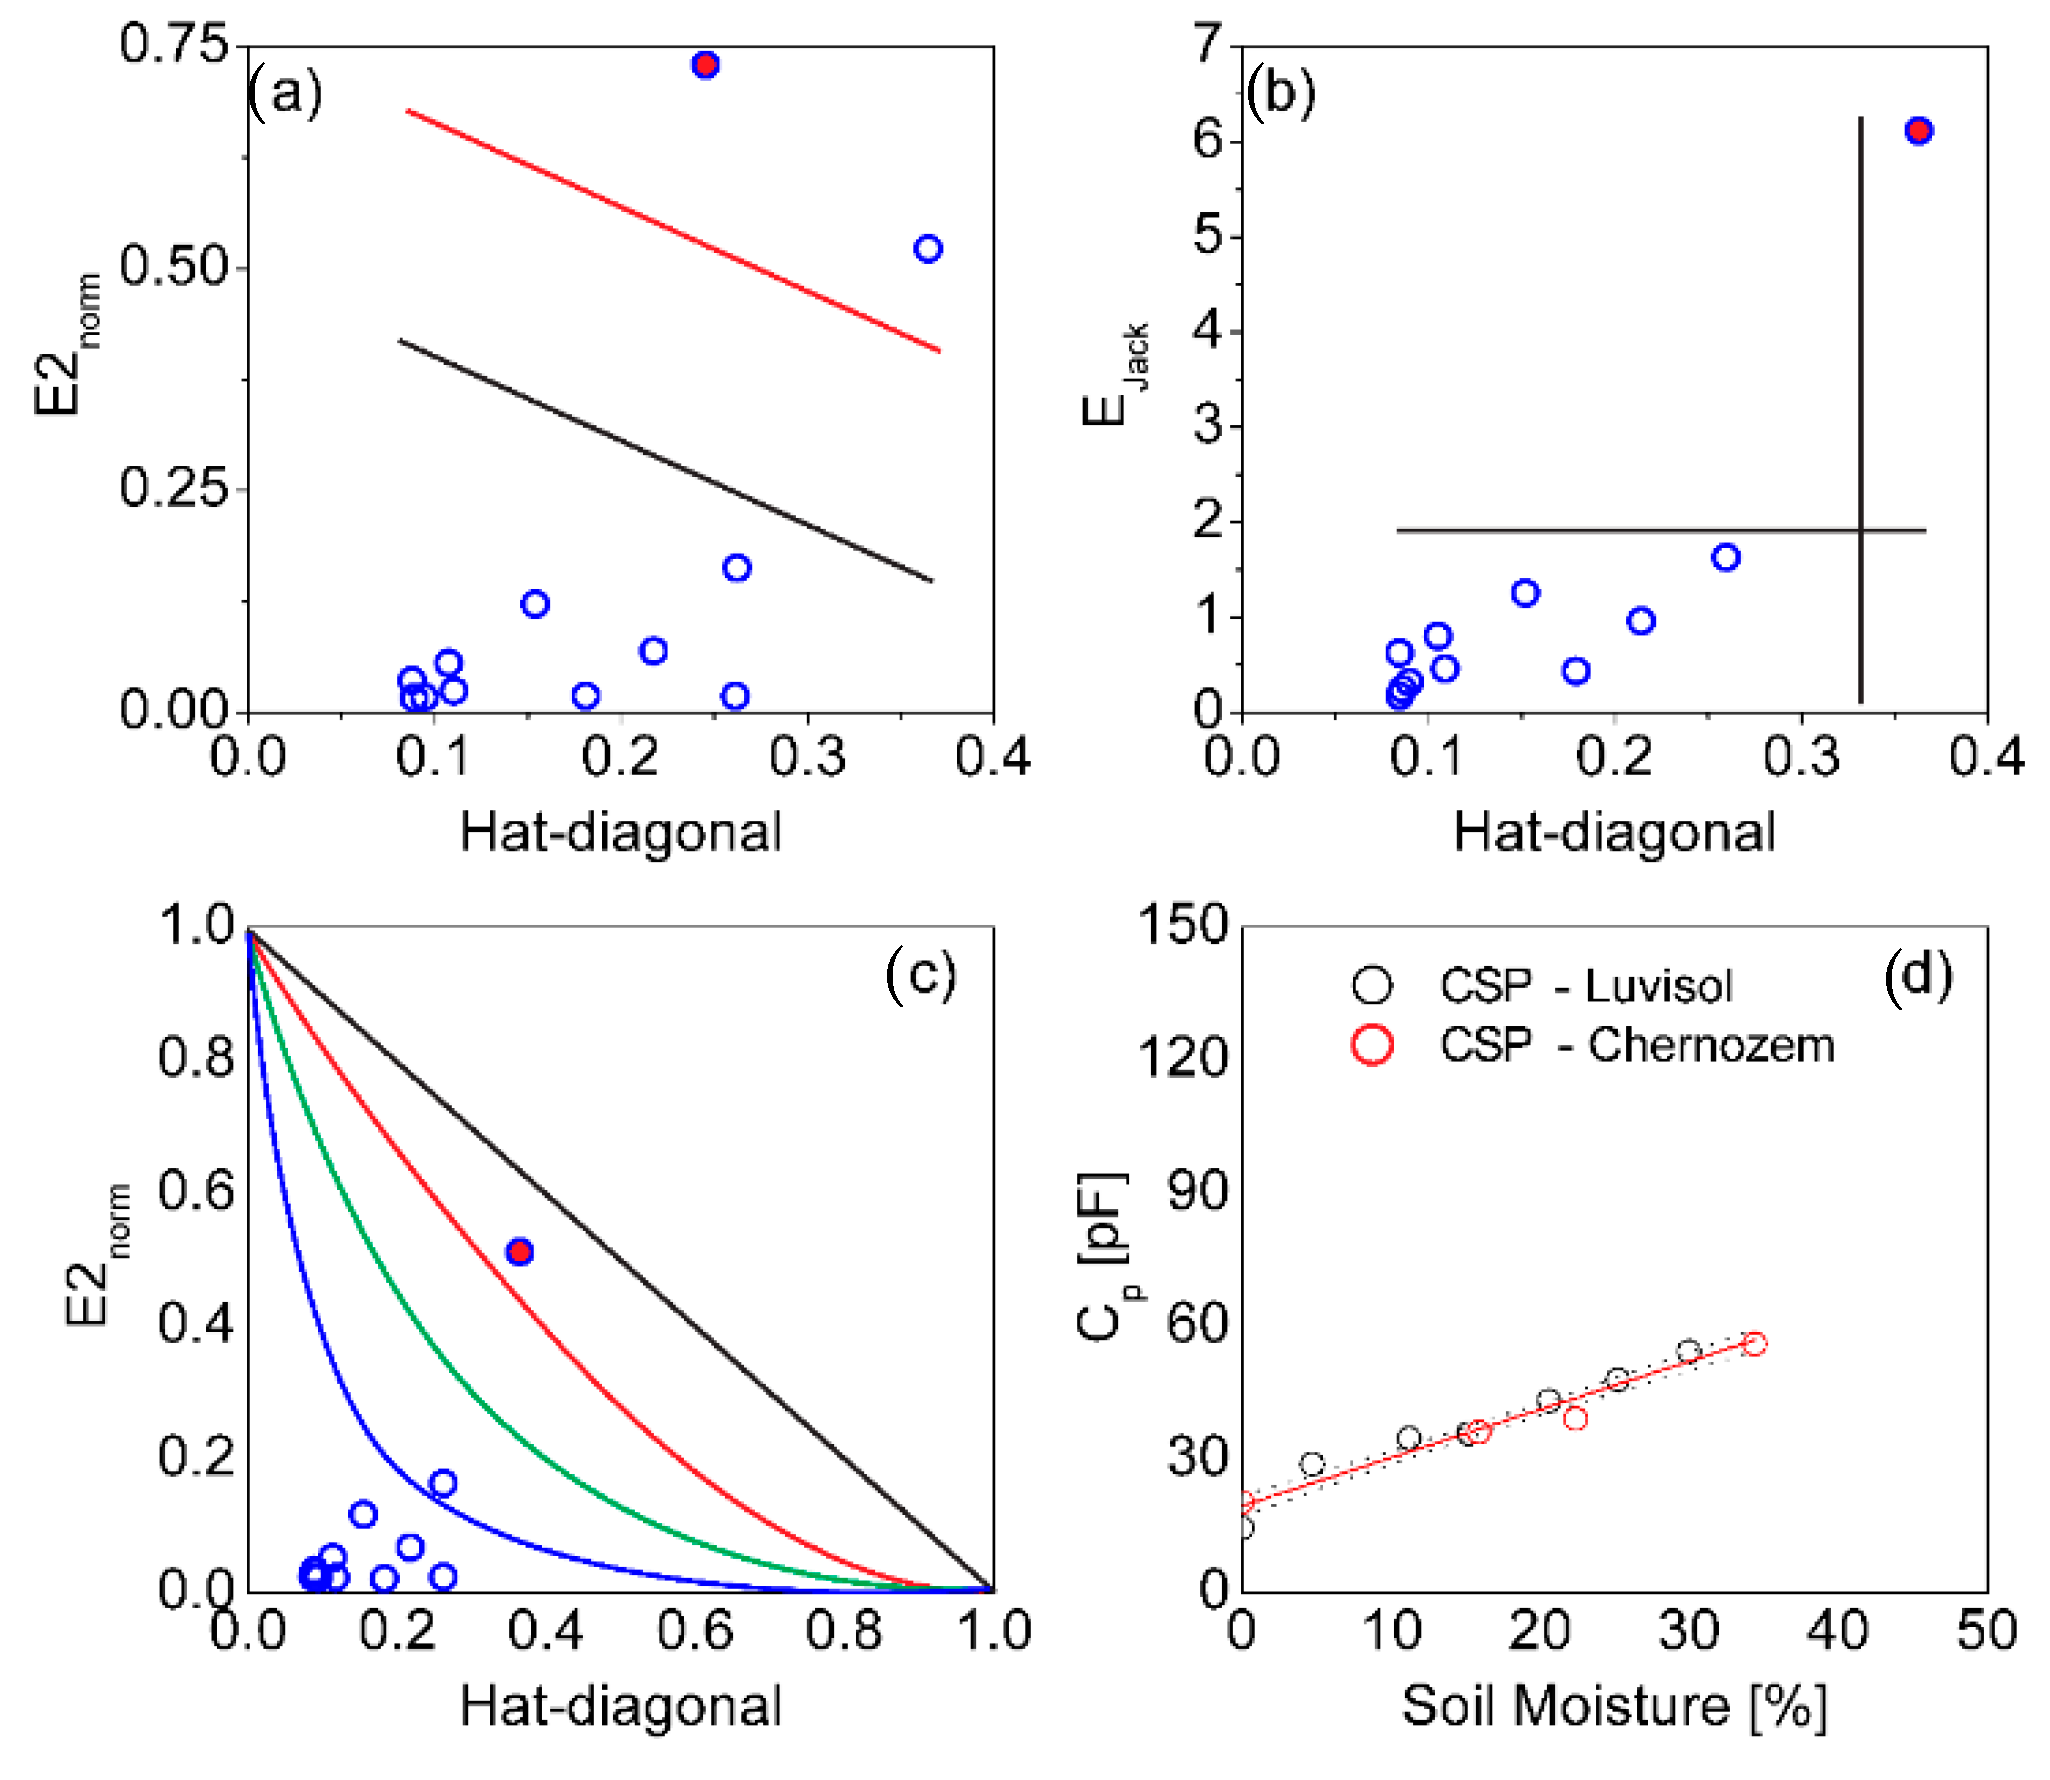
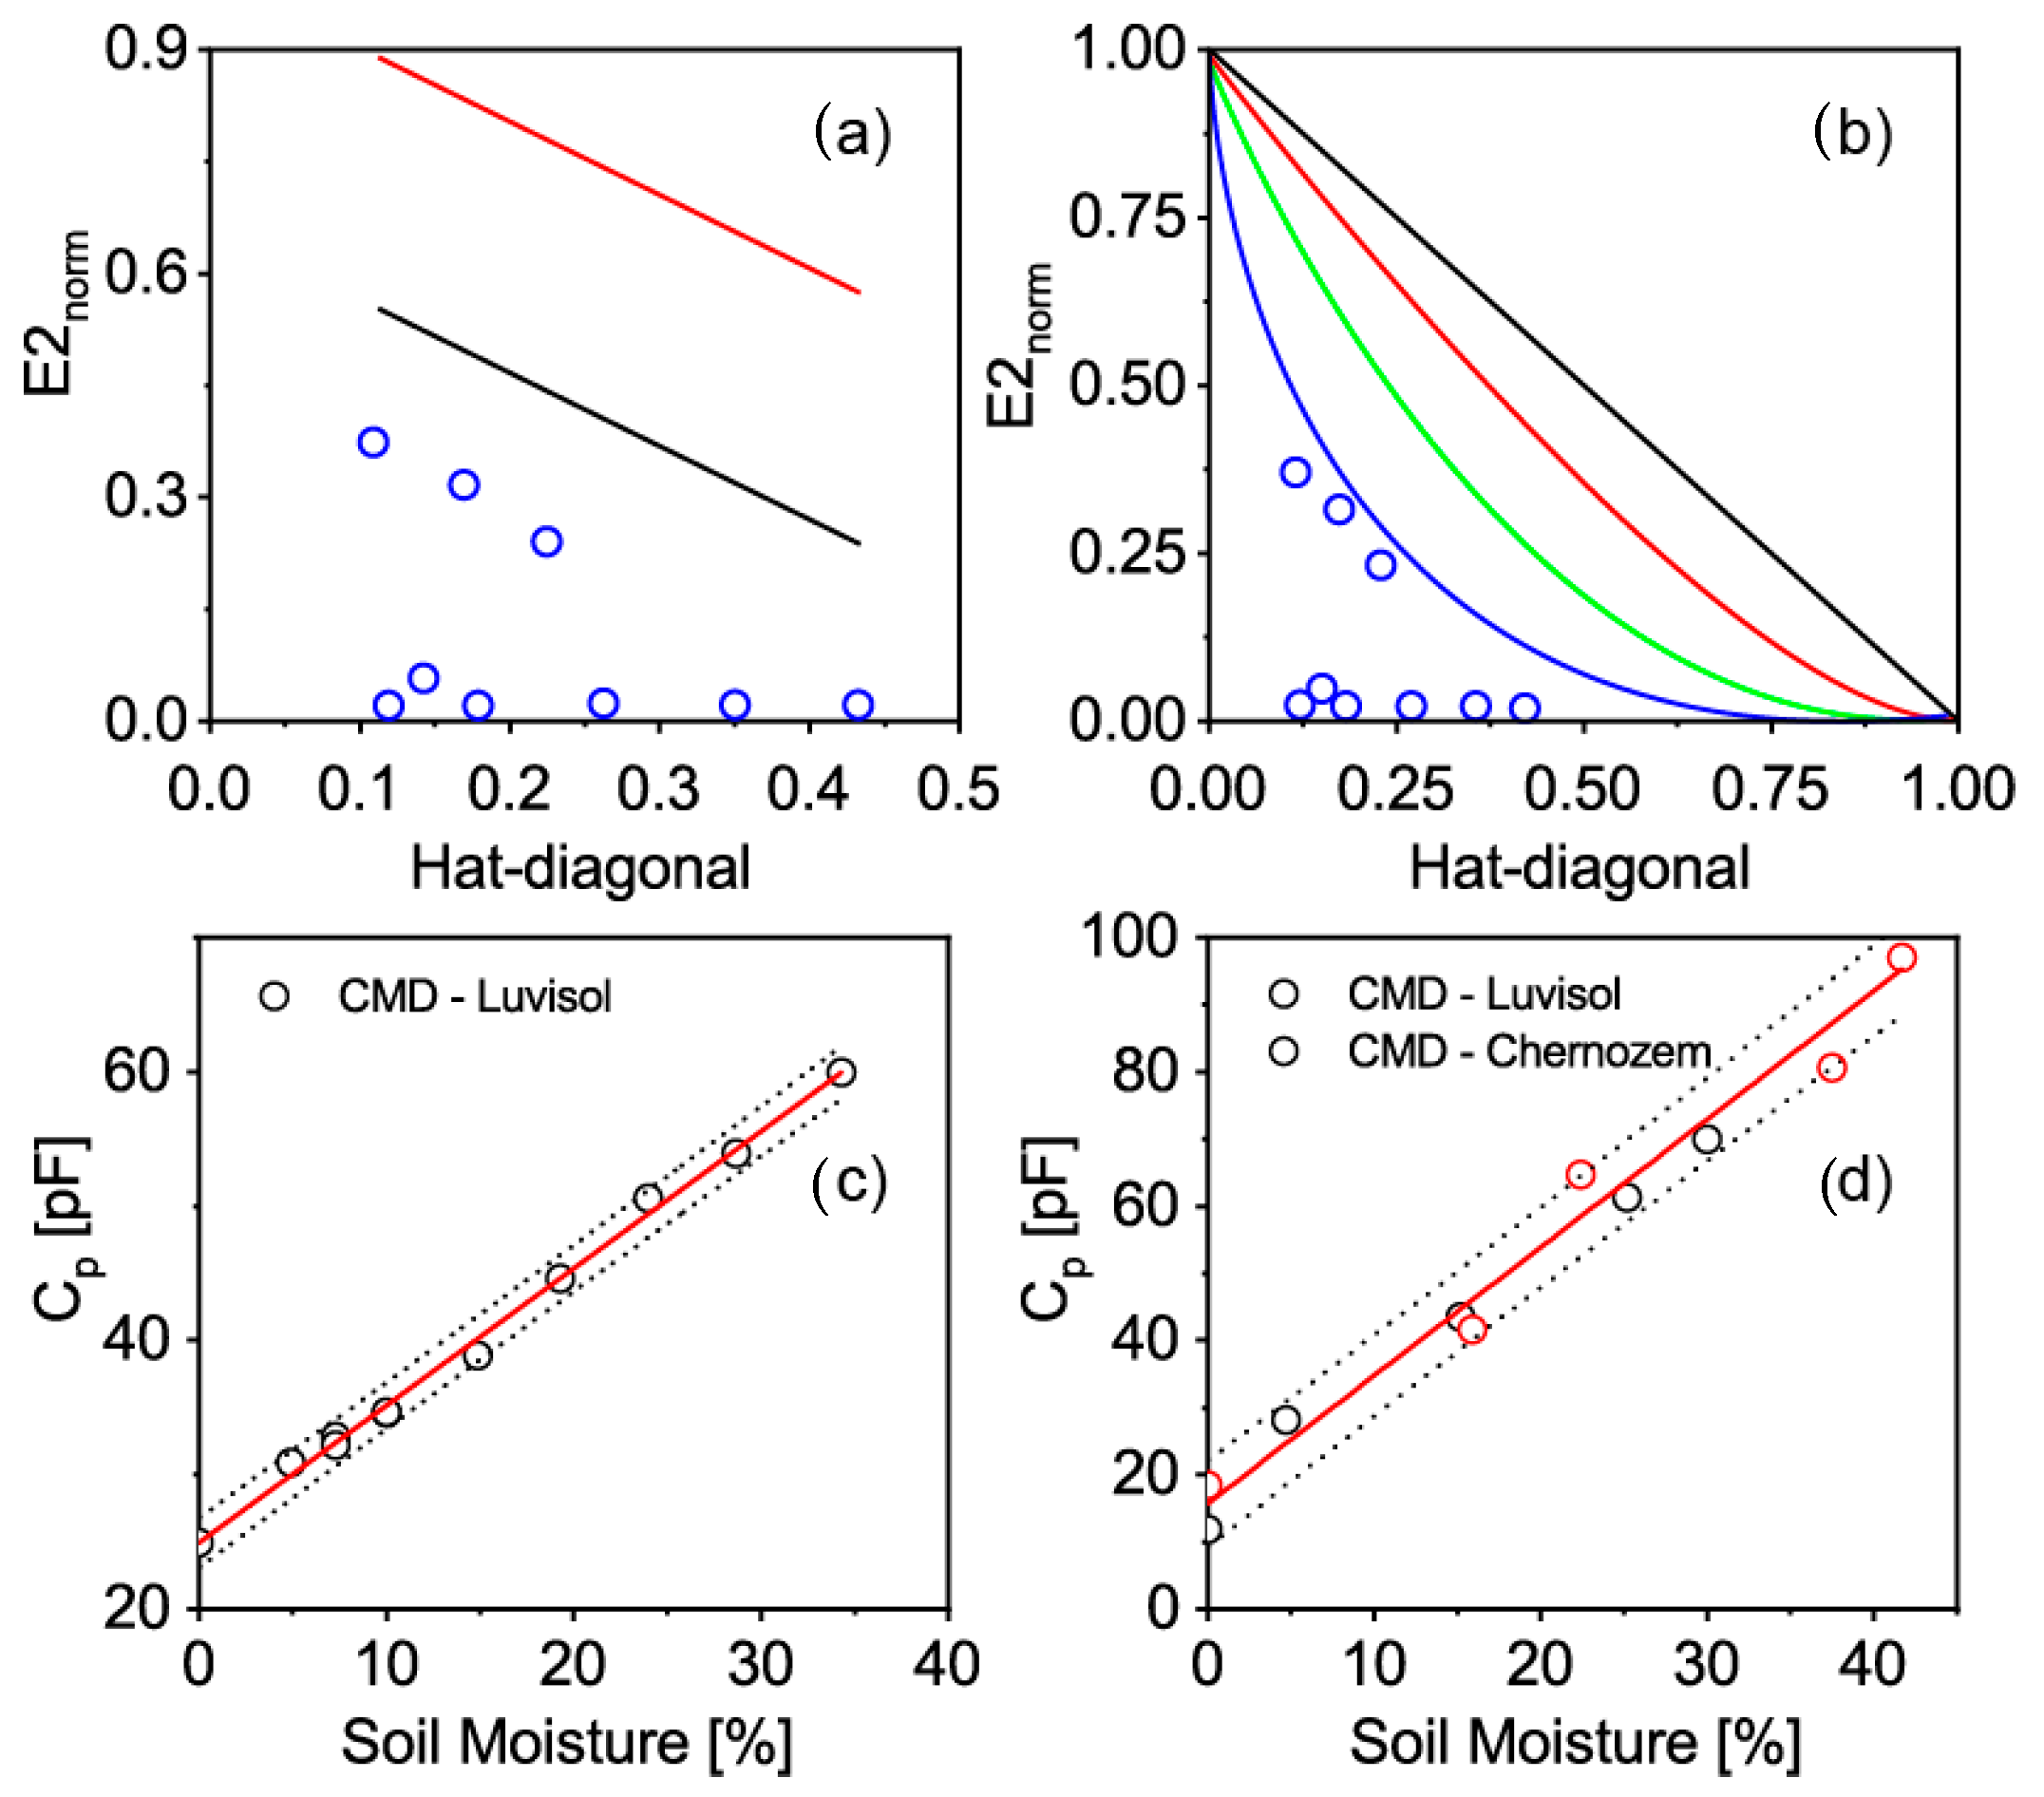
3.2. Regression Analysis of Sensing Characteristics of Soil Moisture Sensor Elements

In the first set of experiments, the determination of sensing characteristics in Luvisol soil was performed. To determine the dependence of sensor element capacity to soil moisture, regression analysis was used. From the graphs in Figure 6, it is obvious that all the sensors have linear trends. The variation coefficients of all individual datasets for each soil moisture level were <0.05. Based on statistical analysis using QC Expert software, it could be concluded that found models are statistically significant, including slopes and intercepts (Table 2). The estimated slope, which corresponds to sensor sensitivity, was highest for the Cu sensor, but the difference to the AGS sensor is not statistically significant. The sensitivity of CMD is about 20% lower in comparison to the Cu sensor element. The determination coefficient has high values for all regressions. The residuals have a normal distribution and there is no presence of outlier points controlled within Pregibon, William, and the L-R plot. The residuals for regression of both sensors have normal distribution according to the Jarque–Berr test. There is no autocorrelation of residuals according to Durbin–Watson and Wald tests. No residue trend was found in the data either.
All sensors were also analyzed in soil type Chernozem. Chernozem generally has a higher ability to absorb water; therefore, there is the possibility of preparing a mixture up to 45% of VWC. From the obtained results, it could be concluded that all regression models were statistically significant according to the Fisher–Snedecor test. The residuals have a normal distribution and there is no presence of outlier points except CSP dataset. For the given dataset within Pregibon, William and the L-R plot were used to identify and remove outlier and regression was performed again. The regression residuals have normal distribution according to the Jarque–Berr test. There are no autocorrelations of residuals according to Durbin–Watson and Wald tests. No residue trend was found in the data either. It could be concluded from the regression analysis that results for Chernozem are similar to those for Luvisol. There are no statistically significant differences between the responses of Cu and AGS sensors because their confidence intervals of slopes and intercepts are in the strong overlap. For Chernozem, the CMD sensor has about 33% lower sensitivity than the Cu sensor, but at the same time almost twice as high sensitivity as the CSP sensor.
When the results of calibrations for calculated slopes and intercepts of Luvisol and Chernozem soil types are compared, it is obvious that there are no statistical differences for the estimated parameters for the two given soils and selected sensors (Table 3). The analysis for the combined datasets of both soil types confirms that all estimated models are statistically significant according to the Fisher–Snedecor test. Statistical analysis proves that the models for the Cu sensor element and AGS element are statistically identical and, therefore, there is no difference in terms of sensitivity between the printed sensors using Ag ink formulation and etched Cu sensor elements. In the given datasets for Cu and AGS, the residuals have a normal distribution and there is no presence of outlier points, controlled within Pregibon, William, and the L-R plot. The residuals for regression of both sensors have normal distribution according to the Jarque–Berr test. There is no autocorrelation of residuals according to Durbin–Watson and Wald tests.
It was concluded for datasets of CMD that the model is statistically significant according to the Fisher–Snedecor test. Residuals have a normal distribution and there is one outlier point controlled within Pregibon, William, and the L-R plot (Figure 7). The residuals for regression have normal distribution according to the Jarque–Berr test and there is no autocorrelation of residuals according to Durbin–Watson and Wald tests.
According to given data filtering, one point was rejected and a new regression analysis was made. That allowed for the building of a more precise regression model, where much better agreement of the fit test was confirmed by the coefficient of determination (0.972 vs. 0.925). The mean error of prediction (MEP) is significantly lower, too (37.2 vs. 80.5). The calculated model for the CSP sensor element is statistically significant according to the Fisher–Snedecor test. In the given dataset for CSP, residuals have a normal distribution and there is one outlier and extreme point at the same time, identified by Pregibon, William, and the L-R plot (Figure 8). The residuals for regression have normal distribution according to the Jarque–Berr test and there is no autocorrelation of residuals according to Durbin–Watson and Wald tests. According to residual analysis, data filtering was performed, and the outlier was removed. A new regression analysis with a reduced dataset was made, where a suitability of fit test allowed for a more precise model to be build. The coefficient of determination increased (0.949 vs. 0.747), while the MEP was significantly lower (10.9 vs. 71.8).
Valid mathematical models for all realized sensors were estimated by linear regression analysis. A key parameter characterizing the sensory properties is the slope of the linear regression, which directly defines the sensitivity of the sensor. From results shown in Table 3, it is obvious that the most sensitive are Cu and AGS sensors. Generally less sensitive were carbon-based sensors, where the CMD sensor has more than two times higher slope in comparison to CSP and therefore is more sensitive to soil moisture. It is clear from the data that the CMD sensor has only about 20/18% smaller slope/sensitivity in comparison to Cu/AGS sensor. This decrease of sensitivity is still very well acceptable, especially under consideration, that given carbon-based material enables printing of metal-free, environmentally friendly sensors in combination with suitable recyclable printing substrate.

3.3. Sensing Characteristics of FR4 and Plank Wood CMD Sensor Using IoT Measuring Unit

For the sustainable production of environmentally friendly soil probes, the most attractive of the tested variants is the CMD sensor element. For this reason, measurement of soil moisture using the IoT unit is demonstrated. To develop the most environmentally friendly sensor elements, the CMD sensors were printed on a common spruce plank wood substrate with dimensions of 300 mm × 58 mm × 11 mm. The surface of the plank was not improved before printing, only additional drying (at 50 °C for 12 h) and cleaning with ethanol was performed. The printing conditions were the same as for the FR4 substrate (pressure 250 kPa, speed 300 mm/min), as well as drying conditions (120 °C for 60 min). After printing the sensor element, the entire probe was encapsulated from all sides with polyurethane protective varnish to prevent the absorption of water into the plank. The protective layer was dried at 25 °C for 24 h. The measured data were again combined for both types of soil and a regression analysis was performed.
Datasets obtained by measurement using the IoT unit were combined for Luvisol and Chernozem. The linear regression and residual analysis identified that there is one outlier in data for the CMD sensor on both the FR4 and wood plank substrate, identified by Pregibon, William, and the L-R plot. A new regression analysis was performed after filtering the data, and it could be concluded that the resulting model is statistically significant including slope 1.9 (0.1) and intercept 15.7 (2.2). The determination coefficient reaches the value 0.981. For the CMD sensor printed on a wood plank, the estimated slope was 1.0 (0.1) and intercept 24.9 (0.5). The determination coefficient has a high value of 0.996. The residuals for both regressions have a normal distribution with the Jarque–Berr test and autocorrelation of residuals is not present according to Durbin–Watson and Wald tests. For CMD sensor on wood plank substrate, it is obvious from Pregibon (Figure 9a), William, and the L-R plot (Figure 9b) that data do not contain outliers after filtration. Based on the comparison of the estimated roots of both regression model datasets, it is clear that these models differ in slope and intercept values. This is probably due to the different dielectric properties of both printing substrates. There is a difference in the estimated values of the CMD sensor capacitance on the FR4 substrate when compared to the measurement data from the LCR meter and IoT unit. This deviation is probably caused by a simpler measurement circuit in the IoT unit, which could affect the absolute measurement values of capacitance. However, this could be diminished by using a proper calibration routine. Overall, using the dataset obtained from the IoT unit, it is possible to make a good quality calibration model for the measurement of moisture in the soil in the terrain, even for an environmentally friendly CMD wood plank-based sensor.

4. Conclusions

In the presented study, we developed an additively produced probe for measuring soil moisture leading to inexpensive, material-, and energy-efficient production. The probe was equipped with a detachable electronic measuring and communication IoT unit. Four types of capacitive sensor elements were printed on planar glass–epoxy substrates forming the main body of the probe: the first type chemically etched from copper foil (Cu), the second type printed from silver paste (AGS), and the last two types printed from carbon-based material either with a smaller thickness (CSP) or a higher thickness (CMD). In addition, the CMD sensor element was also printed on a wood plank as a fully environmentally friendly probe solution. All sensors were characterized by their response to moisture in real soil samples. Based on the performed regression analysis, it can be concluded that the Cu- and AGS-based sensor elements exhibit the highest sensitivity to soil moisture. The CMD-based sensor is approximately 18% less sensitive, which in general still exhibits a high response to soil moisture in a more environmentally friendly design. The lowest sensitivity was found in the CSP sensor element due to its excessive resistance. Finally, the successful implementation of the CMD sensor on a wooden plank substrate was demonstrated. It can be concluded that an additively manufactured carbon-based sensor made using a printing technique on an environmentally friendly wood plank substrate is able to replace conventional types of sensor elements made using Cu photolithography on a glass–epoxy substrate. However, in order to ensure the long-term stability and endurance of the wood substrate in the soil, thorough insulation is required, e.g., with a protective varnish. These aspects will be the subject of further in-depth research in the future.

Author Contributions

Conceptualization, T.S. and L.M.; methodology, L.M.; software, T.S., L.M., R.V., J.Č.; validation, R.V., S.P. and J.Č.; sensor fabrication, printed T.S., L.S., etched R.V. and S.P., writing—original draft preparation, T.S., L.M., R.V. and S.P.; writing—review and editing, all authors.; project administration, L.M.; funding acquisition, L.M., T.S., A.H., L.K. All authors have read and agreed to the published version of the manuscript.

Funding

The paper was created with the support of the project Ministry of Agriculture of the Czech Republic NAZV QK1810010 “SmartField”.

Conflicts of Interest

The authors declare no conflict of interest.

References

  1. Khan, Y.; Thielens, A.; Muin, S.; Ting, J.; Baumbauer, C.; Arias, A.C. A new frontier of printed electronics: Flexible hybrid electronics. Adv. Mater. 2020, 32, 1905279. [Google Scholar] [CrossRef] [PubMed]
  2. Välimäki, M.K.; Sokka, L.I.; Peltola, H.B.; Ihme, S.S.; Rokkonen, T.M.J.; Kurkela, T.J.; Ollila, J.T.; Korhonen, A.T.; Hast, J.T. Printed and hybrid integrated electronics using bio-based and recycled materials—Increasing sustainability with greener materials and technologies. Int. J. Adv. Manuf. Technol. 2020, 111, 325–339. [Google Scholar] [CrossRef]
  3. Janeczek, K. Composite materials for printed electronics in internet of things applications. Bull. Mater. Sci. 2020, 43, 124. [Google Scholar] [CrossRef]
  4. Le Borgne, B.; Chung, B.-Y.; Tas, M.O.; King, S.G.; Harnois, M.; Sporea, R.A. Eco-friendly materials for daily-life inexpensive printed passive devices: Towards “Do-It-Yourself” electronics. Electronics 2019, 8, 699. [Google Scholar] [CrossRef] [Green Version]
  5. Kim, T.; Bao, C.; Hausmann, M.; Siqueira, G.; Zimmermann, T.; Kim, W.S. 3D Printed disposable wireless ion sensors with biocompatible cellulose composites. Adv. Electron. Mater. 2019, 5, 1800778. [Google Scholar] [CrossRef]
  6. Kamarudin, S.F.; Mustapha, M.; Kim, J.-K. Green strategies to printed sensors for healthcare applications. Polym. Rev. 2020, 1–41. [Google Scholar] [CrossRef]
  7. Khosla, A.; Arya, S.; Nagahara, L.A.; Thundat, T.; Kawakami, M.; Furukawa, H. Additive manufacturing: Sustainable manufacturing of flexible sensors, systems and devices. In ECS Meeting Abstracts; IOP Publishing: Bristol, UK, 2020; p. 2200. [Google Scholar]
  8. Khanna, A.; Kaur, S. Evolution of internet of things (IoT) and its significant impact in the field of precision agriculture. Comput. Electron. Agric. 2019, 157, 218–231. [Google Scholar] [CrossRef]
  9. Talavera, J.M.; Tobón, L.E.; Gómez, J.A.; Culman, M.A.; Aranda, J.M.; Parra, D.T.; Quiroz, L.A.; Hoyos, A.; Garreta, L.E. Review of IoT applications in agro-industrial and environmental fields. Comput. Electron. Agric. 2017, 142, 283–297. [Google Scholar] [CrossRef]
  10. Navarro, E.; Costa, N.; Pereira, A. A systematic review of IoT solutions for smart farming. Sensors 2020, 20, 4231. [Google Scholar] [CrossRef]
  11. Loučka, R.; Homolka, P.; Jančík, F.; Koukolová, V.; Kubelková, P.; Tyrolová, Y.; Výborná, A.; Jambor, V.; Vosynková, B.; Nerušil, P.; et al. Precision farming to better results in nutrition. In Elements of Precision Agriculture in Livestock Farming; Institute of Animal Science: Prague, Czech Republic, 2019. [Google Scholar]
  12. Menšík, L.; Nerušil, P.; Míka, V.; Loučka, R.; Jambor, V. History and current use of near-infrared Spectroscopy (NIRS) for the analysis of forage and preserved feed at grasland research station Jevíčko in the Czech Republic. In Proceedings of the 18th International Symposium Forage Conservation, Brno, Czech Republic, 13–16 August 2019. [Google Scholar]
  13. Codeluppi, G.; Cilfone, A.; Davoli, L.; Ferrari, G. LoRaFarM: A LoRaWAN-based smart farming modular IoT architecture. Sensors 2020, 20, 2028. [Google Scholar] [CrossRef] [Green Version]
  14. García, L.; Parra, L.; Jimenez, J.M.; Lloret, J.; Lorenz, P. IoT-based smart irrigation systems: An overview on the recent trends on sensors and IoT systems for irrigation in precision agriculture. Sensors 2020, 20, 1042. [Google Scholar] [CrossRef] [PubMed] [Green Version]
  15. Shi, X.; An, X.; Zhao, Q.; Liu, H.; Xia, L.; Sun, X.; Guo, Y. State-of-the-art internet of things in protected agriculture. Sensors 2019, 19, 1833. [Google Scholar] [CrossRef] [PubMed] [Green Version]
  16. Su, S.L.; Singh, D.N.; Baghini, M.S. A critical review of soil moisture measurement. Measurement 2014, 54, 92–105. [Google Scholar] [CrossRef]
  17. Serrano, D.; Ávila, E.; Barrios, M.; Darghan, A.; Lobo, D. Surface soil moisture monitoring with near-ground sensors: Performance assessment of a matric potential-based method. Measurement 2020, 155, 107542. [Google Scholar] [CrossRef]
  18. Cooper, J.D. Soil Water Measurement: A Practical Handbook; John Wiley & Sons: Hoboken, NJ, USA, 2016. [Google Scholar]
  19. Quinones, H.; Ruelle, P.; Nemeth, I. Comparison of three calibration procedures for TDR soil moisture sensors. Irrig. Drain. 2003, 52, 203–217. [Google Scholar] [CrossRef]
  20. Deng, X.; Gu, H.; Yang, L.; Lyu, H.; Cheng, Y.; Pan, L.; Fu, Z.; Cui, L.; Zhang, L. A method of electrical conductivity compensation in a low-cost soil moisture sensing measurement based on capacitance. Measurement 2020, 150, 107052. [Google Scholar] [CrossRef]
  21. González-Teruel, J.D.; Torres-Sánchez, R.; Blaya-Ros, P.J.; Toledo-Moreo, A.B.; Jiménez-Buendía, M.; Soto-Valles, F. Design and calibration of a low-cost SDI-12 soil moisture sensor. Sensors 2019, 19, 491. [Google Scholar] [CrossRef] [Green Version]
  22. Protim Goswami, M.; Montazer, B.; Sarma, U. Design and characterization of a fringing field capacitive soil moisture sensor. IEEE Trans. Instrum. Meas. 2019, 68, 913–922. [Google Scholar] [CrossRef]
  23. Chakraborty, M.; Malkani, A.; Biswas, K. Hand-held soil moisture meter using polymer coated sensor. IEEE Instrum. Meas. Mag. 2019, 22, 24–29. [Google Scholar] [CrossRef]
  24. Pichorim, S.F.; Gomes, N.J.; Batchelor, J.C. Two solutions of soil moisture sensing with RFID for landslide monitoring. Sensors 2018, 18, 452. [Google Scholar] [CrossRef] [Green Version]
  25. da Fonseca, N.S.S.M.; Freire, R.C.S.; Batista, A.; Fontgalland, G.; Tedjini, S. A passive capacitive soil moisture and environment temperature UHF RFID based sensor for low cost agricultural applications. In Proceedings of the 2017 SBMO/IEEE MTT-S International Microwave and Optoelectronics Conference (IMOC), Aguas de Lindoia, Brazil, 27–30 August 2017; pp. 1–4. [Google Scholar]
  26. Schubert, M.J.W.; Seign, S.; Dai, Q.; Hinterseer, S.; Pielmeier, F.; Pietsch, A.; Seebauer, C.; Weiß, J.; Yu, C.; Zenger, S. Capacitive sensor technology for soil moisture monitoring networks. In Proceedings of the 2017 24th IEEE International Conference on Electronics, Circuits and Systems (ICECS), Batumi, Georgia, 5–8 December 2017; pp. 190–193. [Google Scholar]
  27. Shirahama, Y.; Shigeta, R.; Kawahara, Y.; Asami, T.; Kojima, Y.; Nishioka, K. Implementation of wide range soil moisture profile probe by coplanar plate capacitor on film substrate. In Proceedings of the 2015 IEEE SENSORS, IEEE, Busan, Korea, 1–4 November 2015; pp. 1–4. [Google Scholar]
  28. Kojima, Y.; Shigeta, R.; Miyamoto, N.; Shirahama, Y.; Nishioka, K.; Mizoguchi, M.; Kawahara, Y. Low-cost soil moisture profile probe using thin-film capacitors and a capacitive touch sensor. Sensors 2016, 16, 1292. [Google Scholar] [CrossRef] [PubMed]
  29. Dean, R.N.; Rane, A.K.; Baginski, M.E.; Richard, J.; Hartzog, Z.; Elton, D.J. A Capacitive fringing field sensor design for moisture measurement based on printed circuit board technology. IEEE Trans. Instrum. Meas. 2012, 61, 1105–1112. [Google Scholar] [CrossRef]
  30. Shigeta, R.; Kawahara, Y.; Goud, G.D.; Naik, B.B. Capacitive-touch-based soil monitoring device with exchangeable sensor probe. In Proceedings of the 2018 IEEE SENSORS, New Delhi, India, 28–31 October 2018; pp. 1–4. [Google Scholar]
  31. Artigas, J.; Jimenez, C.; Lemos, S.G.; Nogueira, A.R.A.; Torre-Neto, A.; Alonso, J. Development of a screen-printed thick-film nitrate sensor based on a graphite-epoxy composite for agricultural applications. Sens. Actuators B Chem. 2003, 88, 337–344. [Google Scholar] [CrossRef]
  32. Kim, S.; Traille, A.; Lee, H.; Aubert, H.; Yoshihiro, K.; Georgiadis, A.; Collado, A.; Tentzeris, M.M. Inkjet-printed sensors on paper substrate for agricultural applications. In Proceedings of the 2013 European Microwave Conference, Nuremberg, Germany, 6–10 October 2013; pp. 866–869. [Google Scholar]
  33. Atkinson, J.K.; Sophocleous, M. A novel thick-film screen printed electrical conductivity sensor for measurement of liquid and soil conductivity. In Proceedings of the Sensors, 2014 IEEE, Valencia, Spain, 2–5 November 2014; pp. 86–89. [Google Scholar]
  34. Rêgo Segundo, A.K.; Silva Pinto, É.; Almeida Santos, G.; de Barros Monteiro, P.M. Capacitive impedance measurement: Dual-frequency approach. Sensors 2019, 19, 2539. [Google Scholar] [CrossRef] [Green Version]
  35. WRB, I.W.G. World reference base for soil resources 2014. International soil classification system for naming soils and creating legends for soil maps. In World Soil Resources Report; Food and Agriculture Organization of the United Nations: Rome, Italy, 2014; p. 106. [Google Scholar]
  36. Němeček, J.; Mühlhanselová, M.; Macků, J.; Vavříček, D.; Novák, P. Czech Taxonomic Soil Classification System; Czech University of Life Sciences: Praha-Suchdol, Czech Republic, 2011. [Google Scholar]
  37. Meloun, M.; Militký, J. A Compendium of Statistical Data Processing, 3rd ed.; Karolinum: Prague, Czech Republic, 2012. [Google Scholar]
Figure 1. IoT electronic measuring unit.
Chemosensors 08 00125 g001
Figure 2. Design of soil probe with printed capacitive moisture sensor.
Chemosensors 08 00125 g002
Figure 3. All soil moisture sensors were calibrated using both the (a) Agilent 4287A RF LCR Meter and (b) the developed Internet of Things (IoT) electronic measuring unit. (c) Image of Cu and printed soil moisture sensors, from left: Cu, AGS, CMD, CSP. (d) Wood plank-based sensor CMD/plank.
Chemosensors 08 00125 g003
Figure 4. SEM images of surfaces of (a) Cu, (b) AGS, (c) CMD, and (d) CSP sensing elements.
Chemosensors 08 00125 g004
Figure 5. (a) Microscope image and (b) cross-section profile of microdispensed thick carbon electrode (CMD).
Chemosensors 08 00125 g005
Figure 6. The regression analysis for Cu, AGS, CSP, CMD sensor elements response for combined data measured in soil types Luvisol and Chernozem.
Chemosensors 08 00125 g006
Figure 7. The residual analysis for CMD sensor element presented by (a) Pregibon, (b) William, and (c) the L-R plot, (d) regression plot after data filtering for CMD sensor and dataset Luvisol + Chernozem.
Chemosensors 08 00125 g007
Figure 8. The residual analysis for CSP sensor element presented by (a) Pregibon, (b) William, and (c) the L-R plot, (d) regression plot after data filtering for CSP sensor and dataset Luvisol + Chernozem.
Chemosensors 08 00125 g008
Figure 9. The residual analysis for CMD sensor element presented by (a) Pregibon, (b) the L-R plot after filtration. Regression analysis for CMD sensor elements response measured with IoT unit: (c) CMD on wood plank and (d) combined data for soil types Luvisol and Chernozem measured for CMD on FR4.
Chemosensors 08 00125 g009
Table 1. The measured characteristics of soil moisture sensor layers.
MaterialThickness (μm)Surface Roughness (µm)Sheet Resistance (Ω)Resistivity (Ω.m)
Cu35.00.3794.68 × 10−41.64 × 10⁻⁸
AGS6.50.8393.61 × 10−22.34 × 10⁻⁷
CSP40.51.2908.743.54 × 10−4
CMD310.01.9701.735.35 × 10−4
CMD/Plank149.32.1503.655.45 × 10−4
Table 2. Slopes and intercepts including their standard deviations (in brackets) estimated separately for various soils and sensor elements.
LuvisolChernozem
InterceptSlopeR2InterceptSlopeR2
Cu12.0 (5.0)3.0 (0.3)0.96011.7 (9.3)2.8 (0.3)0.957
AGS13.2 (5.6)2.7 (0.3)0.95911.7 (9.9)2.7 (0.4)0.947
CMD16.0 (3.2)2.4 (0.2)0.97421.0 (8.4)1.9 (0.3)0.923
CSP19.1 (2.1)1.2 (0.1)0.95419.5 (2.2)1.0 (0.1)0.980
Table 3. Slopes and intercepts including their standard deviations (in brackets) estimated for merged soil data and sensor elements.
Soil Luvisol + ChernozemSoil Luvisol + Chernozem After Data Filtering
InterceptSlopeR2InterceptSlopeR2
Cu12.9 (4.2)2.8 (0.2)0.958Without revision of model
AGS13.4 (4.2)2.7 (0.2)0.953
CMD20.1 (4.1)2.0 (0.2)0.92518.6 (2.6)2.2 (0.1)0.972
CSP22.9 (3.3)0.8 (0.2)0.74716.3 (1.5)0.9 (0.1)0.949
Publisher’s Note: MDPI stays neutral with regard to jurisdictional claims in published maps and institutional affiliations.

