Article

Electrochemical Development of an Immunosensor for Detection Polychlorinated biphenyls (PCBs) for Environmental Analysis

Sensing & Separation Group, School of Chemistry and Life Science Interface, Tyndall National Institute, University College Cork, T12R5CP Cork, Ireland
*
Author to whom correspondence should be addressed.
Submission received: 13 September 2021 / Revised: 20 October 2021 / Accepted: 25 October 2021 / Published: 28 October 2021
(This article belongs to the Special Issue Electrochemical Immunosensor)

Abstract

:
Polychlorinated biphenyls (PCBs) are a highly toxic family of synthetic chemical compounds. PCBs are widely spread in the environment and their toxicity can cause serious ailments to living organisms such as cancer; therefore, developing a device for the detection of PCBs in the environment is significant. In this paper, polyclonal primary anti-PCB antibodies were immobilized onto a gold screen-printed electrode with the purpose of creating an electrochemical immunosensor for the detection of Aroclor 1254. It was modified with 11-mercaptoundecanoic acid (11-MUA) and the activation of the carboxylic acid terminal was performed by cross-linking 1-ethyl-3-(3-dimethylaminopropyl) carbodiimide (EDC) and N-hyrodsuccinmide (NHS) on the electrode surface. Cyclic voltammetry, electrochemical impedance spectroscopy (EIS), linear sweep voltammetry, atomic force microscopy (AFM), scanning electron microscopy (SEM), and contact angle measurement were employed to characterize SAM development on the gold electrode. Using a competitive assay, a 0.09 ng/mL−1 limit of detection and a linear range of 0.101–220 ng/mL−1 were determined. The self-assembled monolayers (SAM) were successful in encapsulating the PCBs on the immunosensor. The electrochemical detection showed better resolution when compared to traditional methods such as the ELISA optical technique. The novel electrochemical immunosensor approach that is discussed in this paper has the potential to offer rapid sample screening in a portable, disposable format and could contribute to the effective control and prevention of PCBs in the environment.

1. Introduction

Polychlorinated biphenyls (PCBs) are a family of artificial organic compounds with two to ten chlorine atoms attached to the biphenyl [1,2]. Since 1929, PCBs have been commercially manufactured under the trade name Aroclor. Aroclor consists of a combination of chlorinated biphenyls, including over 100 different unique PCBs. Congeners are defined and numbered according to the total amount of chlorine in the mixture [
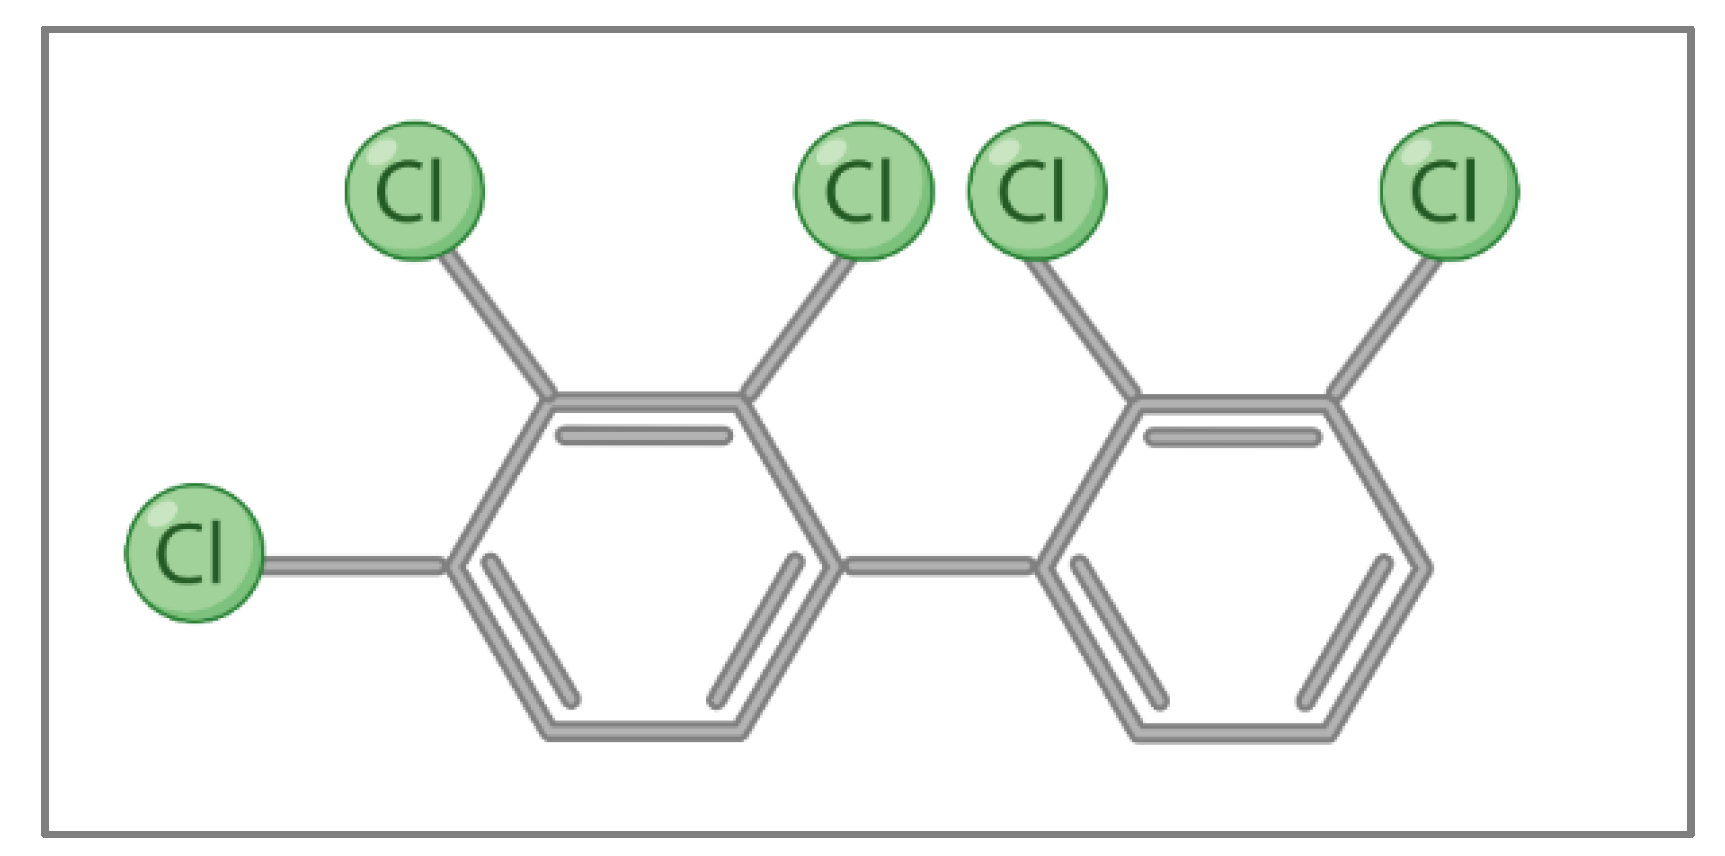
3]. Aroclor 1254 (C12H5Cl5) is one of the commercial products, and it is a viscous, light-yellow liquid with an average molecular weight of 328, containing approximately 21% C12H6Cl4, 48% C12H5Cl5, 23% C12H4Cl6, and 6% C12H3Cl7 with an average chlorine content of 54% [4]. Figure 1 shows the structure of Arcolor 1254.
These compounds have been used as plasticizers, surface coatings, inks, additives for insulating liquids, pesticides, and lubricants [5,6], all of which have contaminated the environment. Further contamination may result from the disposal of obsolete electrical equipment containing PCBs, as well as leaks from industrial sites. Furthermore, PCBs have significant teratogenic, carcinogenic, and mutagenic impacts on the human body. PCBs are persistent in the environment and until today a large proportion of PCBs are still present in old transformers and power capacitors, which have the potential to be released into the environment. PCB congeners also enhance the degree of structural uniformity and chlorination increases. Lastly, the PCBs high stability and lipophilicity nature resulted in them being widely distributed in the world ecosystem. PCBs occur in all environments matrixes and can be found in a variety of environmental media (water, atmosphere, soil, sediment, and creatures) [7,8,9,10]. These chemicals have become a significant danger to the environment and the health and safety of humans. All of these facts make the development of an effective and economical testing method for PCBs very important [11,12].
The methods used to determine PCBs so far are: tandem mass spectrometry [13,14], bioanalytical techniques [15], and spectral analysis [16]. These methods, although sensitive, are generally time-consuming and expensive and typically require sample preparation before the chromatographic separation [17,18]. On the other hand, electrochemical techniques have been utilized in a variety of prospective applications and environmental research due to their relative advantages, such as low costs, easy operation, and fast response.
Only a few papers have been published to date that are based on electrochemical immunosensors for PCBs [19,20]. All of these have used modified materials to enhance the immobilization of antibodies, such as nanoparticles [19,21,22,23], self-assembled monolayers (SAM), including [24,25] cysteamine [26] and 11-mercaptoundecanoic acid (11-MUA) [24].
SAM is typically formed by activating the carboxylic acid groups with [1-ethyl-3-(3-dimethylaminopropyl) carbodiimide] (EDC) in conjunction with N-hydroxy succinimide (NHS) before protein immobilization through the use of an alkylthiol reaction [27]. This reaction decreases the random orientation of the antibodies that bind the surface proteins to the carboxylic acid end-groups enhancing the immunosensor sensitivity and selectivity [24,28]. Research has shown that SAM forms better on a gold surface [29,30,31] as the gold strongly absorbs the protein molecules and creates a hydrophobic interaction through the strong S–Au bonds [32,33]. This facilitates the immobilization of the desired protein on the specific target area and limits non-specific binding [34]. Electrode surfaces provide no sites for covalent bonding, making it necessary to coat a thin film of functional groups to covalently bond with the amino groups of the used antibodies [35]. In this research paper, the anti-PCB were compounded onto the chip (made of the gold sensor) by covalent coupling technique and with the aid of [1-ethyl-3-(3-dimethylamino propyl) carbodiimide] (EDC) in collaboration with NHS N-hydroxy succinimide [36,37]. 
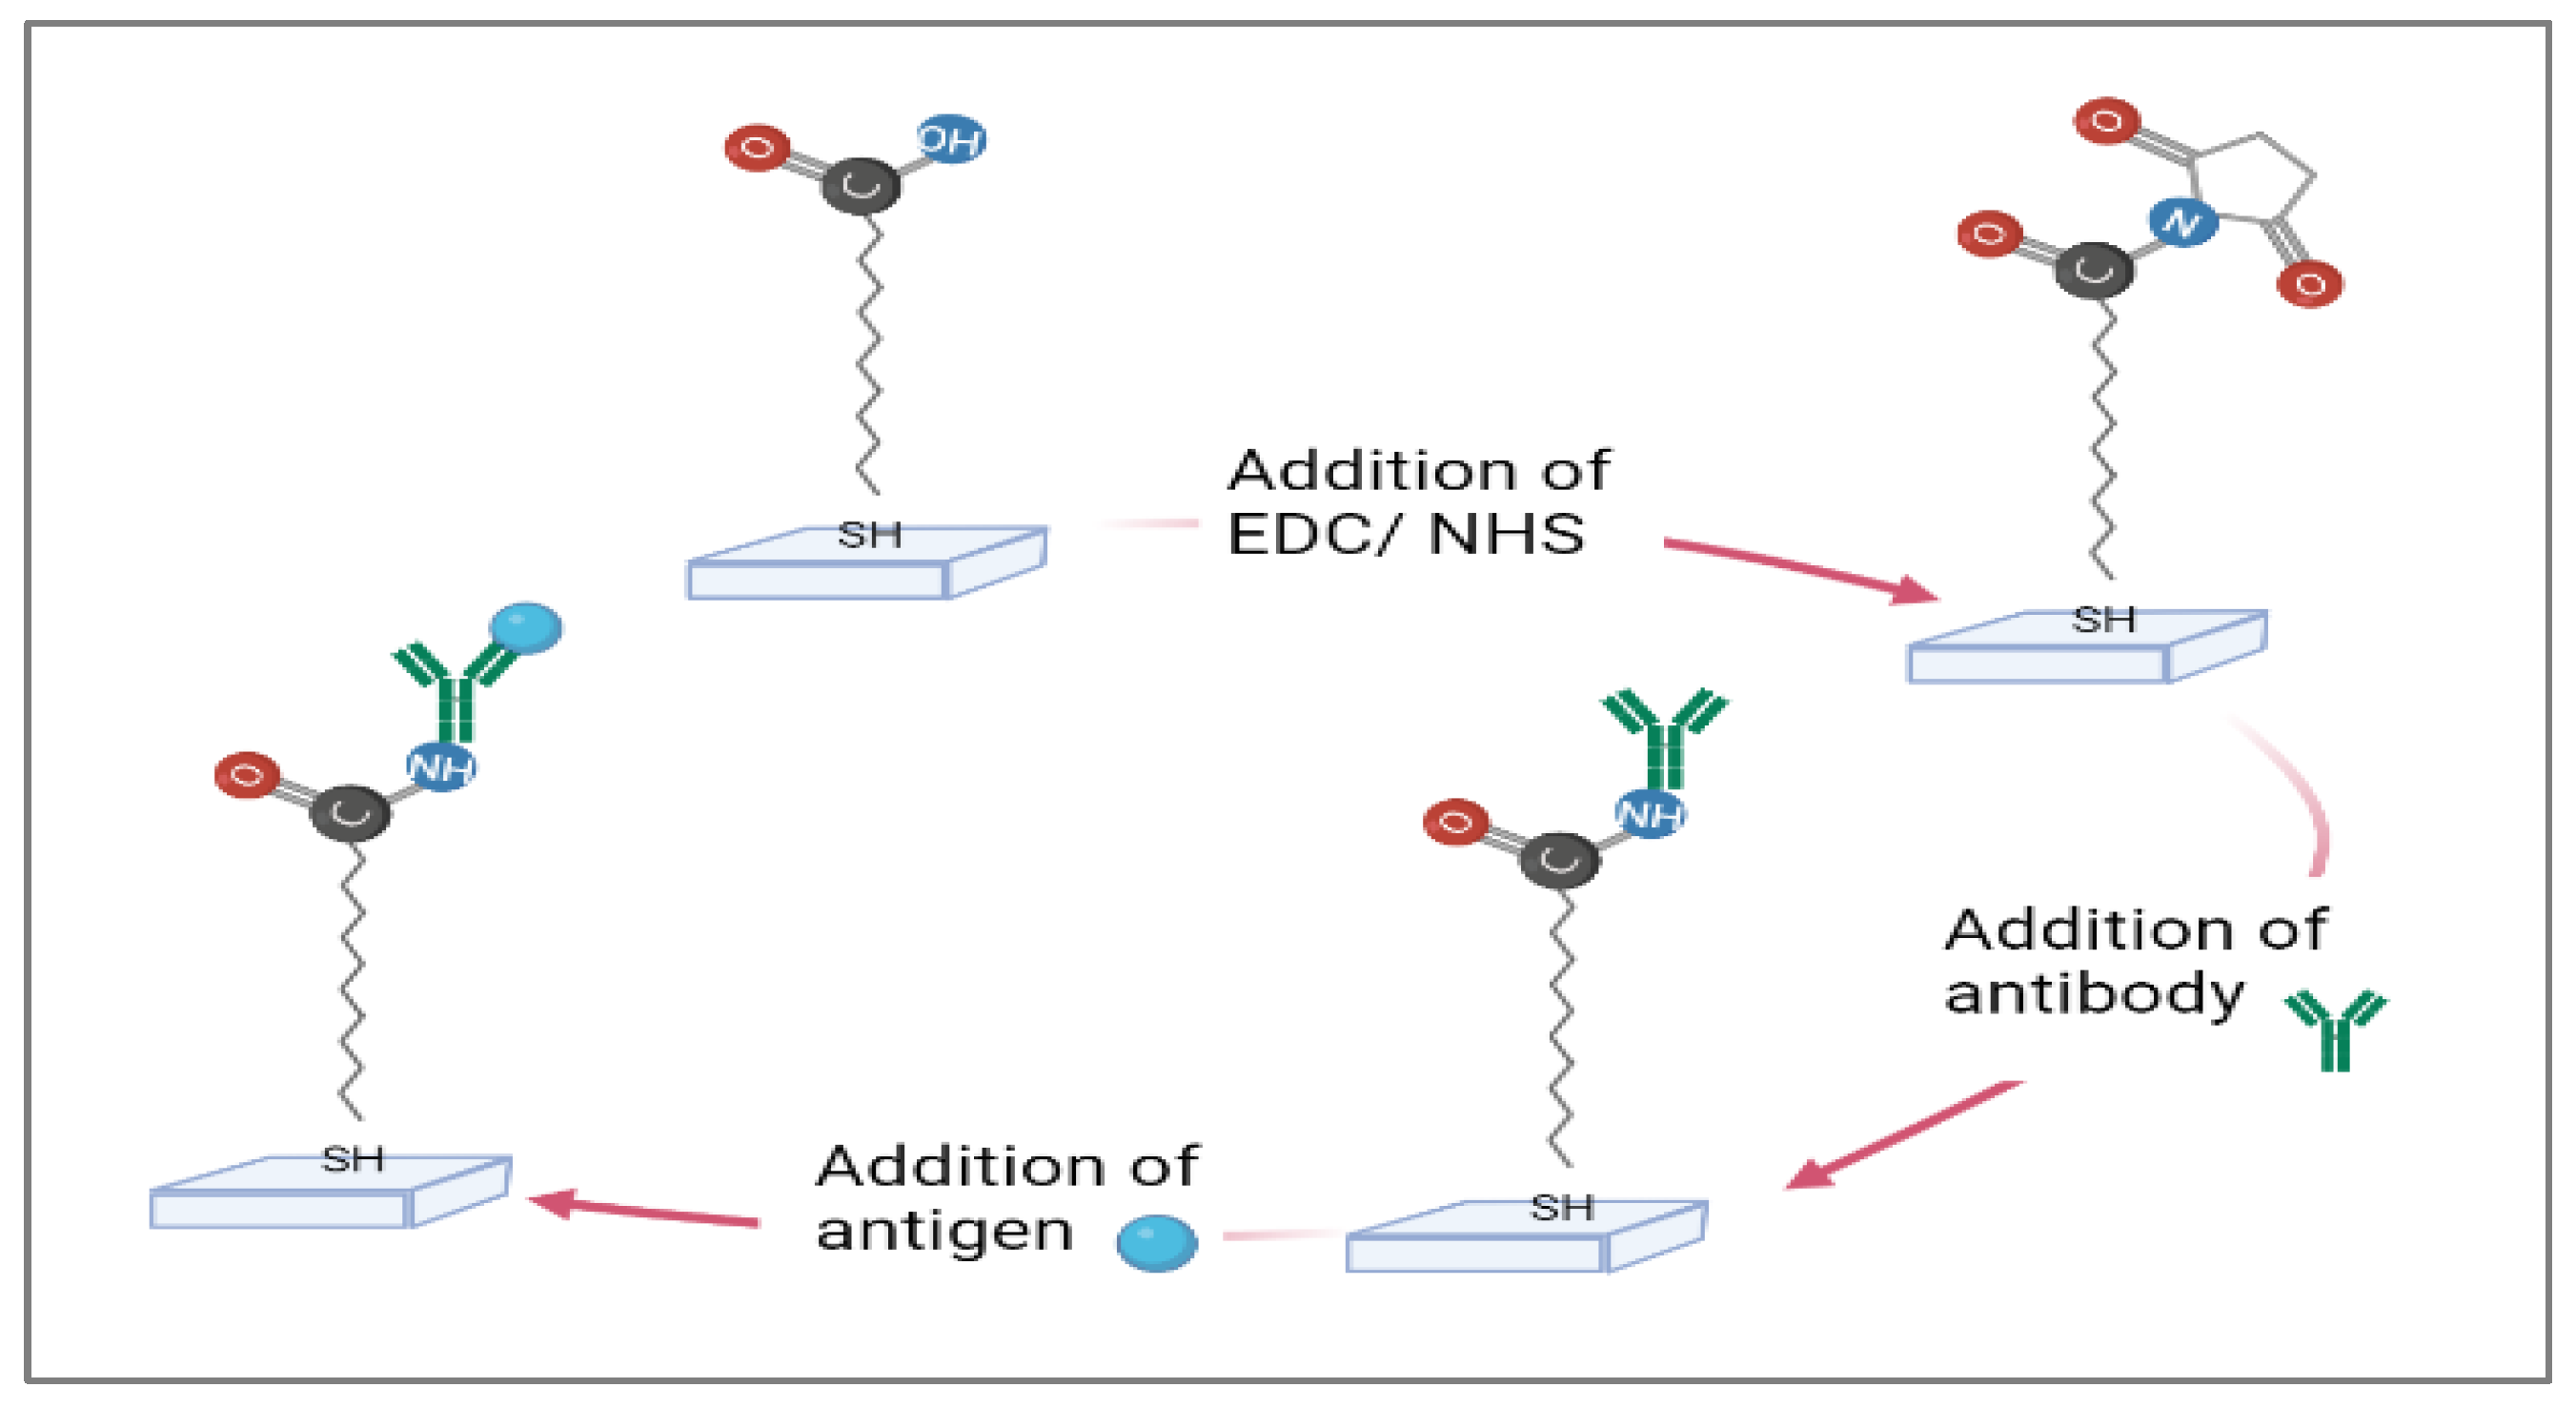
Figure 2 illustrates the fabrication of an immunosensor in a gold electrode with 11-MUA SAM, as well as its activation by EDC/NHS. The desired protein and antigen are then presented.
The indirect competitive assay using (alkaline phosphate) AP as an enzymatic label was used. A bovine albumin (BSA) conjugate, BSA-PCB was the basis for the PCB immobilization procedure. After the experiment, the amount of anti-PCB that reacted with immobilized PCB was determined using a secondary antibody with alkaline phosphate, labeled p-aminophenyl phosphate (pAPP), which detected the presence of alkaline phosphate. Liner sweep volumetry was used as the electrochemical detection technique. A number of characterization methods were reported including contact angle measurement, cyclic voltammetry, impedance measurement, SEM, and AFM. To the best of our knowledge, this is the first study to investigate the SAM modified on gold electrodes with PCBs compounds. The measurement of the electrochemical detection for the biochip was achieved via detection of the quantity of antibodies that react with the target Aroclor 1254 compound. The assay was then compared with the traditional optical method (ELISA).

2. Materials and Methods

2.1. Reagents and Chemicals

Polyclonal chicken antibody (IgY) specific to PCB, alkaline phosphatase (AP) labeled goat anti-chicken (IgY) antibodies were bought from GmbH (Heidelberg, Germany). Aroclor 1254 and PCB were bought from (Cole-Parmer Instrument Company Ltd., Eaton Socon, Saint Neots, UK). A total of 2 mg of PCB-BSA conjugate (Aroclor 1254) was bought from (BioTeZ Berlin-Buch GmbH (Heidelberg, Germany)). p-nitrophenyl phosphate (pNPP) substrate, diethanolamine reagent (DEA) phosphate-buffered saline (PBS), sodium hydrogen carbonate, sodium chloride, Tween-20, tris (hydroxymethyl) aminomethane, potassium chloride (KCl) and bovine serum albumin (BSA) were bought from Sigma (Dublin, Ireland). To adjust pH, hydrochloric acid (HCl) 37%, sodium hydroxide, ammonium hydroxide solution and sodium cyanoborohydride (NaCNBH4) were bought from Sigma (Dublin, Ireland). 11-mercaptoundecanoic acid (11-MUA), 1-ethyl-3-(3-dimethylaminopropyl) carbodiimide (EDC), NHS, potassium ferricyanide (K3[Fe(CN)6]), potassium ferrocyanide (K3[Fe(CN)6]), acetone, 1-isopropyl alcohol, ethanol, and alkaline phosphatase (AP) were also bought from Sigma (Dublin, Ireland). For the electrochemical tests, the substrate was p-aminophenyl phosphate (pAPP) salt, which was bought from Sigma (Dublin, Ireland). Disposable electrochemical screen-printed gold electrodes (AuE), model C220 BT, were purchased from (Drop Sens, Asturias, Spain). To ensure optimal detection, a standard 96 well ELISA microplate was bought from Greiner bio-one (Frickenhausen, Germany). All other reagents were analytical grade or higher, with daily buffer solutions made using nanopore water (18.2 mΩ-cm).

2.2. Equipment and Instrumentation

Optical detection was carried out using the EL Read 2000 microplate reader was provided by biochrom.co.UK. Incubation was made possible using a Biometra OV3 Incubator (Gottingen, Germany), which was set at 37 °C. Cyclic voltammetry was recorded using a PalmSens handheld potentiostat (Palm Instrument BV Houten, Houten, The Netherlands). Impedance measurements were performed in a faraday cage with minimal noise using a CHI potentiostat 1100/620B (CH Instruments Inc., Austin, TX, USA). The removal of the surface organic molecules was achieved using a plasma cleaner (Harrick Plasma Ithaca, New York, NY, USA). A nitrogen spray gun facilitated the drying of SPEs between measurements using the Contact Angle Instrument (OCA) by Data Physics Instruments GmbH (Filderstadt, Germany). SEM measurements were carried out on an FEI Quanta 650 Scanning electron microscope (FEI Company, Hillsboro, OR, USA). AFM measurements were carried out using “SCANASYST-AIR” by Bruker AFM Probes (Bruker AFM Probes, Camarillo, CA, USA). Specificity (Cross-Reactivity) obtained using a PalmSens handheld potentiostat (Palm Instrument BV Houten, Houten, The Netherlands) and Data obtained from Origin Pro 8.5.1 software. Measurements were taken at room temperature between −0.2 and 0.6 V in [Fe (CN)6]3−/4− and 0.1 M of KCl solution with a scan rate of 50 mV·s−1.

2.3. Modification of Gold SPE with SAM (LSV)

In order to prepare self-assembled monolayers (SAM) on the gold working electrodes, solutions of 5 mM 11-mercaptoundecanoic acid (11-MUA) were separately prepared in absolute ethanol (N2 bubbled for 30 min to eliminate the presence of oxygen) [38,39,40]. The gold electrodes were immersed in the SAM solution for 20 h at room temperature. Upon removing the biochips from the solution, the electrodes were rinsed thoroughly with absolute ethanol to remove any unbound molecules. They were then dried with N2. To activate the carboxylic terminal end after SAM formation, the electrodes were immersed in a solution of 50 mM EDC and NHS for 1 h and were rinsed with deionized water and dried with N2. CVs were carried out in 5 mM [Fe (CN)6]3−/4− and 0.1 M of KCl solution, and the potential that was applied was in the range (−0.2 to 0.6 V) [34,35]. The scan rate applied was 50 mV·s−1. 
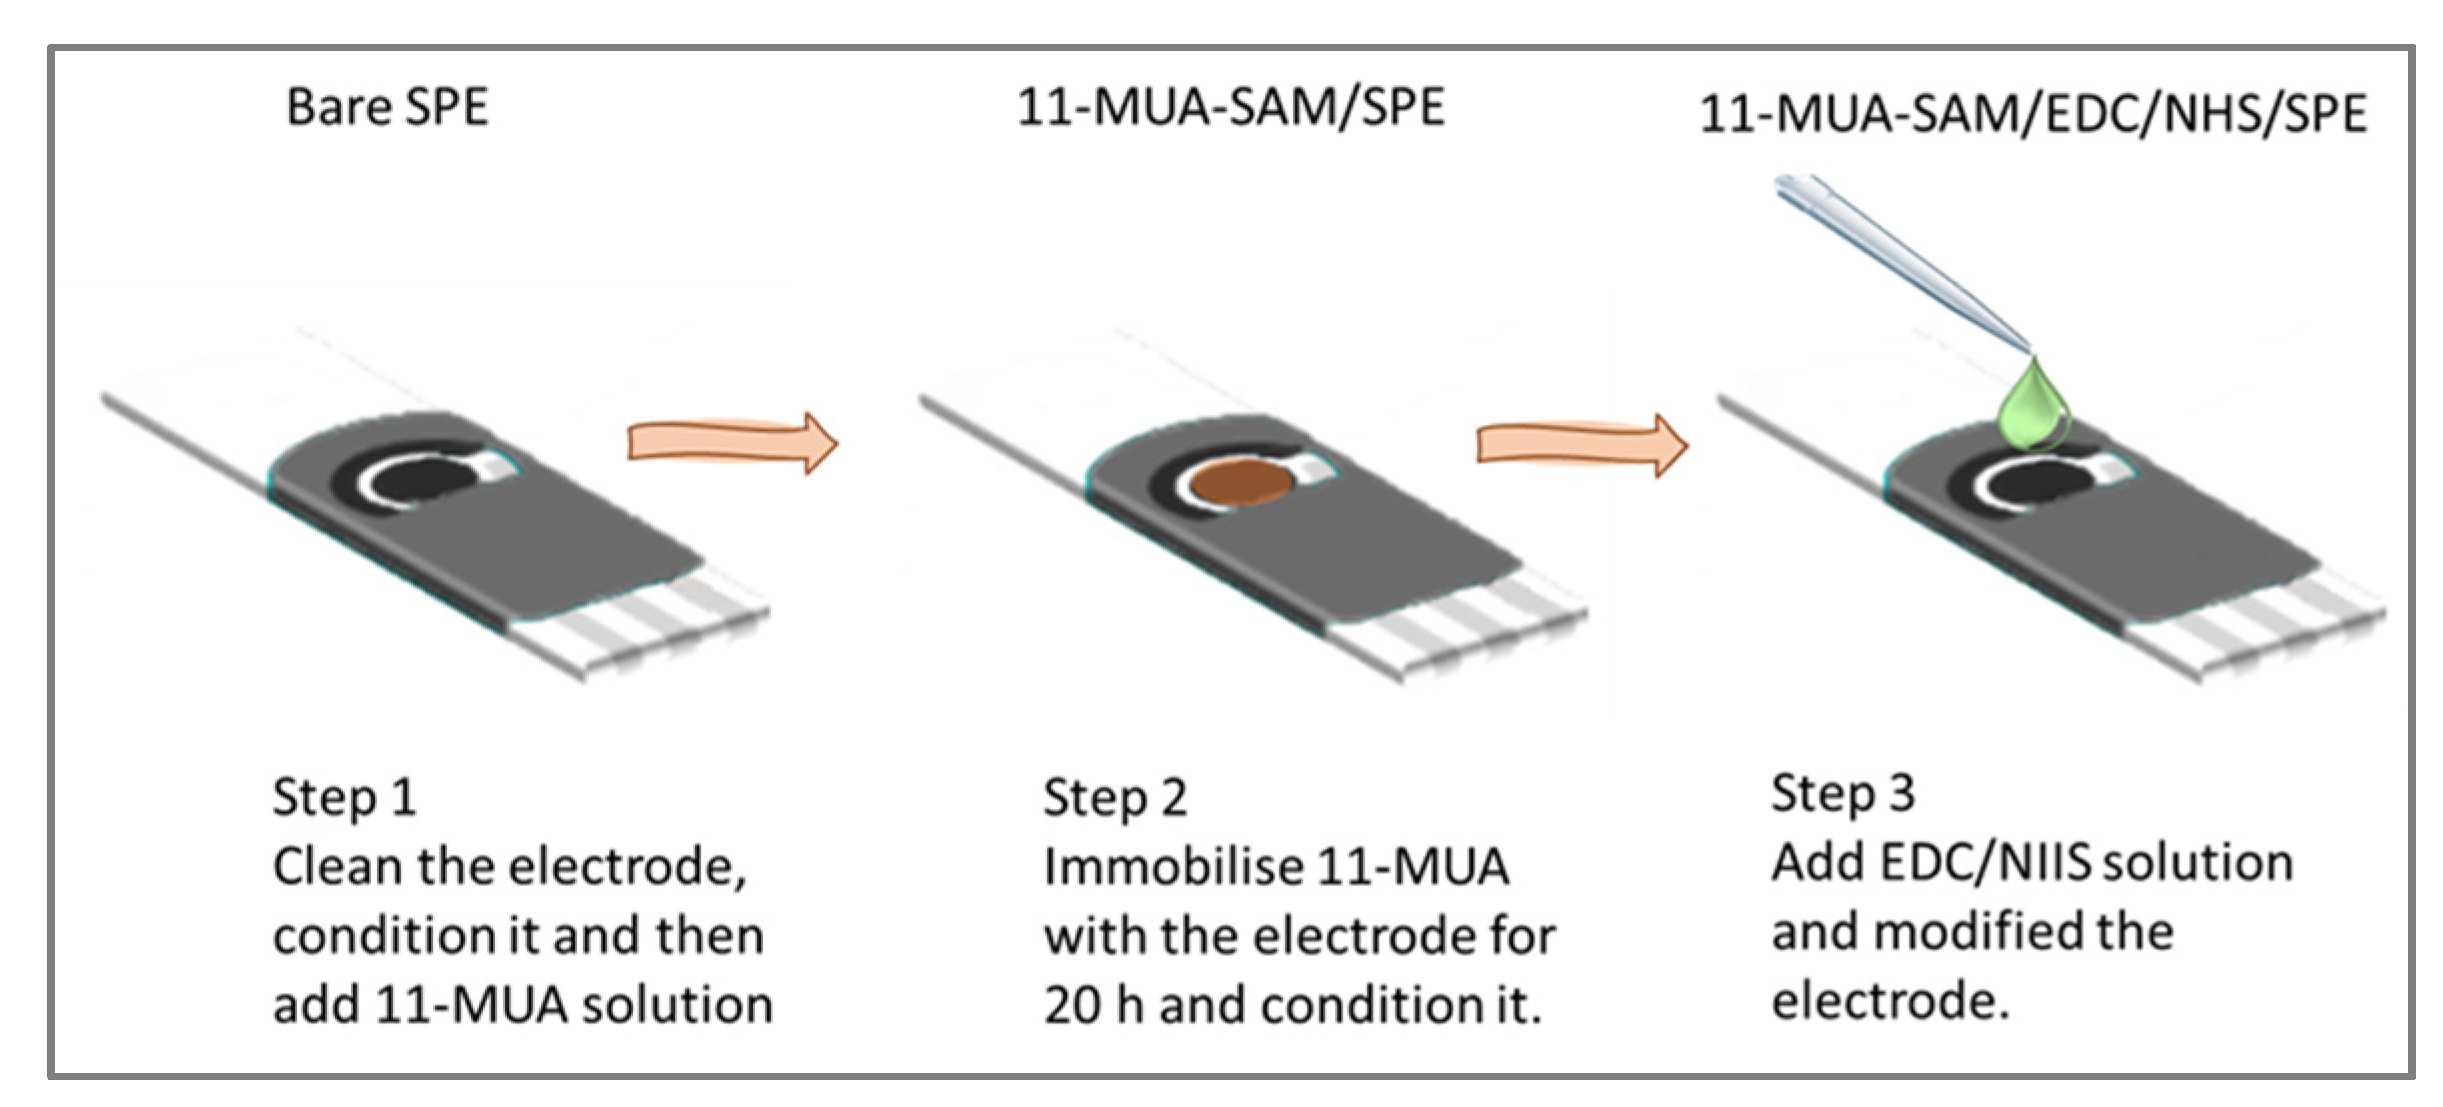
Figure 3 shows the steps involved in the formation of self-assembled monolayers on the gold electrodes. Immobilization of protein on the gold surface after the activation of EDC/NHS was performed by incubating 5 µg mL−1 of BSA-Aroclor 1254 coating conjugate at 37 °C for 1 h.

2.4. Topography Characterization

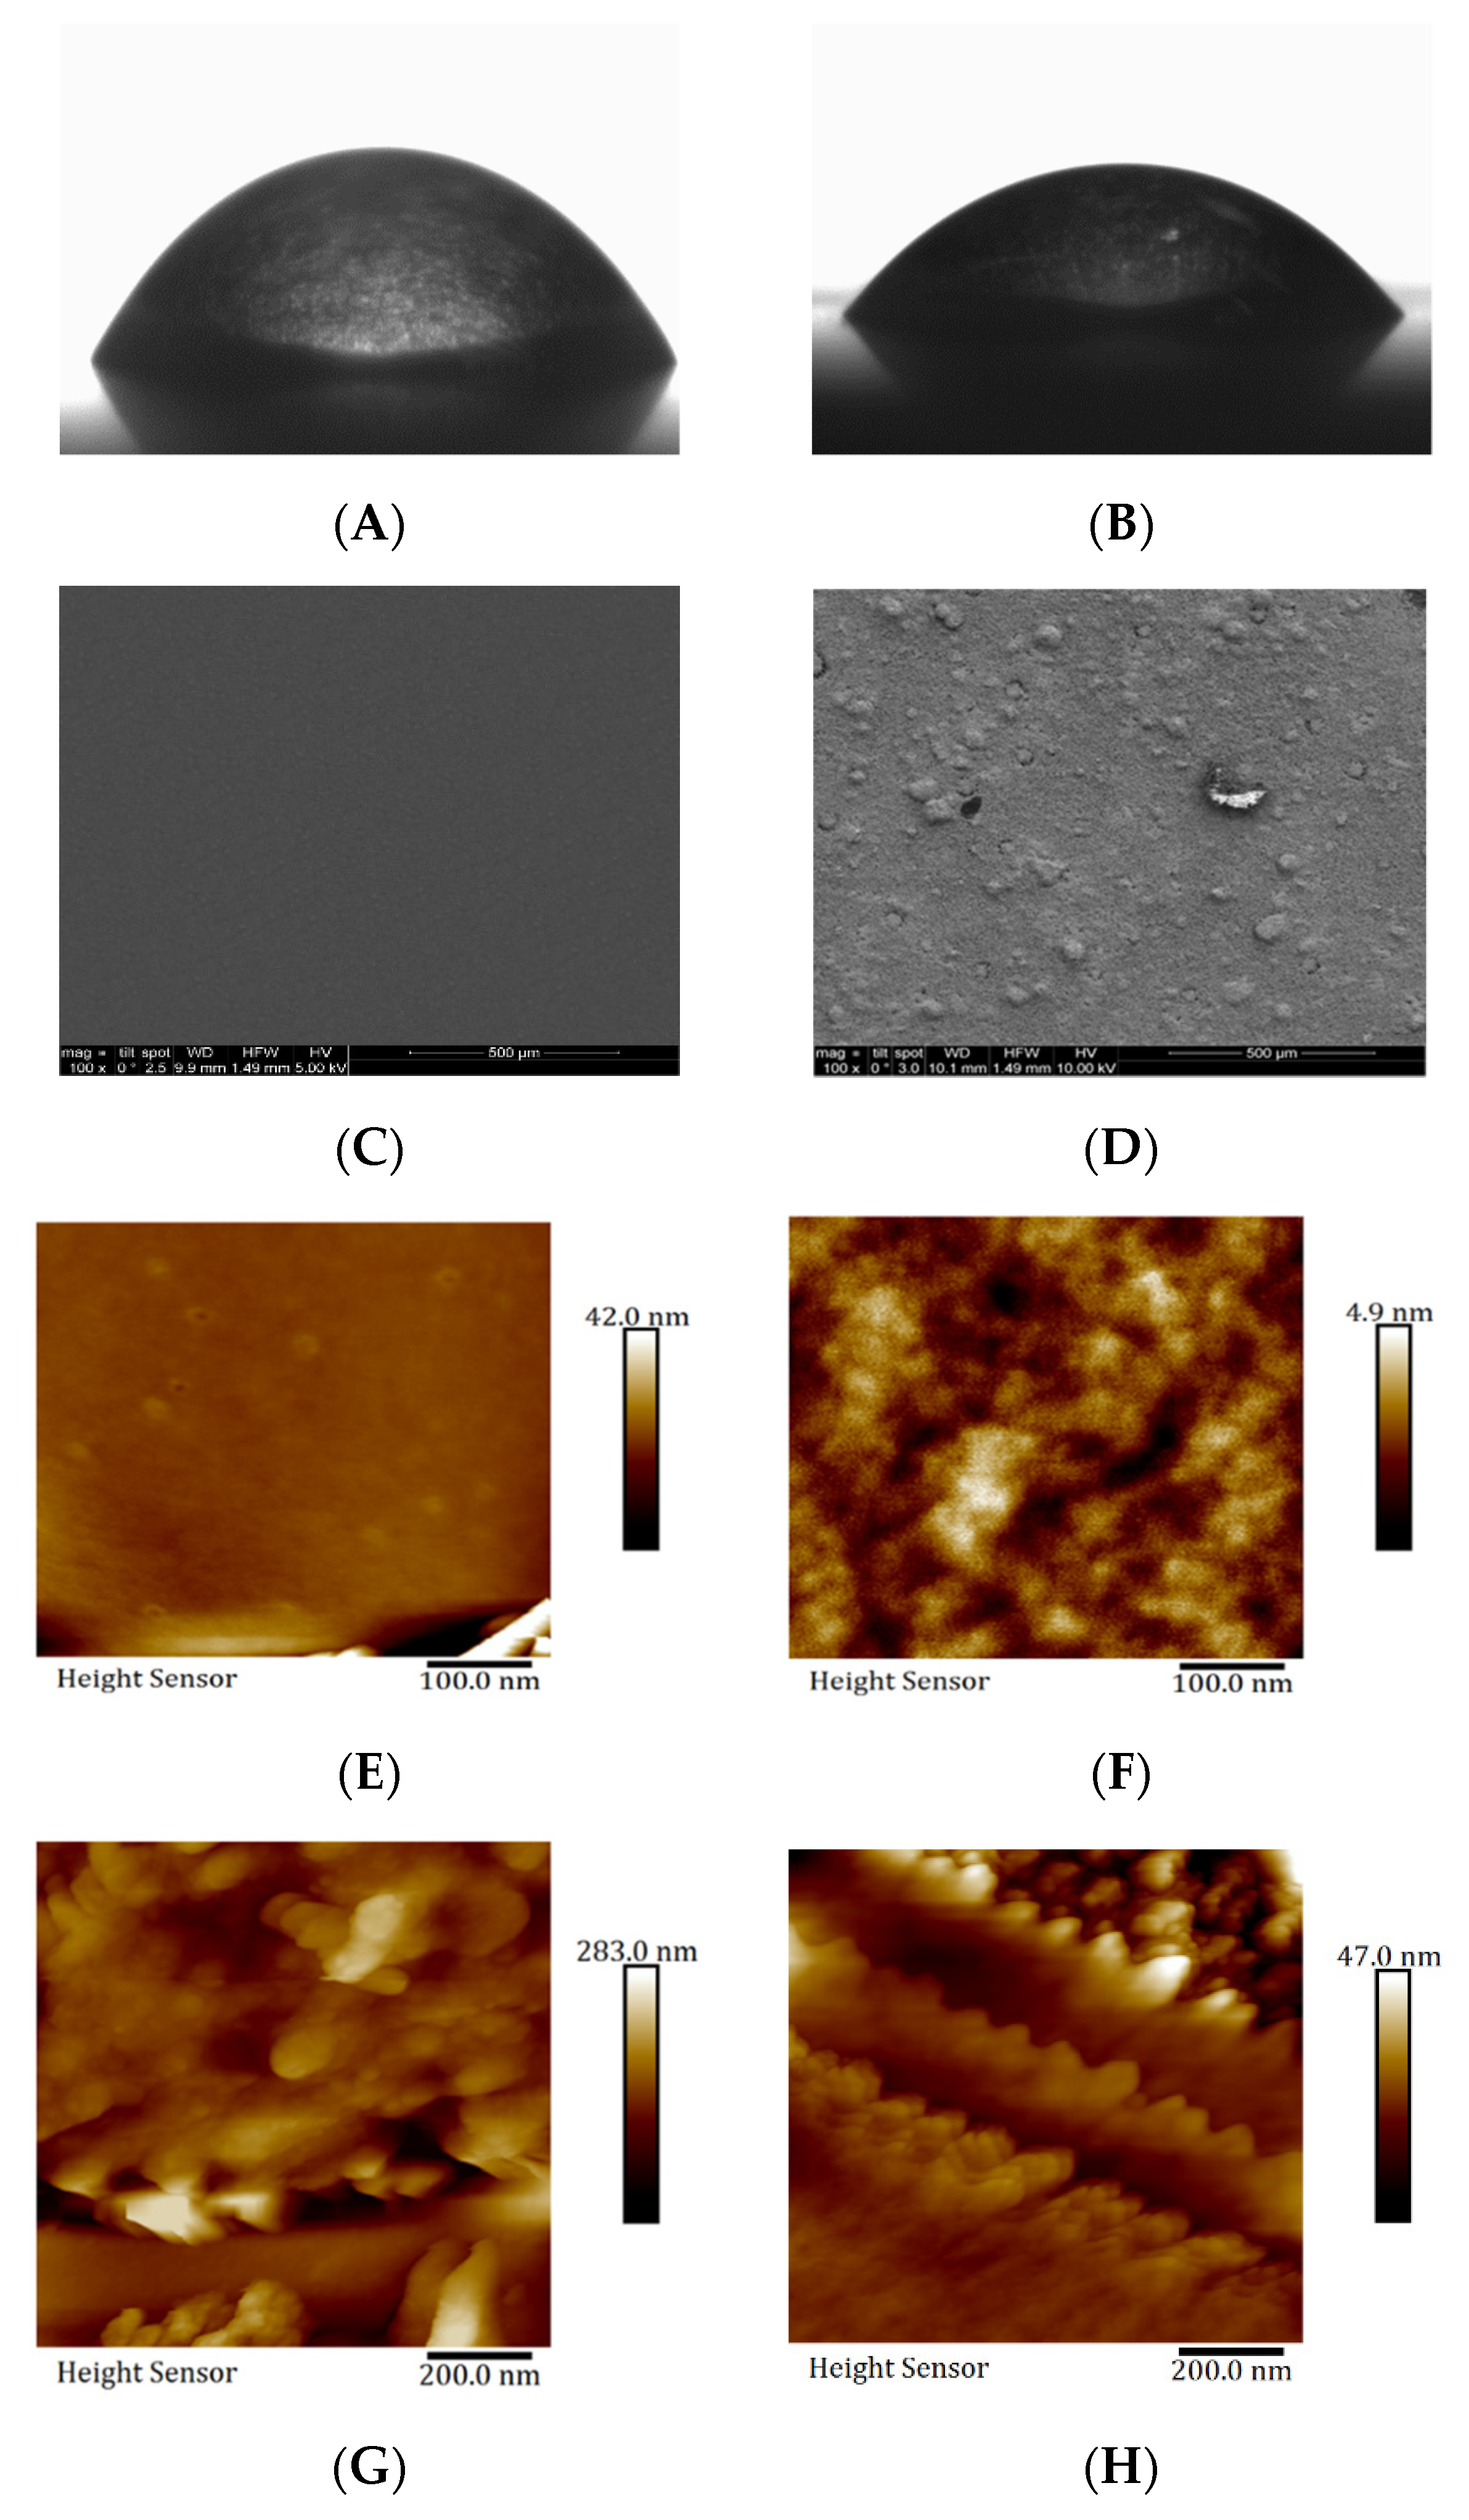
2.4.1. Contact Angle Measurement

The sessile drop contact angle method was utilized to evaluate the surface hydrophobicity of the SAM substrates. A 1 μL drop of deionized water was supplied to the surface of the gold electrodes at a medium rate of 1 μL per second. Measurements were repeated on each electrode for three drops.

2.4.2. Scanning Electron Microscopy (SEM)

SEM measurements at the surface of the bare gold electrode were observed using a FEI Quanta 650 Scanning electron microscope (SEM). The SEM was coated and imaged at ×100 magnification for clean bare AuE and SAM-modified AuE. These were observed and compared before and after the modification.

2.4.3. Atomic Force Microscopy (AFM)

The experiments were performed using an atomic force microscope (Bruker AFM Probes, Camarillo, CA, USA), which used “scanasyst-Air” as its measurement mode. The force constant of the scanasyst-Air was 2 N/m. The frequency used for the tapping mode was 95 ± 45 kHz with a scan size of 0.5 µm. For the purposes of comparison, three scans were taken per sample. Data acquisition was performed using NanoScope Analysis 1.9 software.

2.5. Electrochemichal Characterization

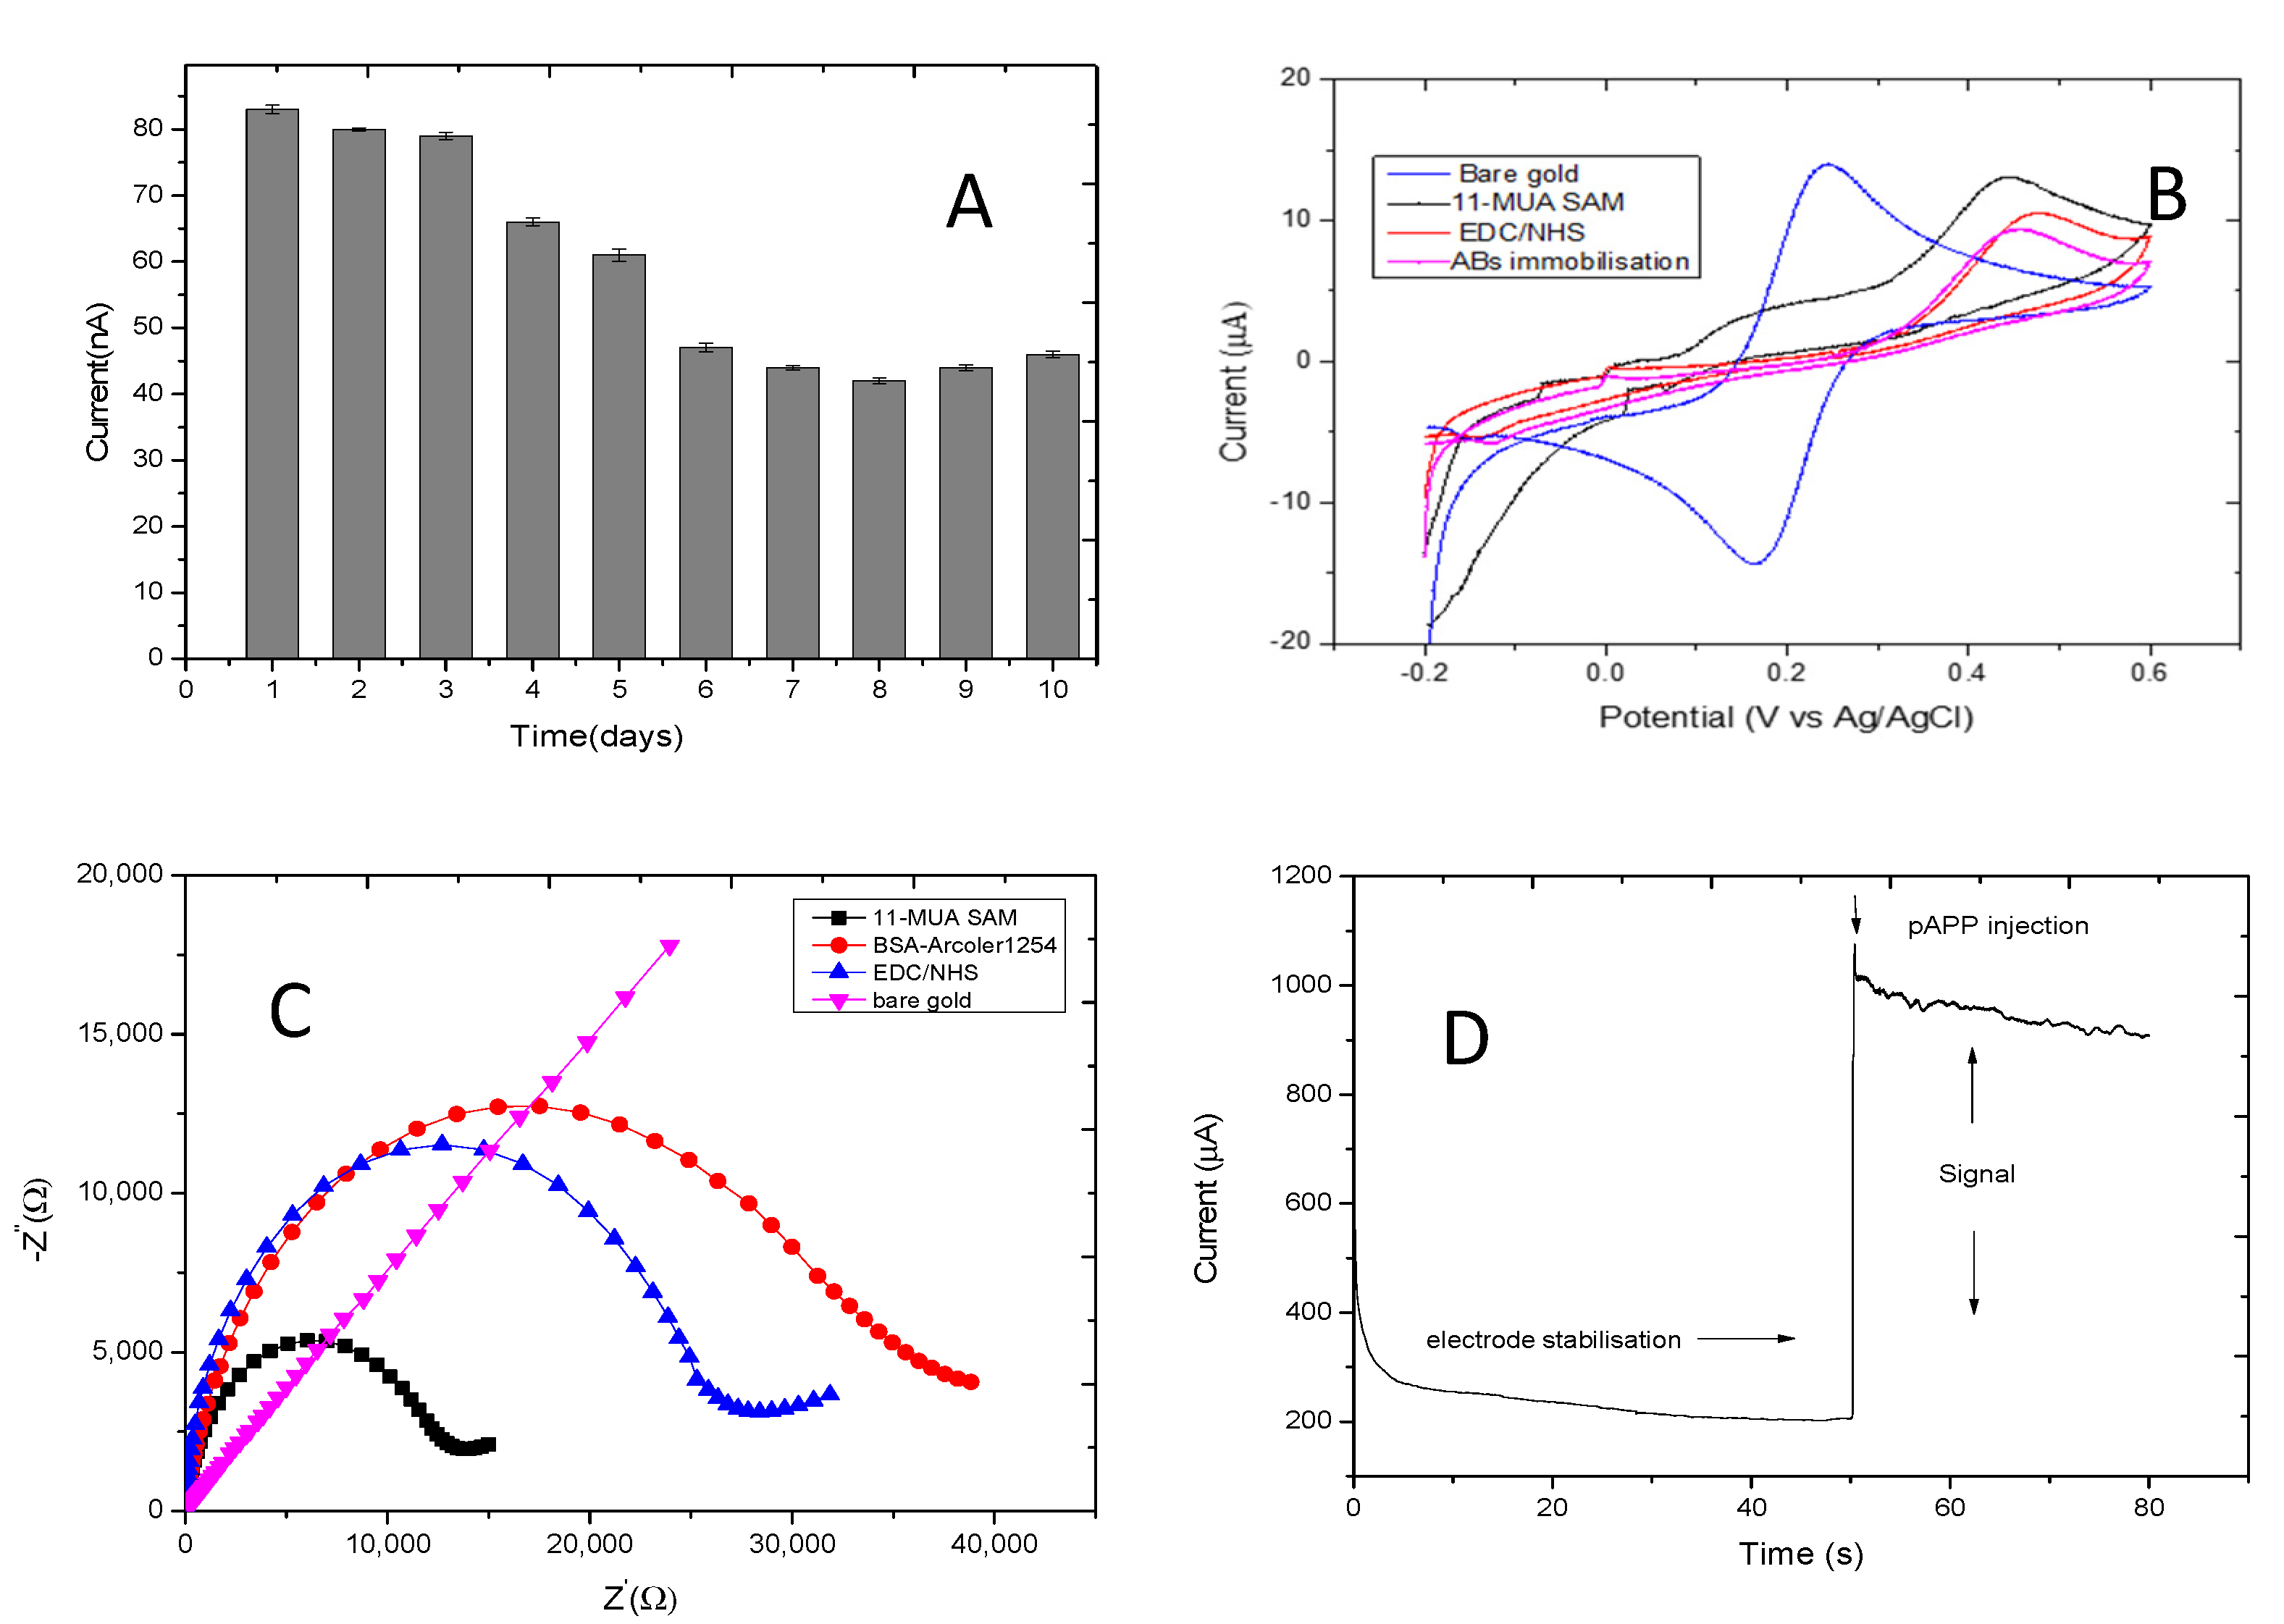
2.5.1. Stability Study of the Coated Electrodes

A stability study was performed on the coated BSA-Aroclor 1254 coating conjugate on the gold electrodes by immobilizing the electrodes with a few layers of the assay components, which is similar to the steps mentioned in Section 2.6. Using an Indirect Competitive Assay, the gold electrode was coated with 5 µg mL−1 of BSA-Aroclor 1254 coating conjugate overnight and kept at a temperature of 4 °C. The next morning the electrodes were washed, dried, and placed in a blocking solution (BSA-tris buffer) for one hour. The electrodes were then rinsed with a washing buffer and nonpure water. The biochips were stored dry at 4 °C for further use. A complete capture assay test was performed on three electrodes daily for 10 days using LSV.

2.5.2. Cyclic Voltammetry (CV)

CV was performed in 0.1 M KCl with a 5 mM ferri/ferrocyanide redox pair with an applied voltage ranging from −0.2 to +0.6 V. The scan rate was set at 0.05 V s−1. In this experiment, screen-printed electrodes (SPEs) were utilized. The gold electrode had a working area of 4 mm. The Ag/AgCl reference electrode was used to refer to all potentials reported in this study.

2.5.3. Impedance Measurement

A frequency response analysis (FRA) was utilized to apply a modest amplitude AC signal to the biochip for impedance measurements. The impedance behavior of the electrode was evaluated by analyzing the AC voltage and current response at frequencies ranging from 0.1 Hz to 1 MHz. The measurements were performed in the presence of a 5 mM redox probe [Fe (CN)6]3−/4− in 0.1 M KCl at an applied potential of +0.2 V and an amplitude of 0.1 V.

2.5.4. Amperometric Detection

PalmSens (Palm Instrument BV Houten, Houten, The Netherlands). was used to carry out the amperometric detection using a portable potentiostat. Before each measurement, a coating was applied to the chips with layers of a biocomponent assay, which was stored in 14,000 μL DEA buffer with pH 9.5 and at a temperature of 4 °C. The aim of this was to prevent loss of activity of the antibodies. The detection was carried out on the coated electrode using the AP as the labeled enzyme and the pAPP as the substrate. The measurement was set to 60 s, and the potential was applied at 450 mV versus Ag/AgCl. The measurement of the current was taken to acquire stability in the baseline. At 45 s, 100 μL of pAPP was injected into the working electrode. The final concentration of the pAPP in the buffer was 5 µg mL−1. The increase in the current was taken as the data signal for evaluation. As pAPP is sensitive to light and moisture, the solution was made daily.

2.5.5. Specificity (Cross-Reactivity)

The specificity was determined by testing the cross-reactivity (CR) of the antibody with a variety of Aroclors. The reaction was carried out using liner sweep voltammetry (LSV) by adding these compounds (instead of Aroclor 1254 in the respective assays) at 11 serial dilutions, using the same concentration range (0.01 to 660 ng mL−1) that was used to detect the target (Aroclor 1254). The CR values can be calculated using the following formula:
cross reactivity   ( % ) = IC 50   of   Aroclor   1254   IC 50   of   other   compounds × 100

2.6. Indirect Competitive Assay

Indirect competitive assay was applied by ELISA or by linear sweep voltammetry. Immobilization of antibodies was carried out directly on microwell plates or on the clean electrode surface to enhance the maximum signal. The immobilization of biocomponents was performed on the working electrode and wells. A total of 100 μL or 10 μL of the coating antigen BSA-Aroclor1254 (5 μg mL−1) (pH 7.4) was added to microwell plates or electrode surfaces and incubated overnight at 4 °C. The microwell plates or electrodes surfaces were then washed three times with 0.05 M Tris, pH 7.4 (0.05% Tween 20) and blocked with 1% BSA-Tris Solution (0.05 M Tris-HCI) for 30 min at 37 °C. After incubation, the microwell plates or electrode surface was washed three times to remove any unbound coating conjugate. For the competition step, the serial dilution of Aroclor 1254 PCB was mixed with polyclonal chicken antibody (IgY) specific to PCB with concentrations of 0.465 µg/mL−1 or 0.123 µg/mL−1 used for ELISA or linear sweep voltammetry. The mixture was left to incubate for 15 min. A volume of 100 or 10 µL was introduced to the microwell plates or electrode surface. The microwell plates and electrode surfaces were allowed to bind for 1 h at 37 °C. To standardize the assay, a 1/5000 dilution of commercially available (AP) labeled goat anti-chicken (IgY) antibodies was prepared, and 100 or 10 µL of the solution was added to the microwell plates or electrode surfaces and allowed to react for 1 h or 30 min at 37 °C. After washing, 100 or 10 μL of the substrate solution pNPP or pAPP diluted in DEA buffer (pH 9.5, 1 mg mL−1) was added to surfaces. The electrochemical substrates were incubated, and measurements were taken using the PalmSens potentiostat.

2.7. Real Sample

The analysis was carried out in a river water sample were collected from River Lee (Cork, Ireland) in April 2020, and the tap water was taken from Kane Building (chemistry department)—UCC (University College Cork). To protect the water samples from contaminants, glass vessels with Teflon caps were used for storage. Immediately after collecting the samples, they were diluted with equal amounts of methanol to prevent losses to the polystyrene tubes or the glass containments. To remove all the suspended materials in the sample, 0.45 µm filter aid materials were used before testing. The water samples used in this experiment contained 50% methanol. the final assay result was multiplied by a factor of 2 [41]. For the highly contaminated samples, those outside the assay’s calibration range were further diluted and analyzed.

3. Results

3.1. Topography Characterization

In order to study SAM behavior, a characterization of the monolayer on the gold electrode was carried out using contact angle, SEM and AFM. The contact angle data showed significant variations in hydrophobicity/hydrophilicity when the substrate was modified. The gold immobilized SAM electrode was tested using contact angles for structural information about the modified surface, as shown in Figure 4A,B. SEM and AFM are complementary techniques in assessing SAM formation. SAMs are usually smooth, structurally ordered and chemically defined at the microscopic scale [42]. Therefore, they are ideal for SEM and AFM measurements. Comparisons were made before and after SAM and protein immobilization was performed on the same gold surface. Furthermore, the interaction between SAM and proteins immobilized on the gold electrode was examined. The bare gold and the modified electrode images were taken at ×100 magnification using SEM corresponding to the various stacks, as shown in Figure 4C,D. AFM high-resolution images were taken to measure the roughness of the gold surface electrode during the electrode modification process. This process began with the bare electrode (Figure 4E), then the electrode when 11-MUA was adsorbed (Figure 4F), then the electrode after the activation of EDC/NHS (Figure 4G), and, finally, the electrode after the protein layer of BSA-Aroclor 1254 was formed (Figure 4H).

3.1.1. Contact Angle Measurement

The thiol end groups utilized in the fabrication of the modified SAM gold electrodes impacted on the water contact angle. The contact angle for bare gold electrodes is 59.4 degrees [24,43]. However, as shown in Figure 4A,B, after 20 h of SAM synthesis, the contact angle value decreased in comparison with the gold bare electrode value, showing the presence of a hydrophilic surface. Hydroxyl-terminated (OH) and methyl-terminated (CH3) SAMs will usually possess a smaller hydrophobic surface over amine-terminated (NH2) or carboxylic acid-terminated (COOH) SAMs [42,44]. Previous research has indicated that the low contact angle value of carboxylic acid-terminated monolayers suggests that the monolayer surface is covered with dense arrays of thiol tail groups. Findings by Wang et al. indicated that SAM carboxyl acid terminus had a minimum contact angle of 10°, depending on the kind of SAM synthesis utilized [42,45]. On the other hand, the contact angle for SAM produced in ethanolic solution has been measured as 35°. This corresponds with the contact angle values obtained twenty hours after SAM modification, as indicated in Table 1. SAM adjustment had 2.2% percent relative standard deviation and decreased the water contact angle for five tests that were recorded per electrode.

3.1.2. Scanning Electron Microscopy (SEM)

The surfaces of the electrodes were photographed using SEM so as to identify at a high resolution the spatial variations in the electrodes before and after modification. The bare gold electrode surface appeared smoother (Figure 4C) than the modified electrode and had a more uneven structure (Figure 4D). As was previously reported [21], the images in Figure 4D show the transition in the surface morphology of the electrodes as the various stacks attached to the gold surface.

3.1.3. Atomic Force Microscopy (AFM)

AFM was applied at 0.5 uM2 to evaluate the interactions between SAM and the proteins that were immobilized on the bare gold electrodes. Figure 4E shows that there was a smooth surface structure for the bare gold electrodes to a resolution of 42 nm. The topography image after the adsorption of 11-MUA revealed a flat surface, with the calculated average of the surface roughness being 2.80 nM (Figure 4F). It was found that the protein layer of the BSA coating conjugate, which formed on the surface, resulted in greater roughness (Figure 4H) than the surface following the activation of EDC/NHS (Figure 4G). Surface roughness and particle diameter are important because they can aid in the study of the effects of tribological behavior on surfaces. Table 2 shows the surface roughness and particle diameter size of the gold electrode before and after the introduction of SAM, EDC/NHS, and the protein layer. It has been reported that surface roughness increases with the addition of protein [46]; however, this research found that the surface roughness decreased after the addition of the protein. The maximum particle diameter was 141.20 nm. As has been argued by Kim [47], it may be possible that the roughness could be due to the different shapes of the protein layer. In addition, it shows inhomogeneous particles size after the addition of the BSA-Arcolor 1254 coating conjugate. This is due to the aggregation of antibodies.

3.2. Electrochemical Characterization

LSV and CV, as shown in Figure 5A,B, were utilized to investigate the SAM redox process in relation to the gold electrode [46,48]; however, their limitations made this difficult. For example, it was difficult to avoid double layer charging and to measure current on low overpotential [47,49]. For these reasons, EIS was applied, as shown in Figure 5C [50]. EIS is a sensitive method for investigating electron transport over a thin monolayer [48,50]. Amperometry was utilized in the presence of pAP, which is transformed to p-aminophenol, to prove the enzymatic process before adding the target analyte (pAP). At +300 mV (vs. Ag/AgCl), detection of pAP was possible. Electrodes may be amperometrically measured because of the low substrate specificity of AP (Figure 5D).

3.2.1. Stability Study of the Coated Electrodes

Before the linear sweep voltammetry deduction was used, the electrodes underwent a complete capture assay. A total of 0.123 ug/mL−1 of the primary antibody was immobilized on the electrode surface, followed by the addition of the labeled secondary antibody in 1/5000 dilution. In total, 10 uL of the substrate solution pAPP was diluted in DEA buffer (pH 9.5, 1 mg mL−1) and added to the electrode surfaces. The electrochemical substrates were incubated, and measurements were taken using the PalmSens potentiostat. The electrodes were washed and dried before using LSV. Measurements were performed daily for 10 days using the three electrodes (n = 3). Figure 5A shows the 10-day performance of the coated BSA-Aroclor 1254 coating conjugate on the gold electrode using LSV detection. From the graphs, it was observed that the coated electrode remained stable for the first 5 days with a decrease in signal being observed from day 6.

3.2.2. Cyclic Voltammetry

To identify the electrochemical properties of the electrode modification, an 11-MUA self-assembly on the gold electrode CV was used. The peaks of the ferricyanide/ferrocyanide couple were utilized to investigate the SAM electron-transfer efficiency on the gold surfaces. It was found that when the SAM molecules bonded to the gold electrode surface, this gradually inhibited electron transport. Figure 5B displays the electrode CVs before and after SAM modification with 11-MUA. Findings indicated a decrease in [Fe (CN)6]3−/4− cathodic and anodic peak current following the gold surface’s immobilization of 11-MUA SAM. This is consistent with the findings of Lu et al. [51]. Water-soluble NHS and EDC to carboxylic acid immobilization ended as SAMs increased protein coverage [52]. The coating conjugate and primary monoclonal antibody were immobilized using the competitive ELISA method.

3.2.3. Impedance Measurement

To gather further kinetic data, impedance was next applied in this study over a broader time constant limit. The impedance measurements applied ranged from 0.1 Hz to 1 MHz. An amplitude of 0.1 V and a potential of 0.21 V were used. It was observed that at higher frequencies, a semi-circle followed by a straight line appeared at the lower frequencies for the bare gold electrode, demonstrating the presence of Warburg resistance, as shown in Figure 5C. The diffusion processes occurred at the surface of the electrode when it was connected to the equivalent circuit that corresponded to the charge-transfer resistance (Re) [53]. With regard to the bare gold (Au) electrodes, there was an increase in impedance value, and the l1-MUA gold electrode was immobilized for electron transfer [54]. A highly insulated surface on the gold electrode was formed after SAM formation. Upon the addition of the protein layer (BSA-Aroclor 1254) coating conjugate, the impedance value significantly increased at both high and low frequencies. This increase relates to the higher molecular weight of protein-BSA (M = 66.5 kDa), compared to 11-MUA (M = 218.36 g/mol). This result is supported by the fact that almost all the faradaic current was blocked, which increased the surface resistance [27]. The Randle’s equivalent shown in Figure 5C depended on mass transport and is comparable to data obtained for electron transfer in an earlier study [54]. The parameter assessment for the Randle’s equivalent circuit on the gold electrode for 11-MUA SAM is shown in Table 3. Findings indicated that the value CdI for the monolayer electrode was lower than the one recorded for the bare gold electrode (1.18 × 10⁻⁶ F/cm−2). This low CdI value is a sign that the electrodes are coated by well-formed SAM of carboxylic-acid-ended long chain thiols [55]. Upon the activation of EDC/NHS and the addition of the protein layer, the CdI values fell to 8.10 × 10⁻⁷ and 5.74 × 10⁻⁷ F/cm−2, in that order. This was due to the presence of the immobilized protein (BSA-Aroclor 1254 coating conjugate) on the gold surface, which resulted in the reduced access of the solution ions to the gold surface.

3.2.4. Amperometric Detection

Amperometry can detect the current flow resulting from the enzymatic redox reaction in real-time. Before the amperometric measurements were taken, the electrodes were washed and stored in DEA buffer. pAPP was the substrate that was used for the amperometric sensor. Figure 5D shows the amperometric response of the immunoassay system. Findings revealed that when the pAPP was introduced at 50 s, the amperometric signal increased and reached a steady-state value in less than 80 s. A steady background amperometric signal was also obtained when there was no addition of p-aminophenyl phosphate (pAPP), which demonstrated electrode stabilization. The enzyme that was utilized for electrochemical detection was AP, which was also used for the ELISA work. Enzyme AP converts pNPP into the molecule p-nitrophenol, which is spectrophotometrically detectable in conventional ELISAs. Considerable differences in redox potentials between phosphorylated and free forms were observed due to a lack of electrode fouling by electro polymerization and a low redox potential when converted to (pAP) at (+300 mV (vs. Ag/AgCl) pAP is detectable [56,57]. Measurement of the electrodes both amperometrically and spectrophotometrically was possible due to the low substrate specificity of AP.

3.2.5. Specificity (Cross-Reactivity)

The specificity of the assay was evaluated by the CR (cross-reactivity) of the polyclonal antibody with five different types of compounds of Aroclors such as (Aroclor 1248, Aroclor 1016, Aroclor 1242, Aroclor 1260, Aroclor 1262). The CR values were calculated according to the following formula: CR (%) = (IC50 of Aroclor 1254)/(IC50 of other compounds) × 100. The cross-reactivity of five Aroclors compounds against Aroclor 1254 was measured, and the results are displayed in Table 4. A low IC50 value was recorded for Aroclor 1254, which proved the sensitivity of the assay toward the PCBs detection. Based on the CR values, the assay evidently provided higher responses to formulations with highly chlorinated biphenyls (Aroclors 1254, 1260, and 1262), which had a similar structure arrangement to Aroclor 1254. On the other hand, it recorded the lowest cross-reactivity with a lower chlorination level (Aroclor 1248, 1242, 1016) because of the significant difference in their molecular structures with Aroclor 1254. Therefore, this method showed good specificity for the detection of Aroclor 1254.

3.3. Indirect Competitive Assay

Linear sweep voltammetry was performed to generate the curves of indirect competitive assay using bare gold electrodes and SAM modified electrodes, as shown in Figure 6. Prior to surface modification, the biochips were cleaned using plasma cleaner. After SAM formation, and to eliminate any unbound molecules from the surface of the gold, the electrodes were cleaned using absolute ethanol. Following SAM formation, a mixture of EDC and NHS was immobilized onto the surface of the gold electrode. The resulting intermediate NHS esters were stable at neutral conditions and did not hydrolyze easily. The unmodified bare gold electrode had a limit of detection (LOD) of 0.202 ng/mL−1 and R2 value of 0.96. These findings are lower than other investigators’ reported values, but they are still within reasonable parameters. A linear range from 0.304 to 220 ng/mL−1 was attained. When the electrode was changed, it was found that the modification electrode displayed a LOD of 0.09 ng/mL−1, a sensitivity level that was much lower than that of the unmodified electrode. The sensor recorded a linear detection range of between 220 and 0.101 ng/mL−1 with an R2 value of 0.99. This novel modification had good value among other literature reviews, as illustrated in Table 5.

3.4. Real Sample Analysis

11-MUA-SAM/EDC/NHS/SPGE was applied to determine Aroclor 1254 in the tap and river samples collected using the standard addition technique. The river and tap samples were further diluted with tris-BSA buffer solution pH 7.4 and analyzed by LSV and ELISA. As highlighted in Table 6, the developed sensor’s results showed that the recovery values of the spiked samples were in the range of 91–97% for both the river and the tap water, which indicated highly reliable results, with an RSD value that was below 3% (n = 3). On the other hand, the Aroclor 1254 results obtained by ELISA showed that the recovery values of the spiked samples were in the range of 107.26–120% with an RSD of approximately 7% (n = 3) Therefore, the 11-MUA-SAM/EDC/NHS/SPGE was an effective technique in determining Aroclor 1254 in water samples. Similarly, the analytical results that were obtained from the 11-MUA-SAM/EDC/NHS/SPGE showed that the procedures of the sample analysis were significantly easy as it benefits from a lower determination time and fewer potential errors produced from the elaborate sample preparation. These results were more effective and reliable when compared to the results obtained from ELISA measurements, which is a traditional technique. In terms of detecting Aroclor 1254, it was clear from the results that ELISA could not accurately quantify the variables that were being tested. Therefore, this meant that the developed electrode was more sensitive and precise when compared to the standard instrument, which made the results obtained more satisfactory. The results of the fundamental analysis also showed that the developed sensor had other benefits such as high accuracy, selectivity, and sensitivity in the determination of the PCBs in the water samples.

4. Conclusions

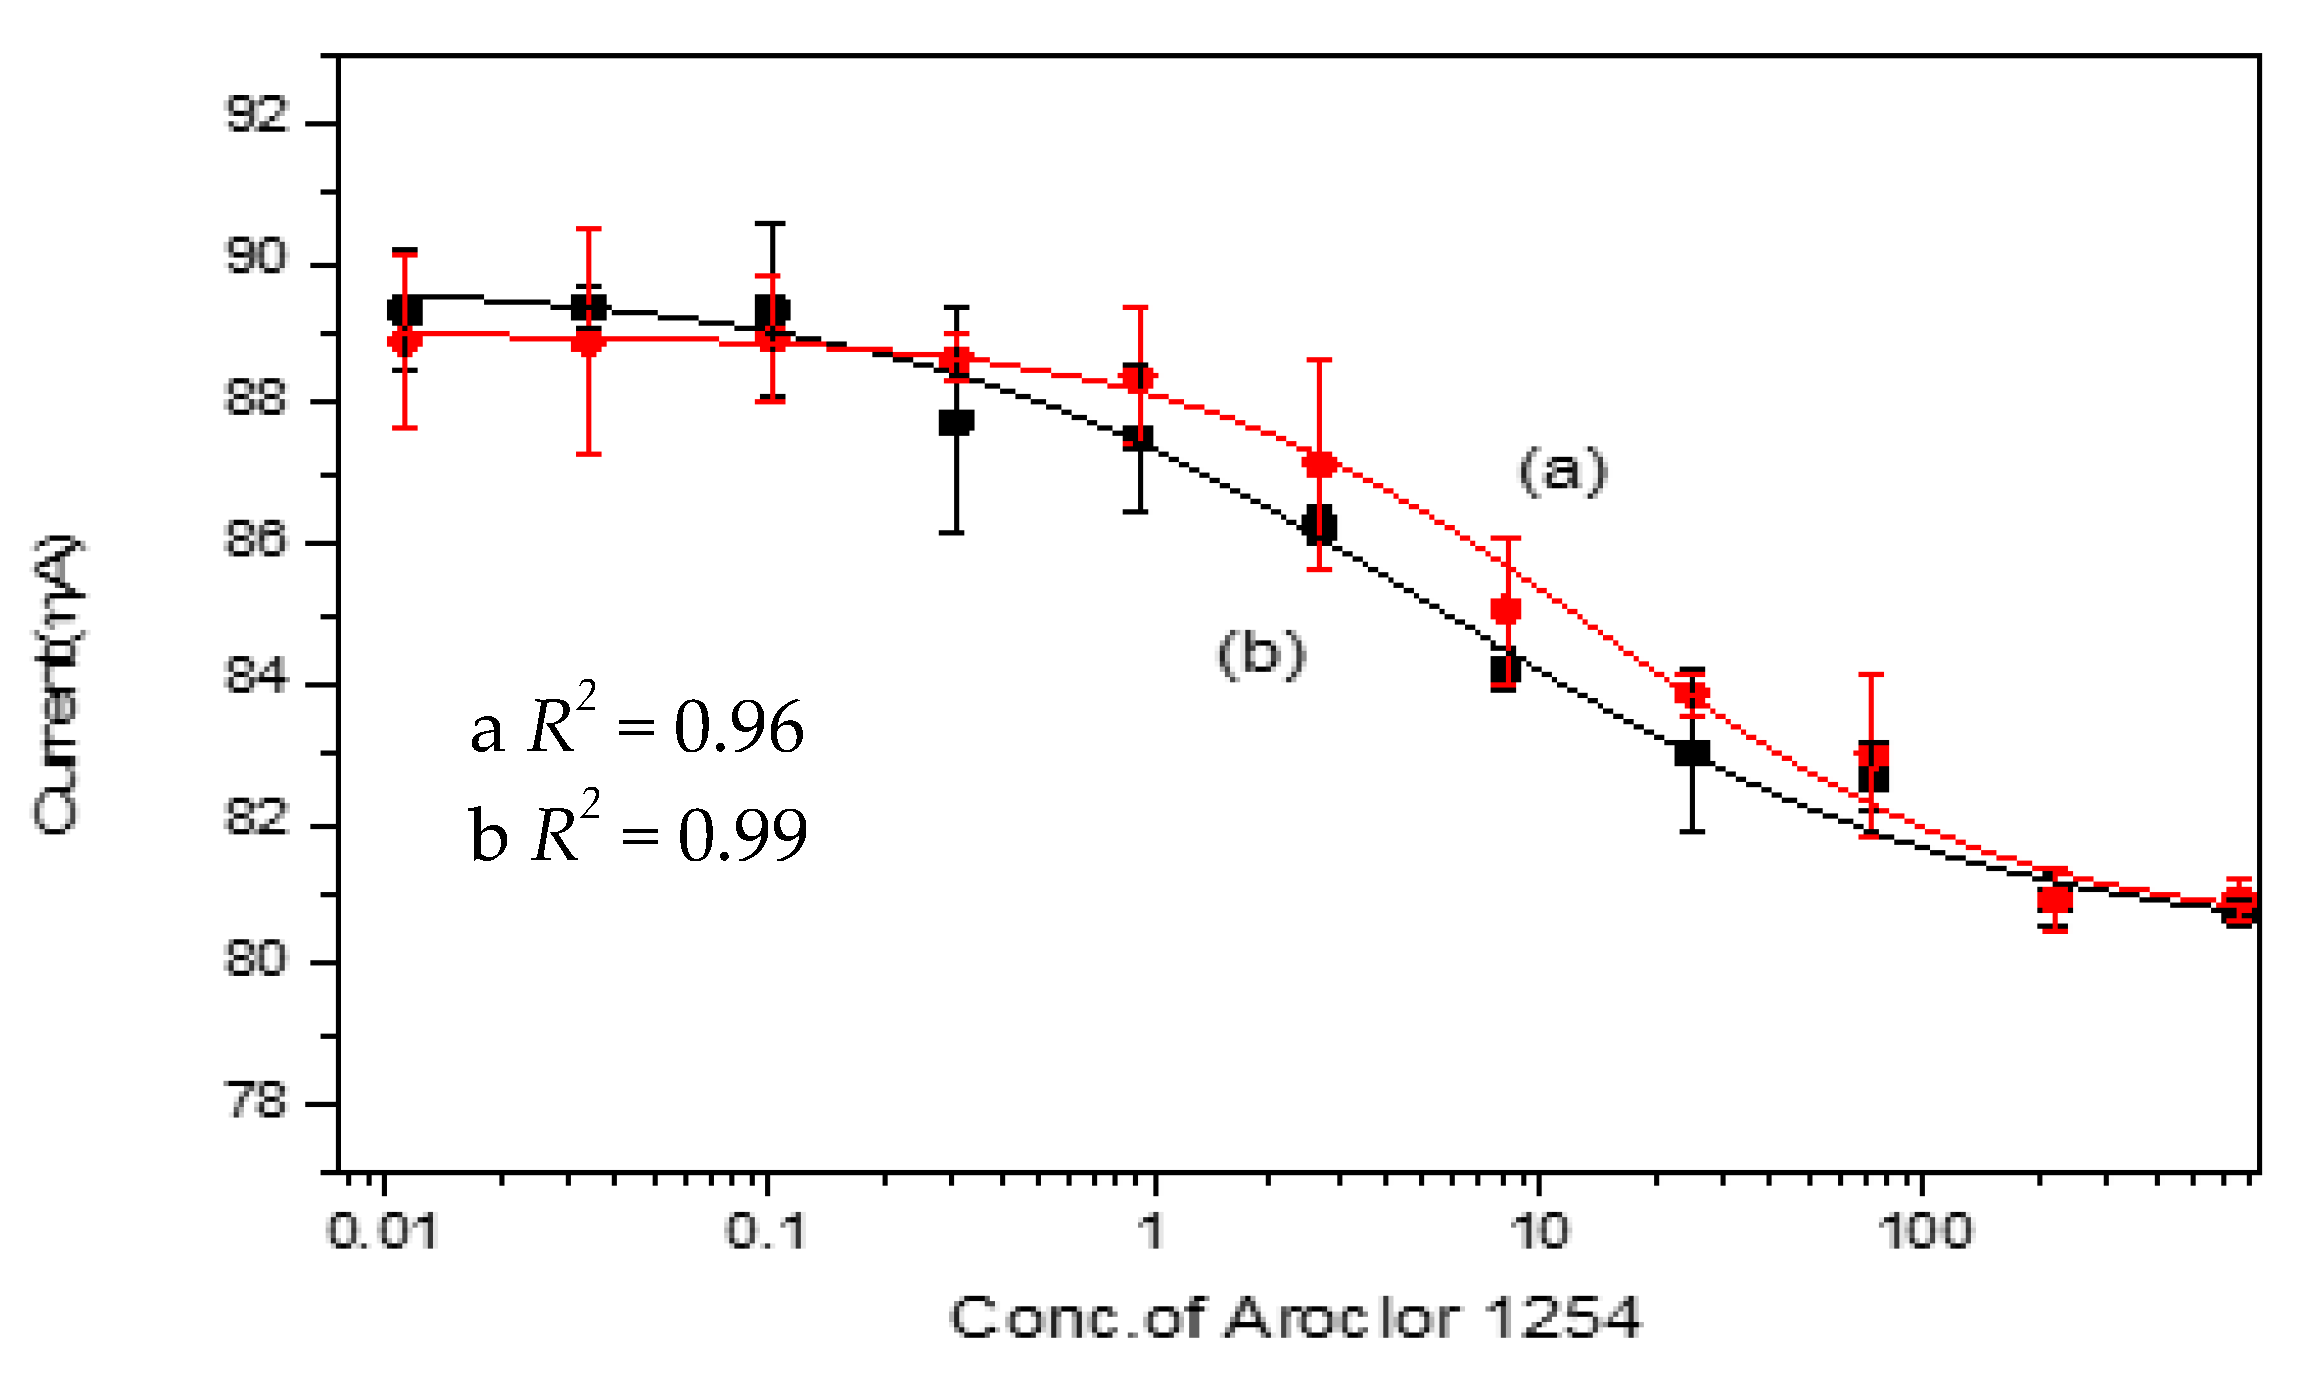
The modification of Au SPE/11MUA-SAM/EDC/NHS in this paper was successfully employed to determine PCBs (Aroclor 1254). In this paper, contact angle, SEM and AFM, the typical topography characterization techniques were used to examine the surface of bare and modified electrodes. In addition, investigation of biochips’ electrochemical behavior was carried out by way of impedance and cyclic voltammetry, through the use of 5 mM potassium ferricyanide/ferrocyanide in the presence of 0.1 M KCI as the redox probe. This redox pair was selected as they are one of the most studied redox complexes in electrochemistry. LSV and amperometry were used to test the stability of the coated electrode as well as the enzymatic redox reaction. The competitive assay was applied to test the developed SPE. The findings demonstrated a significant increase in sensitivity and analytical performance when compared to the SPE. Utilizing the 11-MUA SAM solution, modification of the electrode with the gold surface for detecting Aroclor 1254 determined an LOD of 0.09 ng/mL−1 and a linear range (220–0.101 ng/mL−1).
In an immunoassay, immobilizing protein to targeted sites without non-specific binding is critical. SAM was employed to reduce the random orientation of antibodies attaching to the surface. Findings indicated that the presence of SAM on the gold electrode increased the binding of the antibody to the surface, and therefore, sensor sensitivity was increased.
It was observed that the electrode became more insulated after the immersion of EDC/NHS and BSA-Aroclor 1254 coating conjugate. Overall, the developed chip showed good performance and stability and could be utilized for detection of PCB compounds using the proposed electrochemical immunosensor. This immunosensor could be used in conjunction with a portable device, allowing for in-field measurements. Moreover, much more work could be carried out to improve the commercialization of the described technique, such as minimizing the number of stages for the assay and the incubation time. In addition, further study could seek to increase the sensitivity and performance of the individual sensor measurements. This would also reduce the steps required for immunoassay testing in the field. Therefore, the integration into a real-time portable lab-on-a-chip solution could represent a future platform for monitoring organic pollution such as PCBs in the environment and avoid costly and non-efficient analysis of the samples in dedicated laboratories.

Author Contributions

Supervision, E.M.; writing—original draft, S.A.; reviewing—original draft, T.B. All authors have read and agreed to the published version of the manuscript.

Funding

This research was funded by the Ministry of Higher Education of Saudi Arabia.

Institutional Review Board Statement

Not applicable.

Informed Consent Statement

Not applicable.

Data Availability Statement

Not applicable.

Acknowledgments

The authors would like to acknowledge the financial support of the Ministry of Higher Education of Saudi Arabia. The author would like to thank Emma O’Sullivan-Carroll for constructive criticism of the manuscript.

Conflicts of Interest

The authors declare that there is no conflict of interest from any parts.

Appendix A

The following abbreviations were used in this manuscript:
∆Eppeak-to-peak separation
11-MUA11-mercaptoundecanoic acid
Ag/AgClsilver/silver chloride
APalkaline phosphatase
AFMatomic force microscopy
Augold
BSAbovine serum albumin
CVcyclic voltammetry
EDC1-Ethyl-3-(3-(dimethylamino)-propyl) carbodiimide
EISelectrochemical impedance spectroscopy
ELISAenzyme-linked immunosorbent assay
HPLChigh performance liquid chromatography
K3Fe (CN)6potassium ferricyanide
K4Fe (CN)6potassium ferrocyanide
KCIpotassium chloride
LODlimit of detection
LSVlinear sweep voltammetry
MeOHmethanol
NaClsodium chloride
NaCNBH4sodium cyanoborohydride
NaOHsodium hydroxide
NHSN-hydroxy succinimide
PAbpolyclonal antibodies
pAPPp-aminophenyl phosphate
PBSPhosphate-buffered saline
PCBpolychlorinated biphenyls
pNPPp-nitrophenyl phosphate
Rctcharge transfer resistance
SAMself-assembled monolayer
SEMscanning electron microscopy
SPGEscreen-printed gold electrodes
TRIStris(hydroxylmethyl)aminomethane

References

  1. Varanasi, P.; Fullana, A.; Sidhu, S. Remediation of PCB contaminated soils using iron nano-particles. Chemosphere 2007, 66, 1031–1038. [Google Scholar] [CrossRef]
  2. Chana, A.; Concejero, M.A.; De Frutos, M.; Gonzá Lez, M.J.; Herradón, B. Computational Studies on Biphenyl Derivatives. Analysis of the Conformational Mobility, Molecular Electrostatic Potential, and Dipole Moment of Chlorinated Biphenyl: Searching for the Rationalization of the Selective Toxicity of Polychlorinated Biphenyls (PCBs). Chem. Res. Toxicol. 2002, 15, 1514–1526. [Google Scholar] [PubMed]
  3. Cao, S.; Capozzi, S.L.; Kjellerup, B.V.; Davis, A.P. Polychlorinated biphenyls in stormwater sediments: Relationships with land use and particle characteristics. Water Res. 2019, 163, 114865. [Google Scholar] [CrossRef] [PubMed]
  4. The Risk Assessment Information System. Available online: https://rais.ornl.gov/tox/profiles/aroclor_1254_f_V1.html (accessed on 9 October 2021).
  5. Zheng, X.; Li, H.; Xia, F.; Tian, D.; Hua, X.; Qiao, X.; Zhou, C. An Electrochemical Sensor for Ultrasensitive Determination the Polychlorinated Biphenyls. Electrochim. Acta 2016, 194, 413–421. [Google Scholar] [CrossRef]
  6. Yang, G.; Zhuang, H.; Chen, H.; Ping, X.; Bu, D. A gold nanoparticle based immunosorbent bio-barcode assay combined with real-time immuno-PCR for the detection of polychlorinated biphenyls. Sens. Actuators B Chem. 2015, 214, 152–158. [Google Scholar] [CrossRef]
  7. Gabryszewska, M.; Gworek, B. Impact of municipal and industrial waste incinerators on PCBs content in the environment. PLoS ONE 2020, 15, e0242698. [Google Scholar] [CrossRef]
  8. Deng, A.P.; Kolář, V.; Ulrich, R.; Fránek, M. Direct competitive ELISA for the determination of polychlorinated biphenyls in soil samples. Anal. Bioanal. Chem. 2002, 373, 685–690. [Google Scholar] [CrossRef] [PubMed]
  9. Yang, G.; Zhuang, H.; Chen, H.; Ping, X. An indirect competitive enzyme-linked immunosorbent assay for the determination of 3,4-dichlorobiphenyl in sediment using a specific polyclonal antibody. Anal. Methods 2014, 6, 893–899. [Google Scholar] [CrossRef]
  10. Petrovic, M.; Sremacki, M.; Radonic, J.; Mihajlovic, I.; Obrovski, B.; Vojinovic Miloradov, M. Health risk assessment of PAHs, PCBs and OCPs in atmospheric air of municipal solid waste landfill in Novi Sad, Serbia. Sci. Total Environ. 2018, 644, 1201–1206. [Google Scholar] [CrossRef]
  11. Reddy, A.V.B.; Moniruzzaman, M.; Aminabhavi, T.M. Polychlorinated biphenyls (PCBs) in the environment: Recent updates on sampling, pretreatment, cleanup technologies and their analysis. Chem. Eng. J. 2019, 358, 1186–1207. [Google Scholar] [CrossRef]
  12. Wei, Y.; Kong, L.-T.; Yang, R.; Wang, L.; Liu, J.-H.; Huang, X.-J. Electrochemical impedance determination of polychlorinated biphenyl using a pyrenecyclodextrin-decorated single-walled carbon nanotube hybridw. Chem. Commun 2011, 47, 5340–5342. [Google Scholar] [CrossRef] [PubMed]
  13. Zhang, J.; Pan, M.; Gan, N.; Cao, Y.; Wu, D. Employment of a novel magnetically multifunctional purifying material for determination of toxic highly chlorinated polychlorinated biphenyls at trace levels in soil samples. J. Chromatogr. A 2014, 1364, 36–44. [Google Scholar] [CrossRef] [PubMed]
  14. Ayris, S.; Currado, G.M.; Smith, D.; Harrad, S. GC/MS procedures for the determination of PCBs in environmental matrices. Chemosphere 1997, 35, 905–917. [Google Scholar] [CrossRef]
  15. Van Emon, J.M.; Chuang, J.C. Development and application of immunoaffinity chromatography for coplanar PCBs in soil and sediment. Chemosphere 2013, 90, 1–6. [Google Scholar] [CrossRef] [PubMed]
  16. Cheng, J.; Wang, P.; Su, X.-O. Surface-enhanced Raman spectroscopy for polychlorinated biphenyl detection: Recent developments and future prospects. TrAC Trends Anal. Chem. 2020, 125, 115836. [Google Scholar] [CrossRef]
  17. West, C.; Lesellier, E. A unified classification of stationary phases for packed column supercritical fluid chromatography. J. Chromatogr. A 2008, 1191, 21–39. [Google Scholar] [CrossRef]
  18. Ramón-Azcón, J.; Valera, E.; Rodríguez, Á.; Barranco, A.; Alfaro, B.; Sanchez-Baeza, F.; Marco, M.P. An impedimetric immunosensor based on interdigitated microelectrodes (IDμE) for the determination of atrazine residues in food samples. Biosens. Bioelectron. 2008, 23, 1367–1373. [Google Scholar] [CrossRef]
  19. Liu, X.; Sakthivel, R.; Cheng, C.-Y.; Luo, J.; Song, L.; Wu, J.; He, W.; Younis, U.; Chung, R.-J. 3A-Amino-3A-Deoxy-(2AS, 3AS)-β-Cyclodextrin Hydrate/Tin Disulfide Modified Screen-Printed Carbon Electrode for the Electrochemical Detection of Polychlorinated Biphenyls. Nanoscale Res. Lett. 2020, 15, 4. [Google Scholar] [CrossRef]
  20. Yu, Y.; Chen, X.; Wei, Y.; Liu, J.-H.; Huang, X.-J. Strategy for Polychlorinated Biphenyl Detection Based on Specific Inhibition of Charge Transport Using a Nanogapped Gold Particle Film. Anal. Chem. 2012, 84, 9818–9824. [Google Scholar] [CrossRef]
  21. Moldovan, C.; Mihailescu, C.; Stan, D.; Ruta, L.; Iosub, R.; Gavrila, R.; Purica, M.; Vasilica, S. Characterization of self-assembled monolayers (SAMs) on silicon substrate comparative with polymer substrate for Escherichia coli O157:H7 detection§. Appl. Surf. Sci. 2009, 255, 8953–8959. [Google Scholar] [CrossRef]
  22. Centi, S.; Laschi, S.; Fránek, M.; Mascini, M. A disposable immunomagnetic electrochemical sensor based on functionalised magnetic beads and carbon-based screen-printed electrodes (SPCEs) for the detection of polychlorinated biphenyls (PCBs). Anal. Chim. Acta 2005, 538, 205–212. [Google Scholar] [CrossRef]
  23. Khesuoe, M.P.; Okumu, F.O.; Matoetoe, M.C. Development of a silver functionalised polyaniline electrochemical immunosensor for polychlorinated biphenyls. Anal. Methods 2016, 8, 7087–7095. [Google Scholar] [CrossRef]
  24. Ahmad, A.; Moore, E. Electrochemical immunosensor modified with self-assembled monolayer of 11-mercaptoundecanoic acid on gold electrodes for detection of benzo[a]pyrene in water. Analyst 2012, 137, 5839–5844. [Google Scholar] [CrossRef]
  25. Briand, E.; Salmain, M.; Herry, J.M.; Perrot, H.; Compère, C.; Pradier, C.M. Building of an immunosensor: How can the composition and structure of the thiol attachment layer affect the immunosensor efficiency? Biosens. Bioelectron. 2006, 22, 440–448. [Google Scholar] [CrossRef] [PubMed] [Green Version]
  26. Mendes, R.K.; Ferreira, D.C.M.; Carvalhal, R.F.; Peroni, L.A.; Kubota, L.T. Development of an Electrochemical Immunosensor for. J. Braz. Chem. Soc. 2009, 20, 795–801. [Google Scholar] [CrossRef] [Green Version]
  27. Tlili, A.; Abdelghani, A.; Ameur, S.; Jaffrezic-Renault, N. Impedance spectroscopy and affinity measurement of specific antibody–antigen interaction. Mater. Sci. Eng. C 2006, 26, 546–550. [Google Scholar] [CrossRef]
  28. Gutiérrez-Zúñiga, G.G.; Hernández-López, J.L. Sensitivity improvement of a sandwich-type ELISA immunosensor for the detection of different prostate-specific antigen isoforms in human serum using electrochemical impedance spectroscopy and an ordered and hierarchically organized interfacial supramolecular architecture. Anal. Chim. Acta 2016, 902, 97–106. [Google Scholar] [PubMed]
  29. Chaki, N.K.; Vijayamohanan, K. Self-assembled monolayers as a tunable platform for biosensor applications. Biosens. Bioelectron. 2002, 17, 1–12. [Google Scholar] [CrossRef]
  30. Arya, S.K.; Solanki, P.R.; Datta, M.; Malhotra, B.D. Recent advances in self-assembled monolayers based biomolecular electronic devices. Biosens. Bioelectron. 2009, 24, 2810–2817. [Google Scholar] [CrossRef]
  31. Ulman, A. Self-Assembled Monolayers of 4-Mercaptobiphenyls and the Garcia MRSEC for Polymers at Engineered Interfaces. Acc. Chem. Res. 2001, 34, 855–863. [Google Scholar] [CrossRef]
  32. Gooding, J.J.; Ciampi, S. The molecular level modification of surfaces: From self-assembled monolayers to complex molecular assemblies. Chem. Soc. Rev 2011, 40, 2704–2718. [Google Scholar] [CrossRef] [Green Version]
  33. Sayikli Şimşek, Ç.; Nur Sonuç Karaboğa, M.; Sezgintürk, M.K. A new immobilization procedure for development of an electrochemical immunosensor for parathyroid hormone detection based on gold electrodes modified with 6-mercaptohexanol and silane. Talanta 2015, 144, 210–218. [Google Scholar] [CrossRef]
  34. Bonroy, K.; Frederix, F.; Reekmans, G.; Dewolf, E.; De Palma, R.; Borghs, G.; Declerck, P.; Goddeeris, B. Comparison of random and oriented immobilisation of antibody fragments on mixed self-assembled monolayers. J. Immunol. Methods 2006, 312, 167–181. [Google Scholar] [CrossRef]
  35. Tsugimura, K.; Ohnuki, H.; Wu, H.; Endo, H.; Tsuya, D.; Izumi, M. Oriented antibody immobilization on self-assembled monolayers applied as impedance biosensors. J. Phys. Conf. Ser. 2017, 924, 012015. [Google Scholar] [CrossRef] [Green Version]
  36. Andreescu, S.; Sadik, O.A. Trends and challenges in biochemical sensors for clinical and environmental monitoring. Pure Appl. Chem. 2004, 76, 861–878. [Google Scholar] [CrossRef]
  37. Mollarasouli, F.; Kurbanoglu, S.; Ozkan, S.A. The role of electrochemical immunosensors in clinical analysis. Biosensors 2019, 9, 86. [Google Scholar] [CrossRef] [Green Version]
  38. Bakshi, S.; Mehta, S.; Kumeria, T.; Shiddiky, M.J.A.; Popat, A.; Choudhury, S.; Bose, S.; Nayak, R. Rapid fabrication of homogeneously distributed hyper-branched gold nanostructured electrode based electrochemical immunosensor for detection of protein biomarkers. Sens. Actuators B Chem. 2021, 326, 128803. [Google Scholar] [CrossRef]
  39. Xiao, X.; Li, H.; Wang, M.; Zhang, K.; Si, P. Examining the effects of self-assembled monolayers on nanoporous gold based amperometric glucose biosensors. Analyst 2014, 139, 488–494. [Google Scholar] [CrossRef]
  40. Haji-Hashemi, H.; Norouzi, P.; Safarnejad, M.R.; Ganjali, M.R. Label-free electrochemical immunosensor for direct detection of Citrus tristeza virus using modified gold electrode. Sens. Actuators B Chem. 2017, 244, 211–216. [Google Scholar] [CrossRef]
  41. Lawruk, T.S.; Lachman, C.E.; Jourdan, S.W.; Fleeker, J.R.; Hayes, M.C.; Herzog, D.P.; Rubio, F.M. Quantitative determination of PCBs in soil and water by a magnetic particle-based immunoassay. Environ. Sci. Technol. 1996, 30, 695–700. [Google Scholar] [CrossRef]
  42. Wang, M.S.; Palmer, L.B.; Schwartz, J.D.; Razatos, A. Evaluating Protein Attraction and Adhesion to Biomaterials with the Atomic Force Microscope. Langmuir 2004, 20, 7753–7759. [Google Scholar] [CrossRef] [PubMed]
  43. Narayan, T.; Kumar, S.; Kumar, S.; Augustine, S.; Yadav, B.K.; Malhotra, B.D. Protein functionalised self assembled monolayer based biosensor for colon cancer detection. Talanta 2019, 201, 465–473. [Google Scholar] [CrossRef] [PubMed]
  44. Chuang, W.-H.; Lin, J.-C. Surface characterization and platelet adhesion studies for the mixed self-assembled monolayers with amine and carboxylic acid terminated functionalities. J. Biomed. Mater. Res. Part A 2007, 82, 820–830. [Google Scholar] [CrossRef]
  45. Baio, J.E.; Weidner, T.; Brison, J.; Graham, D.J.; Gamble, L.J.; Castner, D.G. Amine terminated SAMs: Investigating why oxygen is present in these films. J. Electron Spectrosc. Relat. Phenom. 2009, 172, 2–8. [Google Scholar] [CrossRef] [Green Version]
  46. Rechendorff, K.; Hovgaard, M.B.; Foss, M.; Zhdanov, V.P.; Besenbacher, F. Enhancement of Protein Adsorption Induced by Surface Roughness. Appl. Phys. Lett 2003, 5, 10885–10888. [Google Scholar] [CrossRef]
  47. Kim, S.Y.; Yu, J.; Son, S.J.; Min, J. Signal enhancement in a protein chip array using a 3-D nanosurface. Ultramicroscopy 2010, 110, 659–665. [Google Scholar] [CrossRef]
  48. Finklea, H.O.; Hanshew, D.D. American Chemical Society Electron-Transfer Kinetics in Organized Thiol Monolayers with Attached Pentaammine(pyridine)ruthenium Redox Centers. J. Am. Chem. Soc. 1992, 114, 3173–3181. [Google Scholar] [CrossRef]
  49. Miller, C.; Cuendet, P.; Grätzel, M. Adsorbed ω-hydroxy thiol monolayers on gold electrodes: Evidence for electron tunneling to redox species in solution. J. Phys. Chem. 1991, 95, 877–886. [Google Scholar] [CrossRef]
  50. Xing, Y.F.; O’Shea, S.J.; Li, S.F.Y. Electron transfer kinetics across a dodecanethiol monolayer self assembled on gold. J. Electroanal. Chem. 2003, 542, 7–11. [Google Scholar] [CrossRef]
  51. Patel, N.; Davies, M.C.; Heaton, R.J.; Roberts, C.J.; Tendler, S.J.B.; Williams, P.M. A scanning probemicroscopy study of the physisorption and chemisorption of protein molecules onto carboxylate terminated self-assembledmonolayers. Appl. Phys. A Mater. Sci. Process. 1998, 66, 569–574. [Google Scholar] [CrossRef]
  52. Lu, X.; Li, M.; Yang, C.; Zhang, L.; Li, Y.; Jiang, L.; Li, H.; Jiang, L.; Liu, C.; Hu, W. Electron Transport through a Self-Assembled Monolayer of Thiol-End-Functionalized Tetraphenylporphines and Metal Tetraphenylporphines. Langmuir 2006, 22, 3035–3039. [Google Scholar] [CrossRef]
  53. Radi, A.E.; Muñoz-Berbel, X.; Cortina-Puig, M.; Marty, J.L. An electrochemical immunosensor for ochratoxin A based on immobilization of antibodies on diazonium-functionalized gold electrode. Electrochim. Acta 2009, 54, 2180–2184. [Google Scholar] [CrossRef]
  54. Molinero, V.; Calvo, E.J. Electrostatic interactions at self assembled molecular films of charged thiols on gold. J. Electroanal. Chem. 1998, 445, 17–25. [Google Scholar] [CrossRef]
  55. Cecchet, F.; Marcaccio, M.; Margotti, M.; Paolucci, F.; Rapino, S.; Rudolf, P. Redox mediation at 11-mercaptoundecanoic acid self-assembled monolayers on gold. J. Phys. Chem. B 2006, 110, 2241–2248. [Google Scholar] [CrossRef] [Green Version]
  56. Fähnrich, K.A.; Pravda, M.; Guilbault, G.G. Disposable amperometric immunosensor for the detection of polycyclic aromatic hydrocarbons (PAHs) using screen-printed electrodes. Biosens. Bioelectron. 2003, 18, 73–82. [Google Scholar] [CrossRef]
  57. Moore, E.J.; Pravda, M.; Kreuzer, M.P.; Guilbault, G.G. Comparative study of 4-aminophenyl phosphate and ascorbic acid 2-phosphate, as substrates for alkaline phosphatase based amperometric immunosensor. Anal. Lett. 2003, 36, 303–315. [Google Scholar] [CrossRef]
  58. Kaya, S.I.; Cetinkaya, A.; Bakirhan, N.K.; Ozkan, S.A. Trends in sensitive electrochemical sensors for endocrine disruptive compounds. Anal. Chem. 2020, 28, e00106. [Google Scholar]
  59. Mohammadi, A.; Heydari-Bafrooei, E.; Foroughi, M.M.; Mohammadi, M. Electrochemical aptasensor for ultrasensitive detection of PCB77 using thionine-functionalized MoS 2-rGO nanohybrid. Microchem. J. 2020, 155, 104747. [Google Scholar] [CrossRef]
Figure 1. Structure of Arcolor 1254.
Chemosensors 09 00307 g001
Figure 2. The graphic depicts the synthesis of SAM from 11-MUA on a gold electrode in combination with antibody immobilization. (Note abbreviations were included in Appendix A).
Chemosensors 09 00307 g002
Figure 3. The steps involved in the formation of self-assembled monolayers on the gold electrode.
Chemosensors 09 00307 g003
Figure 4. Typical topography of the bare electrode surfaces of gold SPE and modified with SAM. Contact angle graphs of bare electrode (A) and SAM-modified electrode (B); SEM micrographs of bare electrode (C) and 11MUA-SAM-modified electrode (D); top cross-section (×100 magnification); AFM micrographs (E) bare Au, (F) 11-MUA SAM (20 h), (G) EDC/NHS (1 h), (H) BSA-Aroclor 1254 coating conjugate.
Chemosensors 09 00307 g004
Figure 5. Electrochemical characterization of modified electrode. (A) A stability study of the coated BSA-Aroclor 1254 on a gold electrode surface was performed using linear sweep voltammetry. Prior to the measurements, the coated electrode was stored at 4 °C. Three electrodes were measured every day for 10 days. (B) The voltammogram of CV for the bare gold electrode and the gold electrode after SAM modification with 11-MUA. (C) Impedance spectra of the bare gold electrode, after 20 h SAM, activation with EDC/NHS and immobilization with 5 µg/mL−1 BSA-Aroclor 1254. The redox couple was 5 Mm [Fe (CN)6]3−/4− in 0.1 KCl. Frequency measured from 0.1 Hz to 1 MHz, with amplitude of 0.1 V, potential applied at 0.21 V. The inserted circuit is Randle’s equivalent, where Rs represents the dynamic solution resistance, Rct represents the charge transfer resistance of the immobilize recognition layer, CdI indicates the capacitance measured between the gold electrode and the electrolyte solution on a double layer basis, and Zw is the Warburg element describing the time frequency. (D) Amperometric detection of a chip modified AP containing bilayer (competitive assay) was measured in DEA buffer pH 9.5 at potential of 0.45 V vs. Ag/AgCl. The substrate pAPP was injected at 40 s.
Chemosensors 09 00307 g005
Figure 6. A competitive assay was conducted in which the performance of the gold electrode modified with 11-MUA was compared with the assay performance using (a) a bare gold electrode and (b) SAM modification gold electrode.
Chemosensors 09 00307 g006
Table 1. The water contact angle of gold electrodes treated with thiol SAM.
Before SAMAfter SAM
Contact angle θ (°)56.935.4
Relative standard deviation (%)3.7%2.2%
Measurement was taken five times for each electrode.
Table 2. Surface roughness and particle diameters of bare and modified gold electrodes.
Bare Gold ElectrodeSAM (20 h)EDC/NHS (1 h)Bsa-Alcoler1254 Coating Conjugate
Surface Roughness4.742.82.882.94
Min particles diameter (nm)11.86--11.86
Max particles diameter (nm)107.74--141.2
Data obtained from NanoScope Analysis 1.9 software.
Table 3. Parameter evaluation for the Randle’s model on a gold electrode.
SurfaceRS (Ω)Rct (KΩ)CdI (F/cm2) × 10−6
Bare gold7.520.3858.20
SAM (20 h)7.7912.561.18
EDC/NHS (1 h)7.7427.130.81
BSA-Arcoler 12547.7934.920.57
Data obtained from CHI 1100/620B software.
Table 4. The cross-reactivities of the antibody against Aroclor 1254 and other Aroclor using competitive assay.
CompoundIC50 (ng/mL−1)CR (%)
Aroclor 12543.94100
Aroclor 124814.427.36
Aroclor 12605.2075.765
Aroclor 124211.5734
Aroclor 12626.3062.53
Aroclor 101613.2729.6
Table 5. Comparison with previously reported electrochemical PCB immunosensors with present work.
ImmunosensorAnalyteLODLinear RangeRef.
MoS2-rGO/Thi/AuNP/GCEPCB7780 ag mL−10.3 fg mL−1–0.1 ng mL−1[58,59]
SnS2/β-CD modified screen-printed electrodeAroclor10165 µM0.625 to 80 µM[19]
β-CDP/rGO/PPy/PGEPCB0.50 pM1.0 pM–10.0 µM[5]
Gold bare electrodeAroclor of 12540.20 ng/mL−10.304–220 ng/mL−1This work
Au SPE/11MUA-SAM/EDC/NHSAroclor of 12540.09 ng/mL−10.1 to 220 ng/mL−1This work
Table 6. MUA-SAM/EDC/NHS/SPGE and ELISA (immunoassay) for the determination of Aroclor 1254 in tap and river water.
TechniquesSampleAdded (ng/mL−1)Found (ng/mL−1)Recovery %RSD % (n = 3)
11-MUA-SAM/EDC/NHS/SPGERiver water7572.75971.34
11-MUA-SAM/EDC/NHS/SPGETap water7568.25912.35
ELISARiver water75901206.88
ELISATap water7580.44107.264.96
Publisher’s Note: MDPI stays neutral with regard to jurisdictional claims in published maps and institutional affiliations.

