Article

An Active Surface Preservation Strategy for the Rational Development of Carbon Dots as pH-Responsive Fluorescent Nanosensors

by
Ana Carolina P. Afonso
1,
Ana Salomé Correia
2,3,
Diana Duarte
2,3,
Ana T. S. C. Brandão
1,
Maria del Valle Martínez de Yuso
4,
José Jiménez-Jiménez
5,
Nuno Vale
2,3,
Carlos M. Pereira
1,
Manuel Algarra
5 and
Luís Pinto da Silva
1,6,*
1
Chemistry Research Unit (CIQUP), Faculty of Sciences, University of Porto, R. Campo Alegre 687, 4169-007 Porto, Portugal
2
OncoPharma Research Group, Center for Health Technology and Services Research (CINTESIS), Rua Dr. Plácido da Costa, s/n, 4200-450 Porto, Portugal
3
Department of Community Medicine, Health Information and Decision (MEDCIDS), Faculty of Medicine, University of Porto, Alameda Prof. Hernâni Monteiro, 4200-319 Porto, Portugal
4
X-ray Photoelectron Spectroscopy Lab., Central Service to Support Research Building (SCAI), University of Málaga, 29071 Málaga, Spain
5
Department of Inorganic Chemistry, Faculty of Science, University of Málaga, 29007 Málaga, Spain
6
LACOMEPHI, GreenUPorto, Department of Geosciences, Environment and Territorial Planning, Faculty of Sciences, University of Porto, R. Campo Alegre 697, 4169-007 Porto, Portugal
*
Author to whom correspondence should be addressed.
Submission received: 25 June 2021 / Revised: 19 July 2021 / Accepted: 21 July 2021 / Published: 24 July 2021

Abstract

:
Here we report the rational development of a carbon dot (CDs)-based fluorescent pH nanosensor by employing an active surface preservation strategy. More specifically, citric acid, urea and fluorescein were subjected to a one-pot hydrothermal treatment, which preserved fluorescein-like structures on the surface of the CDs. The obtained CDs showed pH-sensitive green emission, which can be used to determine pH variations from 3.7 to 12.1 by fluorescence enhancement. Moreover, the obtained nanoparticles showed excellent selectivity toward pH, fluorescence reversibility in different pH values, photostability, while being compatible with human cell lines (even at high concentrations). Furthermore, their performance as pH sensors was comparable with reference pH determination procedures. Thus, an active surface preservation strategy was successfully employed to develop fluorescence pH nanosensors in a rational manner and without post-synthesis functionalization strategies, which show potential for future use in pH determination.

1. Introduction

Carbon dots (CDs) are carbon-based nanoparticles with photoluminescent properties [1]. The methods to prepare CDs can be divided into top-down and bottom-up approaches. Top-down refers to the breakdown of bulk carbon materials to a smaller size via laser irradiation, or electrochemical and chemical exfoliation. This tends to be an expensive procedure and it is less scalable than the other synthesis methods [2]. A bottom-up approach consists of producing CD from small molecules, through either hydrothermal/solvothermal treatment, carbonization and microwave methods, and it is a more cost-effective method [3,4].
CDs have a wide range of applications in many different fields, such as being used as sensors [5,6], in catalysis [7], as rechargeable batteries [8], and in bioimaging [9], phototherapy [10] and drug delivery [11]. The development of so high a number and types of practical applications for CDs is not surprising, given their advantageous characteristics: good (photo)chemical stability, tunable fluorescence emission, good water dispersibility, biocompatibility and low toxicity.
Among the above-described practical applications, the most arguably sought-after one is the development of CDs as fluorescent nanosensors toward the selective determination of several types of analytes, such as metal ions [1,12,13,14,15], reactive oxygen species [16,17], nitroexplosives [18], pH [6,12,15,19,20,21,22,23], etc. One of the reasons for this is that CDs can present different reactivities and selectivity toward various analytes of interest, by varying their precursors and/or reaction times, solvents and temperature. So, CDs are a promising platform for the development of selective nanosensors for different analytes of interest.
However, the rational development of novel CDs-based nanosensors is impaired by the lack of knowledge regarding the mechanism that governs their reactivity/response toward different analytes. While it is known that using different precursors and/or tuning reaction parameters can lead to CDs with different selectivity toward various analytes without post-synthesis functionalization, it is rarely known why a given precursor/reaction parameter leads to a specific selectivity. Thus, a rational approach to CDs-based sensor development and design, without post-synthesis functionalization, is generally prevented. This leaves researchers with one of two approaches: random development of different CDs and subsequent testing against a specific analyte; development of one CDs and random testing against different analytes.
To provide rationality to the process of CDs-based sensor development, post-synthesis functionalization strategies can be employed to add to the surface of CDs specific sensing moieties. However, these modifications tend to require time-consuming and costly post-synthesis steps [12,13]. The most used method is based on the formation of covalent bonds by following the EDC (1-(3-Dimethylaminopropyl)-3-ethylcarbodiimide hydrochloride) protocol. EDC is unstable in aqueous solutions at acidic pH in which hydrolysis occurs, and so, if the conditions divert from the ideal terms, the efficiency of this method would be lower [24].
Herein, a strategy that allows the rational development of CDs-based sensors without post-synthesis functionalization is sorely needed. A solution to this problem can be the active surface preservation (ASP) strategy, in which a molecule with a known reactivity/selectivity is used as a precursor and treated so their functional moieties are preserved on the surface of the CDs, without post-synthesis functionalization [12,14,16,21]. Thus, CDs with specific reactivity/selectivity could be rationally prepared in a facile, cost-effective and versatile method, without the need for extra time-consuming, complex and costly functionalization steps [12,14,16,21].
Despite this, the ASP strategy is still not widely used, being few the reports in the literature. Hou et al. [12] used the ASP strategy to generate CDs from the known antibiotic ciprofloxacin hydrochloride, which retained on their surface ciprofloxacin-like structures, thus rationally developing a nanoparticle with antibacterial activity. Simões et al. [16] used as a precursor the adduct formed between alizarin red and phenylboronic acid, which is known for a red-shifted emission and to respond to reactive oxygen species, resulting in a CDs-based nanosensor for the detection of ClO-. Finally, Li et al. used the ASP strategy to develop CDs with cysteine-like structure preserved on their surface, which provided them with high Golgi specificity/targeting [21].
Given this, our aim in this work is to use the ASP strategy to rationally develop a CDs-based nanosensor with controllable sensing properties. More specifically, a CDs-based nanosensor for pH sensing is developed as a proof-of-concept, via the ASP strategy by employing fluorescein as one of the precursors. Fluorescein is a commonly used fluorophore, despite being one of the least photostable dyes, with its popularity deriving from its high quantum yield and long wavelengths of absorption and emission. Fluorescein was one of the first studied pH sensors, being used to determine intracellular pH values. This relates to the four possible forms of this molecule, being able to occur in aqueous solutions in its cationic, neutral, anionic and dianionic forms [25].
Organic dyes, such as fluorescein and its derivatives, despite their promising properties for pH measurement still present problematic drawbacks that reduce their applicability. As mentioned above, fluorescein undergoes photobleaching when exposed to light, decreasing its fluorescent emission significantly, causing an issue for pH monitoring and removing the option for repeated measurements [26,27]. Proper sensors also require good solubility, with water solubility being of high importance for pH monitorization. While CDs tend to present good water solubility, organic dyes may not and often need to be tuned via substituents [2,28]. Quantum dots (QDs) and metal containing nanoparticles have also shown potential for fluorescence sensing due to their valuable properties [29]. QDs are commonly combinations of transition metals and metalloid elements, including groups III-V, II-VI and IV-VI. The use of these precursors gives rise to health and environmental concerns, as residual QDs may eventually contaminate the environment by releasing toxic metal ions during their decay process [30,31]. Their toxicity depends on various physicochemical properties, and environmental conditions, impairing their applicability and leading to the necessity for the development of safer and greener materials and synthesis [32].
CDs for fluorescent pH monitorization have already been studied before [6,15,20,22,23], as the development of pH sensors is of high relevance, given the important role of pH in many aspects of environmental, industrial and biomedical processes. Moreover, while glass-pH-electrodes (the most used sensors) have excellent performance and reproducibility, they present relevant limitations: temperature-dependent response, rigid design and fragility. This limits their application for cellular pH sensing and in small volume samples. In such cases, fluorescent-based pH sensors are potential alternatives, with CDs being a promising material [6,15,20,22,23]. However, there are still issues that plague the current level of development of CDs-based pH sensors. First of all, there is still a degree of randomness in the process, without being clear a priori why chosen precursors could lead to pH-sensitive CDs, which complicates rational development and optimization of future sensors [15,20,22,23]. Second, the obtained pH ranges to which CDs are responsive are somewhat limited, with some examples being 6.0–10.0 [23], 6.1–7.8 [22], 5.25–6.75 [20] and 5.2–8.8 [6]. Finally, while being responsive to pH, these CDs also tend to respond to the presence of metal ions, not being selective toward pH variation [12,15].
In this work, we employed an ASP strategy to rationally develop CDs-based fluorescent nanosensors from fluorescein, citric acid, and urea via one-pot hydrothermal treatment. The resulting CDs present pH-sensitive emission at 525 nm, with a good fluorescence-enhancement response with pH variation from 3.7 to 12.1. Furthermore, the pH nanosensor presented excellent selectivity toward pH over several interferents and microenvironmental factors, while exhibiting good photostability and pH-reversibility. Furthermore, in vitro viability assays with human cell lines demonstrated the biocompatibility of these novel CDs. Thus, due to their sensing, physicochemical and biocompatibility properties, these CDs are suitable for pH-sensing, showing potential for future biological applications.

2. Materials and Methods

2.1. Instruments

Fluorescence spectra were measured in standard 10 mm fluorescence quartz cells in a setup composed of an Ocean Optics LS-LED light source (at 450 nm), a CUV-FL-DA Cuvette Holder from Ocean Optics and an Ocean Optics USB4000-FL-450 spectrometer, pre-configured for fluorescence measurements from 360–1000 nm. Absorption spectra were obtained with a VWR UV-3100PC spectrophotometer, by using quartz cells. Non-fluorescence pH-measurements were performed with a Crison micropH 2002 pH-meter and a Sentek pH electrode. The Zeta Potential was measured by using a particle analyzer Anton Paar LitesizerTM 500 (Graz, Austria) and a polycarbonate Omega Cuvette (Ref. 155765). The X-ray photoelectron spectra (XPS) obtained were analyzed using PHI SmartSoft software and processed using MultiPak 9.3 package. The binding energy values were referenced to adventitious carbon C 1s signal (284.8 eV). Shirley-type background and Gauss-Lorentz curves were used to determine the binding energies. The morphology of CDs was evaluated by a high-resolution transmission electron microscopy (HR-TEM) on a FEI Talos F200X. Direct injection ESI-MS was made using a Thermo FinniganTM LCQTM Deca XP Max mass spectrometer. This device consists of an electrospray interface as ionization source and a quadruple ion trap for MSn experiments. Atomic Force Microscopy (AFM) analysis was performed using a CSI Instruments Nano-Observer equipment (Paris, France), and Nano-Observer 1.36 Software, operated in tapping mode using a SPM probe ACT-SS, silicon coated, with a resonance frequency of 200 to 400 kHz. The image processing software used was Gwyddion 2.59.

2.2. Preparation of CDs

The CDs were prepared via a one-pot hydrothermal approach of a 10 mL mixture of 0.1M NaOH solution containing citric acid (200 mg), urea (200 mg) and fluorescein (300 mg), which was transferred to a Teflon-lined reactor with stainless steel shell and heated at 250 °C in a Heraeus D-6450 Hanau oven for 4 h (resulting in a carbonized product). Subsequently, the reaction product was re-dispersed in 15 mL of a pH 4.7 buffer solution and centrifuged at 6000 rpm for 20 min in a Hettich Mikro 220R centrifuge. The addition of acidic buffer was made to try to facilitate the precipitation of unreacted fluorescein, less soluble in acidic aqueous solution. The precipitate was discarded, and the supernatant was diluted in acetone and subsequently centrifuged at 6000 rpm for 50 min, to precipitate hydrophilic CDs while further separating them from unreacted fluorescein (soluble in acetone). The supernatant was discarded, and the precipitate was dissolved in 10 mL of a pH 4.7 buffer solution. The CDs were further purified by dialysis using Float-A-LyzersG2 Dialysis Device SPECTRUMs (molecular weight cut-off of ~1000 Da) for 67 h. The dialyzed solution was evaporated overnight to calculate the synthesis yield, which was measured as 5% (w/w, %). Finally, the CDs were dissolved in aqueous solution, resulting in a stock solution of 2.8 g/L.

2.3. Fluorometric Determination of the pH Curve

For this study, four different types of buffer solutions were prepared, based on the protocol developed by Dardonville [33]: 0.1 M sodium acetate solution (pH 3–5), 0.05 M potassium hydrogen phosphate solution (pH 6–8), 0.025 M borax solution (pH 9–10) and 0.05 M disodium hydrogen phosphate solution (pH 11–12). The pH was adjusted to the required value using 0.1 M HCl and 0.1 M NaOH, and the ionic strength was adjusted to 0.1 M by adding KCl. Solutions with varying pH values were then obtained. For each measurement, 10 μL of CDs dispersion (0.014 g/L) was added to 1990 μL of buffer with different pH values. The resulting solution was well-mixed, and the fluorescence spectra recorded at least in triplicate.

2.4. Determination of the Fluorescence Quantum Yield

The fluorescence quantum yield (QY) with the following equation:
Y = Q Y R × G r a d G r a d R × η 2 η R 2
In the equation, QY is the fluorescence quantum yield, Grad is the gradient from the plot of integrated fluorescence intensity versus absorbance and η is the refractive index. The subscript R refer to the reference fluorophore with a known QY. In this case, this refers to fluorescein, with a QY of 93% [34].

2.5. Cell Culture

SH-SY5Y human neuroblastoma cells were purchased from the American Type Culture Collection (ATCC, Manassas, VA, USA), cultured in Dulbecco’s modified Eagle Medium (DMEM), supplemented with 100 U/mL penicillin, 100 μg/mL streptomycin and 10% heat-inactivated fetal bovine serum (FBS), incubated at 37 °C in a humidified atmosphere (95% air, 5% CO2). Cell media was removed every 3 days. Cells were subcultured when confluency of 75–80% was reached.

2.6. Cell Viability Assay

The cytotoxicity of the obtained CDs was evaluated by a standard 3-(4,5-dimethyl-2-thiazolyl)-2,5-diphenyl-2H-tetrazolium bromide (MTT) assay. For this assay, SH-SY5Y cells were trypsinized (0.25% trypsin-EDTA), centrifuged (1100 rpm, 5 min; Hettich, Tuttlinger, Germany) and seeded in 96-well plates, at a density of 5.5 × 10⁴ cells/mL, being allowed to attach for a period of 24 h. Then, cells were treated with CDs in aqueous solution at 0.01–1 g/L, for 48 h. After this treatment, the cell culture medium was removed and the MTT solution (0.5 mg/mL in PBS; 100 μL), was added to each well, followed by an incubation period of 3 h, protected from the light. After this period, the MTT solution was removed, and 100 μL of DMSO was added to each well to dissolve the formed formazan crystals. Absorbance at 570 nm was determined in an automated microplate reader (Infinite M200, Tecan Trading AG, Männedorf, Switzerland). Results were expressed as a percentage of control. All conditions were performed in triplicates, processed in parallel.

3. Results and Discussions

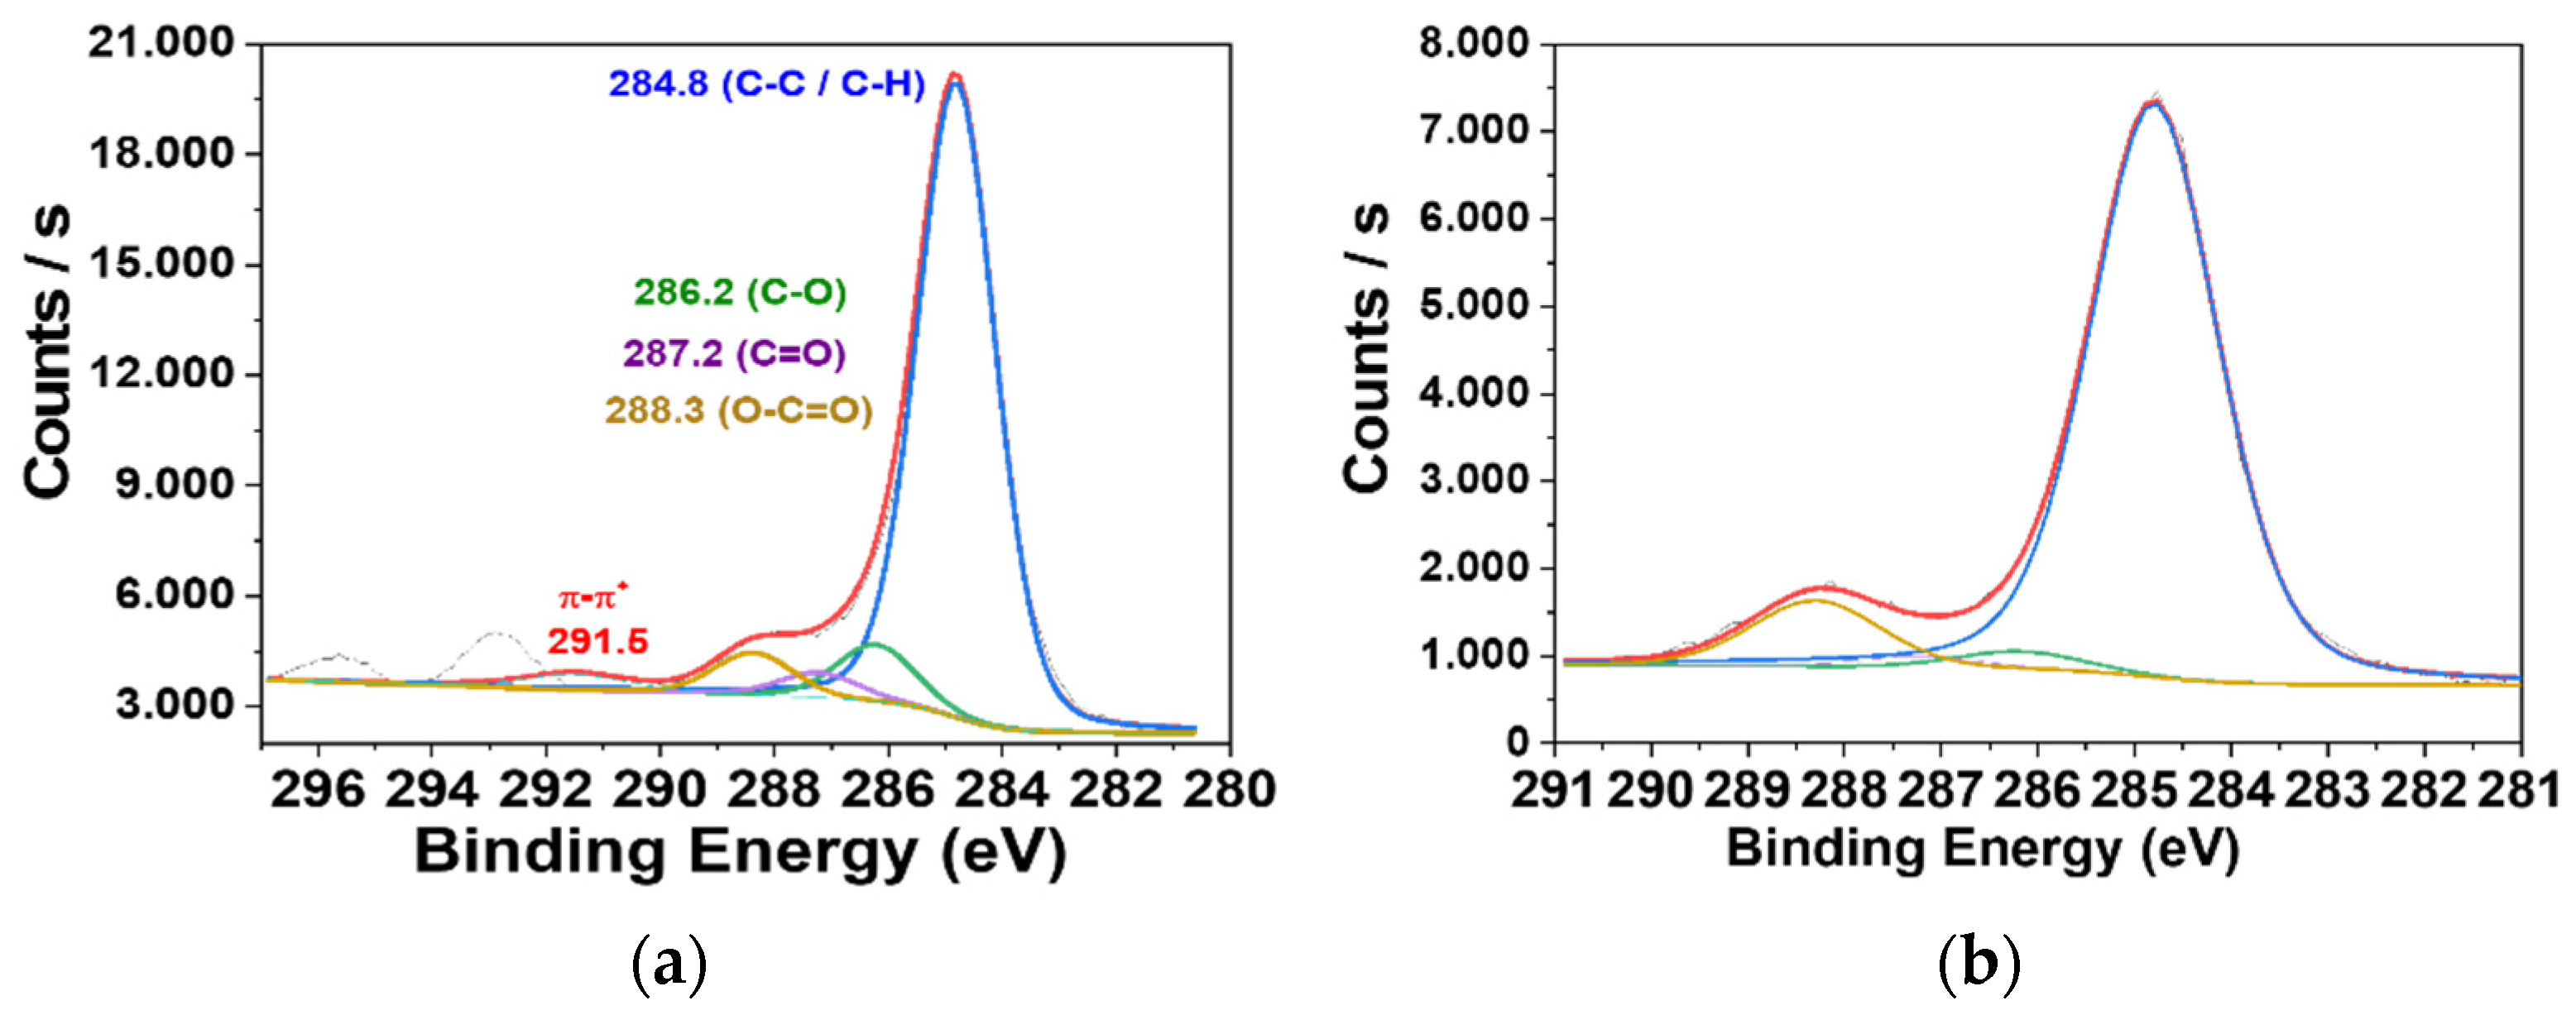
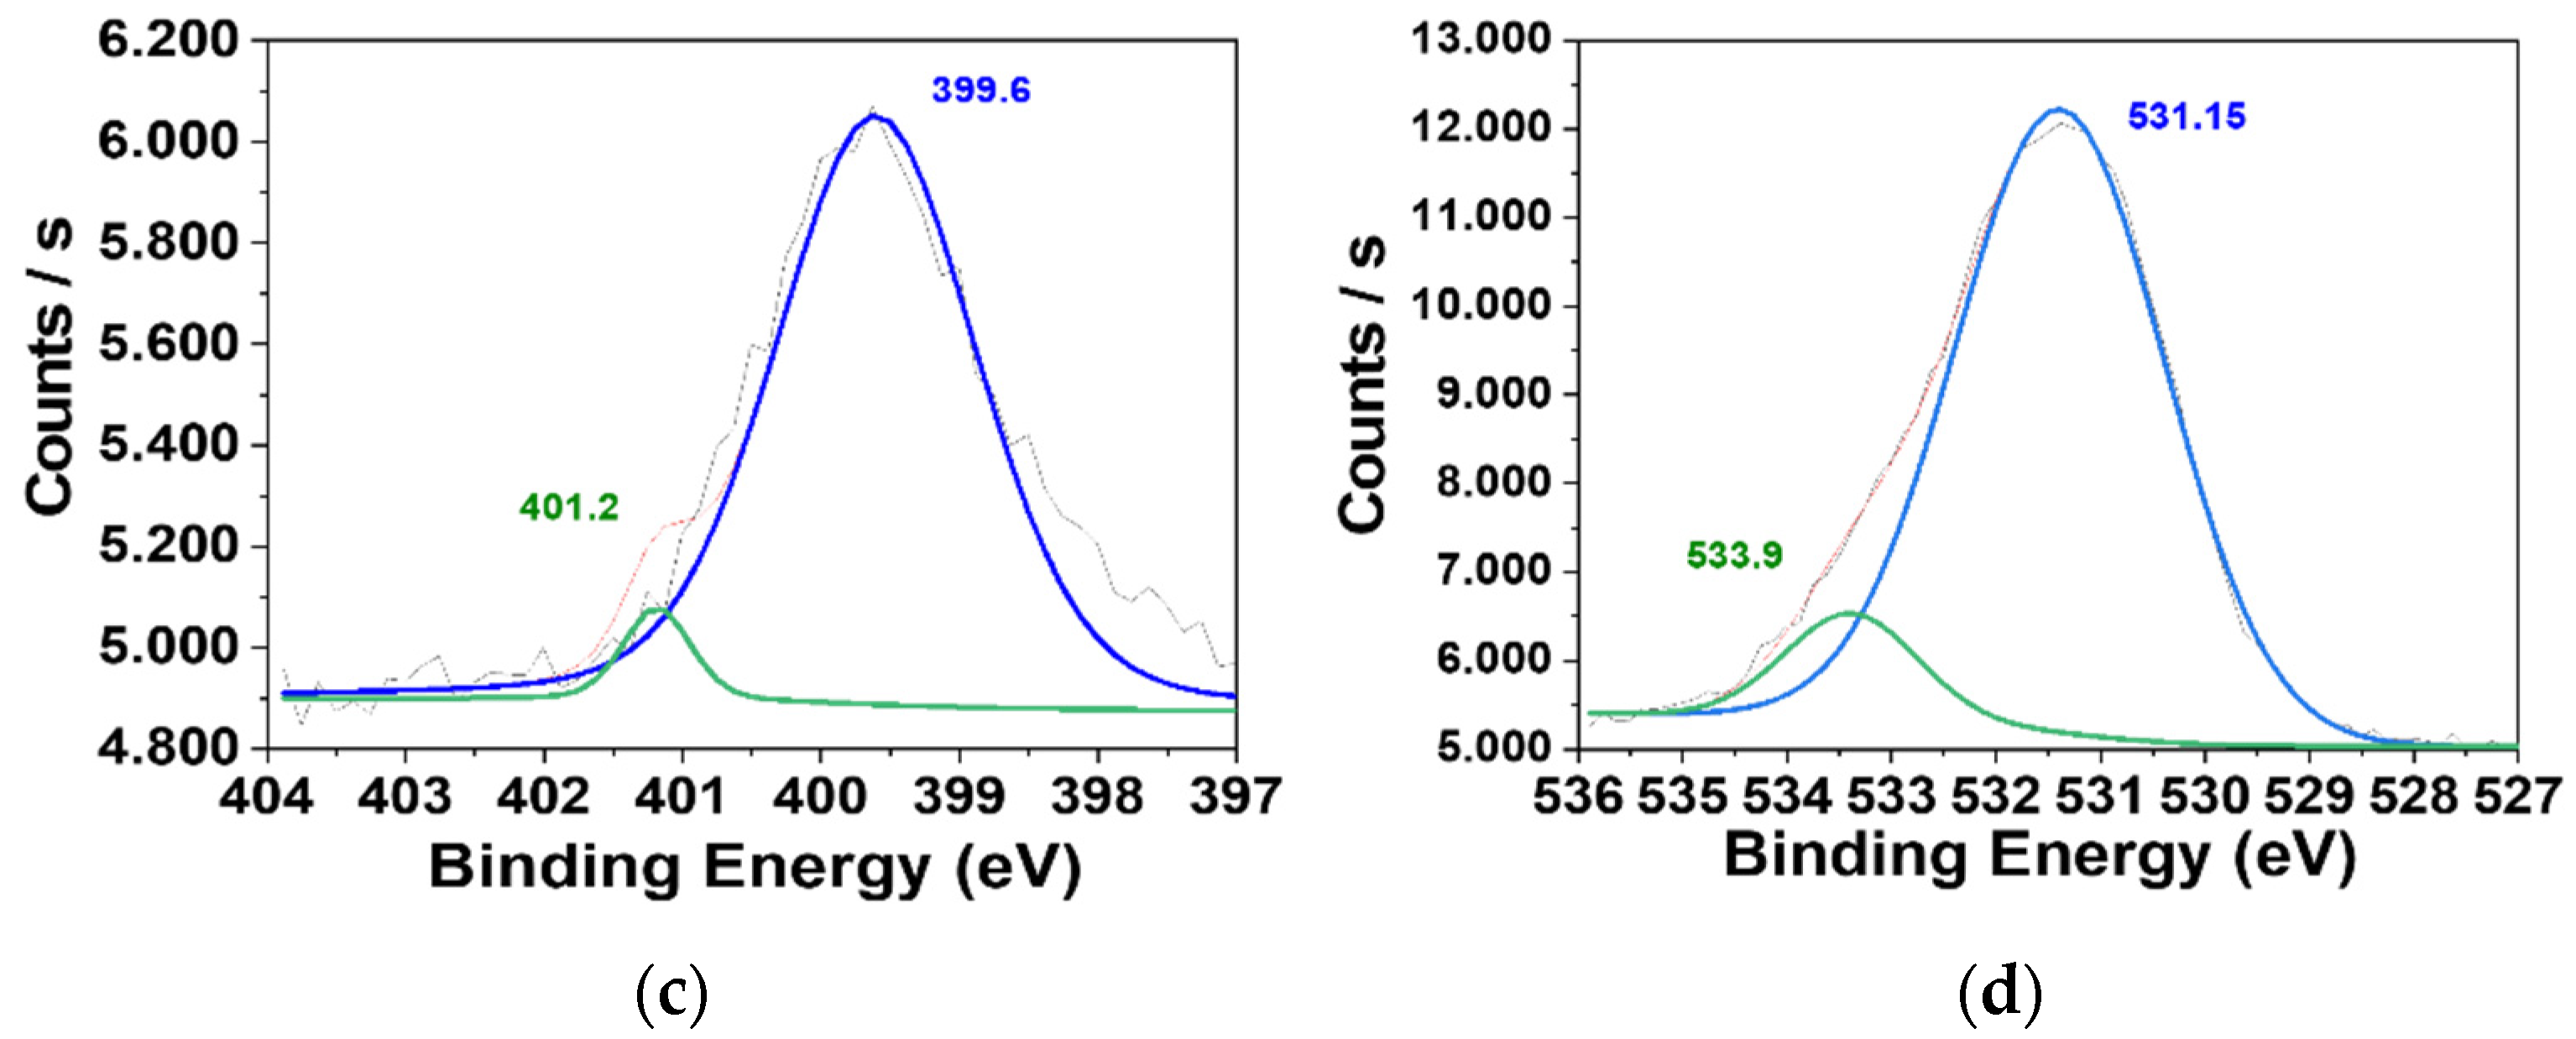
3.1. Synthesis and Characterization of the CDs

Here, an ASP strategy is proposed to rationally generate pH-sensitive CDs from fluorescein, citric acid and urea (CDF), in a one-pot hydrothermal process at 250 °C for 4 h. Citric acid and urea were used as carbon and nitrogen sources, being widely described that under this type of synthesis conditions they generate CDs via typical condensation, polymerization and carbonization processes [4,12]. Fluorescein was chosen not only as a carbon source, but also as a pH-sensitive moiety to be retained on the surface of CDF [25]. The reaction temperature was set below the decomposition temperature of fluorescein, to ensure the preservation of its functional structure in the hydrothermal process [35]. Herein, with this approach we expect that fluorescein intervenes in the polymerization and condensation reactions that occur during the formation of the nanoparticle, being retained on its surface without post-synthesis functionalization involving cross-linking agents.
To understand the role of fluorescein as a precursor and the success of the employed ASP strategy, CDF was characterized by HR-TEM, AFM, XPS spectroscopy and mass (MS) spectrometry. For comparison effects, another type of CDs was also prepared (CD0), which synthesis consists of an identical procedure to that of CDF but excluding fluorescein.
The size and morphology of both CDF and CD0 were analyzed by HR-TEM (Figure 1). Figure 1a revealed for CD0 the presence of well dispersed nanoparticles, with a carbonaceous amorphous structure and a mean diameter size of 2.5 nm. On the other hand, HR-TEM analysis of the CDF sample showed that the addition of fluorescein to the synthesis mixture of CDs resulted in the formation of regular spherical nanoparticles with a significant increase in size when compared with CD0, with CDF particles possessing a mean diameter size of 27 nm. Thus, the inclusion of fluorescein as a precursor led to significant changes in the size of the nanoparticles, indicating a significant degree of aggregation (when comparing with CD0). The high degree of aggregation was also supported by AFM measurements (Figure S1), which provided a mean size value of 65.8 nm for CDF. It should be noted that fluorescein is a dye with known aggregation behavior [36], and so, the aggregation behavior of CDF is the first indication that fluorescein-like properties were indeed retained by the CDs.
XPS analysis was performed to characterize the surface composition of CDF, showing a chemical surface composition (in atomic concentration, %) of 77.33% C, 17.16% O and 3.36% N. It was also found some negligible impurities of Si and Na. The C 1s core high-resolution spectra showed five main contributions at 284.8 (81.53%), 286.2 (7.3%), 287.2 (3.25%), 288.36 (5.13%) and at 291.51 eV (2.75%), which are assigned to C–C adventitious carbon, C–O/C–N, C=O, O–C=O [37] and the π-π* [38] contribution, respectively (Figure 2a). It is also possible to detect the presence of K 1s at 293 and 295 eV, which is inherent to the synthesis procedure. For the purposes of comparison, the C 1s spectra of CD0 was also obtained and analyzed (Figure 2b), revealing typical contributions in CDs at 284.8 (86.15%), 286.2 (2.76%), 287.2 (1.61%) and 288.3 (9.49%)eV, respectively, which were assigned to C–C/C–H adventitious carbon, C–O/C–N, C=O and O–C=O, respectively, which is similar to previous work carried out by members of this team [39]. The presence of a π-π* contribution in CDF, which is absent in CD0, indicates the presence of fluorescein-like moieties in the surface of the former nanoparticles.
The N 1s and O 1s core level spectra were also obtained and analyzed for the CDF sample. For N 1s spectra (Figure 2c), it was found a main contribution at 399.6 eV (96.6%), assigned to C–NH2 amine groups, and a small shoulder at 401.2 eV (3.4%), assigned to the presence of protonated species on the CDF surface. As for O 1s spectra (Figure 2d), contributions were observed at both 531.15 eV and 533.2 eV, which were assigned to C=O and C–O, respectively [37].
To further identify if the addition of fluorescein to the synthesis procedure of CDs resulted in the retention of fluorescein-like moieties on their surface, both CDF, CD0 and fluorescein itself were subjected to direct-injection MS spectrometry analysis (Figure S2). The mass spectrum of fluorescein itself is composed by a peak at 333.6 m/z, while CD0 has no relevant fragment peaks with similar m/z values (indicating the absence of fluorescein, as expected). Interestingly, the mass spectrum of CDF revealed fragments peaks with m/z values similar to fluorescein (at 335.4 m/z), and even higher values (at 416.8 and 462.5 m/z). Given some similarity with fluorescein itself, and their absence in the same spectrum of CD0, we interpret these fragment peaks to derivatized fluorescein-like moieties present in the surface of CDF (possibly formed during the polymerization and condensation reactions responsible for the formation of CDs).

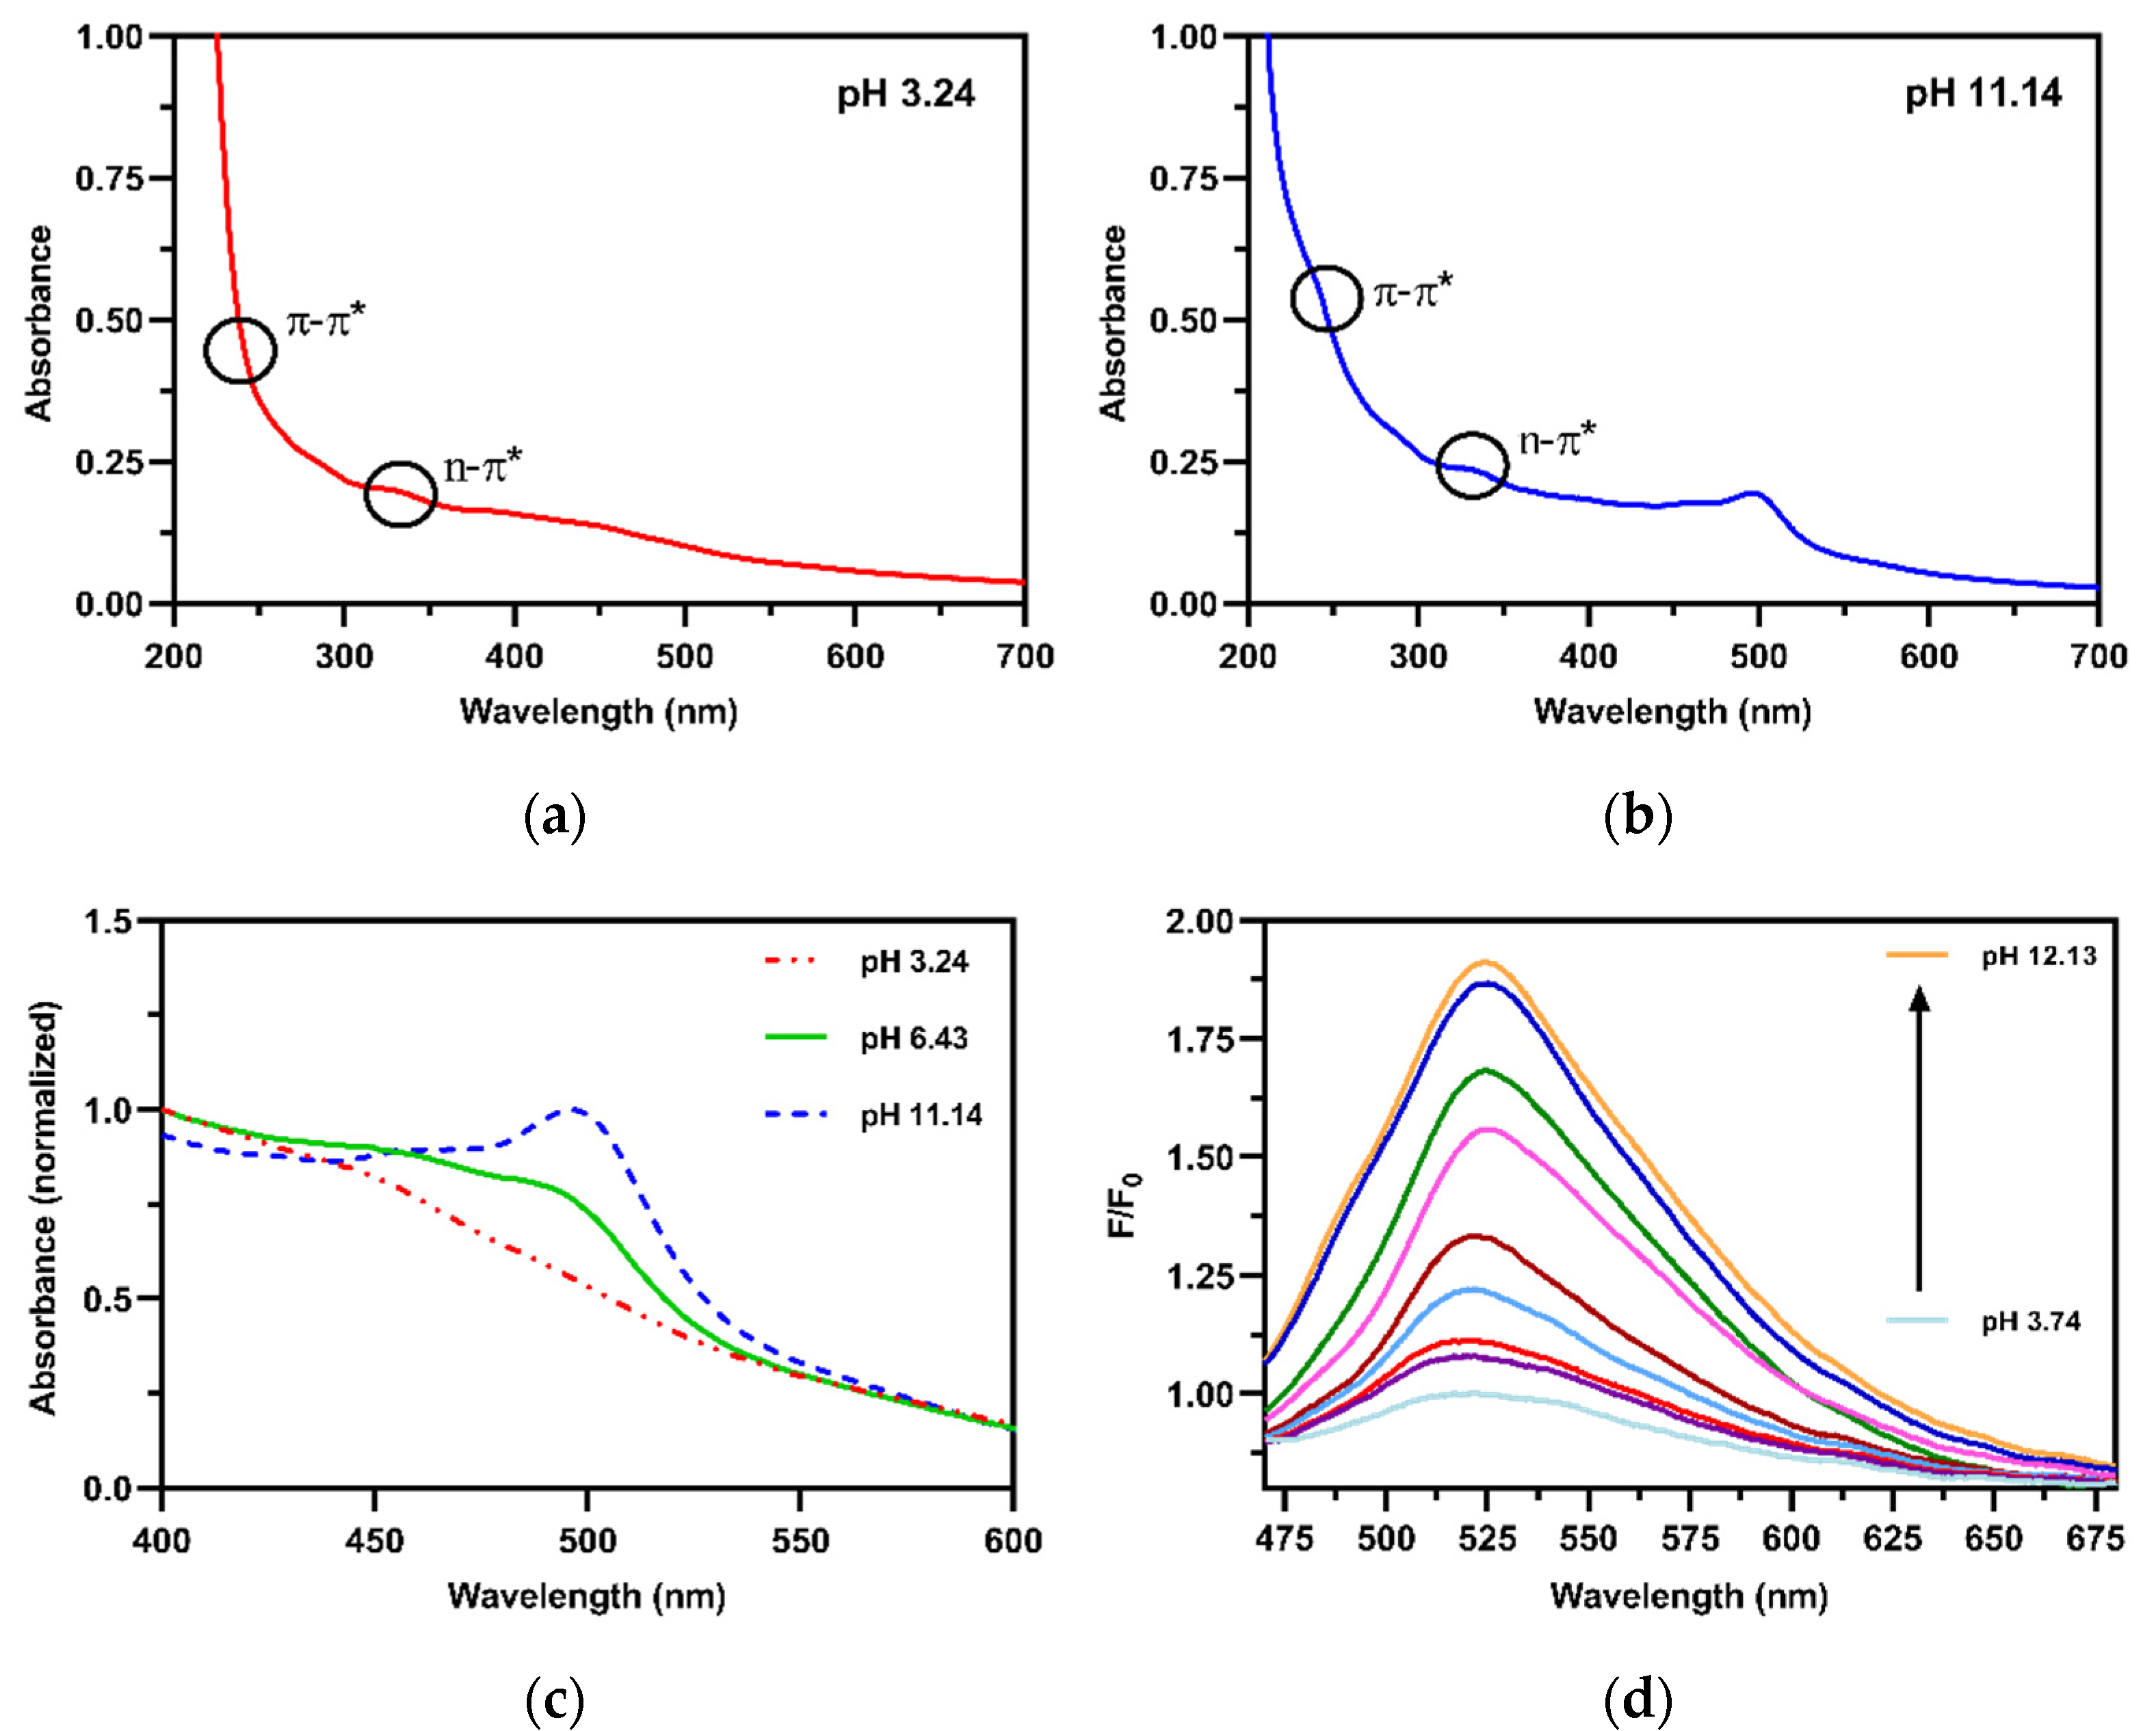
3.2. Optical Properties of the CDs

The UV-Vis spectrum (Figure 3) of CDF was analyzed at 3 different pH values (3.2, 6.4 and 11.1). It shows for all pH values a small band at around 340 nm and a less visible shoulder at around 240 nm, which are attributed to n-π* and π-π* transitions, respectively [40,41]. Interestingly, while absent at pH 3.2, a small band is formed at ~500 nm at basic pH (Figure 3b). In fact, the intensity of this band appears to increase with increasing pH (Figure 3c). We attribute this band and its pH-response to fluorescein-like structures present in the surface of CDF. In fact, we have measured the UV-Vis spectra of fluorescein in the same conditions (Figure S3) and found an absorption band at ~440 nm at acidic pH, which becomes red-shifted up to ~490 nm with increasing pH. On the contrary, the UV-Vis spectra of CD0 does not present either a band at ~500 nm or a pH-sensitive response at his region of the spectrum (Figure S4).
The fluorescence wavelength maximum of CDF (with an excitation wavelength of 450 nm) was 525 nm (Figure 3d), which is similar to the emission profile of fluorescein [34]. Furthermore, as seen for fluorescein, the CDF undergoes significant fluorescence enhancement with increasing pH. On the contrary, for CD0 there is no emission band in the 475–625 nm region, when using the same excitation wavelength of 450 nm (Figure S5). Given the pH-sensitivity of the emission spectra of CDF, we calculated its QY at different pH values (3.2, 7.5, 12.1), and obtained values of 1.7%, 4.0% and 6.0% (respectively).
In summary, the present results demonstrated that the used synthetic strategy was able to preserve fluorescein-like structures on the surface of CDs, given the similar optical properties of CDF when comparing with fluorescein, and which are absent when fluorescein is not used as a precursor (CD0). The fact that these optical properties of CDF are similar but not equal to those of fluorescein also indicates that they result from moieties incorporated into the CDs, and not just from unreacted molecules present in the solution.

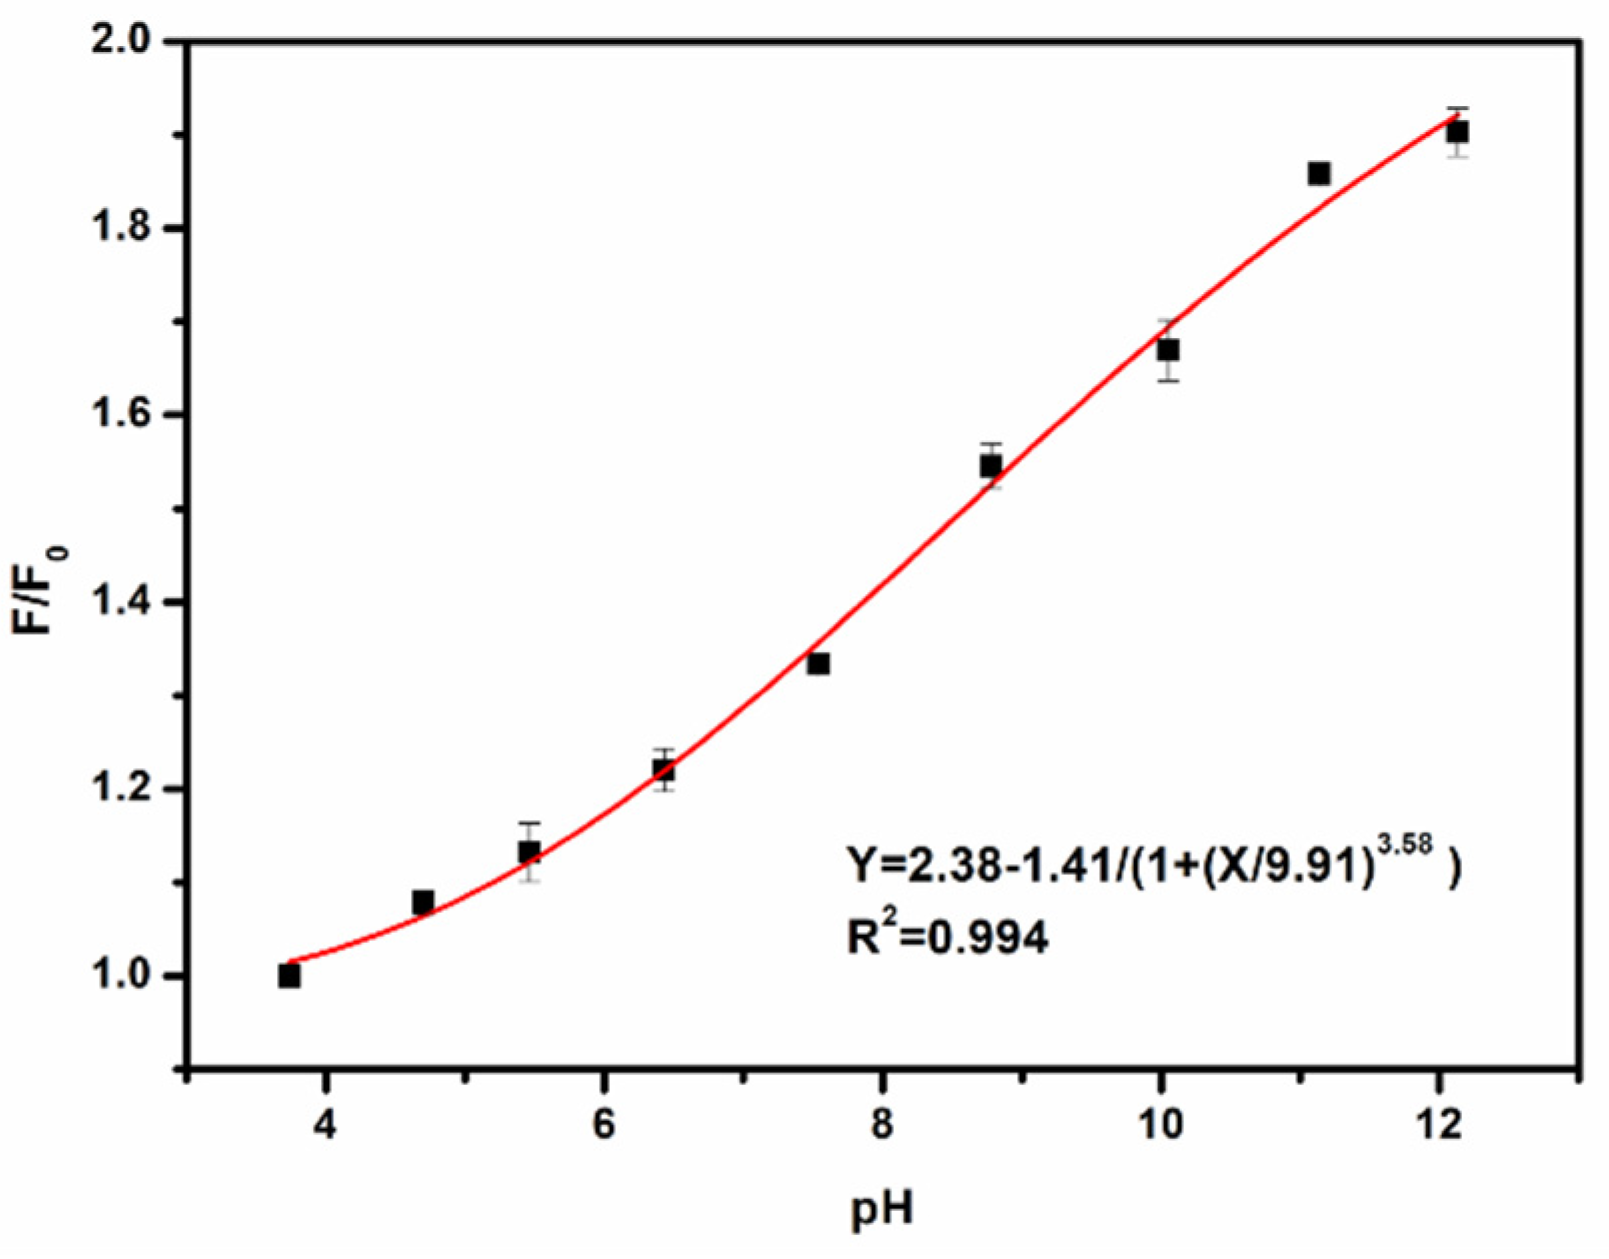
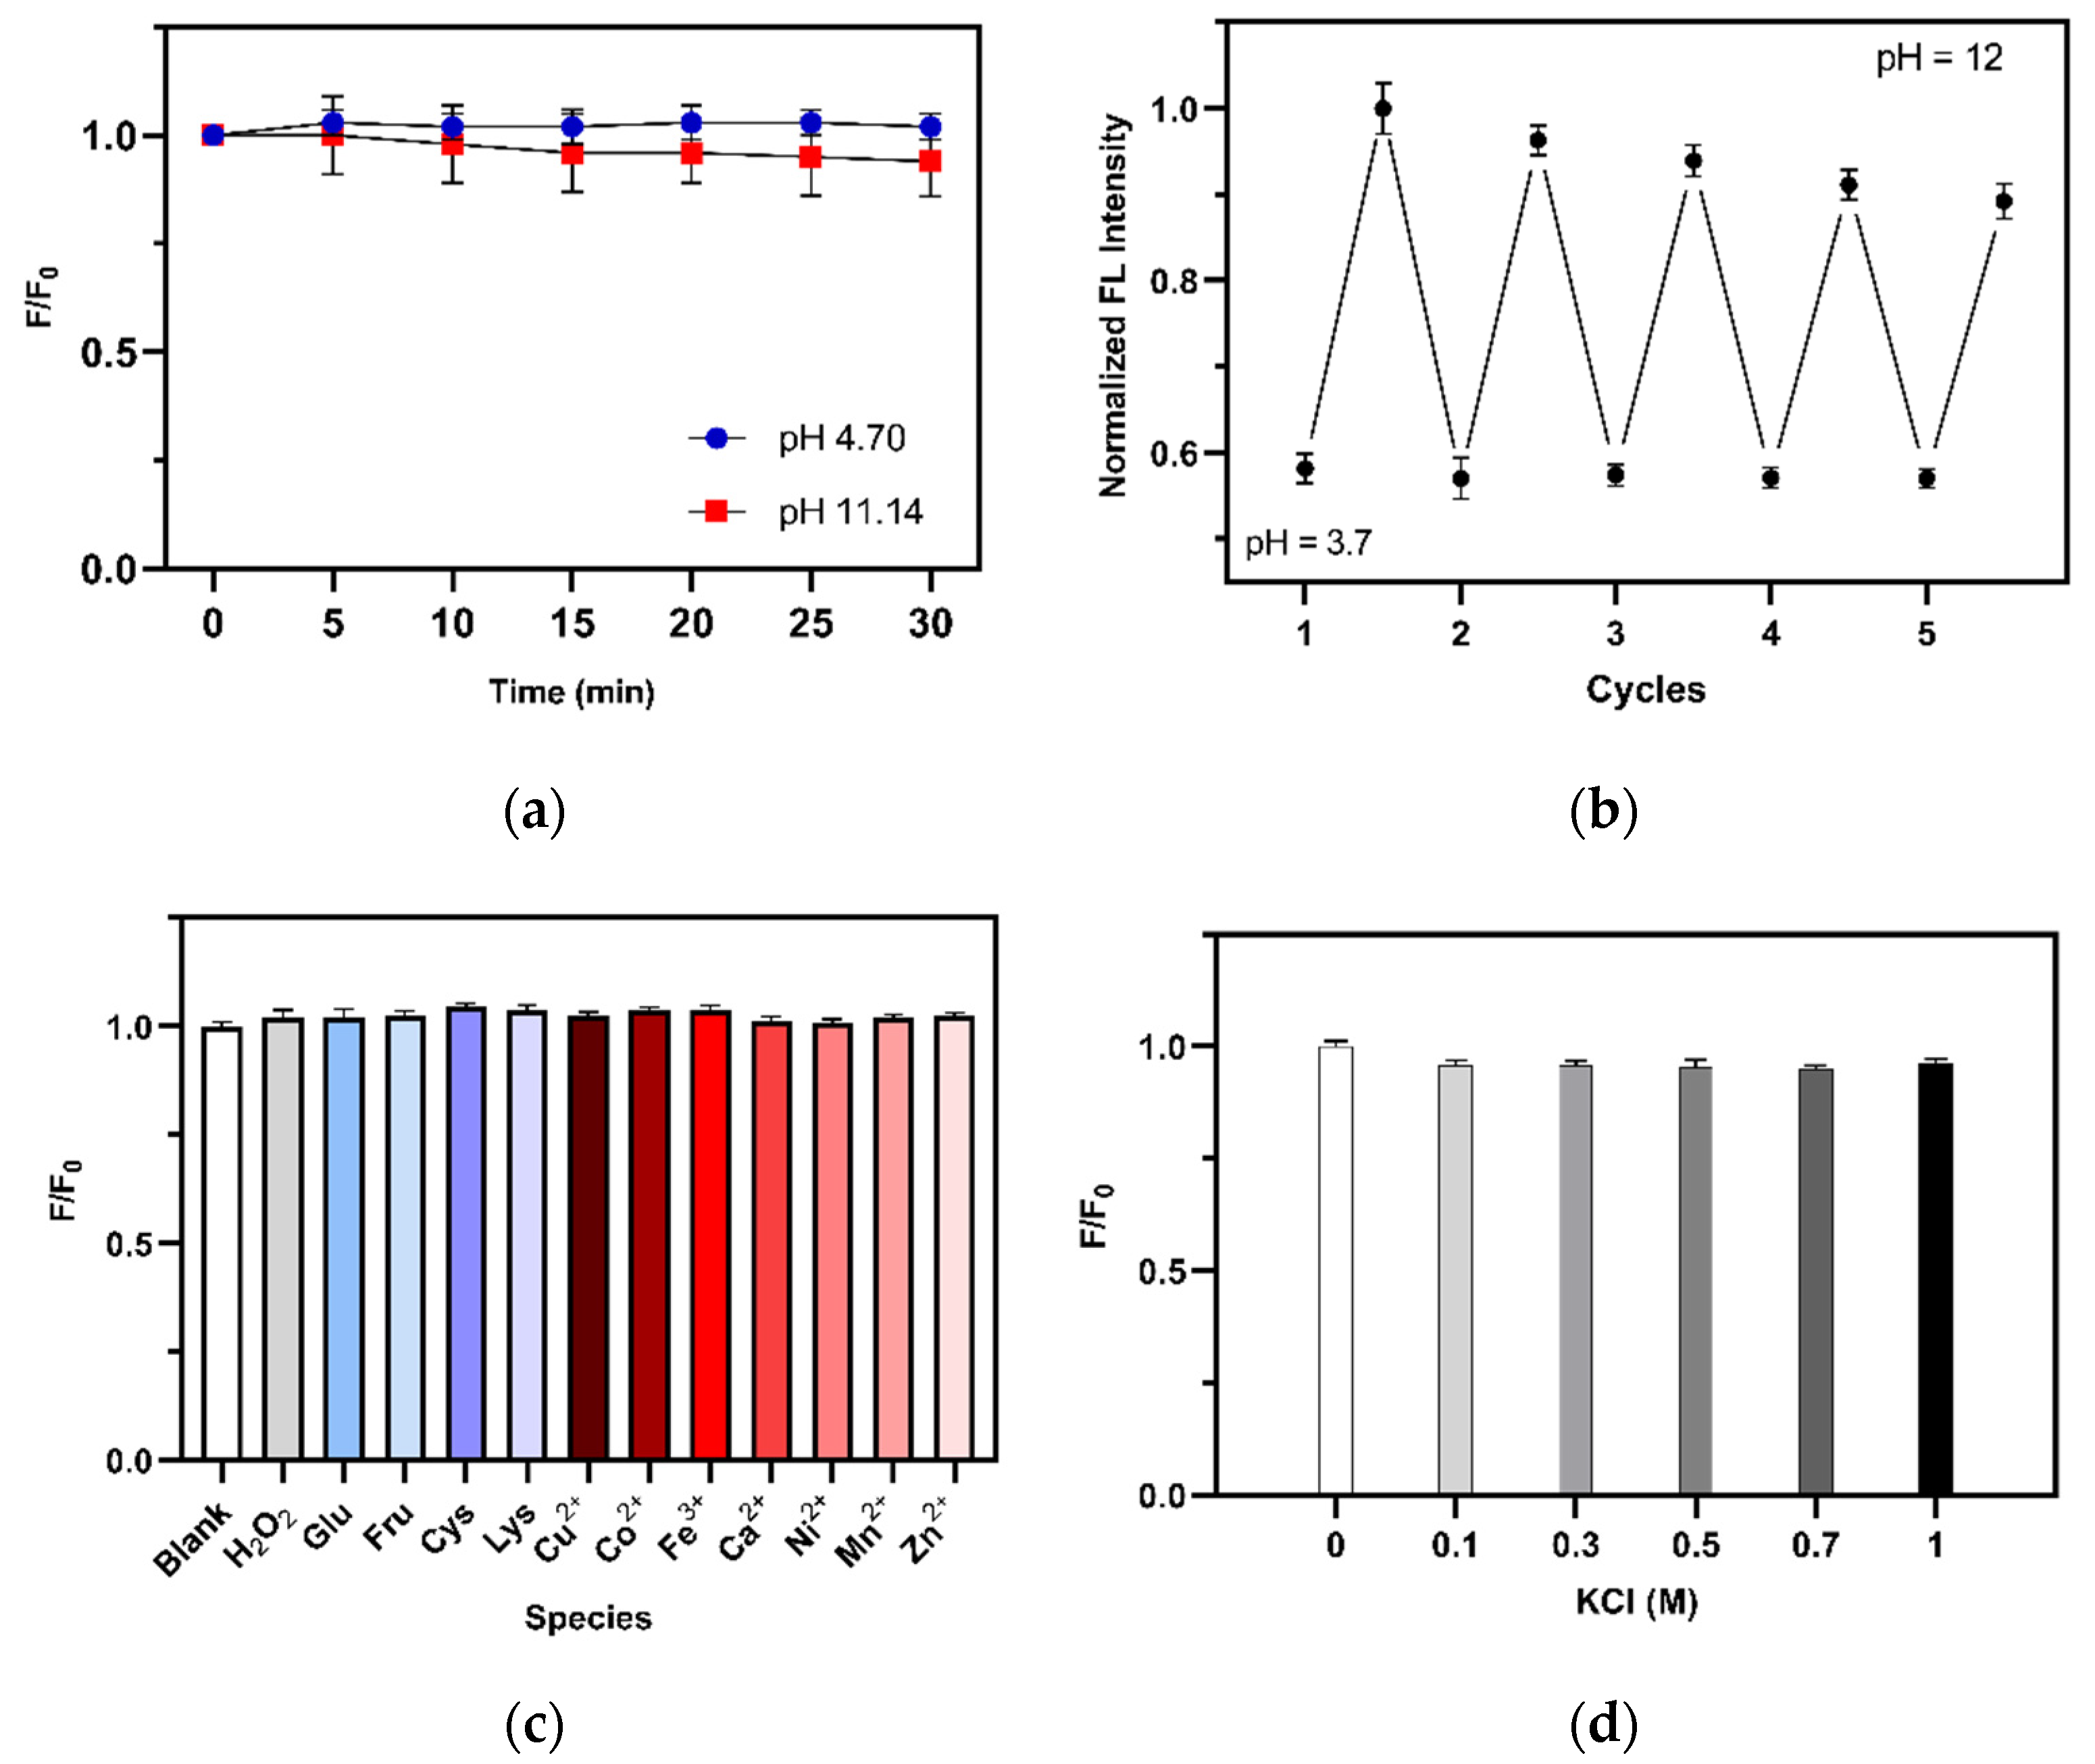
3.3. Investigation of the pH-Sensing Properties of CDs

Standard pH-dependent fluorescence measurements were performed in buffer solutions with pH values ranging from 3.7 to 12.1 (Figure 3d and Figure 4). As referred above, Figure 3d demonstrates that with increasing pH values, the fluorescence emission intensity at 525 nm is enhanced significantly, without any relevant shift in the emission wavelength maxima. Figure 4 shows that these data can be fitted with a logistic function, with a R2 = 0.994, within a wide range of pH values. Previously developed CD-based fluorescent sensors present a smaller range of pH, while having a comparable QY to the one calculated above for CDF, and some of these sensors were not submitted to an appropriate purification process (either dialysis or column chromatography), which might result in leftover fluorescent impurities (Table S2). Thus, these results show that the synthesized CDF could be applied as a nanosensor for pH determination.
We ascribe this pH-sensitivity to the preservation of fluorescein-like structures on the surface of CDF. For one, the fluorescence signal for CD0 was observed at two different pH values, and no emission peak was seen at either pH (Figure S5). Furthermore, the emission profile of fluorescein with varying pH was also measured (Figure S6) and is similar to that of CDF (Figure 4). This is in line with the UV-Vis spectra of both CDF (Figure 3) and fluorescein (Figure S3), which showed similar pH variations. Interestingly, the pH-dependent emission profiles of both CDF and fluorescein do show some differences, with the main one being that the emission profile of fluorescein (Figure S6) reaches a plateau at pH 7–8, making it difficult to be used to distinguish between values at basic pH. CDF does not appear to have this problem (Figure 4), and so, could be used to distinguish values at basic pH.
To try to assess if the pH-sensitive fluorescence of CDF could also be due to ionization changes in the surface of the nanoparticle, we have measured its zeta potential at different pH values (Table S1). These were found to be negative at all tested pH values (from −7.7 to −18.7 mV), but no clear correlation with pH was found.
To assess the photostability of CDF and considering the use of an excitation wavelength in the visible region (450 nm), we have measured its fluorescence response after irradiation for certain periods of time with a commercial Feit White Compact Fluorescent lamp (23 W, cool daylight), at two different pH values. These results can be found in Figure 5a. There is no appreciable variation of fluorescence intensity with visible light irradiation at acidic pH, while just being observed an almost negligible variation at basic pH.
The pH reversibility of the fluorescence emission of CDF was tested by adding CDs to a buffer solution of 3.7, and repeatedly switching the pH between 3.7 and 12.1 by using solutions of HCl and NaOH. As illustrated in Figure 5b, there is indeed a reproducible reversibility of the CDs’ fluorescence signal with pH variations. However, a slight decrease in the fluorescence intensity at basic pH was noted as the cycles were repeated. To understand if this decrease was due to either pH-variation-induced instability or simply due to a dilution effect, a similar experiment was made in which the pH was first switched from 3.7 to 12.1 by the addition of NaOH (Figure S7). After that, the cycles were performed by adding repeatedly deionized water and NaOH (Figure S7). In this way, there is no reversibility of pH, but we maintained the same dilution effect achieved in the previous experiment. In fact, we observe the same slight decrease in the fluorescence intensity with increasing cycles, which points to this being only due to the dilution effect of increasing number of cycles.
pH sensing measurements can take place in complex environments, such as the intracellular environment, which are composed by complex mixtures of ions and biomolecules. Thus, the signal of a pH sensor should not be affected by such interferent species. In view of that, we have investigated the potential interference of metal ions (Cu2+, Co+, Mn2+, Ca2+, Ni2+, Fe3+, Zn2+, 0.1 mM), amino-acids (lysine and cysteine, 1 mM), reactive oxygen species (H2O2, 0.5 mM) and carbohydrates (fructose and glucose, 5 mM) toward the fluorescence signal of CDF in aqueous solution (Figure 5c). No relevant change in fluorescent intensity was seen in the presence of either interferent, showing the excellent selectivity of this nanosensor for pH determination.
To further assess the stability and selectivity of CDF as a pH nanosensor, the effect of the ionic strength on its fluorescent intensity was also evaluated by preparing a series of solutions with different ionic strengths (0.1, 0.3, 0.5, 0.7 and 1 M KCl). As demonstrated in Figure 5d, despite a very slight decrease in fluorescent intensity when comparing results without KCl and the addition of 0.1 M KCl, the increase of KCl concentration did not have an appreciable effect on the signal intensity of CDF. This demonstrates the stability of this nanoparticle toward variations of the ionic strength in each solution.
To further validate the suitability of CDF as a fluorescent pH nanosensor, we used it to determine the pH values of two real samples (Table 1). Namely, tap water from two locations of the Porto municipal area, in Portugal. One being from the laboratory where the experiments were performed, and another a private residence. For comparison effects, the pH of both samples was also determined by using a standard pH-meter with a pH electrode. The results in Table 1 show that pH values obtained with CDF agree with those obtained with a standard pH electrode-based method, and so, validates its use as a fluorescence pH nanosensor.

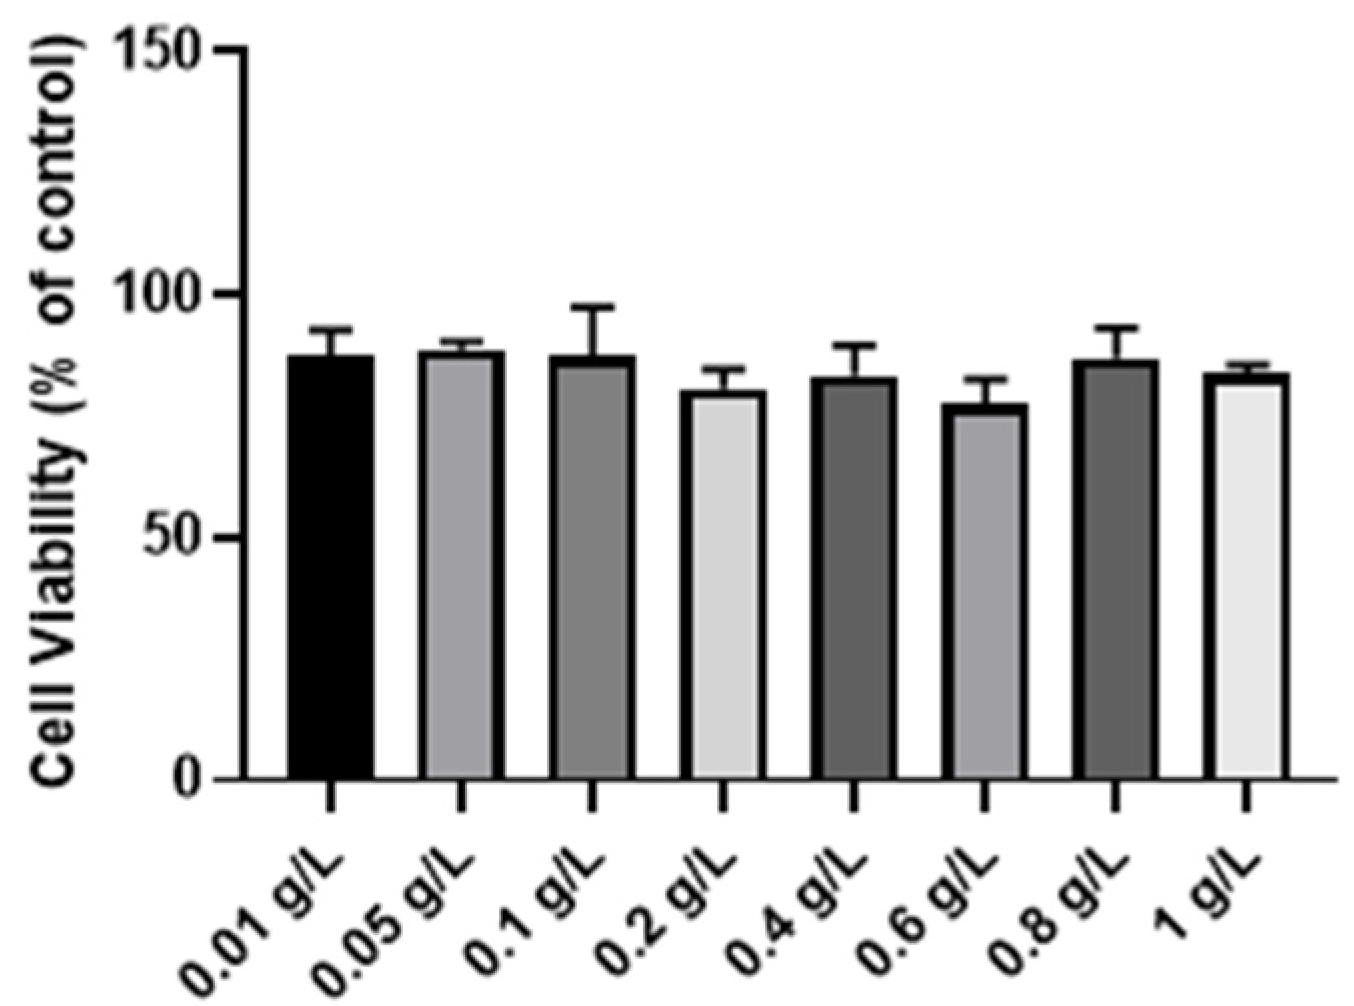
3.4. Investigation of the Biocompatibility of CDs

One of the most promising uses of fluorescent pH nanosensors is for intracellular pH determination. Thus, it is useful to determine if the proposed CDs are biocompatible with human cell lines, or if they affect their normal functioning, and so, are unable to be used as pH nanosensors for intracellular measurements. To evaluate its biocompatibility, CDF was added to human SH-SY5Y cells in increasing concentration (0.01–1.0 g/L) for 48 h, and cell viability was determined by the MTT viability assay. The results are expressed in percentage, relative to the control (100%) and the obtained results are presented in Figure 6. No significant drop in cellular viability was found, even for significantly high concentrations of 1 g/L. Thus, our results indicate that CDF is indeed compatible with human cells, and so, can be of potential use of intracellular pH measurements for biological applications.

4. Conclusions

A fluorescent pH nanosensor was rationally developed by using an active surface preservation strategy. Namely, carbon dots (CDs) were prepared via a one-pot hydrothermal treatment of citric acid, urea and fluorescein, which generated CDs with fluorescein-like structures preserved on their surface. The CDs can be used to determined pH values from 3.7 to 12.1 by fluorescence enhancement at 525 nm, showing also excellent pH-selectivity, reversibility and photostability, while being compatible with human cells. Therefore, the present CDs show potential for pH determination, possibly with biological applications. More importantly, our work demonstrates a strategy in which CD-based nanosensors can be rationally developed without requiring time-consuming and costly post-synthesis functionalization procedures.

Supplementary Materials

The following are available online at https://0-www-mdpi-com.brum.beds.ac.uk/article/10.3390/chemosensors9080191/s1, Figure S1: Atomic force microscopy (AFM) images for CDF, providing the average size of 65.8 nm, Figure S2: Electrospray ionization-mass spectrometry (ESI-MS) spectrum of (A) Fluorescein, (B) CDF and (C) CD0, in the positive ionization mode, Figure S3: Normalized UV-Vis spectrum of Fluorescein at different pH, Figure S4: Normalized UV-Vis spectrum of CDs without fluorescein at different pH, Figure S5: F/F0 values for the emission spectra of CDs without fluorescein at two different pH values, Figure S6: F/F0 values of the fluorescence intensity for fluorescein at different pH, Figure S7: Effect of the dilution of CDF with NaOH for the repeatability test between pH values of 3.7 and 12.1, Table S1: Zeta potential measurements for CDs with fluorescein at different pH values. Table S2: Comparison between CD-based fluorescent sensors found in literature and CDF.

Author Contributions

Conceptualization, L.P.d.S.; investigation: A.C.P.A., A.S.C., D.D., A.T.S.C.B. and M.d.V.M.d.Y.; writing—original draft preparation—A.C.P.A., L.P.d.S., M.A. and N.V.; writing—review and editing—L.P.d.S., C.M.P., M.A., J.J.-J. and L.P.d.S., supervision—N.V., C.M.P. and L.P.d.S. All authors have read and agreed to the published version of the manuscript.

Funding

This research was funded by projects UIDB/00081/2020 (CIQUP), UIDB/05748/2020 (GreenUPorto) and PTDC/QUI-QFI/2870/2020 (funded by the Portuguese Foundation for Science and Technology, FCT). Luís Pinto da Silva acknowledges funding from the Portuguese Foundation for Science and Technology (FCT), under the Scientific Employment Stimulus (CEECIND/01425/2017). Nuno Vale thanks FCT by supporting these studies through project from National Funds, within CINTESIS, R&D Unit (UIDB/4255/2020) and in the framework of project IF/00092/2014/CP1255/CT0004. Manuel Algarra acknowledges the Spanish Ministerio de Economia, Industria y Competividad (RTI2018-099668-BC22).

Institutional Review Board Statement

Not applicable.

Informed Consent Statement

Not applicable.

Data Availability Statement

Not applicable.

Acknowledgments

The Laboratory of Computational Modelling of Environmental Pollutants-Human Interactions (LACOMEPHI) is acknowledged.

Conflicts of Interest

The authors declare no conflict of interests.

References

  1. Crista, D.M.A.; El Mragui, A.; Algarra, M.; Esteves da Silva, J.C.G.; Luque, R.; da Silva, L.P. Turning spent coffee grounds into sustainable precursors for the fabrication of carbon dots. Nanomaterials 2020, 10, 1209. [Google Scholar] [CrossRef] [PubMed]
  2. Liu, M.L.; Chen, B.B.; Li, C.M.; Huang, C.Z. Carbon dots: Synthesis, formation mechanism, fluorescence origin and sensing applications. Green Chem. 2019, 21, 449–471. [Google Scholar] [CrossRef]
  3. Sharma, A.; Das, J. Small molecules derived carbon dots: Synthesis and applications in sensing, catalysis, imaging, and biomedicine. J. Nanobiotechnol. 2019, 1–24. [Google Scholar] [CrossRef] [PubMed] [Green Version]
  4. Crista, D.M.A.; da Silva, J.C.G.E.; da Silva, L.P. Evaluation of different bottom-up routes for the fabrication of carbon dots. Nanomaterials 2020, 10, 1316. [Google Scholar] [CrossRef] [PubMed]
  5. Yue, Q.; Hu, Y.; Tao, L.; Zhang, B.; Liu, C.; Wang, Y.; Chen, C.; Zhao, J.; Li, C.Z. Fluorometric sensing of pH values using green-emitting black phosphorus quantum dots. Microchim. Acta 2019, 186. [Google Scholar] [CrossRef] [PubMed]
  6. Shangguan, J.; He, D.; He, X.; Wang, K.; Xu, F.; Liu, J.; Tang, J.; Yang, X.; Huang, J. Label-free carbon-dots-based ratiometric fluorescence pH nanoprobes for intracellular pH sensing. Anal. Chem. 2016, 88, 7837–7843. [Google Scholar] [CrossRef]
  7. Hutton, G.A.M.; Martindale, B.C.M.; Reisner, E. Carbon dots as photosensitisers for solar-driven catalysis. Chem. Soc. Rev. 2017, 46, 6111–6123. [Google Scholar] [CrossRef] [Green Version]
  8. Song, T.B.; Huang, Z.H.; Niu, X.Q.; Liu, J.; Wei, J.S.; Chen, X.B.; Xiong, H.M. Applications of carbon dots in next-generation lithium-ion batteries. ChemNanoMat 2020, 6, 1421–1436. [Google Scholar] [CrossRef]
  9. Hola, K.; Zhang, Y.; Wang, Y.; Giannelis, E.P.; Zboril, R.; Rogach, A.L. Carbon dots—Emerging light emitters for bioimaging, cancer therapy and optoelectronics. Nano Today 2014, 9, 590–603. [Google Scholar] [CrossRef]
  10. Bao, X.; Yuan, Y.; Chen, J.; Zhang, B.; Li, D.; Zhou, D.; Jing, P.; Xu, G.; Wang, Y.; Holá, K.; et al. In vivo theranostics with near-infrared-emitting carbon dots—Highly efficient photothermal therapy based on passive targeting after intravenous administration. Light Sci. Appl. 2018, 7, 1–11. [Google Scholar] [CrossRef] [Green Version]
  11. Hettiarachchi, S.D.; Graham, R.M.; Mintz, K.J.; Zhou, Y.; Vanni, S.; Peng, Z.; Leblanc, R.M. Triple conjugated carbon dots as a nano-drug delivery model for glioblastoma brain tumors. Nanoscale 2019, 11, 6192–6205. [Google Scholar] [CrossRef] [PubMed]
  12. Hou, P.; Yang, T.; Liu, H.; Li, Y.F.; Huang, C.Z. An active structure preservation method for developing functional graphitic carbon dots as an effective antibacterial agent and a sensitive pH and Al (III) nanosensor. Nanoscale 2017, 9, 17334–17341. [Google Scholar] [CrossRef]
  13. Gao, M.X.; Yang, L.; Zheng, Y.; Yang, X.X.; Zou, H.Y.; Han, J.; Liu, Z.X.; Li, Y.F.; Huang, C.Z. “Click” on alkynylated carbon quantum dots: An efficient surface functionalization for specific biosensing and bioimaging. Chem. A Eur. J. 2017, 23, 2171–2178. [Google Scholar] [CrossRef]
  14. He, J.H.; Cheng, Y.Y.; Yang, T.; Zou, H.Y.; Huang, C.Z. Functional preserving carbon dots-based fluorescent probe for mercury (II) ions sensing in herbal medicines via coordination and electron transfer. Anal. Chim. Acta 2018, 1035, 203–210. [Google Scholar] [CrossRef]
  15. Li, B.; Ma, H.; Zhang, B.; Qian, J.; Cao, T.; Feng, H.; Li, W.; Dong, Y.; Qin, W. Dually emitting carbon dots as fluorescent probes for ratiometric fluorescent sensing of pH values, mercury (II), chloride and Cr (VI) via different mechanisms. Microchim. Acta 2019, 186. [Google Scholar] [CrossRef]
  16. Simões, E.F.C.; da Silva, L.P.; da Silva, J.C.G.E.; Leitão, J.M.M. Hypochlorite fluorescence sensing by phenylboronic acid-alizarin adduct based carbon dots. Talanta 2020, 208, 120447. [Google Scholar] [CrossRef] [PubMed]
  17. Simões, E.F.C.; Leitão, J.M.M.; da Silva, J.C.G.E. Carbon dots prepared from citric acid and urea as fluorescent probes for hypochlorite and peroxynitrite. Microchim. Acta 2016, 183, 1769–1777. [Google Scholar] [CrossRef]
  18. Campos, B.B.; Contreras-Cáceres, R.; Bandosz, T.J.; Jiménez-Jiménez, J.; Rodríguez-Castellón, E.; Esteves da Silva, J.C.G.; Algarra, M. Carbon dots as fluorescent sensor for detection of explosive nitrocompounds. Carbon N. Y. 2016, 106, 171–178. [Google Scholar] [CrossRef]
  19. Shamsipur, M.; Barati, A.; Nematifar, Z. Fluorescent pH nanosensors: Design strategies and applications. J. Photochem. Photobiol. C Photochem. Rev. 2019, 39, 76–141. [Google Scholar] [CrossRef]
  20. Li, L.; Shi, L.; Zhang, Y.; Zhang, G.; Zhang, C.; Dong, C.; Yu, H.Z.; Shuang, S. Excitation-independent hollow orange-fluorescent carbon nanoparticles for pH sensing in aqueous solution and living cells. Talanta 2019, 196, 109–116. [Google Scholar] [CrossRef] [PubMed]
  21. Li, R.S.; Gao, P.F.; Zhang, H.Z.; Zheng, L.L.; Li, C.M.; Wang, J.; Li, Y.F.; Liu, F.; Li, N.; Huang, C.Z. Chiral nanoprobes for targeting and long-term imaging of the Golgi apparatus. Chem. Sci. 2017, 8, 6829–6835. [Google Scholar] [CrossRef] [Green Version]
  22. Safavi, A.; Ahmadi, R.; Mohammadpour, Z.; Zhou, J. Fluorescent pH nanosensor based on carbon nanodots for monitoring minor intracellular pH changes. RSC Adv. 2016, 6, 104657–104664. [Google Scholar] [CrossRef]
  23. Wang, Q.; Yang, H.; Zhang, Q.; Ge, H.; Zhang, S.; Wang, Z.; Ji, X. Strong acid-assisted preparation of green-emissive carbon dots for fluorometric imaging of pH variation in living cells. Microchim. Acta 2019, 186. [Google Scholar] [CrossRef]
  24. Jang, L.S.; Keng, H.K. Modified fabrication process of protein chips using a short-chain self-assembled monolayer. Biomed. Microdevices 2008, 10, 203–211. [Google Scholar] [CrossRef]
  25. Sjöback, R.; Nygren, J.; Kubista, M. Absorption and fluorescence properties of fluorescein. Spectrochim. Acta Part A Mol. Spectrosc. 1995, 51. [Google Scholar] [CrossRef]
  26. Le Guern, F.; Mussard, V.; Gaucher, A.; Rottman, M.; Prim, D. Fluorescein derivatives as fluorescent probes for ph monitoring along recent biological applications. Int. J. Mol. Sci. 2020, 21, 9217. [Google Scholar] [CrossRef]
  27. Loiselle, F.B.; Casey, J.R. Membrane transporters in drug discovery and development: Methods and protocols. In Measurement of Intracellular pH; Yan, Q., Ed.; Humana Press: Totowa, NJ, USA, 2010; pp. 311–331. ISBN 978-1-60761-700-6. [Google Scholar]
  28. Resch-Genger, U.; Grabolle, M.; Cavaliere-Jaricot, S.; Nitschke, R.; Nann, T. Quantum dots versus organic dyes as fluorescent labels. Nat. Methods 2008, 5, 763–775. [Google Scholar] [CrossRef] [PubMed]
  29. Kim, S.; Fisher, B.; Bawendi, M. Type-II quantum dots: CdTe/CdSe (Core/Shell) and CdSe/ZnTe (Core/Shell) Heterostructures. J. Am. Chem. Soc. 2003, 11466–11467. [Google Scholar] [CrossRef]
  30. Pramanik, S.; Hill, S.K.E.; Zhi, B.; Hudson-Smith, N.V.; Wu, J.J.; White, J.N.; McIntire, E.A.; Kondeti, V.S.S.K.; Lee, A.L.; Bruggeman, P.J.; et al. Comparative toxicity assessment of novel Si quantum dots and their traditional Cd-based counterparts using bacteria models Shewanella oneidensis and Bacillus subtilis. Environ. Sci. Nano 2018, 5, 1890–1901. [Google Scholar] [CrossRef]
  31. Hu, L.; Zhang, C.; Zeng, G.; Chen, G.; Wan, J.; Guo, Z.; Wu, H.; Yu, Z.; Zhou, Y.; Liu, J. Metal-based quantum dots: Synthesis, surface modification, transport and fate in aquatic environments and toxicity to microorganisms. RSC Adv. 2016, 6, 78595–78610. [Google Scholar] [CrossRef]
  32. Zhu, C.; Chen, Z.; Gao, S.; Goh, B.L.; Samsudin, I.B.; Lwe, K.W.; Wu, Y.; Wu, C.; Su, X. Recent advances in non-toxic quantum dots and their biomedical applications. Prog. Nat. Sci. Mater. Int. 2019, 29, 628–640. [Google Scholar] [CrossRef]
  33. Martínez, C.H.R.; Dardonville, C. Rapid determination of ionization constants (pKa) by UV spectroscopy using 96-well microtiter plates. ACS Med. Chem. Lett. 2013, 4, 142–145. [Google Scholar] [CrossRef] [PubMed] [Green Version]
  34. Brouwer, A.M. Standards for photoluminescence quantum yield measurements in solution (IUPAC technical report). Pure Appl. Chem. 2011, 83, 2213–2228. [Google Scholar] [CrossRef] [Green Version]
  35. Arshad, M.; Masud, K.; Saeed, A.; Qureshi, A.H.; Shabir, G. Thermogravimetric and differential thermal analyses of fluorescein dye in inert and static air atmosphere. J. Therm. Anal. Calorim. 2018, 131, 1385–1390. [Google Scholar] [CrossRef]
  36. Mei, J.; Hong, Y.; Lam, J.W.Y.; Qin, A.; Tang, Y.; Tang, B.Z. Aggregation-induced emission: The whole is more brilliant than the parts. Adv. Mater. 2014, 26, 5429–5479. [Google Scholar] [CrossRef] [PubMed]
  37. Moulder, J.F.; Stickle, W.; Sobol, P.; Bomben, K.D. Handbook of X Ray Photoelectron Spectroscopy: A Reference Book of Standard Spectra for Identification and Interpretation of XPS Data; Physical Electronics: Eden Praire, MN, USA, 1995. [Google Scholar]
  38. Campos, B.B.; Contreras-Cáceres, R.; Bandosz, T.J.; Jiménez-Jiménez, J.; Rodríguez-Castellón, E.; da Silva, J.C.G.E.; Algarra, M. Carbon dots coated with vitamin B12 as selective ratiometric nanosensor for phenolic carbofuran. Sens. Actuators B Chem. 2017, 239, 553–561. [Google Scholar] [CrossRef]
  39. Sendão, R.; Yuso, M.; Algarra, M.; Silva, J.; Pinto da Silva, L. Comparative life cycle assessment of bottom-up synthesis routes for carbon dots derived from citric acid and urea. J. Clean. Prod. 2020, 254, 120080. [Google Scholar] [CrossRef]
  40. Wang, W.; Wang, B.; Embrechts, H.; Damm, C.; Cadranel, A.; Strauss, V.; Distaso, M.; Hinterberger, V.; Guldi, D.M.; Peukert, W. Shedding light on the effective fluorophore structure of high fluorescence quantum yield carbon nanodots. RSC Adv. 2017, 7, 24771–24780. [Google Scholar] [CrossRef] [Green Version]
  41. Sharma, A.; Gadly, T.; Gupta, A.; Ballal, A.; Ghosh, S.K.; Kumbhakar, M. Origin of excitation dependent fluorescence in carbon nanodots. J. Phys. Chem. Lett. 2016, 7, 3695–3702. [Google Scholar] [CrossRef]
Figure 1. HR-TEM images for (a) CD0 and (b) CDF.
Chemosensors 09 00191 g001
Figure 2. XPS core (a) C 1s level spectra for CDF and (b) CD0, and (c) N 1s and (d) O 1s level spectra for CDF.
Chemosensors 09 00191 g002aChemosensors 09 00191 g002b
Figure 3. (a) UV-Vis spectra for CDF at pH 3.2. (b) UV-Vis spectra for CDF at pH 11.1. In both (a) and (b), the circles indicate the shoulder and peak at around 240 nm and 340 nm, respectively. (c) Normalized UV-Vis spectra for the CDF at pH 3.2, 6.4 and 11.1 in the wavelength range of 400–600 nm. (d) F/F0 values of the emission spectra for CDF with different pH values (3.7–12.1).
Chemosensors 09 00191 g003
Figure 4. Logistic fit of F/F0 values of the fluorescence intensity for Fluorescein at different pH (3.7–12.1).
Chemosensors 09 00191 g004
Figure 5. (a) Photostability assay of CDF irradiated under visible light (lamp of 23W (220–240 V 50/60 Hz)) for 30 min in pH 4.7 and 11.1; (b) pH reversibility study of CDF between pH 3.7 and 12.1; (c) Various fluorescence intensity of the CDF solution with various interferent species. H2O2 (0.5 mM); lysine (Lys) and cysteine (Cys) (1 mM); metallic ions (0.1 mM), Cu2+, Co2+, Fe3+, Ca2+, Ni2+, Mn2+, Zn2+; fructose (Fru) and glucose (Glu) (5 mM); (d) Ionic strength effect study on CDF using solutions with different concentrations of KCl (0, 0.1, 0.3, 0.5, 0.7, 1 M).
Chemosensors 09 00191 g005
Figure 6. Effect of CDF on the cellular viability of human SH-SY5Y cells, with cells being cultivated in the presence of increasing concentrations of CDs. Values of cell viability are expressed in percentage and represent mean ± SEM of 3 independent experiments (n = 3).
Chemosensors 09 00191 g006
Table 1. Determination of pH in real water samples (pH ± standard deviation) by using either a standard pH-meter with a pH electrode or by measurement of the fluorescence intensity of CDF.
MethodLaboratoryResidence
pH-meter with pH electrode7.93 ± 0.017.99 ± 0.05
Fluorescence measurement with CDF7.59 ± 0.047.69 ± 0.18
Publisher’s Note: MDPI stays neutral with regard to jurisdictional claims in published maps and institutional affiliations.

