Article

Methodology of Selecting the Optimal Receptor to Create an Electrochemical Immunosensor for Equine Arteritis Virus Protein Detection

by
Mateusz Brodowski
1,2,
Marcin Kowalski
1,2,
Wioleta Białobrzeska
2,*,
Katarzyna Pałka
2,
Rafał Walkusz
2,
Justyna Roguszczak
2,
Tomasz Łęga
2,
Marta Sosnowska
2,
Małgorzata Biedulska
2,
Joanna Kreczko Kurzawa
2,
Ewelina Bięga
2,
Joanna Wysocka
2,
Marta Lisowska
3,
Katarzyna Niedźwiedzka
3,
Tomasz Lipiński
3,
Sabina Żołędowska
2,4 and
Dawid Nidzworski
2,4
1
Department of Metrology and Optoelectronics, Faculty of Electronics, Telecommunications and Informatics, Gdańsk University of Technology, 11/12 G. Narutowicza St., 80-233 Gdańsk, Poland
2
Institute of Biotechnology and Molecular Medicine, 3 Trzy Lipy St., 80-172 Gdańsk, Poland
3
Bioengineering Research Group, Łukasiewicz Research Network–PORT Polish Center for Technology Development, 54-066 Wroclaw, Poland
4
SensDx, 14b Postępu St., 02-676 Warszawa, Poland
*
Author to whom correspondence should be addressed.
Submission received: 9 July 2021 / Revised: 6 September 2021 / Accepted: 8 September 2021 / Published: 16 September 2021
(This article belongs to the Collection Electrochemical Biosensors for Medical Diagnosis)

Abstract

:
The study reports a methodology of selecting the optimal receptor to create an electrochemical immunosensor for equine arteritis virus (EAV) protein detection. The detection was based on antigen recognition by antibodies immobilized on gold electrodes. Modification steps were controlled by electrochemical impedance spectroscopy and cyclic voltammetry measurements. In order to obtain the impedance immunosensor with the best parameters, seven different receptors complementary to equine arteritis virus protein were used. In order to make the selection, a rapid screening test was carried out to check the sensor’s response to blank, extremely low and high concentrations of target EAV protein, and negative sample: M protein from Streptococcus equi and glycoprotein G from Equid alphaherpesvirus 1. F6 10G receptor showed the best performance.

1. Introduction

As shown by the events of the last three years, the issue of epidemic threats related to diseases caused by easily spreading human and animal pathogens is of the utmost importance. Along with the progress of globalization and the facilitation of transport, in parallel with numerous benefits, there are threats related to the transmission of pathogens, and hence a threat of widespread epidemic outbreaks [1,2].
In addition to vaccination and laboratory tests, there is an unfulfilled need for new on-site screening methods to reduce the transmission of dangerous pathogens. In this paper, we present the concept of the EAV screening method [3].
Equine viral arteritis (EVA) is a disease caused by EAV, a small, enveloped RNA virus [3]. Infection can occur through inhalation, or in particular, by venereal route during equine breeding or artificial insemination (the virus is present, for example, in tears, sweat, urine, sperm, or nostril secretions).
EAV was first identified and isolated in 1953 during an outbreak in Bucyrus, Ohio. Since then, outbreaks of EVA occurred in numerous places, amongst others: in 1984, in Kentucky, USA [4], in 1992 in Spain [5], in 1993 in Nottinghamshire, UK [6], in 2006 in New Mexico, USA [7], in 2007 in the Normandy region in France [8], and in 2019 in Dorset and Devon, UK [9].
Among the symptoms present during the outbreaks of EVA, abortion, pneumonia, and high mortality in foals were noted [10]. Clinical signs of infection are often non-specific including elevated temperature, ecchymosis, purulent discharge from eyes and nose, swelling, hives, and loss of appetite [7,10,11]. They differ depending on the virus strain and are largely related to individual characteristics of equid [10].
The consequences of the spread of EAV have significant economic implications for both breeders and organizers of equestrian events, shows, and races. The above-mentioned direct financial losses are related to abortions in pregnant mares and the death of animals (especially young foals), costs related to their vaccination and isolation, lack of export opportunities for infected semen and carrier stallions, and a significant reduction in the commercial value of infected stallions [11,12,13]. Special care is recommended during equestrian events or horse races in order to reduce the risk of further dissemination of EVA [14].
Diagnosis of equine arteritis virus cannot be based solely on clinical symptoms alone because they are indistinguishable from those of other, more common horse diseases. Laboratory detection of EAV is currently based on a combination of serological assay, virus isolation, and viral nucleic acid or antigen detection [10]. Nasopharyngeal swabs or washings, semen containing sperm rich fraction of ejaculate, conjunctival swabs and blood samples are the most appropriate biological samples for virus isolation from live animals [15].
It is important that specimens are collected immediately after the onset of clinical symptoms or suspected EAV infection. The samples should be ice-cooled on the spot and delivered overnight to an approved laboratory.
Traditional laboratory techniques are time-consuming, labor-intensive, and in some cases, relatively low sensitivity [16,17,18,19]. Moreover, virus isolation and expensive laboratory equipment are required [20]. In all cases, the specimens must be delivered to approved diagnostic laboratory for testing by qualified staff, which increases the time-to-answer and costs of tests [21,22]. Up to now, there is one commercially available point-of-care test detecting EAV, based on the ELISA method (ID Screen® Equine Viral Arteritis Indirect). It has 98% specificity, however, no information concerning its sensitivity is provided by the manufacturer [23]. The results were obtained in 90 min.
As the above analysis shows, there is currently no quick and reliable method for the rapid diagnosis of horse infections that can be performed in a stable without the need for a veterinary visit and delivering samples to a diagnostic laboratory. There is an urgent need for a rapid, sensitive, and specific test for EAV detection, which would let stable owners and breeders avoid sending biological samples to the laboratory and waiting relatively long for the results. The test could be performed in a stable or any other place by unqualified personnel with the results obtained immediately on-site. This approach would allow for quick intervention if an infection is detected and reduce the risk of the infection spreading on the farm.
An interesting alternative to conventional diagnostic methods involves immunosensors based on electrochemical response. They have great potential to provide rapid, simple, cost-effective, portability, fast response time, real time analysis, and compatibility with miniaturized point-of-care detection technologies while maintaining high selectivity and sensitivity [24,25,26].
Electrochemical immunosensors (EIs) are integrated analytical devices allowing one to detect the antibody-antigen immunocomplex formation thanks to an antibody immobilized on the electrode surface that recognizes the target molecule present in the tested sample. The electrochemical signal is generated during biochemical reactions through the electrode surface and is directly proportional to the amount of antigen present in the sample [27].
Here, immunosensor surfaces were prepared by the immobilization of antibodies using a self-assembled monolayer (SAMs) of 4-aminothiophenol covalently bonded to the gold surface of the electrode.
The functionalization of the immunosensor was characterized using electrochemical techniques such as cyclic voltammetry (CV) and electrochemical impedance spectroscopy (EIS). In the present study, we selected seven receptors to create simple immunosensor platforms able to detect equine arteritis virus present in a tested sample with good precision and accuracy and is at the same time able to suppress non-specific binding of undesirable proteins or molecules on the electrode surface. Obtained electrochemical impedance spectroscopy measurements allowed us to select the optimal receptor complementary to EAV, which plays a crucial role in disease diagnosis.
In this paper, we present the concept of the equine arteritis virus screening method. The developed platform shows a highly sensitive and selective response to a viral protein. The achieved limit of detection is equal to 0.01705 μg/mL. To the best of the authors’ knowledge, an electrochemical biosensor for EVA detection has not been reported yet.

2. Materials and Methods

2.1. Reagents and Materials

For electrochemical measurements K3[Fe(CN)6], K4[Fe(CN)6] and KCl were purchased from Chempur (Piekary Śląskie, Poland). For electrode preparation and modification, 99.8% ethanol was provided by Chempur (Piekary Śląskie, Poland); phosphate-buffered saline (PBS) tablets, tris buffered saline (TBS), 97% 4-aminothiophenol (4-ATP), 25% glutaraldehyde (GA), and bovine serum albumin (BSA) were provided from Sigma Aldrich (Munich, Germany). A total of 30% hydrogen peroxide and 25% ammonia water were purchased from P.H.H. “STANLAB” (Lublin, Poland). HCl, NaH2PO4, NaCl, urea, glycine buffer, and Tris buffer were purchased from Sigma-Aldrich (Munich, Germany). All reagents were used without further purification. Aqueous solutions were made using double-distilled sterile water (ddH2O). Ethanolic and aqueous solutions were deaerated using argon from Air Products (Poland) and stored in 5 °C conditions. The working gold electrodes, reference silver chloride electrode, and platinum counter electrodes were purchased from Mennica Metale (Warsaw, Poland).

2.2. Hybridoma Establishment and Antibody Production

Hybridoma cell lines producing antibodies against all antigens were established using the classical method [28] via fusion of murine spleenocytes with murine myeloma cells: Sp2/0-Ag14 with polyethylene glycol (PEG) [29]. Mice were first subjected to the immunization cycle with antigens formulated in Freund’s incomplete adjuvant, each dose containing about 40 µg of recombinant protein in 100–200 µL of emulsion. Prime injection was given intraperitoneally and two subsequent booster injections were given at two week intervals, subcutaneously into a skin fold in the lumbar region. The last injection was given intraperitoneally without adjuvant two to three days before euthanasia. Spleens were harvested, splenocytes harvested, and used immediately for fusion. Cells were seeded onto 384-well plates at a density of 70–80 thousand per well and arising colonies screened for antibody production using an ELISA on plates coated with recombinant antigens. Positive colonies were picked up and cloned onto fresh 96-well plates. After the next screening, colonies showing the highest signal were subjected to consecutive cloning rounds until stably producing clones were obtained. About ten different clones for each antigen were propagated to produce antibody samples necessary for immobilization on the sensors’ surfaces. Cell lines were cultured in Ex-cell–serum free medium, and antibody samples were purified on Sepharose (Sigma Aldrich, Munich, Germany) protein G via batch adsorption using 50 μL of beads. Antibodies were eluted using glycine buffer pH 2.7 and immediately naturalized with 1 M Tris HCl buffer pH 8.8 (Sigma Aldrich, Munich, Germany) to aid proper functionalization of the sensor surface, and buffer was exchanged to PBS using Zeba spin desalting columns (130 µL columns) (Sigma Aldrich, Munich, Germany). Antibody content was measured with an UV spectrometer (Nanodrop 2000c) (Thermofisher Scientific, Waltham, MA, USA) and concentrated on a Microcon-10kDa Centrifugal Filter Unit (Sigma Aldrich, Munich, Germany) when necessary. Animal experiments obtained approval from the Local Ethics Committee for Animal Experiments (No. 76/2016).

2.3. Isolation of Protein

2.3.1. Protein for the Pathogen Equine Arteritis Virus (EVA-N-HisTAG)

DNA sequence coding for nucleocapsid protein from equine arteritis virus (GB AAD13740.1) was synthesized by GenScript with codon optimization for E. coli expression and cloned into the pET-28a(+) vector. The obtained plasmid was transformed into E. coli BL21(DE3) and protein production was induced with 1 mM isopropyl β-D-1-thiogalactopyranoside (IPTG) for 3 h at 37 °C. Protein isolation was performed under denaturing conditions using HIS-Select Nickel Affinity Gel (Sigma Aldrich). Bacterial lysis, protein binding, and washing steps were performed using buffer containing 8 M urea; 100 mM NaH2PO4; 10 mM Tris; pH 8.0. Protein was eluted with buffer 8 M urea; 100 mM NaH2PO4; 10 mM Tris; pH 4.5. Eluate was dialyzed against buffers containing 150 mM NaCl; 50 mM Tris; pH 7.4 with a stepwise urea concentration decrease (6 M, 4 M, 2 M, 0 M).

2.3.2. Protein for the Pathogen Streptococcus Equi (SeM-HisTAG)

DNA sequence coding for M protein from Streptococcus equi (GB AHI46575.1) was synthesized by GenScript with codon optimization for E. coli expression and cloned into pET-28a(+) vector. The obtained plasmid was transformed into E. coli BL21(DE3) and protein production was induced with 1 mM IPTG for 3 h at 37 °C. Protein isolation was performed under denaturating conditions using HIS-Select Nickel Affinity Gel (Sigma Aldrich). Bacterial lysis, protein binding, and washing steps were performed using buffer containing 8 M urea; 100 mM NaH2PO4; 10 mM Tris; pH 8.0. Protein was eluted with buffer 8 M urea; 100 mM NaH2PO4; 10 mM Tris; pH 4.5. The eluate was dialyzed against buffers containing 150 mM NaCl; 50 mM Tris; pH 7.4 with a stepwise urea concentration decrease (6 M, 4 M, 2 M, 0 M).

2.3.3. Protein for the Pathogen Equine Herpesvirus (SUMO-EHV-1 gG)

DNA sequence coding for envelope glycoprotein G from Equid alphaherpesvirus 1 (GB YP_053114.1) was synthesized by GenScript with codon optimization for E. coli expression and cloned into the pET-28a(+) vector. The resulting plasmid was used as the DNA template to subclone gG protein into pRham N-His SUMO (Lucigen) using primers EHV-1-gGSUMOF 5′-CGCGAACAGATTGGAGGTGCGGCGCTGAGCCTGCTGAGCCTG-3′ EHV-1-gGSUMOR 5′-GTGGCGGCCGCTCTATTAACATATTCCAGACGTTGGTAG-3′. The cloning procedure was performed with Expresso® Rhamnose SUMO Cloning and Expression System (Lucigen) according to the manufacturer’s instructions. EHV-1-gGSUMO production was induced in E.cloni 10G (Lucigen) using 0.2% rhamnose for 4 h in 37 °C. Protein isolation was performed under denaturating conditions using HIS-Select Nickel Affinity Gel (Sigma Aldrich). Bacterial lysis, protein binding, and washing steps were performed using buffer containing 8 M urea; 100 mM NaH2PO4; 10 mM Tris; pH 8.0. Protein was eluted with buffer 8 M urea; 100 mM NaH2PO4; 10 mM Tris; pH 4.5. The eluate was dialyzed against buffers containing 150 mM NaCl; 50 mM Tris; pH 7.4 with a stepwise urea concentration decrease (6 M, 4 M, 2 M, 0 M).
SUMO tag was cleaved using SUMO Express Protease (Lucigen). Digestion was conducted in buffer 150 mM NaCl; 50 mM Tris; 2 mM DTT; pH 7.4 using 1 unit of protease per 100 μg SUMO fusion protein. The reaction mixture was incubated at 30 °C for 1 h. After the cleavage reaction, the SUMO tag and SUMO Express Protease as well as any residual uncleaved fusion protein were removed from the sample by adsorption to HIS-Select Nickel Affinity Gel (Sigma Aldrich). The released protein was present in the column flowthrough while the 6× histidine tagged the SUMO fragment and the protease remained bound to the column.

2.4. Apparatus

EIS and CV were performed on a PlamSens 4 potentiostat (Houten, The Netherlands) with PSTrace 5.8 software. Quartz Crystal Microbalance (QCM) openQCM Wi2 and the sensors were obtained from openQCM (Pompeii, Italy). The sensors were AT-cut piezoelectric quartz crystals (QC) vibrating at 10 MHz with a titanium substrate and the gold electrode at the surface with a diameter of 11.5 mm. QCM was modified to perform the electrochemical test on the quartz sensors.

2.5. Immunosensor Fabrication

2.5.1. Preparation and Modification of Gold Disc Electrodes

Before starting the electrochemical measurements, the electrodes were polished on alumina oxide (0.04 µm) and then washed with ethanol and water. The cleaning was repeated until a reproducible voltammogram and impedance spectrum were obtained. The electrodes were then placed in test tubes filled with 100 µL of a freshly prepared 0.1 M 4-ATP solution in ethanol. After 16 h of incubation at 5 °C, the electrodes were washed with ethanol and water and then dried with a stream of argon. In the next step, 3 µL of a 2.5% aqueous GA solution was applied to the pre-modified surface for 15 min at room temperature in the darkness. To reduce the evaporation of the solutions, the electrode was covered with a 200 μL test tube for every incubation. Then, the electrode was washed with demineralized water and incubated in a 3 μL solution of one of the seven receptors (23.4 μg/mL H6 12E, 32.2 μg/mL A4 12D, 23.5 μg/mL F6 10G, 70.0 μg/mL D10 11B, 93.0 μg/mL F1 11G, 18.0 μg/mL H9 11A, 12.8 μg/mL H3 7E) in PBS for one hour at 5 °C. The electrode was then washed with water and re-incubated in 3 μL of 0.1% BSA solution in PBS for 5 min. At this stage, the electrode is ready to detect pathogen proteins (Figure 1). This procedure was already tested and used in previous works and is shown with the schematic diagram [30,31].

2.5.2. QC Sensors

The QC preparation procedure differs from disk electrodes mainly due to the difference in surface area and physical dimensions. Before starting the measurements, the QC was purified by washing for 20 min in acetone, followed by immersion for 5 min in an alkaline piranha solution (H2O:NH3:H2O2, 8:1:1, v:v:v). The QC was then immersed in 5 mL of 0.1 M 4-ATP solution in ethanol for 16 h at 5 °C. The next steps were omitted because the main purpose of using QCM was to confirm the adsorption of 4-ATP on the gold surface.

2.5.3. Electrochemical Experiments

All electrochemical experiments, both using gold discs and QC as a working electrode, were performed in 3 mL of deoxygenated 5 mM K3[Fe(CN)6]/K4[Fe(CN)6] in 0.1 M KCl. All of them were carried out in a three-electrode system using a silver chloride reference electrode Ag|AgCl|3 M KCl and a platinum wire as a counter electrode. CV for gold discs was performed from −0.1 to 0.5 V vs. Ag|AgCl|3 M KCl and for QC from −0.6 to 0.7 V vs. Ag|AgC|3 M KCl, both at a scan rate of 100 mV/s over three cycles. Then, the EIS was performed with the working electrode polarized for 5 s to the formal potential of the redox pair previously determined from the CV. The frequency range was from 10 kHz to 0.1 Hz with 25 points per decade and the excitation signal amplitude of 10 mV.

2.6. Quartz Crystal Microbalance Measurements

Measurements on QCM were performed to confirm the adsorption of 4-ATP on the gold surface. The measurements were performed in a QCM modified to carry out electrochemical measurements by adding an electrochemical cell to it. The quartz vibration frequency was measured both without and in the presence of the electrolyte, then the CV and EIS on QC were carried out. Although the remaining tests were carried out on different samples (gold disc electrodes) than those in which QCM was used, all other test parameters (temperature, incubation time, solution) remained unchanged, thus allowing a comparison between QC and gold disc electrodes.

2.7. Selection of Antibodies

In order to obtain the impedance immunosensor with the best parameters, the seven different receptors complementary to EVA-N-HisTAG were used. In order to make the selection, a rapid screening test was carried out to check the sensor’s response to blank, extremely low and high concentrations of the target protein (EVA-N-HisTAG), and negative samples: SeM-HisTAG, SUMO-EHV-1 gG.

2.8. Characteristics of the Immunosensor

To characterize the sensor, a blank test (TBS), complementary protein (EVA-N-HisTAG) detection was performed on several samples. For the EVA-N-HisTAG protein solutions, concentrations of 0.14, 1.0, 15, 36, and 57 µg/mL were used. The test was performed by incubating the sensor in 3 µL of the appropriate solution for 10 min at 5 °C. The sample was then washed with demineralized water and dried with an argon stream to then carry out an EIS measurement. Then, from the obtained data, the detection limit of the EVA-N-HisTAG protein was calculated and the repeatability and reproducibility of the measurements were tested.

3. Results

3.1. Characterization of Immunosensor

Data from the electrochemical measurements during gold surface modification are shown in Figure 2.
In Figure 2A, it is easy to follow the changes recorded during the successive steps of the sensor modification recorded by the CV. In addition to the previously discussed changes after incubation in 4-ATP, there is a clear decrease in the height of the current peaks from the oxidation and reduction in [Fe(CN)6]3−/4− by 0.5 uA and an increase in their separation by 0.04 mV after GA joins. However, when it is hard to see the binding receptor to the surface and saturating the free sites with BSA, it is much easier to interpret changes occurring on the sample from the impedance spectra shown in Figure 2B. To better present the data, the impedance spectra are shown in the range from 10 kHz to 7.5 Hz. To improve data analysis from the EIS, they were fitted to an equivalent electrical circuit (EEC), which is shown in Figure 2C, and the results are shown in Table 1 with the chi-square parameter interpreted as a goodness of fit.
The elements contained in EEC have the following meanings: R1 is the resistance of the electrolyte; Rct is the charge transfer resistance; W is the Warburg impedance related to the diffusion process of electroactive species to the surface of the electrode; and CPE is the constant phase element. As the modification of the gold surface mainly affects the electrode surface, the parameters to which the greatest attention is paid during the analysis are Rct and CPE. The presence of a double electrical layer on the electrode surface causes it to have a certain capacity that can be modeled with CPE, the impedance of which is expressed by Equation (1):
Z CPE = 1 Q j ω n
It is easy to see that for n = 1, CPE will be equal to a capacitor with a capacity equal to Q. The reason why the capacitor is not applicable for modeling data is the fact that real systems differ from ideal electrical components in their behavior due to the non-heterogeneity of the surfaces, which can be taken into account by parameter n [32].
Analyzing the data presented in Table 1. It can be seen that after the incubation of the gold disc electrodes in the 4-ATP solution, the n parameter increased by 0.3, and the Q parameter as well as Rct decreased. Changes in the parameters Q and n can be easily explained by the formation of a monolayer of adsorbed 4-ATP on the electrode surface, which leads to an increase in surface homogeneity, and thus an increase in the n parameter, while an increase in the distance between the electrode surface and the ions forming the dielectric double layer because of 4-ATP molecules leads to a reduction in capacitance, which can be easily understood when considering the formula for the capacitor [33]. The decrease in the Rct parameter, on the other hand, can be explained by the presence of –NH2 groups, which can undergo protonation and thus improve charge exchange [34]. During all subsequent modification stages, an increase in the Rct parameter can be noted due to the increasingly difficult access of redox couple molecules to the electrode surface. There is also a very clear decrease in the value of the Q parameter and an increase in the n parameter after GA attachment, which can be explained similarly to the 4-ATP modification. Although Figure 2A,B shows the changes only for incubation in solution of one receptor (F6 10G), attachment to the surface of other receptors resulted in very comparable and reproducible changes in both the voltamperogram and the impedance spectrum of the sample.
It can be seen that the changes in both the voltammogram and the impedance spectrum after incubation in 4-ATP solution were very slight or inconsistent with most data found in the literature—the monolayer formed on the electrode surfaces should significantly impair the charge exchange [35]. On the other hand, some research has shown that the 4-ATP monolayer on the surface of the electrode does not influence the charge transfer. To dispel any doubts about the adsorption of 4-ATP on the surface of the sensor, which is crucial to further functionalization, the changes in the sample were investigated with the referenced method, which is QCM. This method does not only allow for changes in the surface of the sample to show, but also provides useful information about the amount of the species adsorbed. To compare results obtained from both methods, the QCM was modified, allowing us to also perform electrochemical measurements on QC. The results of that experiments are shown in Figure 3.
Both the voltammogram and impedance spectra of the sample did not show significant differences, which corresponded well with the results presented in Figure 3. However, QC showed a frequency shift of about 31.20 Hz in the case of measurement in liquid (electrolyte) and 83.72 Hz without it. This, without any doubt, indicates the rise in QC weight linked with the adsorption process of 4-ATP. Using Equation (2), it is possible to determine the exact number of moles of adsorbed substance [36]:
m = C f p  
where ∆m is the mass of the monolayer [g]; ∆f is frequency shift [Hz]; C is a constant value equal to 4.42 × 10⁻⁹ [g/(Hz∙cm2)] [37]; and p is equal to 1. Since the used QCs were intended for liquid biosensing, the frequency change determined in the presence of liquid was used for the calculations. The mass change determined corresponded to 1.10 × 10⁻⁹ of the number of moles per cm2. Because the modification of the gold surface with thiol molecules has been confirmed, it is possible to further attach appropriate linkers for placement on the antibody surface.

3.2. Determination of the Operating Parameters of the Immunosensor

3.2.1. Selection of Antibodies: Cross-Reactivity Tests

After the sensor modification procedure was fully completed, screening tests were carried out to select the best receptor. Although good reproducibility and repeatability of the sensor parameters were noted during modification, in order to standardize the results, the electrode coverage degree was calculated according to Equation (3) [38]:
φ = R T e s t ct   R B a s i c ct R T e s t ct × 100 % = 1 R B a s i c ct R T e s t ct × 100 %
where RBasicct is Rct before the test (blank, positive sample, negative sample) and RTestct is Rct after the test. This equation is often used in various studies of adsorption processes and has the advantage of better displaying the relative changes taking place on the sensor surface.
The specificity of the seven used receptors was tested in the presence of negative samples such as TBS buffer (blank) and other proteins such as SUMO-EHV-1 gG and SeM-HisTAG and also positive sample-EVA-N-HisTAG protein. Each analyte was tested at two concentrations. All measurements were performed in triplicate, which confirms the repeatability of the proposed method. All results are shown in Figure 4.
By analyzing Figure 4, we can conclude that receptor F6 10G is most suitable for usage to create the immunosensor. Behavior of samples containing this particular receptor is clearly different from samples of the immunosensor created by the usage of different receptors. F6 10G was the only one that showed low responses to high concentrations of negative samples not exceeding 11% as well as the highest responses to targeted protein (approximately 50%). All of the remaining receptors did not show such high selectivity and sensitivity. Most responses of the positive sample were comparable with responses of negative samples, which may be caused by low selectivity of a receptor of the phenomena of biofouling. Presumably, the confirmation of receptor F6 10G is preventing other molecules from adsorption on the electrode surface, which nullifies the changes in sample impedance.
All of the receptors showed slight responses to the blank. It is also noticeable that repeatability was satisfactory as the standard deviation of measurements (shown as the error bar) did not exceed 12%.

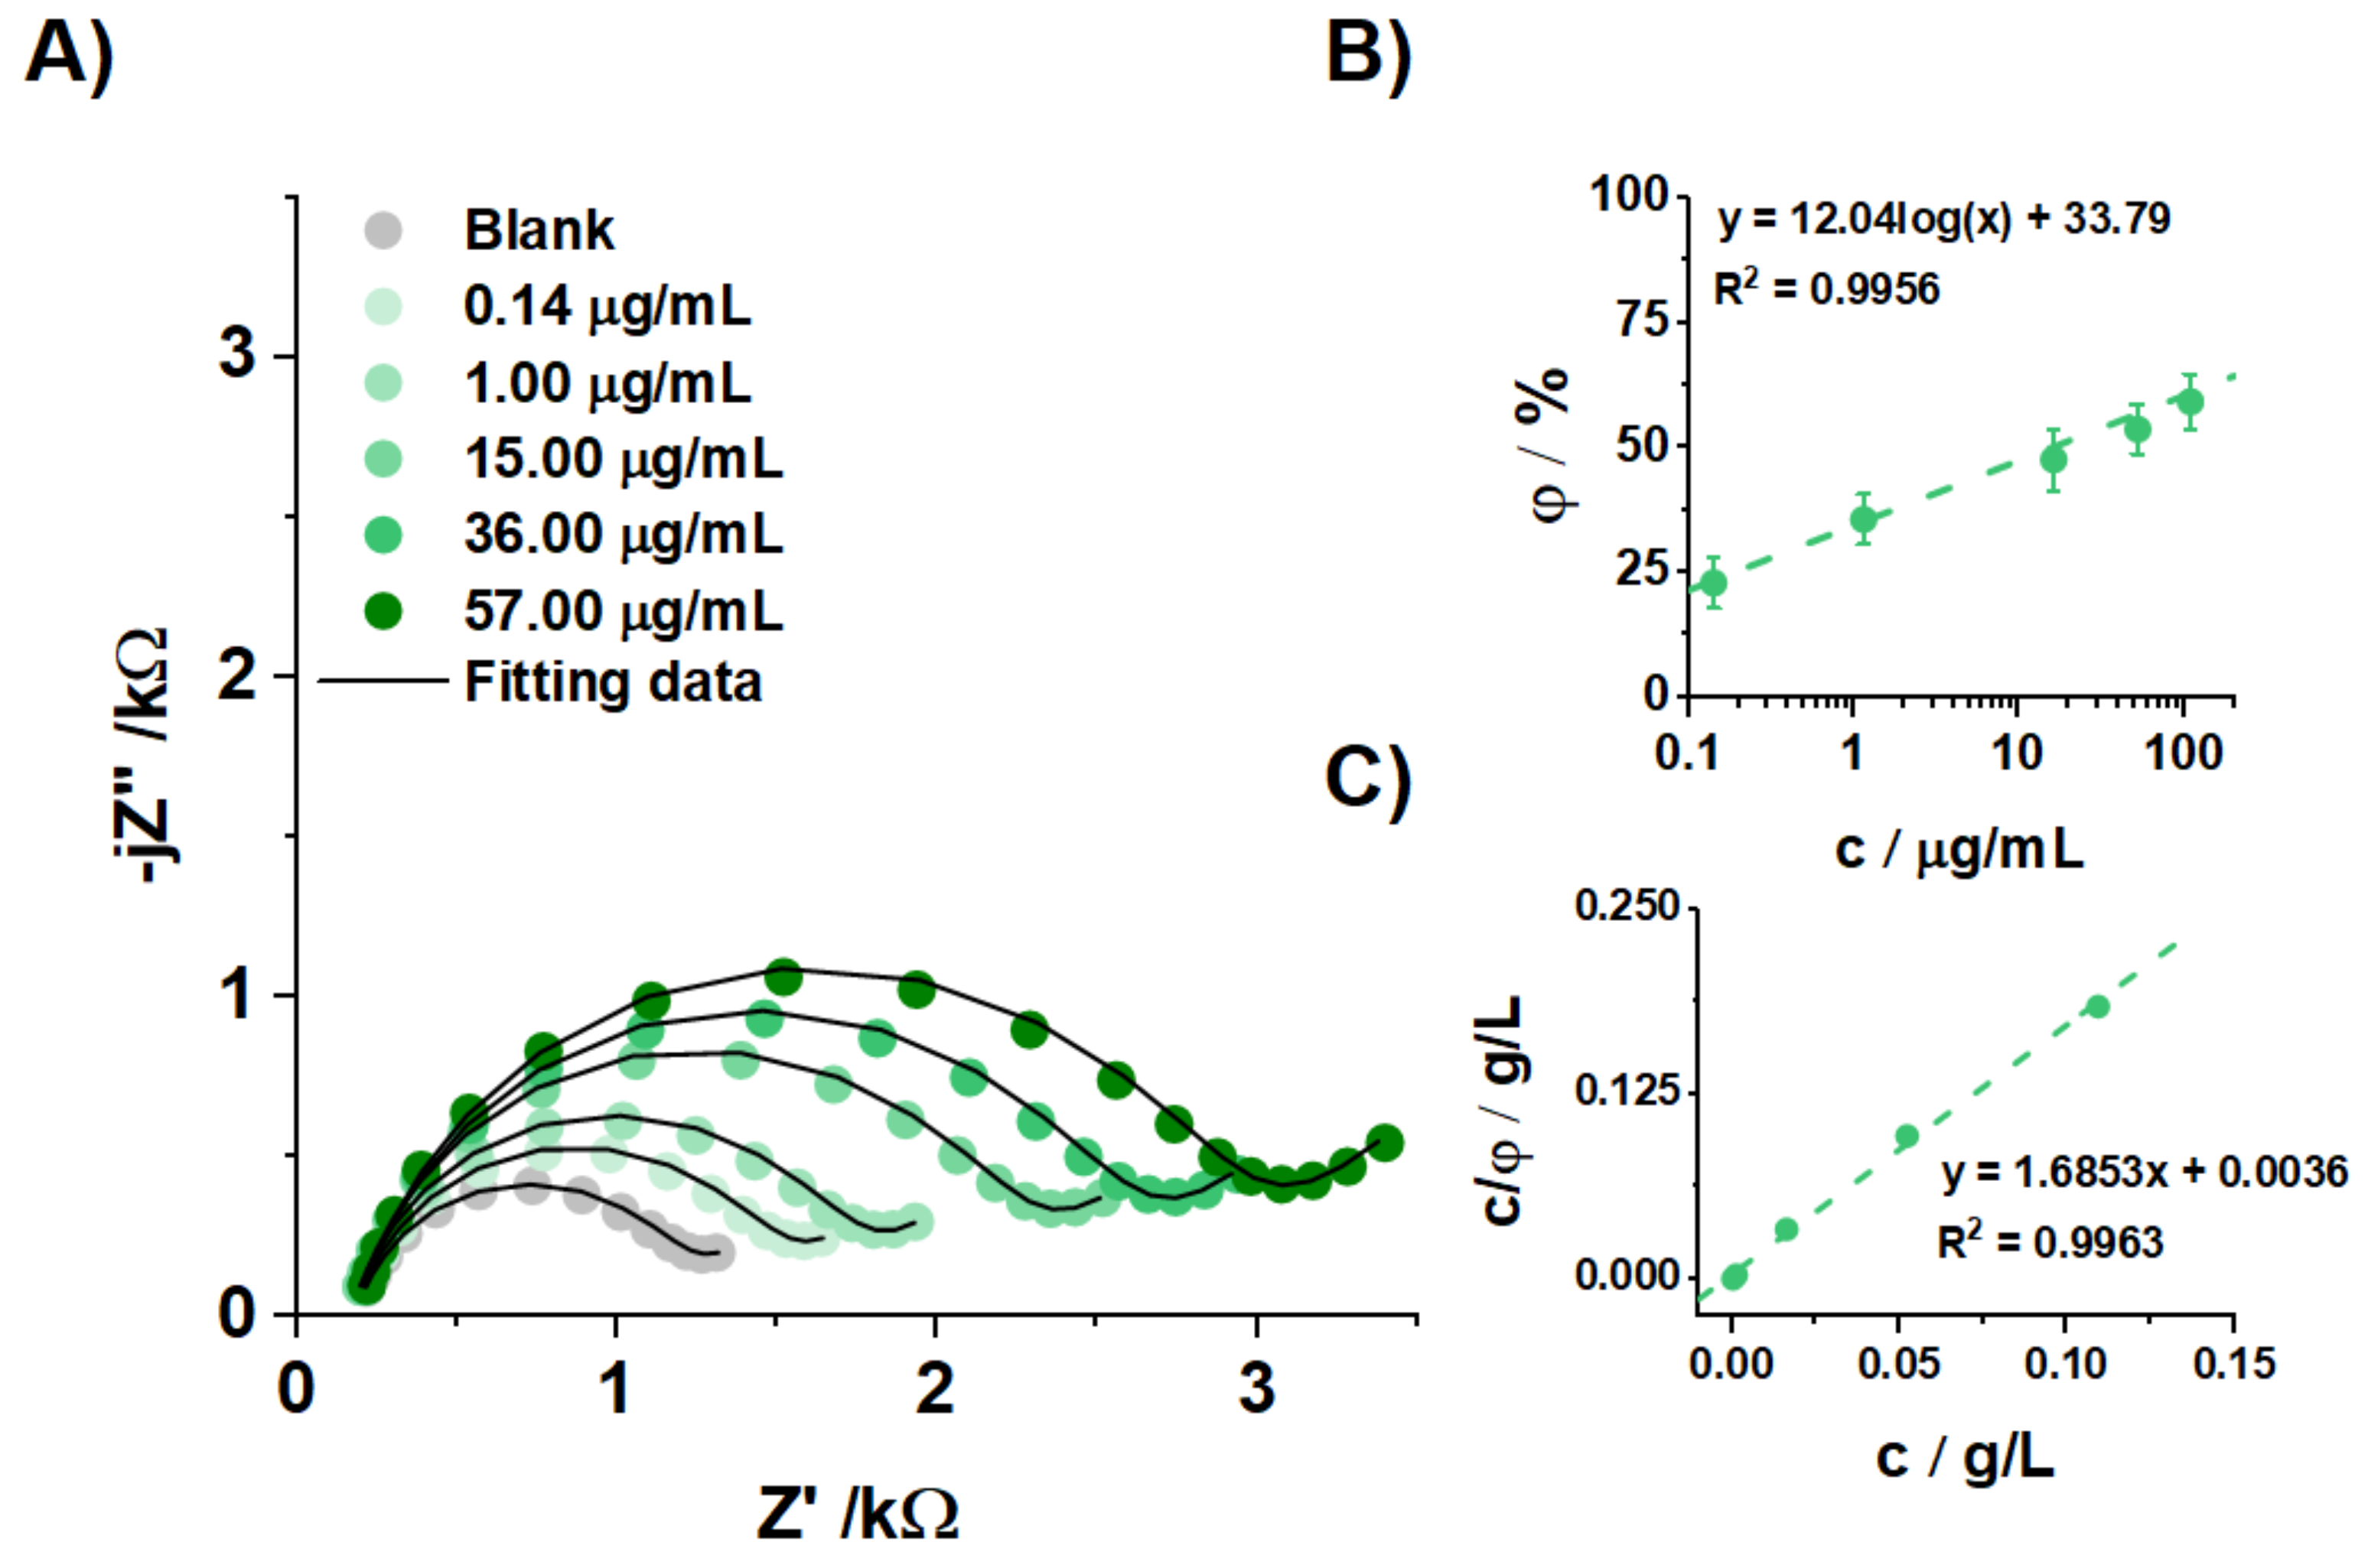
3.2.2. Accurate Evaluation of the Parameters of the Selected Receptor

The data collected during the detection of the EVA-N-HisTAG protein is shown in Figure 5.
In Figure 5A, the impedance spectra during incubation in successive concentrations of the protein show that the attachment of the protein to the surface hinders the charge exchange on the surface, which was observed by the increase in the Rct parameter. For a more precise data analysis from the calculated Rct, the electrode coverage degree can be further calculated and its dependence on the EVA-N-HisTAG protein concentration plotted. It should be remembered that to accurately analyze the data, the successive concentrations should be added to the previously used ones. A plot of this relationship is shown in Figure 5B. It can be seen that the relationship is logarithmic, which is related to the characteristics of the adsorption process. The slope of this curve in Figure 5B, in combination with the data collected during antibody selection, can be used to calculate the limit of detection (LOD) [35] by calculating at which EVA-N-HisTAG protein concentration the same response as the highest response in cross-reactivity tests is obtained. The calculated LOD value was equal to 0.01705 μg/mL. In order to obtain more data on the EVA-N-HisTAG protein attachment process to the surface of the modified electrode, the Langmuir adsorption isotherm shown in Figure 5C can be plotted. The Langmuir isotherm can be written as a linear equation, as shown below [39]:
c φ = 1 K a d s + c
Concluding from the value of the correlation coefficient of the curve from Figure 5C close to one, it can be concluded that this relationship is well satisfied. The use of the model presented by Langmuir seems to be the most appropriate taking into account the assumptions contained therein: the presence of a certain number of adsorption sites on the surface, the same size and shape of all adsorption sites, and the possibility of attaching only one adsorbent molecule through the adsorption site correlate well with a surface filled with identical receptor molecules. In order to further analyze the results obtained by such presentation of the data, the following equation can be used to calculate the free enthalpy of the adoption process from the intercept [40]:
log K a d s = log c H 2 O Δ G a d s 2.303 R T    
where R is the universal gas constant expressed in kJ/mol; T is the temperature in Kelvin; and cH2O is expressed in a unit identical to that of the EVA-N-HisTAG protein concentration in Figure 5C. The value thus calculated Δ G a d s was −31.00 kJ/mol. Assuming that more negative Δ G a d s values than −20 kJ/mol means that the process is chemosorptive in nature [41,42,43]. This means that the adsorption of the protein takes place in a highly specific manner on the active sites (receptor molecules) and a monolayer of the protein is formed on the surface of the modified electrode.

3.2.3. Stability of Biosensor and Optimization of Storage Conditions

One of the most important assumptions of creating any kind of immunosensor is its stability under normal conditions [44]. Nevertheless, it is also important to have a possibility to store immunosensor before use until it is needed. Unfortunately, electrochemical biosensors containing the biological structures are often not stable under normal conditions for long because irreversible changes in those structures would occur. To determine the stability of the prepared biosensor, the impedance spectra of the electrode fully prepared for detection of the target protein were recorded, then it was rinsed with deionized water and dried with a stream of argon. Next prepared samples were stored in different conditions: 5 °C without immersing in any buffer, 20 °C without immersing in any buffer, and 5 °C with immersing in TBS buffer for 1 h. After that time, the electrode was also rinsed with deionized water, dried with argon, and the impedance spectra were recorded once more. All tests were performed for multiple samples. The results are presented in Figure 6.
As can be seen in Figure 6A,B the diameter of the semicircle increased approximately about 2 kΩ, which would indicate that configuration of proteins present at the surface of the electrode would have changed and blocked the migration of the electrochemical species (Fe(CN)63−/4−) to the surface of the electrode. Thus it is obvious that the sensor cannot be stored at 5 °C or −20 °C. To solve this problem, the samples were immersed in a 200 μL solution of TBS buffer, which is used as a solvent as well as for the positive and negative samples used in this work. As can be seen in Figure 6C, there was a slight change in impedance spectra of the sample before and after storage, which indicates good stability of the biosensor.

4. Conclusions

In this work, we describe the development impedimetric sensing platforms to detect equine arteritis virus. We compared the performance of immunosensors in terms of their sensitivity, limit of detection, dynamic range, and specificity for the EVA-N-HisTAG protein. The viral detection was based on the analysis of EIS spectra recorded at the electrodes’ antibody-modified surfaces. The F6 10G receptor showed the best performance. The highest value of the sensor response to the positive sample was obtained, which was over 50% for the detection of a higher concentration (15 µg/mL) of the EVA-N-HisTAG protein and over 23% for the detection of the lower concentration equal to 0.14 µg/mL. Sensor responses obtained with negative samples did not exceed 11%. The developed sensor was not verified on real samples. In this work, we used protein (positive and negative control) to exclude possible cross-reactions. It was also shown that there is no hindrance for further assumed studies—verification of the sensor on biological samples (viruses)—which are planned to be done and further published in the next paper.

Author Contributions

Conceptualization, M.B. (Mateusz Brodowski), M.K. and W.B.; Formal analysis, M.B. (Mateusz Brodowski) and M.K.; Investigation, W.B. and J.W.; Methodology, M.K., K.P., R.W., J.R., T.Ł., M.S., M.B. (Małgorzata Biedulska), J.K.K., M.L. and K.N.; Project administration, W.B. and S.Ż.; Supervision, T.L., K.P., S.Ż. and D.N.; Visualization, E.B.; Writing—original draft, M.B. (Mateusz Brodowski). All authors have read and agreed to the published version of the manuscript.

Funding

The Project funded by the National Center of Research and Development (contract no. POIR. 04.01.04-00-0013/18-00).

Institutional Review Board Statement

The study was conducted according to the guidelines of the Declaration of Helsinki, and approved by the Institutional Review Board (or Ethics Committee) of Local Ethics Committee (protocol code 89/2018/P1 and date of approval 17 October 2018).

Informed Consent Statement

Not applicable.

Data Availability Statement

Not applicable.

Conflicts of Interest

The authors declare no conflict of interest. The funders had no role in the design of the study; in the collection, analyses, or interpretation of data; in the writing of the manuscript, or in the decision to publish the results.

References

  1. Tatem, A.J.; Rogers, D.J.; Hay, S.I. Global Transport Networks and Infectious Disease Spread. Adv. Parasitol. 2006, 62, 293–343. [Google Scholar] [CrossRef]
  2. Drexler, M.; Institute of Medicine (US). What You Need to Know about Infectious Disease; National Academies Press (US): Washington, DC, USA, 2010. [Google Scholar]
  3. Carossino, M.; Loynachan, A.T.; Canisso, I.F.; Cook, R.F.; Campos, J.R.; Nam, B.; Go, Y.Y.; Squires, E.L.; Troedsson, M.H.T.; Swerczek, T.; et al. Equine Arteritis Virus Has Specific Tropism for Stromal Cells and CD8+ T and CD21+ B Lymphocytes but Not for Glandular Epithelium at the Primary Site of Persistent Infection in the Stallion Reproductive Tract. J. Virol. 2017, 91, e00418-17. [Google Scholar] [CrossRef] [Green Version]
  4. Timoney, P.J.; McCollum, W.H.; Roberts, A.W.; McDonald, M.J. Status of Equine Viral Arteritis in Kentucky, 1985. J. Am. Vet. Med. Assoc. 1987, 191, 36–39. [Google Scholar] [PubMed]
  5. Monreal, L.; Villatoro, A.J.; Hooghuis, H.; Ros, I.; Timoney, P.J. Clinical Features of the 1992 Outbreak of Equine Viral Arteritis in Spain. Equine Vet. J. 1995, 27, 301–304. [Google Scholar] [CrossRef]
  6. Wood, J.; Chirnside, E.; Mumford, J.; Higgins, A. First Recorded Outbreak of Equine Viral Arteritis in the United Kingdom. Vet. Rec. 1994, 136, 381. [Google Scholar] [CrossRef]
  7. Holyoak, G.R.; Balasuriya, U.B.R.; Broaddus, C.C.; Timoney, P.J. Equine Viral Arteritis: Current Status and Prevention. Theriogenology 2008, 70, 403–414. [Google Scholar] [CrossRef] [PubMed]
  8. Miszczak, F.; Legrand, L.; Balasuriya, U.B.R.; Ferry-Abitbol, B.; Zhang, J.; Hans, A.; Fortier, G.; Pronost, S.; Vabret, A. Emergence of Novel Equine Arteritis Virus (EAV) Variants during Persistent Infection in the Stallion: Origin of the 2007 French EAV Outbreak Was Linked to an EAV Strain Present in the Semen of a Persistently Infected Carrier Stallion. Virology 2012, 423, 165–174. [Google Scholar] [CrossRef] [Green Version]
  9. Żychska, M.; Rakowska, A.; Bereznowski, A.; Witkowski, L. z Samodzielnej Pracowni Epidemiologii i Ekonomiki Weterynaryjnej Wydziału Medycyny Weterynaryjnej w Warszawie. Życie Weter. 2019, 94, 607–609. [Google Scholar]
  10. Timoney, P.J.; McCollum, W.H. Equine Viral Arteritis. Vet. Clin. N. Am. Equine Pract. 1993, 9, 295–309. [Google Scholar] [CrossRef]
  11. Ruiz-Sáenz, J. Equine Viral Arteritis: Epidemiological and Intervention Perspectives. Rev. Colomb. Cienc. Pecu. 2010, 23, 501–512. [Google Scholar]
  12. Timoney, P. Factors Influencing the International Spread of Equine Diseases. Vet. Clin. N. Am. Equine Pract. 2001, 16, 537–551. [Google Scholar] [CrossRef]
  13. Balasuriya, U.B.R.; Sarkar, S.; Carossino, M.; Go, Y.Y.; Chelvarajan, L.; Cook, R.F.; Loynachan, A.T.; Timoney, P.J.; Bailey, E. Host Factors That Contribute to Equine Arteritis Virus Persistence in the Stallion: An Update. J. Equine Vet. Sci. 2016, 43, S11–S17. [Google Scholar] [CrossRef] [Green Version]
  14. Timoney, P.J. The Increasing Significance of International Trade in Equids and Its Influence on the Spread of Infectious Diseases. Ann. N. Y. Acad. Sci. 2000, 916, 55–60. [Google Scholar] [CrossRef] [PubMed]
  15. Garber, L. Eva: Equine Viral Arteritis and The U.S. Horse Industry. Miscellaneous Publications; United States Department of Agriculture, National Animal Health Monitoring System: 2000. Available online: https://ageconsearch.umn.edu/record/32749/ (accessed on 30 August 2021).
  16. Lazić, S.; Lupulović, D.; Gaudaire, D.; Petrovic, T.; Lazić, G.; Hans, A. Serological Evidence of Equine Arteritis Virus Infection and Phylogenetic Analysis of Viral Isolates in Semen of Stallions from Serbia. BMC Vet. Res. 2017, 13, 316. [Google Scholar] [CrossRef] [Green Version]
  17. Hedges, J.F.; Balasuriya, U.B.; Timoney, P.J.; McCollum, W.H.; MacLachlan, N.J. Genetic Divergence with Emergence of Novel Phenotypic Variants of Equine Arteritis Virus during Persistent Infection of Stallions. J. Virol. 1999, 73, 3672–3681. [Google Scholar] [CrossRef] [PubMed] [Green Version]
  18. Chirnside, E.D.; Francis, P.M.; de Vries, A.A.; Sinclair, R.; Mumford, J.A. Development and Evaluation of an ELISA Using Recombinant Fusion Protein to Detect the Presence of Host Antibody to Equine Arteritis Virus. J. Virol. Methods 1995, 54, 1–13. [Google Scholar] [CrossRef]
  19. Cho, H.J.; Entz, S.C.; Deregt, D.; Jordan, L.T.; Timoney, P.J.; McCollum, W.H. Detection of Antibodies to Equine Arteritis Virus by a Monoclonal Antibody-Based Blocking ELISA. Can. J. Vet. Res. 2000, 64, 38–43. [Google Scholar]
  20. Severgnini, M.; Cremonesi, P.; Consolandi, C.; Bellis, G.; Castiglioni, B. Advances in DNA Microarray Technology for the Detection of Foodborne Pathogens. Food Bioprocess Technol. 2011, 6, 936–953. [Google Scholar] [CrossRef]
  21. Ward, S.; Lindsley, A.; Courter, J.; Assa’ad, A. Clinical Testing for COVID-19. J. Allergy Clin. Immunol. 2020, 146, 23–34. [Google Scholar] [CrossRef]
  22. Velusamy, V.; Arshak, K.; Korostynska, O.; Oliwa, K.; Adley, C. An Overview of Foodborne Pathogen Detection: In the Perspective of Biosensors. Biotechnol. Adv. 2010, 28, 232–254. [Google Scholar] [CrossRef]
  23. Ahmed, A.; Rushworth, J.V.; Hirst, N.A.; Millner, P.A. Biosensors for Whole-Cell Bacterial Detection. Clin. Microbiol. Rev. 2014, 27, 631–646. [Google Scholar] [CrossRef] [Green Version]
  24. Legrand, L.; Pitel, P.H.; Fortier, G.; Pronost, S.; Vabret, A. Testing for Antibodies to Equine Arteritis Virus. Vet. Rec. 2007, 161, 599–600. [Google Scholar] [CrossRef] [PubMed]
  25. Ashrafi, A.; Koudelkova, Z.; Sedlackova, E.; Richtera, L.; Adam, V. Review—Electrochemical Sensors and Biosensors for Determination of Mercury Ions. J. Electrochem. Soc. 2018, 165, B824–B834. [Google Scholar] [CrossRef]
  26. Singhal, C.; Khanuja, M.; Chaudhary, N.; Pundir, C.S.; Narang, J. Detection of Chikungunya Virus DNA Using Two-Dimensional MoS2 Nanosheets Based Disposable Biosensor. Sci. Rep. 2018, 8, 7734. [Google Scholar] [CrossRef] [PubMed]
  27. Mehrotra, P. Biosensors and Their Applications—A Review. J. Oral Biol. Craniofac. Res. 2016, 6, 153–159. [Google Scholar] [CrossRef] [Green Version]
  28. Contreras-Naranjo, J.E.; Aguilar, O. Suppressing Non-Specific Binding of Proteins onto Electrode Surfaces in the Development of Electrochemical Immunosensors. Biosensors 2019, 9, 15. [Google Scholar] [CrossRef] [PubMed] [Green Version]
  29. Tang, X.; Zhang, X.; Xu, H. Establishment of Hybridoma Cell Lines Producing Monoclonal Antibodies against Hepatitis B Virus Surface Antigens (a, d, and r) and Development of Sensitive ELISA Diagnostic Test. Hybridoma 2001, 20, 47–52. [Google Scholar] [CrossRef]
  30. Shulman, M.; Wilde, C.D.; Köhler, G. A Better Cell Line for Making Hybridomas Secreting Specific Antibodies. Nature 1978, 276, 269–270. [Google Scholar] [CrossRef] [PubMed]
  31. Białobrzeska, W.; Dziąbowska, K.; Lisowska, M.; Mohtar, M.A.; Muller, P.; Vojtesek, B.; Krejcir, R.; O’Neill, R.; Hupp, T.R.; Malinowska, N.; et al. An Ultrasensitive Biosensor for Detection of Femtogram Levels of the Cancer Antigen AGR2 Using Monoclonal Antibody Modified Screen-Printed Gold Electrodes. Biosensors 2021, 11, 184. [Google Scholar] [CrossRef]
  32. Białobrzeska, W.; Firganek, D.; Czerkies, M.; Lipniacki, T.; Skwarecka, M.; Dziąbowska, K.; Cebula, Z.; Malinowska, N.; Bigus, D.; Bięga, E.; et al. Electrochemical Immunosensors Based on Screen-Printed Gold and Glassy Carbon Electrodes: Comparison of Performance for Respiratory Syncytial Virus Detection. Biosensors 2020, 10, 175. [Google Scholar] [CrossRef]
  33. Hirschorn, B.; Orazem, M.E.; Tribollet, B.; Vivier, V.; Frateur, I.; Musiani, M. Determination of Effective Capacitance and Film Thickness from Constant-Phase-Element Parameters. Electrochim. Acta 2010, 55, 6218–6227. [Google Scholar] [CrossRef]
  34. Ryl, J.; Wysocka, J.; Cieslik, M.; Krakowiak, S.; Slepski, P. Galvanostatic Impedance Measurements for the Efficient Adsorption Isotherm Construction in Corrosion Inhibitor Studies. Electrochem. Commun 2013, 27, 42–45. [Google Scholar] [CrossRef]
  35. Wei, Y.; Yang, R.; Li, X.-Z.; Wang, L.; Huang, X.-J. Layer-by-Layer Assembly and Electrochemical Study of a 4-Aminothiophenol and Ytterbium(Iii) Trifluoromethanesulfonate Hydrate Film on a Gold Electrode. Analyst 2011, 136, 3997. [Google Scholar] [CrossRef]
  36. Wang, M.; Wang, L.; Wang, G.; Ji, X.; Bai, Y.; Li, T.; Gong, S.; Li, J. Application of Impedance Spectroscopy for Monitoring Colloid Au-Enhanced Antibody Immobilization and Antibody-Antigen Reactions. Biosens. Bioelectron. 2004, 19, 575–582. [Google Scholar] [CrossRef]
  37. Kaur, S.; Kaur, I. Self-Assembly of p-Aminothiophenol on Gold Surface: Application for Impedimetric and Potentiometric Sensing of Cobalt (II) Ions—A Comparative Study. Electroanalysis 2019, 31, 2507–2517. [Google Scholar] [CrossRef]
  38. Rosario-Castro, B.I.; Fachini, E.R.; Hernández, J.; Pérez-Davis, M.E.; Cabrera, C.R. Electrochemical and Surface Characterization of 4-Aminothiophenol Adsorption at Polycrystalline Platinum Electrodes. Langmuir 2006, 22, 6102–6108. [Google Scholar] [CrossRef] [PubMed]
  39. Medina, S.C.; Farinha, A.S.F.; Emwas, A.-H.; Tabatabai, A.; Leiknes, T. A Fundamental Study of Adsorption Kinetics of Surfactants onto Metal Oxides Using Quartz Crystal Microbalance with Dissipation (QCM-D). Colloids Surf. A Physicochem. Eng. Asp. 2020, 586, 124237. [Google Scholar] [CrossRef]
  40. 10 MHZ Quartz Sensors Box for Liquid Biosensing—10 Pieces. Available online: https://store.openqcm.com/10-mhz-quartz-sensors-box-for-liquid-biosensing-10-pieces.html (accessed on 28 May 2021).
  41. Ryl, J.; Wysocka, J.; Cieslik, M.; Gerengi, H.; Ossowski, T.; Krakowiak, S.; Niedzialkowski, P. Understanding the Origin of High Corrosion Inhibition Efficiency of Bee Products towards Aluminium Alloys in Alkaline Environments. Electrochim. Acta 2019, 304, 263–274. [Google Scholar] [CrossRef]
  42. Cebula, Z.; Żołędowska, S.; Dziąbowska, K.; Skwarecka, M.; Malinowska, N.; Białobrzeska, W.; Czaczyk, E.; Siuzdak, K.; Sawczak, M.; Bogdanowicz, R.; et al. Detection of the Plant Pathogen Pseudomonas Syringae Pv. Lachrymans on Antibody-Modified Gold Electrodes by Electrochemical Impedance Spectroscopy. Sensors 2019, 19, 5411. [Google Scholar] [CrossRef] [Green Version]
  43. Chauhan, L.R.; Gunasekaran, G. Corrosion Inhibition of Mild Steel by Plant Extract in Dilute HCl Medium. Corros. Sci. 2007, 49, 1143–1161. [Google Scholar] [CrossRef]
  44. Noor, E.A. Potential of Aqueous Extract of Hibiscus Sabdariffa Leaves for Inhibiting the Corrosion of Aluminum in Alkaline Solutions. J. Appl. Electrochem. 2009, 39, 1465–1475. [Google Scholar] [CrossRef]
Figure 1. Mechanisms of gold electrode modifications with antibodies.
Chemosensors 09 00265 g001
Figure 2. Results obtained from the electrochemical tests. (A) CV study for each stage of sensor modification. (B) Impedance spectra for each stage of the sensor modification. (C) Equivalent electrical circuit used for data modeling.
Chemosensors 09 00265 g002
Figure 3. Results of electrochemical QC tests before and after incubation in 4-ATP solution: (A) Voltammetric curve. (B) Impedance spectra.
Chemosensors 09 00265 g003
Figure 4. The results of tests of the responses of various receptors to the negative samples (SeM-HisTAG and SUMO-EHV-1 gG), the blank (TBS), and the target protein (EVA-N-HisTAG).
Chemosensors 09 00265 g004
Figure 5. Sensor response results depending on the EVA-N-HisTAG protein concentration. (A) Sensor impedance spectra. (B) Dependence of the sensor response on the protein concentration. (C) Langmuir adsorption isotherm.
Chemosensors 09 00265 g005
Figure 6. Impedance spectra of the prepared biosensor to step of BSA (before storage) and after storage under different conditions: (A) 5 °C without immersing in TBS buffer; (B) −20 °C without immersing in TBS buffer; (C) 5 °C with immersing in TBS buffer.
Chemosensors 09 00265 g006
Table 1. Results of fitting EEC to experimental EIS data.
StageRct/ΩQ/μF × s(1−n)n/−Chi-Square
Bare298.9359.400.382 × 10−3
4-ATP78.067.300.641 × 10−4
GA805.800.790.883 × 10−4
Receptor1008.000.800.872 × 10−4
BSA1538.000.710.873 × 10−4
Publisher’s Note: MDPI stays neutral with regard to jurisdictional claims in published maps and institutional affiliations.

