
In Vivo Cerebral Translocator Protein (TSPO) Binding and Its Relationship with Blood Adiponectin Levels in Treatment-Naïve Young Adults with Major Depression: A [11C]PK11195 PET Study


 , and
, and
Abstract
:1. Introduction
2. Materials and Methods
2.1. Participants
2.2. Clinical Assessments
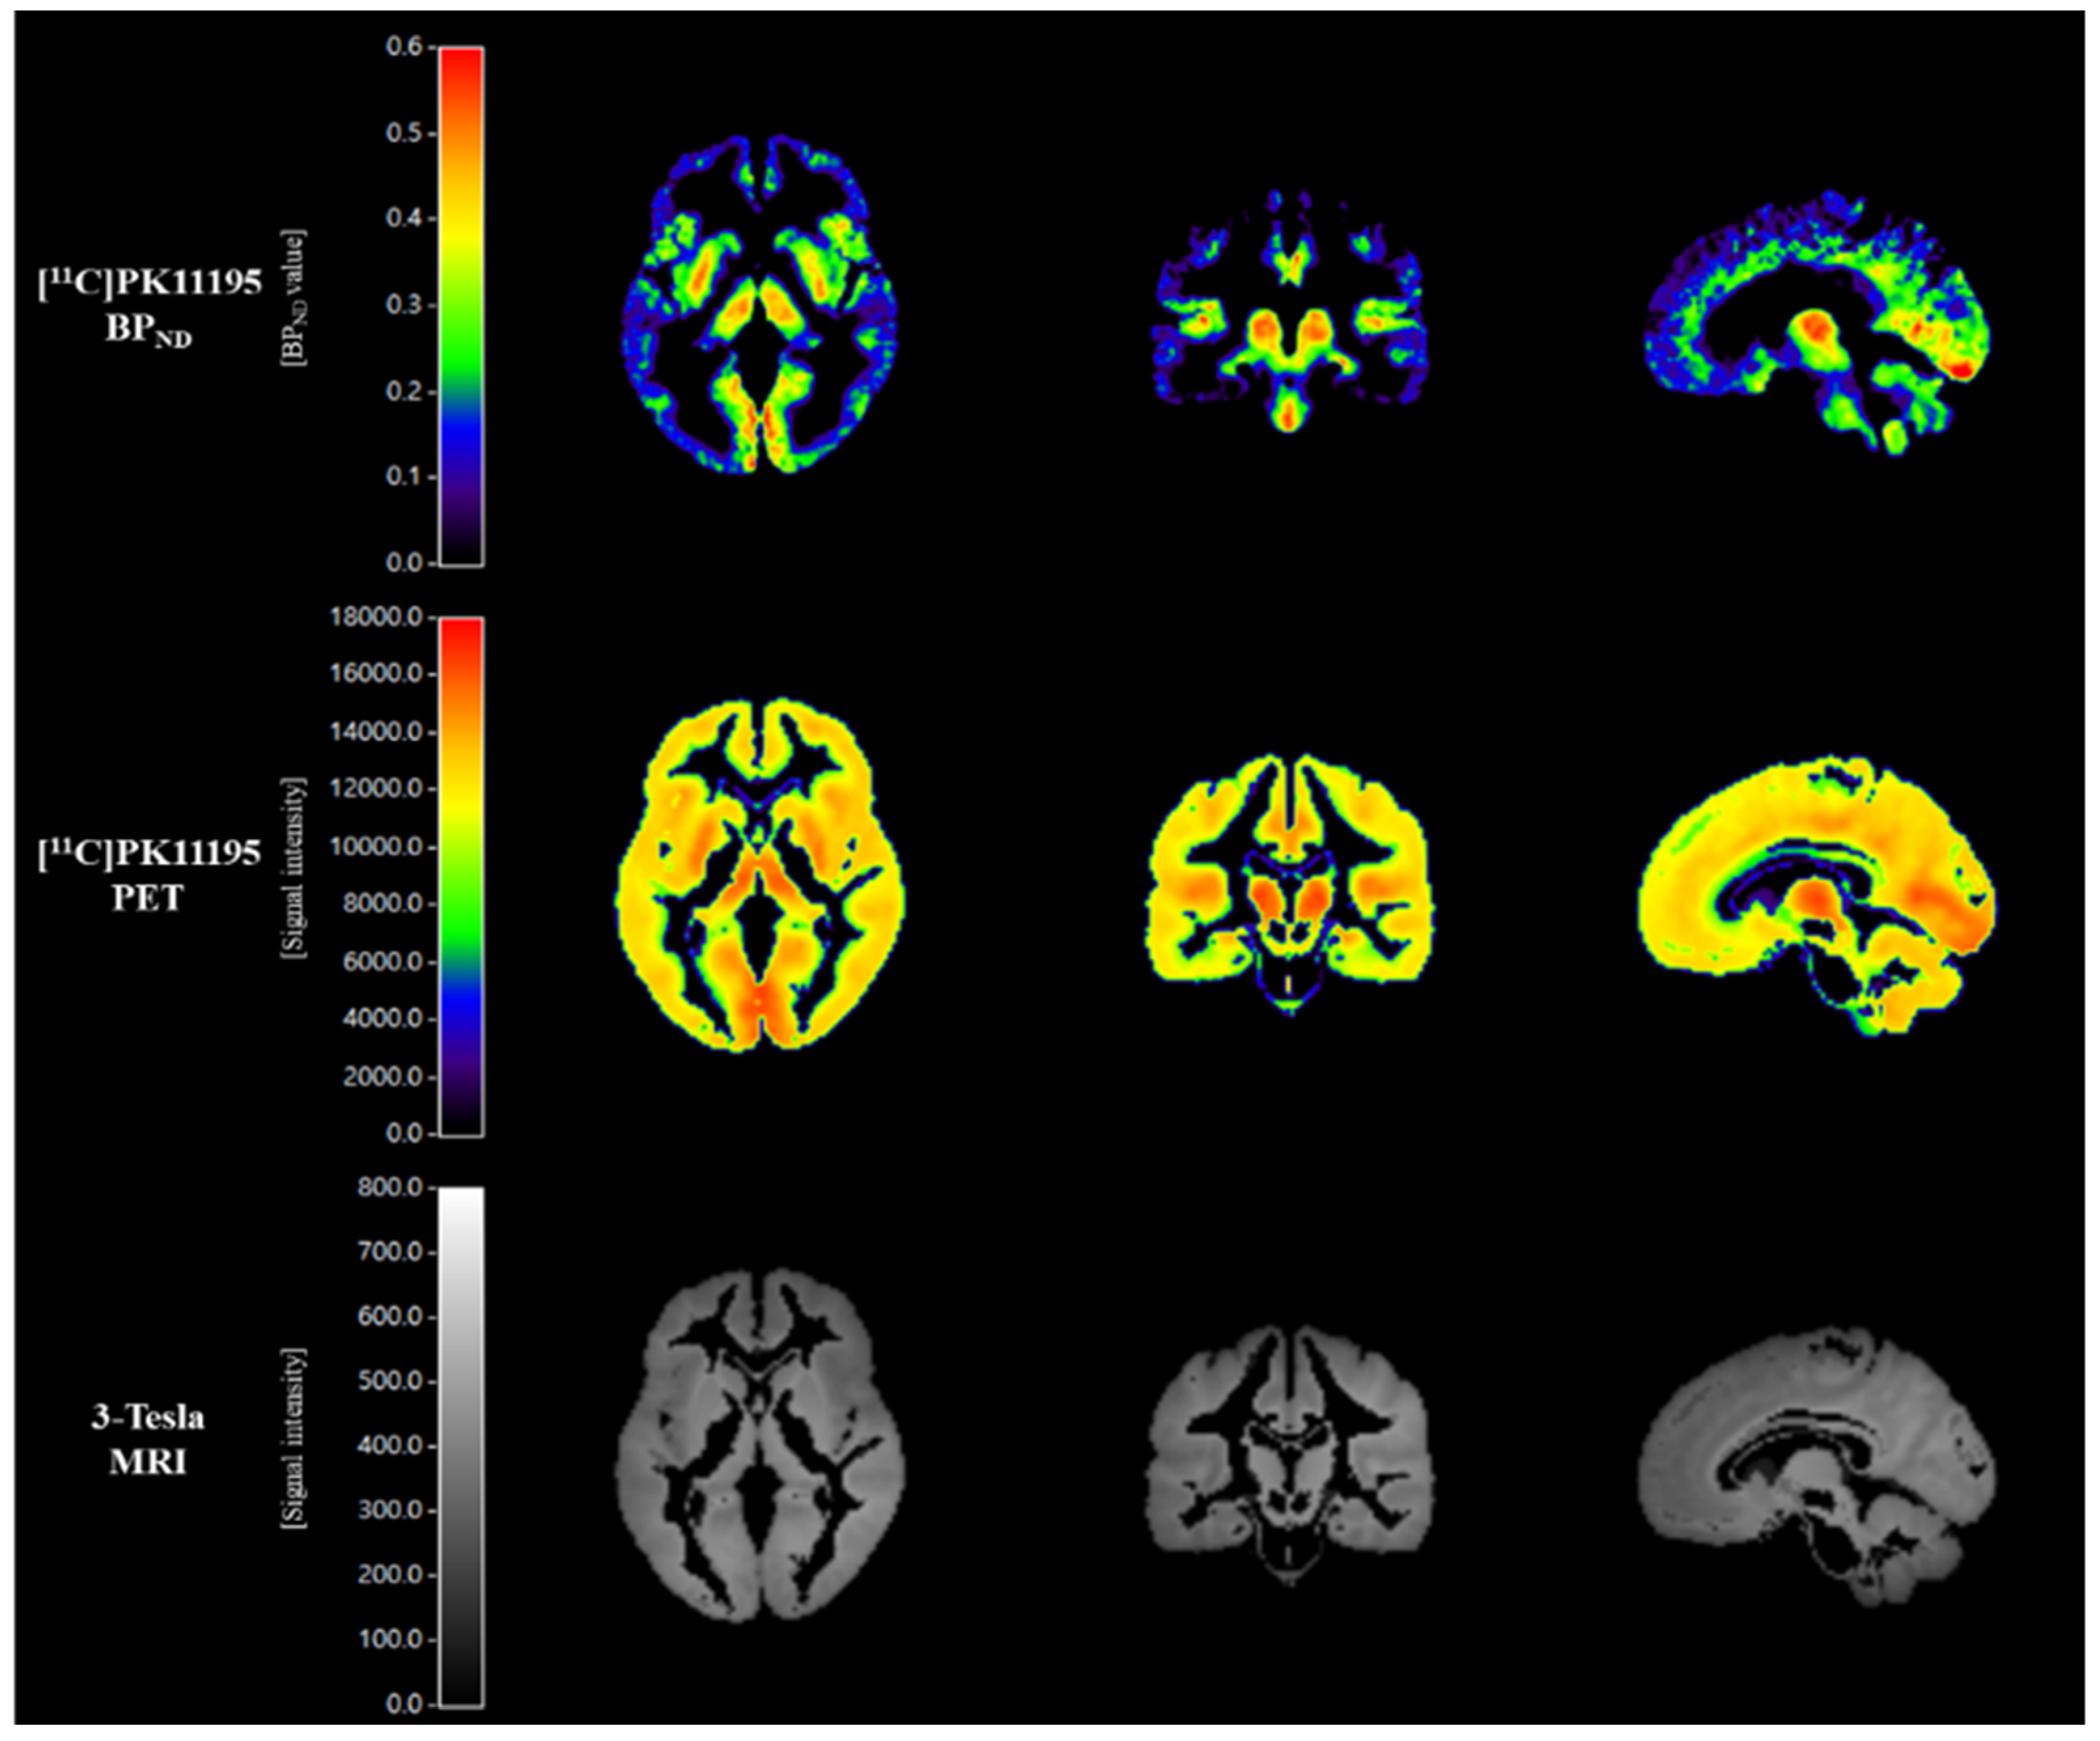
2.3. Scanning Protocol for [11C]PK11195 PET Imaging
2.4. [11C]PK11195 PET Imaging Analysis
2.5. Measurement of Blood Adiponectin Levels
2.6. Statistical Analysis
3. Results
4. Discussion
5. Conclusions
Supplementary Materials
Author Contributions
Funding
Institutional Review Board Statement
Informed Consent Statement
Data Availability Statement
Acknowledgments
Conflicts of Interest
References
- Løge-Hagen, J.S.; Sæle, A.; Juhl, C.; Bech, P.; Stenager, E.; Mellentin, A. Prevalence of Depressive Disorder among Patients with Fibromyalgia: Systematic Review and Meta-Analysis. J. Affect. Disord. 2019, 245, 1098–1105. [Google Scholar] [CrossRef] [PubMed]
- Nerurkar, L.; Siebert, S.; McInnes, I.B.; Cavanagh, J. Rheumatoid Arthritis and Depression: An Inflammatory Perspective. Lancet Psychiatry 2019, 6, 164–173. [Google Scholar] [CrossRef]
- D’Mello, C.; Swain, M.G. Immune-to-Brain Communication Pathways in Inflammation-Associated Sickness and Depression. Curr. Top. Behav. Neurosci. 2017, 31, 73–94. [Google Scholar] [CrossRef] [PubMed]
- Liu, J.J.; Wei, Y.B.; Strawbridge, R.; Bao, Y.; Chang, S.; Shi, L.; Que, J.; Gadad, B.S.; Trivedi, M.H.; Kelsoe, J.R.; et al. Peripheral Cytokine Levels and Response to Antidepressant Treatment in Depression: A Systematic Review and Meta-Analysis. Mol. Psychiatry 2020, 25, 339–350. [Google Scholar] [CrossRef] [PubMed] [Green Version]
- Enache, D.; Pariante, C.M.; Mondelli, V. Markers of Central Inflammation in Major Depressive Disorder: A Systematic Review and Meta-Analysis of Studies Examining Cerebrospinal Fluid, Positron Emission Tomography and Post-Mortem Brain Tissue. Brain Behav. Immun. 2019, 81, 24–40. [Google Scholar] [CrossRef] [PubMed]
- Dupont, A.-C.; Largeau, B.; Santiago Ribeiro, M.J.; Guilloteau, D.; Tronel, C.; Arlicot, N. Translocator Protein-18 KDa (TSPO) Positron Emission Tomography (PET) Imaging and Its Clinical Impact in Neurodegenerative Diseases. Int. J. Mol. Sci. 2017, 18, 785. [Google Scholar] [CrossRef]
- Cumming, P.; Burgher, B.; Patkar, O.; Breakspear, M.; Vasdev, N.; Thomas, P.; Liu, G.-J.; Banati, R. Sifting through the Surfeit of Neuroinflammation Tracers. J. Cereb. Blood Flow Metab. 2018, 38, 204–224. [Google Scholar] [CrossRef]
- Hannestad, J.; DellaGioia, N.; Gallezot, J.-D.; Lim, K.; Nabulsi, N.; Esterlis, I.; Pittman, B.; Lee, J.-Y.; O’Connor, K.C.; Pelletier, D.; et al. The Neuroinflammation Marker Translocator Protein Is Not Elevated in Individuals with Mild-to-Moderate Depression: A [11C]PBR28 PET Study. Brain Behav. Immun. 2013, 33, 131–138. [Google Scholar] [CrossRef] [PubMed] [Green Version]
- Su, L.; Faluyi, Y.O.; Hong, Y.T.; Fryer, T.D.; Mak, E.; Gabel, S.; Hayes, L.; Soteriades, S.; Williams, G.B.; Arnold, R.; et al. Neuroinflammatory and Morphological Changes in Late-Life Depression: The NIMROD Study. Br. J. Psychiatry 2016, 209, 525–526. [Google Scholar] [CrossRef] [PubMed]
- Holmes, S.E.; Hinz, R.; Conen, S.; Gregory, C.J.; Matthews, J.C.; Anton-Rodriguez, J.M.; Gerhard, A.; Talbot, P.S. Elevated Translocator Protein in Anterior Cingulate in Major Depression and a Role for Inflammation in Suicidal Thinking: A Positron Emission Tomography Study. Biol. Psychiatry 2018, 83, 61–69. [Google Scholar] [CrossRef] [PubMed] [Green Version]
- Li, H.; Sagar, A.P.; Kéri, S. Translocator Protein (18kDa TSPO) Binding, a Marker of Microglia, Is Reduced in Major Depression during Cognitive-Behavioral Therapy. Prog. Neuro-Psychopharmacol. Biol. Psychiatry 2018, 83, 1–7. [Google Scholar] [CrossRef] [PubMed]
- Li, H.; Sagar, A.P.; Kéri, S. Microglial Markers in the Frontal Cortex Are Related to Cognitive Dysfunctions in Major Depressive Disorder. J. Affect. Disord. 2018, 241, 305–310. [Google Scholar] [CrossRef] [PubMed]
- Richards, E.M.; Zanotti-Fregonara, P.; Fujita, M.; Newman, L.; Farmer, C.; Ballard, E.D.; Machado-Vieira, R.; Yuan, P.; Niciu, M.J.; Lyoo, C.H.; et al. PET Radioligand Binding to Translocator Protein (TSPO) Is Increased in Unmedicated Depressed Subjects. EJNMMI Res. 2018, 8, 57. [Google Scholar] [CrossRef] [PubMed]
- Setiawan, E.; Wilson, A.A.; Mizrahi, R.; Rusjan, P.M.; Miler, L.; Rajkowska, G.; Suridjan, I.; Kennedy, J.L.; Rekkas, P.V.; Houle, S.; et al. Role of Translocator Protein Density, a Marker of Neuroinflammation, in the Brain During Major Depressive Episodes. JAMA Psychiatry 2015, 72, 268–275. [Google Scholar] [CrossRef] [PubMed]
- Setiawan, E.; Attwells, S.; Wilson, A.A.; Mizrahi, R.; Rusjan, P.M.; Miler, L.; Xu, C.; Sharma, S.; Kish, S.; Houle, S.; et al. Association of Translocator Protein Total Distribution Volume with Duration of Untreated Major Depressive Disorder: A Cross-Sectional Study. Lancet Psychiatry 2018, 5, 339–347. [Google Scholar] [CrossRef]
- Turkheimer, F.E.; Althubaity, N.; Schubert, J.; Nettis, M.A.; Cousins, O.; Dima, D.; Mondelli, V.; Bullmore, E.T.; Pariante, C.; Veronese, M. Increased Serum Peripheral C-Reactive Protein Is Associated with Reduced Brain Barriers Permeability of TSPO Radioligands in Healthy Volunteers and Depressed Patients: Implications for Inflammation and Depression. Brain Behav. Immun. 2021, 91, 487–497. [Google Scholar] [CrossRef]
- Owen, D.R.; Narayan, N.; Wells, L.; Healy, L.; Smyth, E.; Rabiner, E.A.; Galloway, D.; Williams, J.B.; Lehr, J.; Mandhair, H.; et al. Pro-Inflammatory Activation of Primary Microglia and Macrophages Increases 18 KDa Translocator Protein Expression in Rodents but Not Humans. J. Cereb. Blood Flow Metab. 2017, 37, 2679–2690. [Google Scholar] [CrossRef] [Green Version]
- Primiani, C.T.; Ryan, V.H.; Rao, J.S.; Cam, M.C.; Ahn, K.; Modi, H.R.; Rapoport, S.I. Coordinated Gene Expression of Neuroinflammatory and Cell Signaling Markers in Dorsolateral Prefrontal Cortex during Human Brain Development and Aging. PLoS ONE 2014, 9, e110972. [Google Scholar] [CrossRef] [Green Version]
- Tuisku, J.; Plavén-Sigray, P.; Gaiser, E.C.; Airas, L.; Al-Abdulrasul, H.; Brück, A.; Carson, R.E.; Chen, M.-K.; Cosgrove, K.P.; Ekblad, L.; et al. Effects of Age, BMI and Sex on the Glial Cell Marker TSPO—A Multicentre [11C]PBR28 HRRT PET Study. Eur. J. Nucl. Med. Mol. Imaging 2019, 46, 2329–2338. [Google Scholar] [CrossRef] [Green Version]
- Liu, C.-H.; Zhang, G.-Z.; Li, B.; Li, M.; Woelfer, M.; Walter, M.; Wang, L. Role of Inflammation in Depression Relapse. J. Neuroinflamm. 2019, 16, 90. [Google Scholar] [CrossRef] [Green Version]
- Attwells, S.; Setiawan, E.; Wilson, A.A.; Rusjan, P.M.; Miler, L.; Xu, C.; Hutton, C.; Husain, M.I.; Kish, S.; Vasdev, N.; et al. Replicating Predictive Serum Correlates of Greater Translocator Protein Distribution Volume in Brain. Neuropsychopharmacology 2020, 45, 925–931. [Google Scholar] [CrossRef]
- Bloemer, J.; Pinky, P.D.; Govindarajulu, M.; Hong, H.; Judd, R.; Amin, R.H.; Moore, T.; Dhanasekaran, M.; Reed, M.N.; Suppiramaniam, V. Role of Adiponectin in Central Nervous System Disorders. Neural. Plast. 2018, 2018, e4593530. [Google Scholar] [CrossRef] [PubMed] [Green Version]
- Carvalho, A.F.; Rocha, D.Q.C.; McIntyre, R.S.; Mesquita, L.M.; Köhler, C.A.; Hyphantis, T.N.; Sales, P.M.G.; Machado-Vieira, R.; Berk, M. Adipokines as Emerging Depression Biomarkers: A Systematic Review and Meta-Analysis. J. Psychiatr. Res. 2014, 59, 28–37. [Google Scholar] [CrossRef]
- Lee, T.H.; Cheng, K.K.; Hoo, R.L.; Siu, P.M.; Yau, S. The Novel Perspectives of Adipokines on Brain Health. Int. J. Mol. Sci. 2019, 20, 5638. [Google Scholar] [CrossRef] [PubMed] [Green Version]
- Rizzo, M.R.; Fasano, R.; Paolisso, G. Adiponectin and Cognitive Decline. Int. J. Mol. Sci. 2020, 21, 2010. [Google Scholar] [CrossRef] [PubMed] [Green Version]
- Song, J.; Choi, S.-M.; Kim, B.C. Adiponectin Regulates the Polarization and Function of Microglia via PPAR-γ Signaling Under Amyloid β Toxicity. Front. Cell Neurosci. 2017, 11, 64. [Google Scholar] [CrossRef] [Green Version]
- Zheng, J.; Sun, Z.; Liang, F.; Xu, W.; Lu, J.; Shi, L.; Shao, A.; Yu, J.; Zhang, J. AdipoRon Attenuates Neuroinflammation After Intracerebral Hemorrhage Through AdipoR1-AMPK Pathway. Neuroscience 2019, 412, 116–130. [Google Scholar] [CrossRef]
- Miao, W.; Jiang, L.; Xu, F.; Lyu, J.; Jiang, X.; He, M.; Liu, Y.; Yang, T.; Leak, R.K.; Stetler, R.A.; et al. Adiponectin Ameliorates Hypoperfusive Cognitive Deficits by Boosting a Neuroprotective Microglial Response. Prog. Neurobiol. 2021, 205, 102125. [Google Scholar] [CrossRef]
- Formolo, D.A.; Lee, T.H.-Y.; Yau, S.-Y. Increasing Adiponergic System Activity as a Potential Treatment for Depressive Disorders. Mol. Neurobiol. 2019, 56, 7966–7976. [Google Scholar] [CrossRef] [Green Version]
- Zhang, D.; Guo, M.; Zhang, W.; Lu, X.-Y. Adiponectin Stimulates Proliferation of Adult Hippocampal Neural Stem/Progenitor Cells through Activation of P38 Mitogen-Activated Protein Kinase (P38MAPK)/Glycogen Synthase Kinase 3β (GSK-3β)/β-Catenin Signaling Cascade. J. Biol. Chem. 2011, 286, 44913–44920. [Google Scholar] [CrossRef] [Green Version]
- Machado-Vieira, R.; Gold, P.W.; Luckenbaugh, D.A.; Ballard, E.D.; Richards, E.M.; Henter, I.D.; De Sousa, R.T.; Niciu, M.J.; Yuan, P.; Zarate, C.A. The Role of Adipokines in the Rapid Antidepressant Effects of Ketamine. Mol. Psychiatry 2017, 22, 127–133. [Google Scholar] [CrossRef] [PubMed] [Green Version]
- American Psychiatric Association. Diagnostic and Statistical Manual of Mental Disorders: DSM-IV, 4th ed.; American Psychiatric Association: Washington, DC, USA, 1994. [Google Scholar]
- First, M.B.; Spitzer, R.L.; Gibbon, M.; Williams, J.B.W. Structured Clinical Interview for DSM-IV Axis I Disorders (SCID-I) Research Version; Biometrics Research: New York, NY, USA, 1996. [Google Scholar]
- American Psychiatric Association. Diagnostic and Statistical Manual of Mental Disorders: DSM-5, 5th ed.; American Psychiatric Association: Washington, DC, USA, 2013. [Google Scholar]
- Nørgaard, M.; Ganz, M.; Svarer, C.; Feng, L.; Ichise, M.; Lanzenberger, R.; Lubberink, M.; Parsey, R.V.; Politis, M.; Rabiner, E.A.; et al. Cerebral Serotonin Transporter Measurements with [11C]DASB: A Review on Acquisition and Preprocessing across 21 PET Centres. J. Cereb. Blood Flow Metab. 2019, 39, 210–222. [Google Scholar] [CrossRef]
- Hamilton, M. A Rating Scale for Depression. J. Neurol. Neurosurg. Psychiatry 1960, 23, 56–62. [Google Scholar] [CrossRef] [PubMed] [Green Version]
- Beck, A.T. Depression: Clinical, Experimental and Theoretical Aspects; Hoeber Medical Division, Harper & Row: New York, NY, USA, 1967. [Google Scholar]
- Rosenberg, M. Society and the Adolescent Self-Image; Princeton University Press: Princeton, NJ, USA, 1965; ISBN 978-1-4008-7613-6. [Google Scholar]
- Barratt, E.S.; Monahan, J.; Steadman, H. Impulsiveness and Aggression. In Violence and Mental Disorder: Developments in Risk Assessment; The University of Chicago Press: Chicago, IL, USA, 1994; Volume 10, pp. 61–79. [Google Scholar]
- Turkheimer, F.E.; Edison, P.; Pavese, N.; Roncaroli, F.; Anderson, A.N.; Hammers, A.; Gerhard, A.; Hinz, R.; Tai, Y.F.; Brooks, D.J. Reference and Target Region Modeling of [11C]-(R)-PK11195 Brain Studies. J. Nucl. Med. 2007, 48, 158–167. [Google Scholar]
- Boellaard, R.; Turkheimer, F.E.; Hinz, R.; Schuitemaker, A.; Scheltens, P.; van Berckel, B.N.M.; Lammertsma, A.A. Performance of a Modified Supervised Cluster Algorithm for Extracting Reference Region Input Functions from (R)-[11C]PK11195 Brain PET Studies. In Proceedings of the 2008 IEEE Nuclear Science Symposium Conference Record, Dresden, Germany, 19–25 October 2008; IEEE: Piscataway, NJ, USA, 2008; pp. 5400–5402. [Google Scholar]
- Yaqub, M.; van Berckel, B.N.; Schuitemaker, A.; Hinz, R.; Turkheimer, F.E.; Tomasi, G.; Lammertsma, A.A.; Boellaard, R. Optimization of Supervised Cluster Analysis for Extracting Reference Tissue Input Curves in (R)-[11C]PK11195 Brain PET Studies. J. Cereb. Blood Flow Metab. 2012, 32, 1600–1608. [Google Scholar] [CrossRef] [PubMed] [Green Version]
- Gunn, R.N.; Lammertsma, A.A.; Hume, S.P.; Cunningham, V.J. Parametric Imaging of Ligand-Receptor Binding in PET Using a Simplified Reference Region Model. NeuroImage 1997, 6, 279–287. [Google Scholar] [CrossRef] [Green Version]
- Yaqub, M.; Tolboom, N.; van Berckel, B.N.M.; Scheltens, P.; Lammertsma, A.A.; Boellaard, R. Simplified Parametric Methods for [18F]FDDNP Studies. NeuroImage 2010, 49, 433–441. [Google Scholar] [CrossRef]
- Lancaster, J.L.; Woldorff, M.G.; Parsons, L.M.; Liotti, M.; Freitas, C.S.; Rainey, L.; Kochunov, P.V.; Nickerson, D.; Mikiten, S.A.; Fox, P.T. Automated Talairach Atlas labels for functional brain mapping. Hum. Brain Mapp. 2000, 10, 120–131. [Google Scholar] [CrossRef]
- Teffer, K.; Semendeferi, K. Human Prefrontal Cortex: Evolution, Development, and Pathology. Prog. Brain Res. 2012, 195, 191–218. [Google Scholar] [CrossRef]
- Tzourio-Mazoyer, N.; Landeau, B.; Papathanassiou, D.; Crivello, F.; Etard, O.; Delcroix, N.; Mazoyer, B.; Joliot, M. Automated Anatomical Labeling of Activations in SPM Using a Macroscopic Anatomical Parcellation of the MNI MRI Single-Subject Brain. NeuroImage 2002, 15, 273–289. [Google Scholar] [CrossRef]
- Martinot, J.-L.; Hardy, P.; Feline, A.; Huret, J.-D.; Mazoyer, B.; Attar-Levy, D.; Pappata, S.; Syrota, A. Left Prefrontal Glucose Hypometabolism in the Depressed State: A Confirmation. Am. J. Psychiatry 1990, 147, 1313–1317. [Google Scholar] [CrossRef] [PubMed]
- Grimm, S.; Beck, J.; Schuepbach, D.; Hell, D.; Boesiger, P.; Bermpohl, F.; Niehaus, L.; Boeker, H.; Northoff, G. Imbalance between Left and Right Dorsolateral Prefrontal Cortex in Major Depression Is Linked to Negative Emotional Judgment: An FMRI Study in Severe Major Depressive Disorder. Biol. Psychiatry 2008, 63, 369–376. [Google Scholar] [CrossRef]
- Veronese, M.; Rizzo, G.; Belzunce, M.; Schubert, J.; Searle, G.; Whittington, A.; Mansur, A.; Dunn, J.; Reader, A.; Gunn, R.N. Reproducibility of Findings in Modern PET Neuroimaging: Insight from the NRM2018 Grand Challenge. J. Cereb. Blood Flow Metab. 2021. [Google Scholar] [CrossRef] [PubMed]
- Gryglewski, G.; Lanzenberger, R.; Kranz, G.S.; Cumming, P. Meta-Analysis of Molecular Imaging of Serotonin Transporters in Major Depression. J. Cereb. Blood Flow Metab. 2014, 34, 1096–1103. [Google Scholar] [CrossRef] [PubMed] [Green Version]
- Kaiser, R.H.; Andrews-Hanna, J.R.; Wager, T.D.; Pizzagalli, D.A. Large-Scale Network Dysfunction in Major Depressive Disorder: A Meta-Analysis of Resting-State Functional Connectivity. JAMA Psychiatry 2015, 72, 603–611. [Google Scholar] [CrossRef]
- Meyer, J.H. Neuroprogression and Immune Activation in Major Depressive Disorder. Mod. Trends Pharmacopsychiatry 2017, 31, 27–36. [Google Scholar] [CrossRef]
- Rolls, E.T. The Cingulate Cortex and Limbic Systems for Emotion, Action, and Memory. Brain Struct. Funct. 2019, 224, 3001–3018. [Google Scholar] [CrossRef] [Green Version]
- Monkul, E.S.; Silva, L.A.P.; Narayana, S.; Peluso, M.A.M.; Zamarripa, F.; Nery, F.G.; Najt, P.; Li, J.; Lancaster, J.L.; Fox, P.T.; et al. Abnormal Resting State Corticolimbic Blood Flow in Depressed Unmedicated Patients with Major Depression: A 15O-H2O PET Study. Hum. Brain Mapp. 2012, 33, 272–279. [Google Scholar] [CrossRef] [Green Version]
- Orth, U.; Robins, R.W.; Meier, L.L.; Conger, R.D. Refining the Vulnerability Model of Low Self-Esteem and Depression: Disentangling the Effects of Genuine Self-Esteem and Narcissism. J. Pers. Soc. Psychol. 2016, 110, 133–149. [Google Scholar] [CrossRef] [Green Version]
- Bhar, S.; Ghahramanlou-Holloway, M.; Brown, G.; Beck, A.T. Self-Esteem and Suicide Ideation in Psychiatric Outpatients. Suicide Life Threat. Behav. 2008, 38, 511–516. [Google Scholar] [CrossRef]
- Perrot, C.; Vera, L.; Gorwood, P. Poor self-esteem is correlated with suicide intent, independently from the severity of depression. L’encephale 2018, 44, 122–127. [Google Scholar] [CrossRef]
- Maes, M.; Berk, M.; Goehler, L.; Song, C.; Anderson, G.; Gałecki, P.; Leonard, B. Depression and Sickness Behavior Are Janus-Faced Responses to Shared Inflammatory Pathways. BMC Med. 2012, 10, 66. [Google Scholar] [CrossRef] [Green Version]
- Dantzer, R. Cytokine, Sickness Behavior, and Depression. Immunol Allergy Clin. N. Am. 2009, 29, 247–264. [Google Scholar] [CrossRef] [Green Version]
- Liu, J.; Guo, M.; Zhang, D.; Cheng, S.-Y.; Liu, M.; Ding, J.; Scherer, P.E.; Liu, F.; Lu, X.-Y. Adiponectin Is Critical in Determining Susceptibility to Depressive Behaviors and Has Antidepressant-like Activity. Proc. Natl. Acad. Sci. USA 2012, 109, 12248–12253. [Google Scholar] [CrossRef] [PubMed] [Green Version]
- Yau, S.Y.; Li, A.; Hoo, R.L.C.; Ching, Y.P.; Christie, B.R.; Lee, T.M.C.; Xu, A.; So, K.-F. Physical Exercise-Induced Hippocampal Neurogenesis and Antidepressant Effects Are Mediated by the Adipocyte Hormone Adiponectin. Proc. Natl. Acad. Sci. USA 2014, 111, 15810–15815. [Google Scholar] [CrossRef] [Green Version]
- Zhang, D.; Wang, X.; Lu, X.-Y. Adiponectin Exerts Neurotrophic Effects on Dendritic Arborization, Spinogenesis, and Neurogenesis of the Dentate Gyrus of Male Mice. Endocrinology 2016, 157, 2853–2869. [Google Scholar] [CrossRef] [Green Version]
- Sachan, A.; Singh, A.; Shukla, S.; Aggarwal, S.; Mir, I.; Yadav, R. Serum Adipocytokines Levels and Their Association with Insulin Sensitivity in Morbidly Obese Individuals Undergoing Bariatric Surgery. J. Obes. Metab. Syndr. 2020, 29, 303–312. [Google Scholar] [CrossRef]
- Bromander, S.; Anckarsäter, R.; Kristiansson, M.; Blennow, K.; Zetterberg, H.; Anckarsäter, H.; Wass, C.E. Changes in Serum and Cerebrospinal Fluid Cytokines in Response to Non-Neurological Surgery: An Observational Study. J. Neuroinflamm. 2012, 9, 242. [Google Scholar] [CrossRef] [Green Version]
- Yuan, Y.; Wu, C.; Ling, E.-A. Heterogeneity of Microglia Phenotypes: Developmental, Functional and Some Therapeutic Considerations. Curr. Pharm. Des. 2019, 25, 2375–2393. [Google Scholar] [CrossRef] [PubMed]
- Da Pozzo, E.; Tremolanti, C.; Costa, B.; Giacomelli, C.; Milenkovic, V.M.; Bader, S.; Wetzel, C.H.; Rupprecht, R.; Taliani, S.; Da Settimo, F.; et al. Microglial Pro-Inflammatory and Anti-Inflammatory Phenotypes Are Modulated by Translocator Protein Activation. Int. J. Mol. Sci. 2019, 20, 4467. [Google Scholar] [CrossRef] [PubMed] [Green Version]
- Saijo, K.; Glass, C.K. Microglial Cell Origin and Phenotypes in Health and Disease. Nat. Rev. Immunol 2011, 11, 775–787. [Google Scholar] [CrossRef]
- Betlazar, C.; Harrison-Brown, M.; Middleton, R.J.; Banati, R.; Liu, G.-J. Cellular Sources and Regional Variations in the Expression of the Neuroinflammatory Marker Translocator Protein (TSPO) in the Normal Brain. Int. J. Mol. Sci. 2018, 19, 2707. [Google Scholar] [CrossRef] [PubMed] [Green Version]
- Tournier, B.B.; Tsartsalis, S.; Ceyzériat, K.; Medina, Z.; Fraser, B.H.; Grégoire, M.-C.; Kövari, E.; Millet, P. Fluorescence-Activated Cell Sorting to Reveal the Cell Origin of Radioligand Binding. J. Cereb. Blood Flow Metab. 2020, 40, 1242–1255. [Google Scholar] [CrossRef] [PubMed]
- Nutma, E.; Ceyzériat, K.; Amor, S.; Tsartsalis, S.; Millet, P.; Owen, D.R.; Papadopoulos, V.; Tournier, B.B. Cellular Sources of TSPO Expression in Healthy and Diseased Brain. Eur. J. Nucl. Med. Mol. Imaging 2021. [Google Scholar] [CrossRef] [PubMed]
- Cumming, P.; Pedersen, M.D.; Minuzzi, L.; Mezzomo, K.; Danielsen, E.H.; Iversen, P.; Aagaard, D.; Keiding, S.; Munk, O.L.; Finsen, B. Distribution of PK11195 binding sites in porcine brain studied by autoradiography in vitro and by positron emission tomography. Synapse 2006, 59, 418–426. [Google Scholar] [CrossRef]
- Duggan, M.R.; Parikh, V. Microglia and Modifiable Life Factors: Potential Contributions to Cognitive Resilience in Aging. Behav. Brain Res. 2021, 405, 113207. [Google Scholar] [CrossRef]
- Marques, C.G.; dos Santos Quaresma, M.V.L.; Nakamoto, F.P.; Magalhães, A.C.O.; Lucin, G.A.; Thomatieli-Santos, R.V. Does Modern Lifestyle Favor Neuroimmunometabolic Changes? A Path to Obesity. Front. Nutr. 2021, 8, 686. [Google Scholar] [CrossRef]


| Variables | MDD (n = 30) | Controls (n = 23) | t-Value | p-Value |
|---|---|---|---|---|
| Age (year) | 24.6 ± 4.2 | 24.5 ± 3.2 | 0.074 | 0.941 |
| Gender (male/female) | 13/17 | 13/10 | 0.906 (2) | 0.341 |
| Duration of current episode (months) | 1.7 ± 1.0 | - | - | - |
| HAMD-17 | 24.3 ± 6.7 | - | - | - |
| BDI | 27.2 ± 9.0 | 1.5 ± 1.7 | 15.292 | <0.0001 |
| RSES | 19.5 ± 5.4 | 34.0 ± 3.6 | −11.053 | <0.0001 |
| BIS | 72.2 ± 10.5 | 58.1 ± 9.4 | 5.066 | <0.0001 |
| BMI | 23.6 ± 4.1 | 23.6 ± 3.3 | −0.002 | 0.998 |
| Adiponectin (ng/mL) | 6668 ± 3451 | 8024 ± 3597 | −1.314 | 0.196 |
| Injected dose (MBq) | 631.5 ± 60.9 | 651.6 ± 52.5 | −1.264 | 0.212 |
| Specific activity (GBq/umol) | 43 ± 12 | 44 ± 16 | −0.299 | 0.767 |
| ROIs | [11C]PK11195 BPND Value | t-Value | p-Value | Effect Size (Cohen’s d) | |
|---|---|---|---|---|---|
| MDD Group Mean (SD) | Control Group Mean (SD) | ||||
| Lt. PFC | 0.245 (0.103) | 0.194 (0.104) | 1.783 | 0.080 † | 0.494 |
| Rt. PFC | 0.234 (0.099) | 0.192 (0.105) | 1.491 | 0.142 | 0.413 |
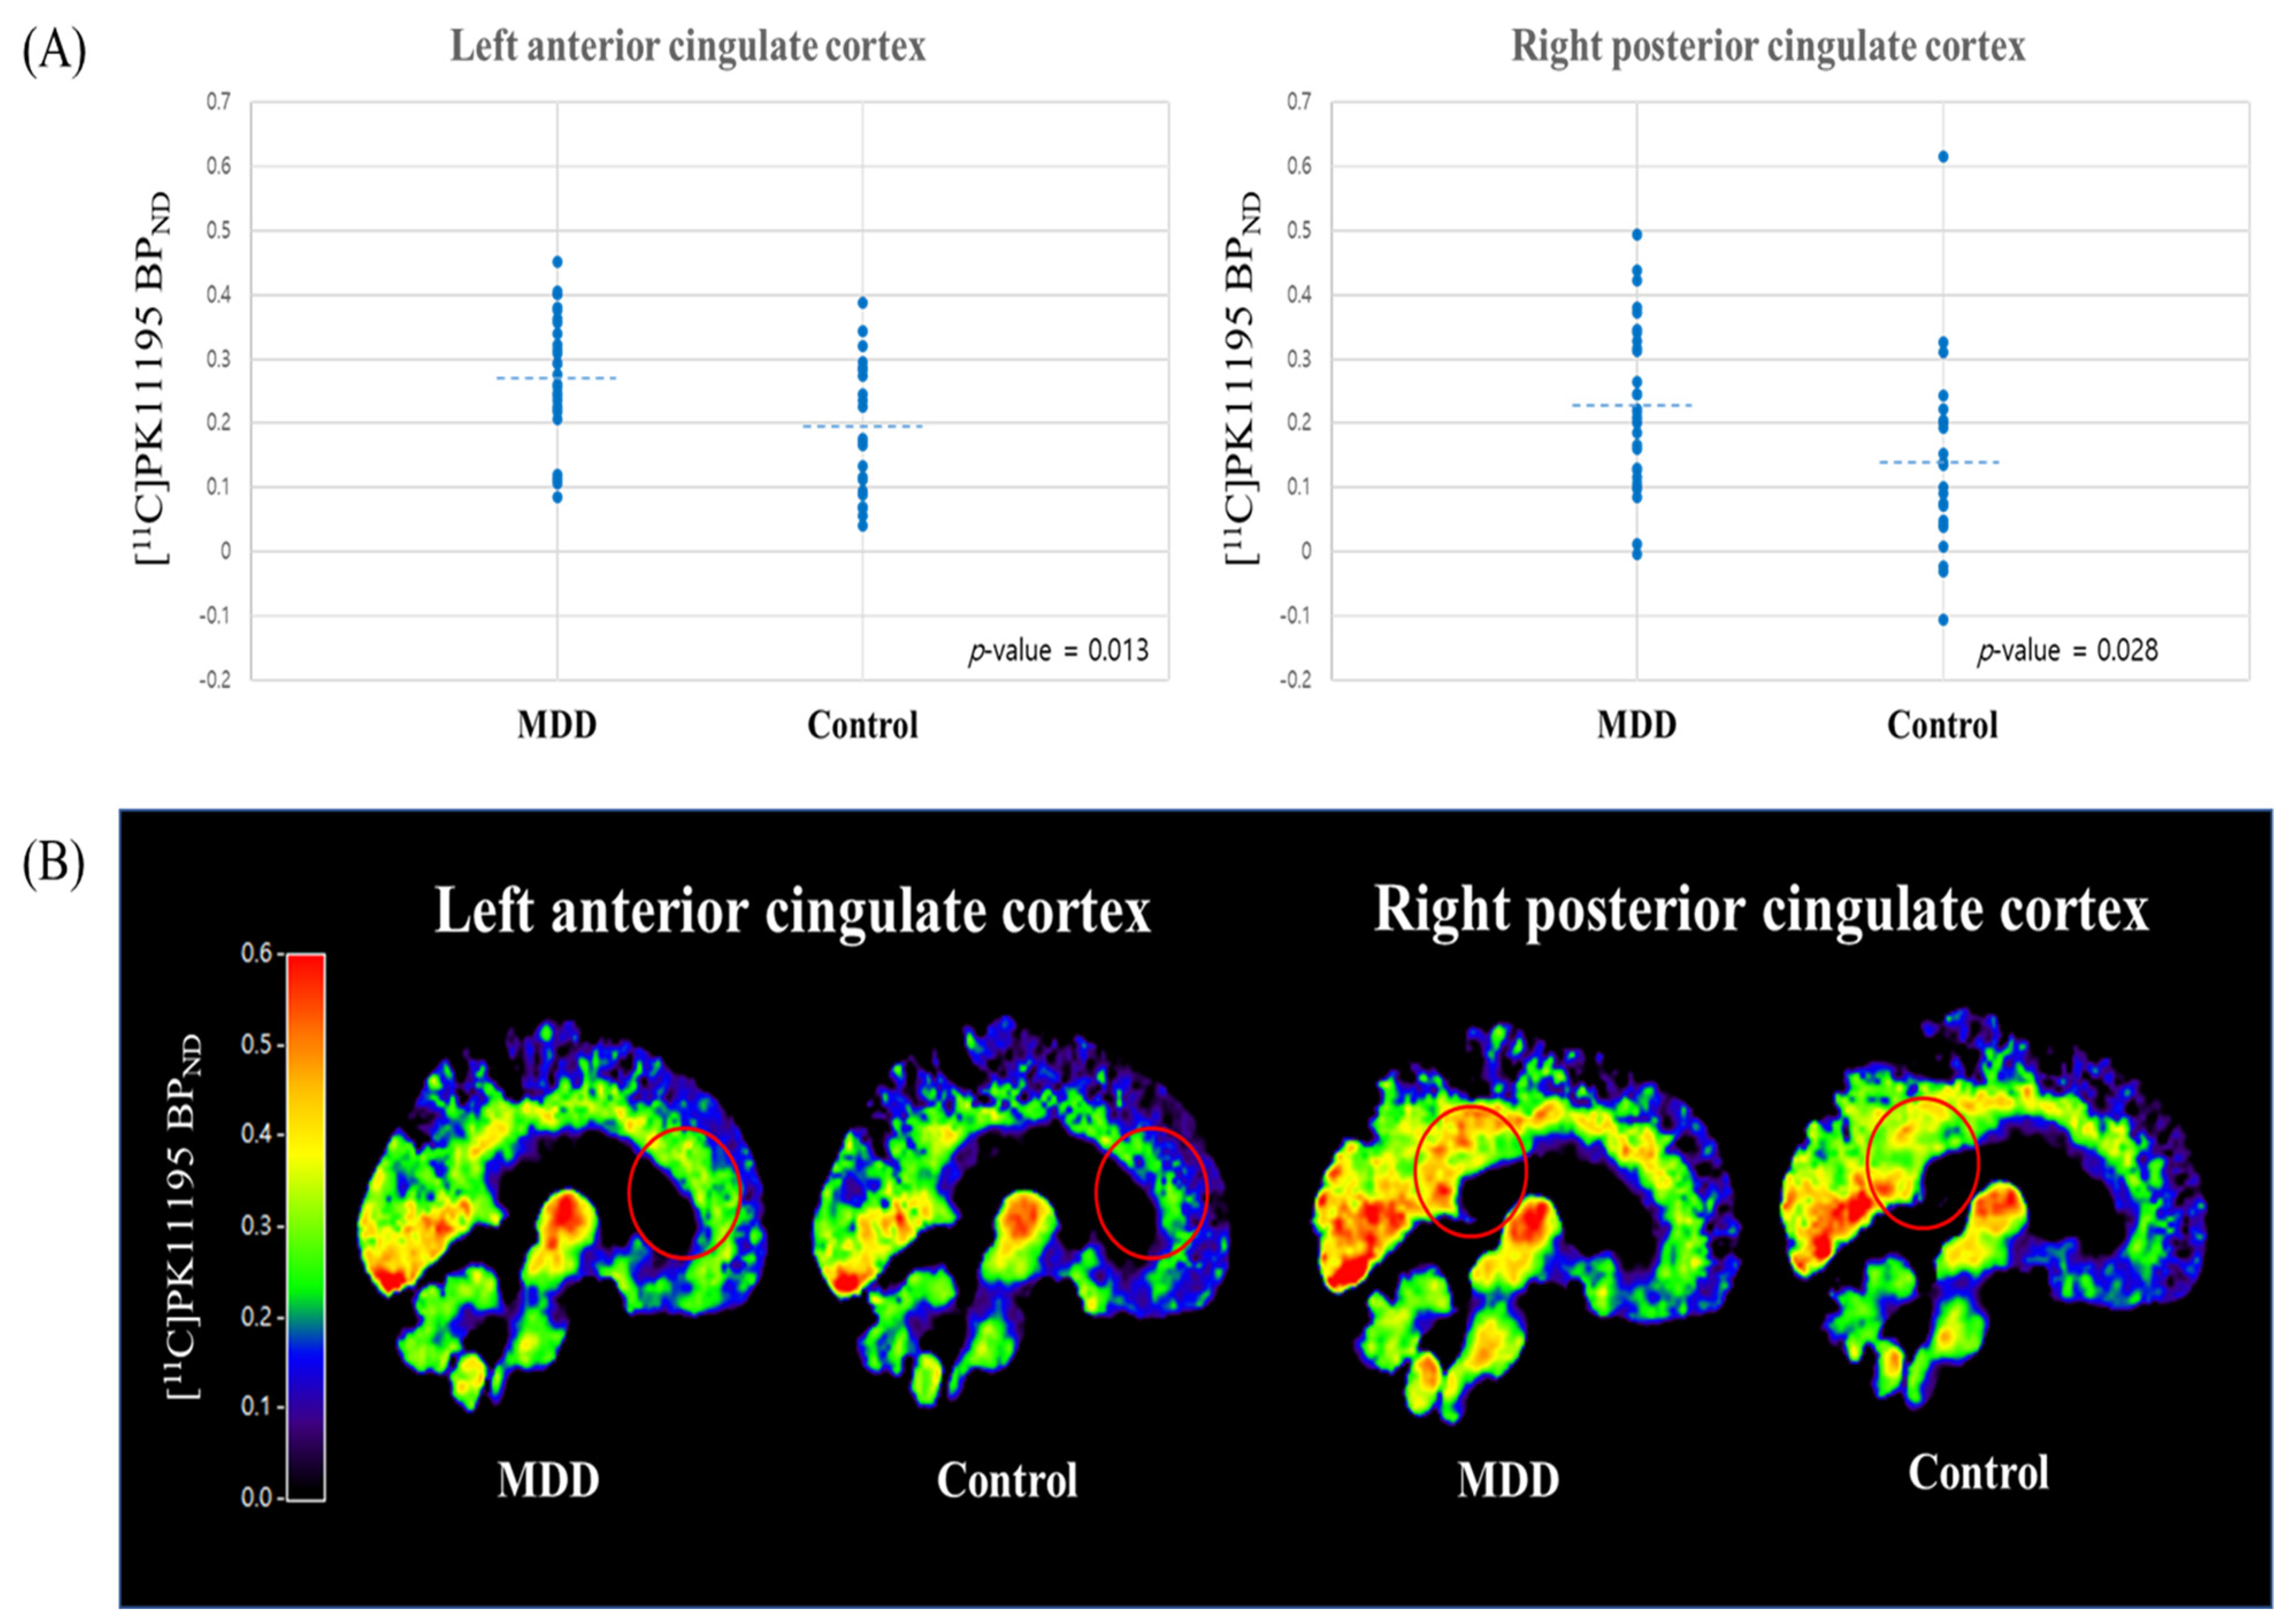
| Lt. ACC | 0.268 (0.103) | 0.195 (0.104) | 2.572 | 0.013 * | 0.713 |
| Rt. ACC | 0.157 (0.090) | 0.115 (0.103) | 1.577 | 0.121 | 0.437 |
| Lt. PCC | 0.251 (0.122) | 0.200 (0.130) | 1.467 | 0.149 | 0.407 |
| Rt. PCC | 0.228 (0.126) | 0.142 (0.150) | 2.269 | 0.028 * | 0.629 |
| Lt. insula | 0.272 (0.114) | 0.232 (0.122) | 1.240 | 0.221 | 0.344 |
| Rt. insula | 0.338 (0.125) | 0.294 (0.137) | 1.221 | 0.228 | 0.338 |
| Lt. hippocampus | 0.165 (0.088) | 0.134 (0.092) | 1.222 | 0.227 | 0.339 |
| Rt. hippocampus | 0.129 (0.086) | 0.099 (0.078) | 1.347 | 0.184 | 0.373 |
| Lt. temporal cortex | 0.159 (0.097) | 0.124 (0.088) | 1.388 | 0.171 | 0.385 |
| Rt. temporal cortex | 0.170 (0.090) | 0.133 (0.082) | 1.540 | 0.130 | 0.427 |
| ROIs | RSES | BIS | ||
|---|---|---|---|---|
| r-Value | p-Value | r-Value | p-Value | |
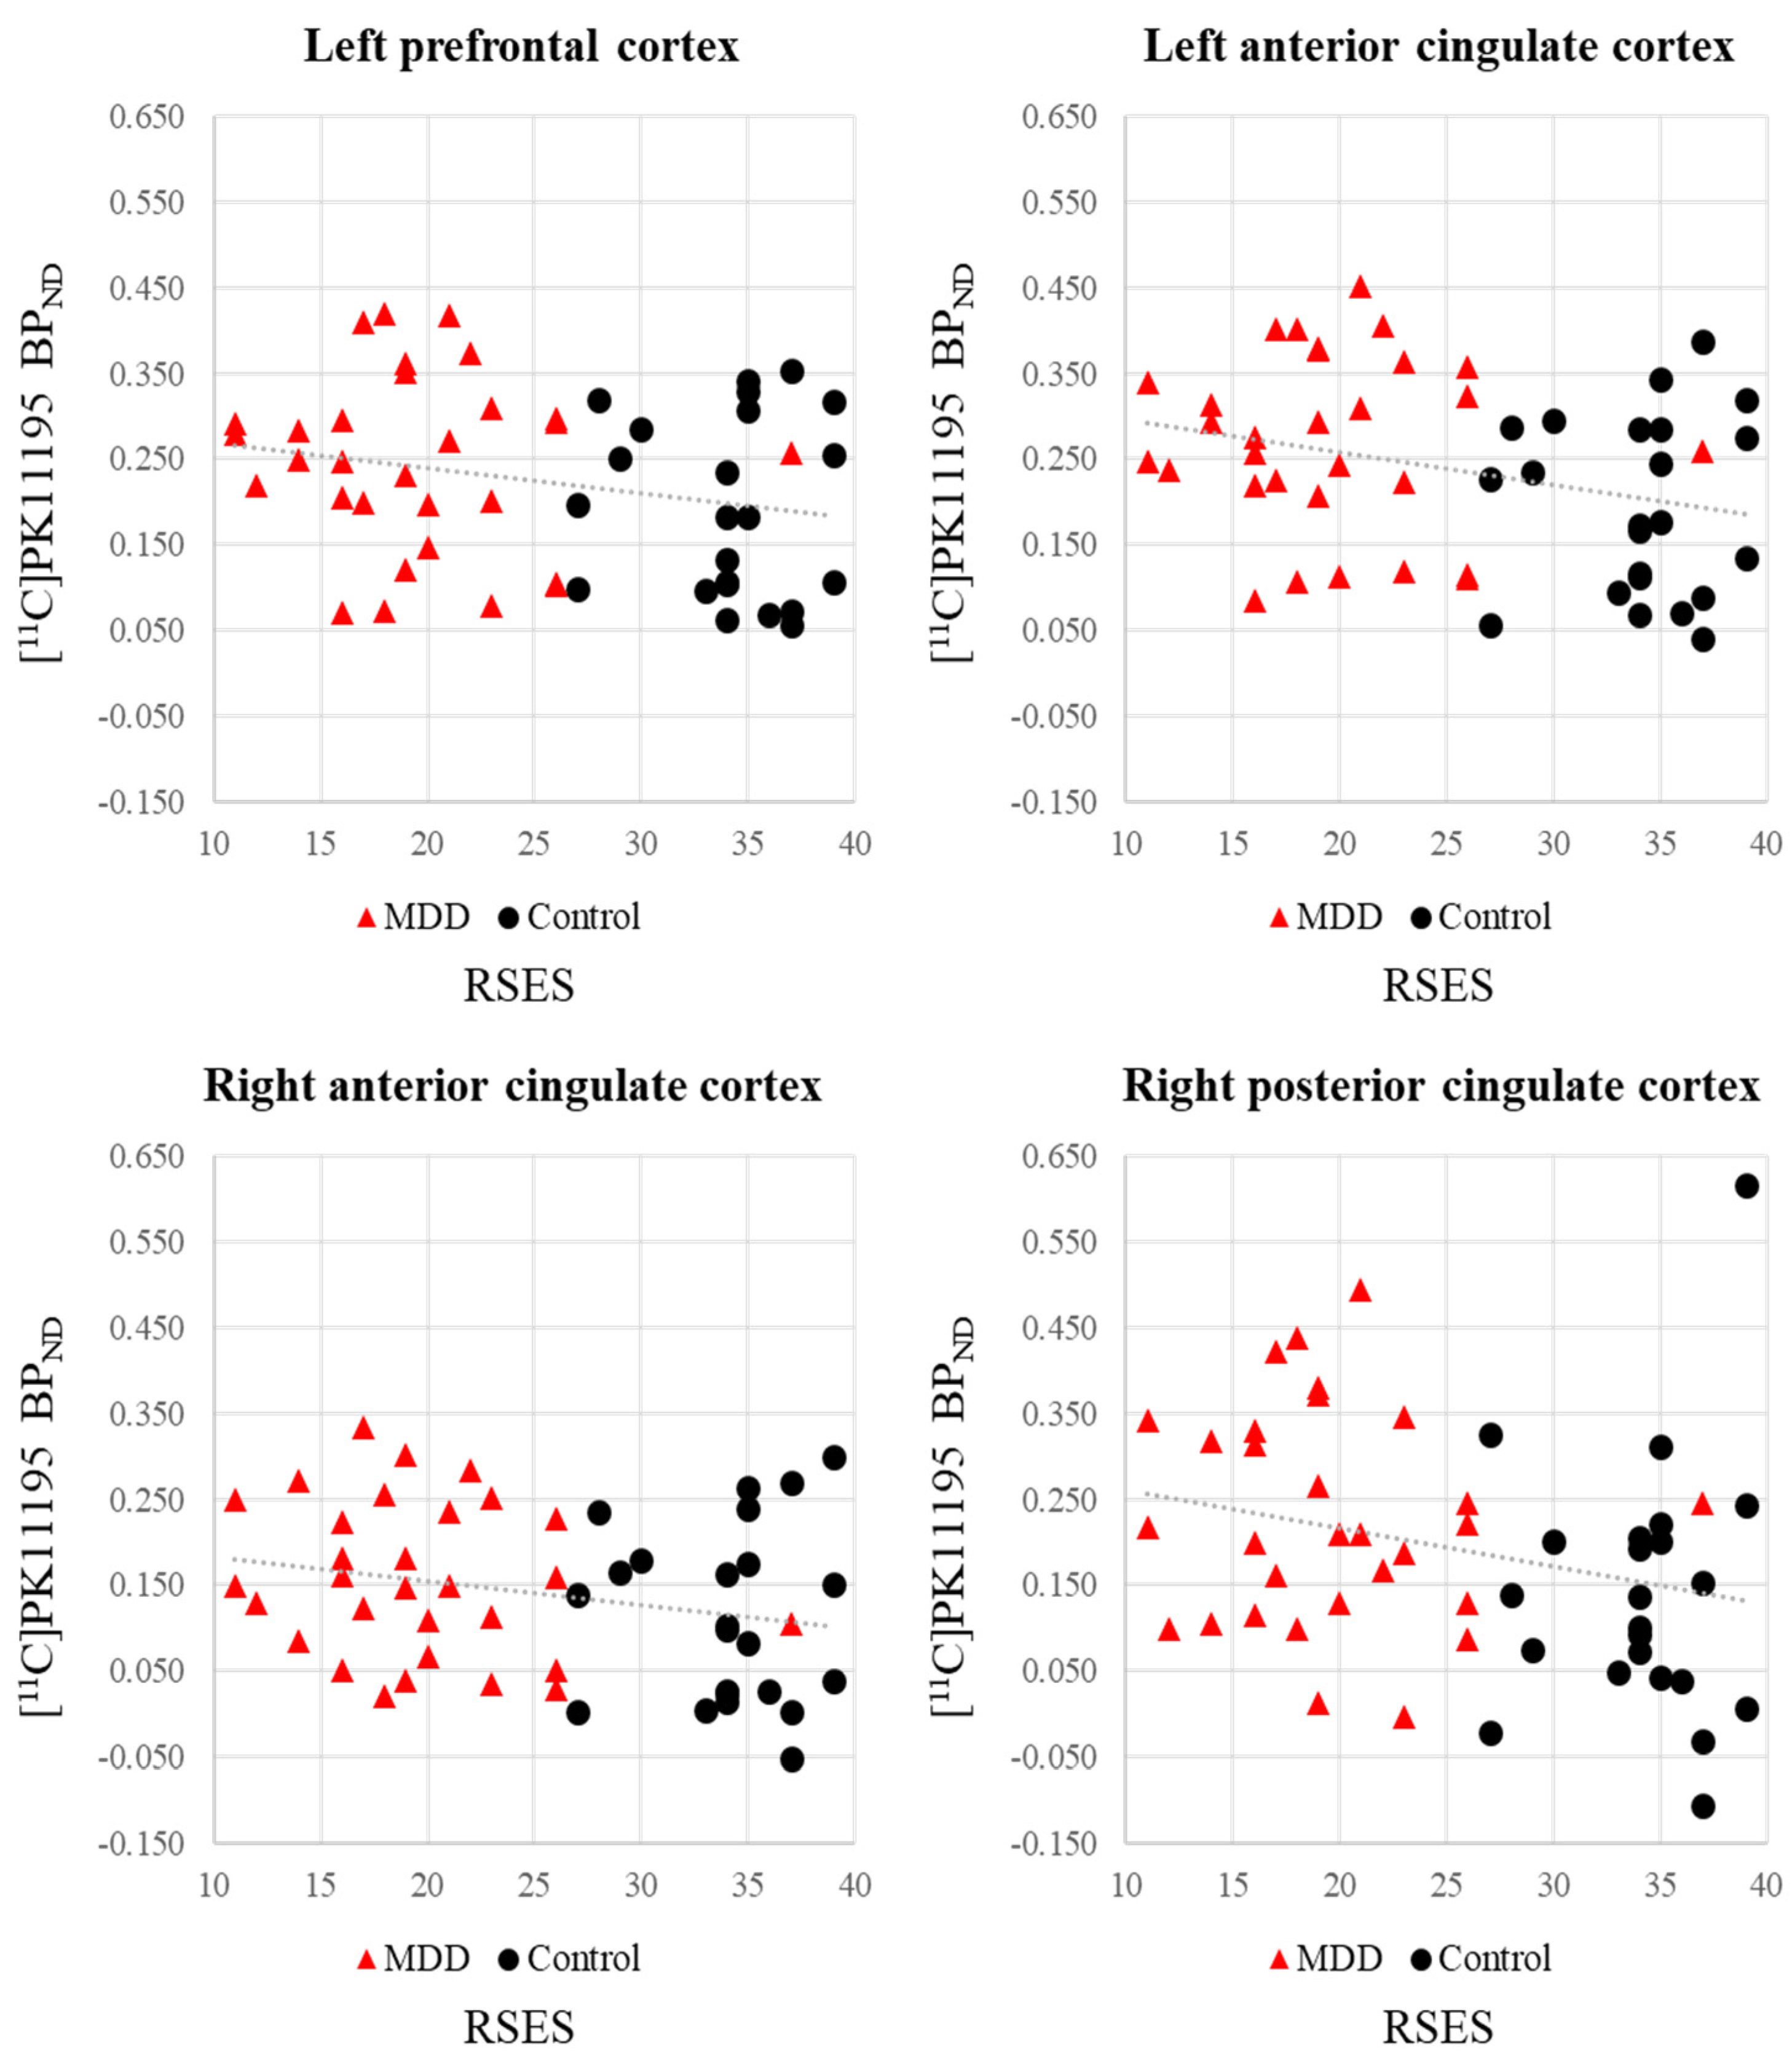
| Lt. prefrontal cortex | −0.242 | 0.081 † | 0.114 | 0.416 |
| Rt. prefrontal cortex | −0.220 | 0.114 | 0.098 | 0.484 |
| Lt. anterior cingulate cortex | −0.301 | 0.029 * | 0.165 | 0.238 |
| Rt. anterior cingulate cortex | −0.248 | 0.074 † | 0.159 | 0.255 |
| Lt. posterior cingulate cortex | −0.203 | 0.144 | 0.163 | 0.244 |
| Rt. posterior cingulate cortex | −0.269 | 0.052 † | 0.198 | 0.155 |
| Lt. insula | −0.220 | 0.113 | 0.144 | 0.303 |
| Rt. Insula | −0.206 | 0.139 | 0.105 | 0.455 |
| Lt. hippocampus | −0.149 | 0.285 | 0.099 | 0.479 |
| Rt. hippocampus | −0.126 | 0.370 | 0.175 | 0.211 |
| Lt. temporal cortex | −0.217 | 0.119 | 0.111 | 0.429 |
| Rt. temporal cortex | −0.212 | 0.127 | 0.106 | 0.448 |
| ROIs | MDD Group (n = 26) | Control Group (n = 21) | z-Value | p-Value |
|---|---|---|---|---|
| r-Value (p-Value) | r-Value (p-Value) | |||
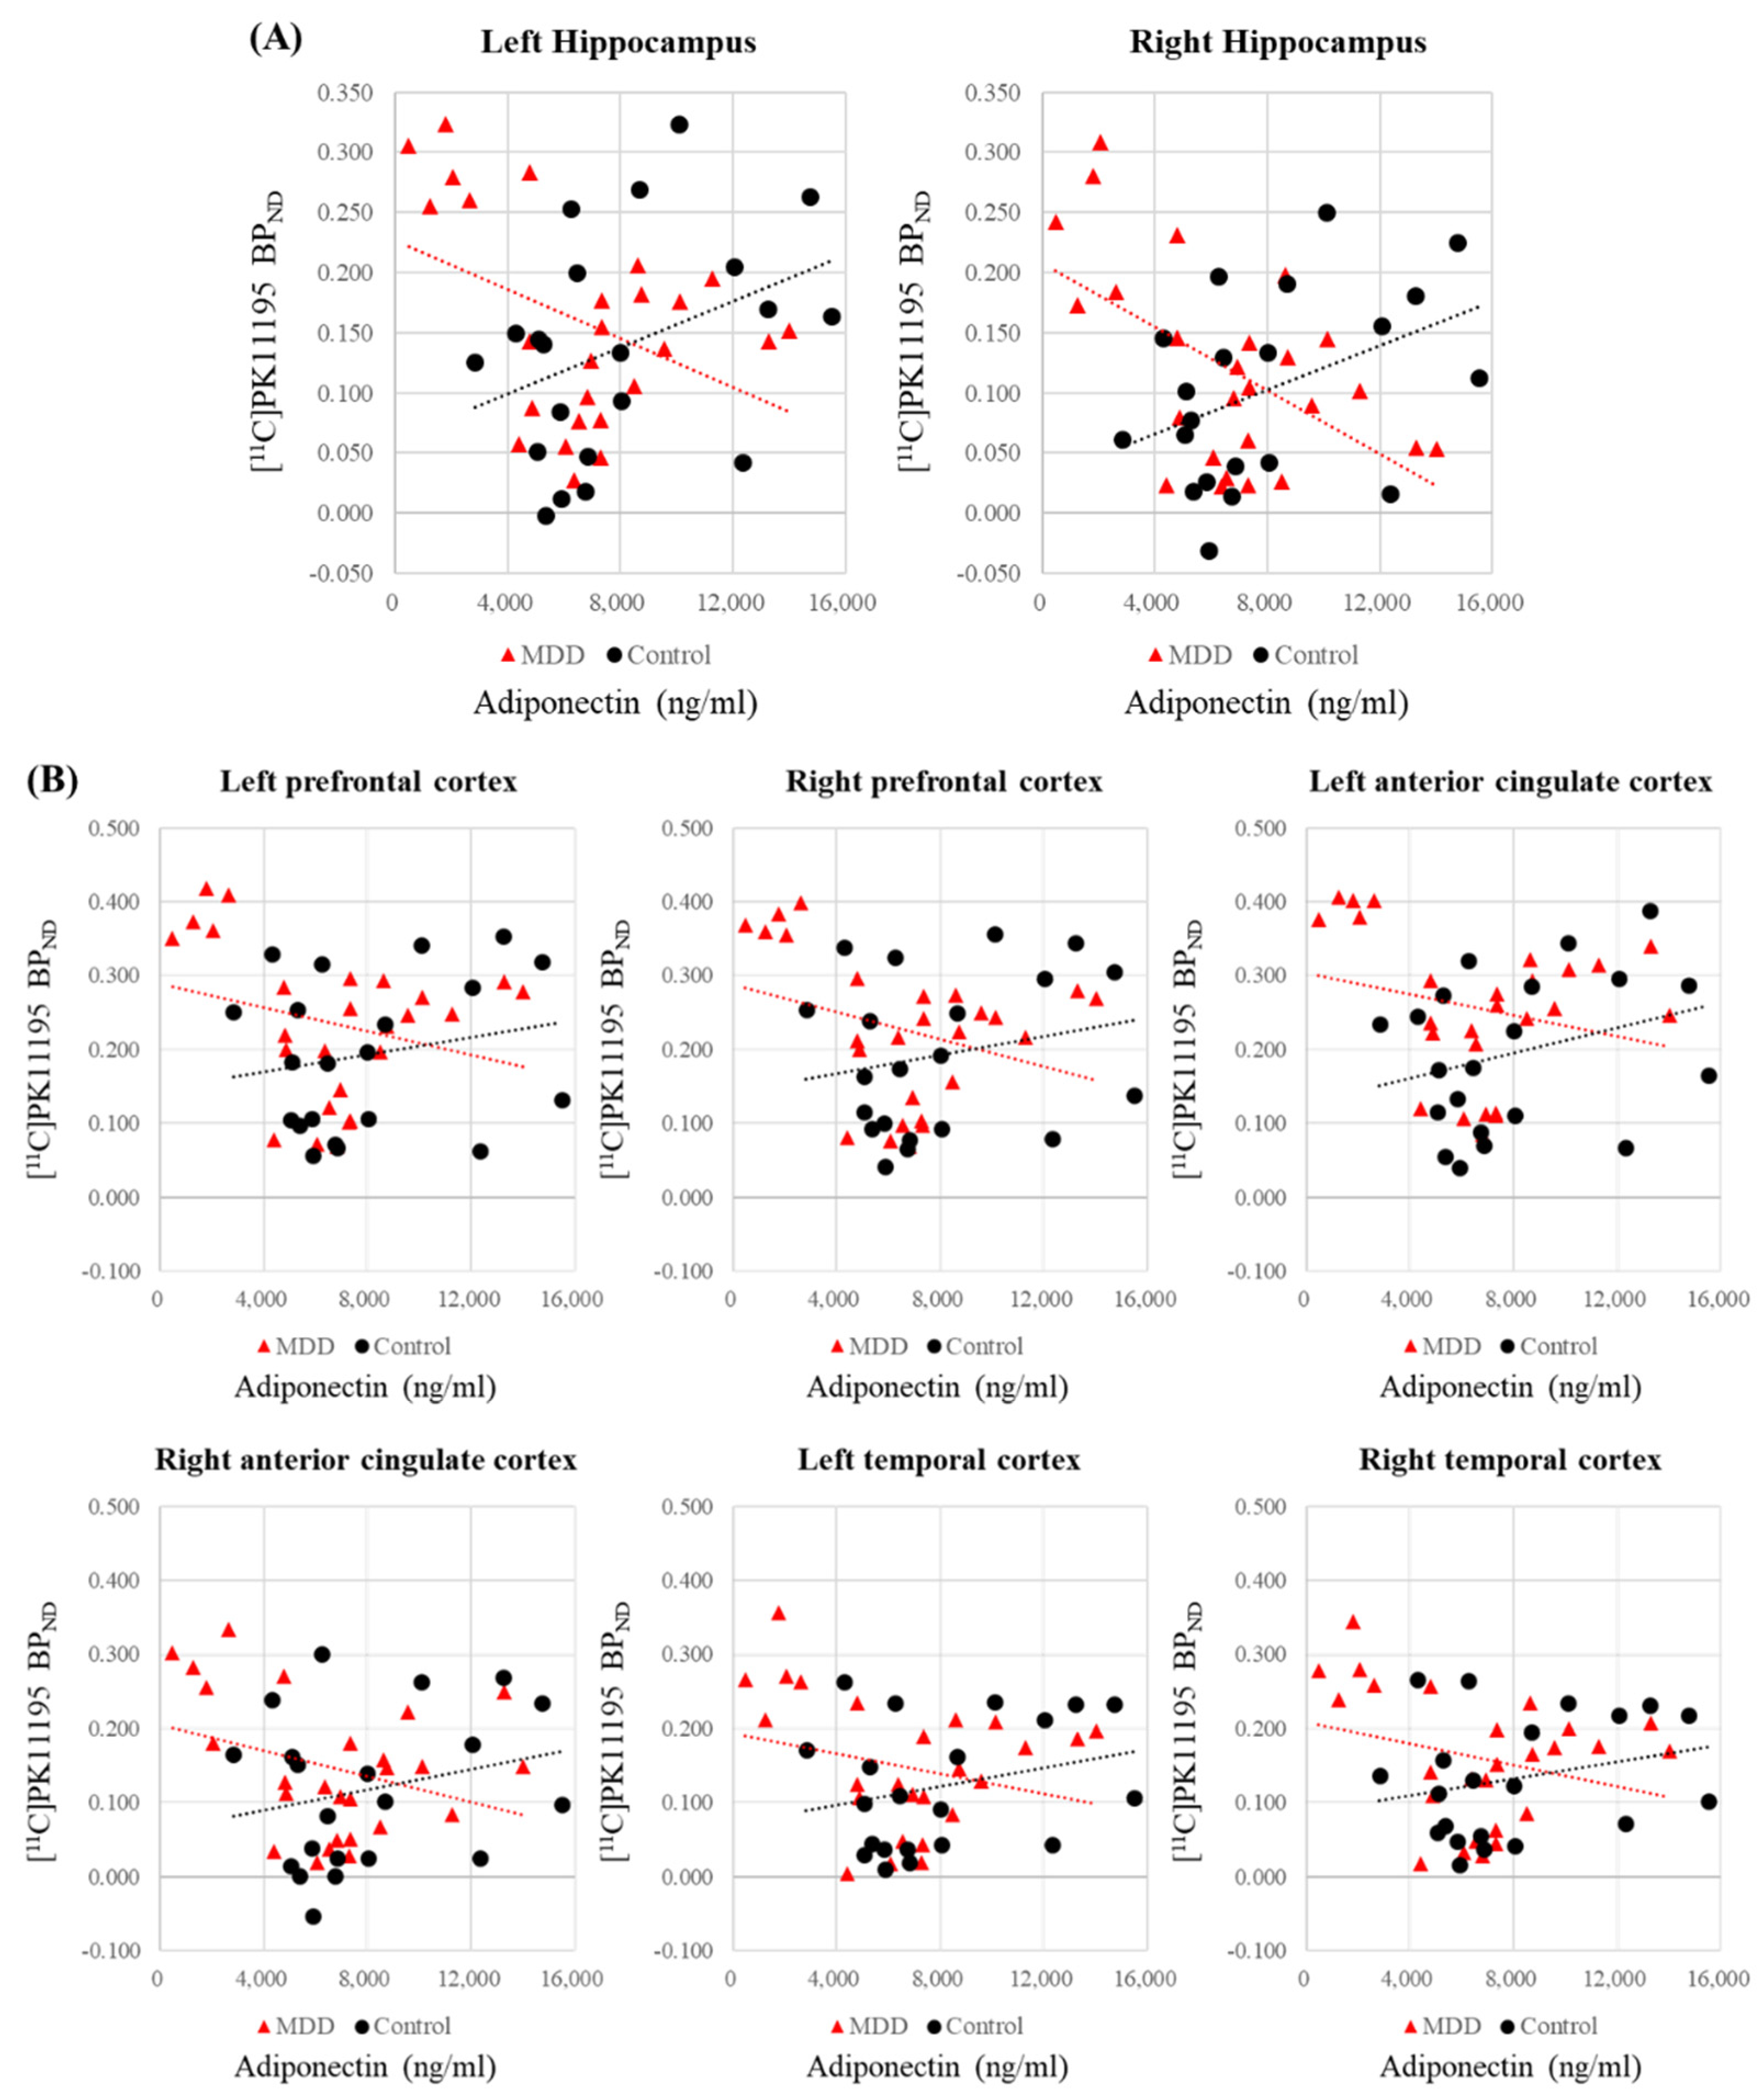
| Lt. prefrontal cortex | −0.328 (0.109) | 0.319 (0.170) | −2.134 | 0.033 * |
| Rt. prefrontal cortex | −0.372 (0.067) | 0.330 (0.156) | −2.330 | 0.020 * |
| Lt. anterior cingulate cortex | −0.294 (0.154) | 0.403 (0.078) | −2.320 | 0.020 * |
| Rt. anterior cingulate cortex | −0.368 (0.070) | 0.348 (0.133) | −2.381 | 0.017 * |
| Lt. posterior cingulate cortex | −0.184 (0.378) | 0.136 (0.568) | −1.026 | 0.305 |
| Rt. posterior cingulate cortex | −0.152 (0.468) | 0.111 (0.643) | −0.839 | 0.401 |
| Lt. insula | −0.240 (0.247) | 0.195 (0.409) | −1.408 | 0.159 |
| Rt. Insula | −0.297 (0.149) | 0.278 (0.236) | −1.879 | 0.060 |
| Lt. hippocampus | −0.433 (0.030) * | 0.520 (0.019) * | −3.305 | 0.001 ** |
| Rt. hippocampus | −0.564 (0.003) ** | 0.594 (0.006) ** | −4.200 | <0.001 ** |
| Lt. temporal cortex | −0.298 (0.148) | 0.382 (0.096) | −2.256 | 0.024 * |
| Rt. temporal cortex | −0.337 (0.100) | 0.380 (0.099) | −2.384 | 0.017 * |
Publisher’s Note: MDPI stays neutral with regard to jurisdictional claims in published maps and institutional affiliations. |
© 2021 by the authors. Licensee MDPI, Basel, Switzerland. This article is an open access article distributed under the terms and conditions of the Creative Commons Attribution (CC BY) license (https://creativecommons.org/licenses/by/4.0/).
Share and Cite
Joo, Y.-H.; Lee, M.-W.; Son, Y.-D.; Chang, K.-A.; Yaqub, M.; Kim, H.-K.; Cumming, P.; Kim, J.-H. In Vivo Cerebral Translocator Protein (TSPO) Binding and Its Relationship with Blood Adiponectin Levels in Treatment-Naïve Young Adults with Major Depression: A [11C]PK11195 PET Study. Biomedicines 2022, 10, 34. https://0-doi-org.brum.beds.ac.uk/10.3390/biomedicines10010034
Joo Y-H, Lee M-W, Son Y-D, Chang K-A, Yaqub M, Kim H-K, Cumming P, Kim J-H. In Vivo Cerebral Translocator Protein (TSPO) Binding and Its Relationship with Blood Adiponectin Levels in Treatment-Naïve Young Adults with Major Depression: A [11C]PK11195 PET Study. Biomedicines. 2022; 10(1):34. https://0-doi-org.brum.beds.ac.uk/10.3390/biomedicines10010034
Chicago/Turabian StyleJoo, Yo-Han, Min-Woo Lee, Young-Don Son, Keun-A Chang, Maqsood Yaqub, Hang-Keun Kim, Paul Cumming, and Jong-Hoon Kim. 2022. "In Vivo Cerebral Translocator Protein (TSPO) Binding and Its Relationship with Blood Adiponectin Levels in Treatment-Naïve Young Adults with Major Depression: A [11C]PK11195 PET Study" Biomedicines 10, no. 1: 34. https://0-doi-org.brum.beds.ac.uk/10.3390/biomedicines10010034