
Radionuclide Imaging of Cytotoxic Immune Cell Responses to Anti-Cancer Immunotherapy


1
Molecular Imaging Center Antwerp (MICA), Integrated Personalized and Precision Oncology Network (IPPON), Faculty of Medicine and Health Sciences, University of Antwerp, Universiteitsplein 1, B-2610 Wilrijk, Belgium
2
Center for Oncological Research (CORE), Integrated Personalized and Precision Oncology Network (IPPON), Faculty of Medicine and Health Sciences, University of Antwerp, Universiteitsplein 1, B-2610 Wilrijk, Belgium
3
Center for Cell Therapy and Regenerative Medicine, Antwerp University Hospital, Drie Eikenstraat 655, B-2650 Edegem, Belgium
4
Nuclear Medicine, Antwerp University Hospital, Drie Eikenstraat 655, B-2650 Edegem, Belgium
*
Author to whom correspondence should be addressed.
Biomedicines 2022, 10(5), 1074; https://0-doi-org.brum.beds.ac.uk/10.3390/biomedicines10051074
Submission received: 4 March 2022
/
Revised: 24 April 2022
/
Accepted: 30 April 2022
/
Published: 5 May 2022
(This article belongs to the Special Issue Oncoimmunity and Immunotherapy in Solid Tumors)
Abstract
:Cancer immunotherapy is an evolving and promising cancer treatment that takes advantage of the body’s immune system to yield effective tumor elimination. Importantly, immunotherapy has changed the treatment landscape for many cancers, resulting in remarkable tumor responses and improvements in patient survival. However, despite impressive tumor effects and extended patient survival, only a small proportion of patients respond, and others can develop immune-related adverse events associated with these therapies, which are associated with considerable costs. Therefore, strategies to increase the proportion of patients gaining a benefit from these treatments and/or increasing the durability of immune-mediated tumor response are still urgently needed. Currently, measurement of blood or tissue biomarkers has demonstrated sampling limitations, due to intrinsic tumor heterogeneity and the latter being invasive. In addition, the unique response patterns of these therapies are not adequately captured by conventional imaging modalities. Consequently, non-invasive, sensitive, and quantitative molecular imaging techniques, such as positron emission tomography (PET) and single-photon emission computed tomography (SPECT) using specific radiotracers, have been increasingly used for longitudinal whole-body monitoring of immune responses. Immunotherapies rely on the effector function of CD8+ T cells and natural killer cells (NK) at tumor lesions; therefore, the monitoring of these cytotoxic immune cells is of value for therapy response assessment. Different immune cell targets have been investigated as surrogate markers of response to immunotherapy, which motivated the development of multiple imaging agents. In this review, the targets and radiotracers being investigated for monitoring the functional status of immune effector cells are summarized, and their use for imaging of immune-related responses are reviewed along their limitations and pitfalls, of which multiple have already been translated to the clinic. Finally, emerging effector immune cell imaging strategies and future directions are provided.
1. Introduction
In recent years, a shift has been made from traditional chemotherapy and radiotherapy to targeted treatments and immunotherapy for cancer treatment, including the clinical use of immune checkpoint inhibitors (ICI), adoptive cell therapy and cancer vaccines with over 3000 ongoing clinical trials [1,2,3,4]. Cancer immunotherapies generally work by promoting cancer cell death through enhancing cytotoxic immune cell infiltration and function, and by reprogramming myeloid cells toward an anti-tumor phenotype [5,6]. Despite the impressive responses seen in patients with rapidly fatal cancers, only a fraction of patients shows a durable response to immunotherapy and a significant number of patients develop severe adverse events [1,7]. Furthermore, immunotherapy is expensive, leaving fewer resources available for other purposes [8]. Possible reasons for the lack of response in some patients are complex interactions in the tumor microenvironment (TME), physical barriers that prevent lymphocyte infiltration, feedback loops and checkpoints in the immune response, and the heterogeneity and adaptability of tumors [9]. Therefore, it would be of value for physicians to quickly identify responders from non-responders to optimize patient treatment, minimize severe adverse events, and reduce inefficient usage of healthcare resources.
The effect of immunotherapy relies on enhancing the immune response of cytotoxic immune cells to cancer as described by the cancer-immunity cycle [10,11]. After internalizing an antigen at the tumor site, antigen presenting cells (APCs) migrate to secondary lymphoid organs (SLOs), where they present the antigen to T cells. This process is followed by T cell antigen recognition, activation, and subsequent population expansion, whereafter the activated T cells depart from the SLOs and home towards the tumor. This T cell activation and population expansion is characterized by a metabolic switch, with increased glucose uptake and an increased usage of deoxyribonucleoside salvage pathways. The final step before T cells execute their cytotoxic effector function is to infiltrate the TME. In the case of an effective anti-cancer immune response, the resulting tumor cell death and inflammation due to T cell cytotoxic activity leads to new waves of effector cells [6].
Most often, the eligibility of patients to receive immunotherapy is determined using tumor biopsies to characterize the TME in an attempt to predict response. However, biopsies are not always representative of the heterogeneity and dynamic change in the TME [12,13]. In addition, taking biopsies is an invasive procedure, which is generally undesired [12,13]. As an alternative, liquid biopsies are proposed as a powerful tool to distinguish between subpopulations of cancer cells. A disadvantage of this technique is that liquid biopsies are not suitable for disease staging, due to a lack of spatial information and detail on tumor heterogeneity [12,14]. After therapy is initiated, evaluation of tumor response is conventionally performed in clinical practice using the RECIST criteria based on changes in tumor dimensions, as measured by computed tomography (CT) or magnetic resonance imaging (MRI) [15,16]. However, with immunotherapies, these anatomic imaging techniques cannot differentiate between tumor progression and pseudo-progression, a state where tumor volume increases due to inflammation and infiltration of immune cells, followed by an eventual decrease in total tumor burden [17,18]. Even though modifications to the RECIST system have been developed to overcome some of these limitations (e.g., iRECIST), morphological tumor changes are only visible after multiple weeks, which is unfavourable for patients, due to disease progression and adverse therapy effects [19]. Therefore, clinicians need other tools to predict and evaluate treatment responses more accurately.
Molecular imaging with positron emission tomography (PET) or single-photon emission computed tomography (SPECT) are non-invasive techniques that can monitor cellular processes after injection of tracer amounts of radiolabelled molecules (also known as radiopharmaceuticals) [20]. Molecular imaging can be used to visualize the homing and accumulation of cytotoxic cells at tumor sites using tracers specific for certain targets, such as CD8, which can give an indication of tumor infiltration [21]. Different methodologies have been explored to radiolabel immune cells, each with their own benefits and drawbacks [22]. Immune cells can either be labelled with imaging probes before administration, modified with a reporter gene ex vivo, or visualized directly in vivo with target-specific probes [22]. However, challenges remain in measuring response to therapy because the TME is immunosuppressive and downregulates the activity of infiltrated cytotoxic immune cells in different ways [23]. Whereas activated immune cells show increased expression of various targets (e.g., NKp30 on natural killer cells [NK]), exhausted immune cells (i.e., cytotoxic immune cells with an impaired effector function) stop expressing specific markers (e.g., granzyme B) [24,25]. Quantification of expression of activation markers could therefore provide unique insights in the treatment response to immunotherapy compared to quantifying the accumulation of lymphocytes. Moreover, ICI treatment response can be predicted by measuring the co-expression of inhibitory receptors, such as LAG3 and PD-1, both cell exhaustion markers, on tumor infiltrating lymphocytes (TILs) [26,27]. Therefore, evaluating the functional state of cytotoxic cells by imaging activation or exhaustion markers may provide information on response to immunotherapy at an earlier stage than morphological methods, benefiting patient management [19,28,29].
In the first part of this paper, an overview is provided of the different radiotracers used to image total immune infiltrates. The main part of this review discusses recent advances made in evaluating the functional state of effector immune cells in the TME using PET and SPECT imaging to predict or determine response to immunotherapy.
2. Imaging of Total Immune Infiltrates
The core concept of adoptive cell therapies, such as CAR T cells and CAR NK cells, is to insert a chimeric antigen receptor (CAR) in extracted lymphocytes for recognition of tumor antigens after reinsertion in the body [30]. Moreover, immunotherapies rely on the activation, proliferation, tumor infiltration and subsequent cytotoxic effector function of immune cells [11,31]. Therefore, knowing the extent of lymphocyte accumulation at the tumor site is a good biomarker for therapy response [11,31]. Three different methods for cell labelling with radiopharmaceuticals and subsequent tracking, have been explored, each with their own pros and cons. To assess the effect of adoptive immune cell transfer therapy, cells can be labelled directly ex vivo with a suitable radiotracer for in vivo imaging [32]. An alternative is inserting reporter genes in the immune cells that program proteins which radiopharmaceuticals can specifically target [33,34]. A final method to assess immune response is by imaging lymphocytes in vivo by targeting markers that are constitutively expressed on the cells of interest [35,36]. The three different approaches are discussed in the next paragraphs (Figure 1).
Direct ex vivo labelling of immune cells consists of labelling of cells with an agent that remains trapped within the cells, followed by injection of the cells to the patient. This technique is commonly used in clinical practice as it does not require the modification of the cells. [111In]In-oxine, [89Zr]Zr-oxine and [18F]FDG have been used for this purpose among others (Table 1) [37,38,39]. However, a major drawback of this method is that the tracer is diluted with every cell division, diminishing the measurable signal per cell [32]. Additionally, the efflux of loaded radiotracers decreases the measurable signal and increases background radiation, resulting in higher amounts of activity administration and accompanying increased patient radiation burden. This efflux is partially mitigated by a more recent tracer, [89Zr]Zr-DFO-Bz-NCS, which forms a biostable covalent thiourea bond between the amine functionalities and the NCS group. However, this radiotracer suffers from the known issue of instability of the 89Zr-DFO metal complex. In order to increase the stability of 89Zr complexes two DFO chelator analogs have been developed and are currently under clinical evaluation [38,40]. Moreover, toxicity to the isolated cells, patient and manipulator must be taken into account when using the direct ex vivo cell labelling method, and loss of cell function must be tested extensively [32].
An alternative is to use indirect labelling approaches that do not suffer from loss of labelling agent from the cells and tracer dilution. These indirect labelling strategies refer to the use of reporter genes, or to the in vivo targeting of specific antigens expressed by immune cell subtypes.
Reporter gene imaging consists of introducing genes, such as HSV1-TK, in a cell of interest under the control of a given promotor. These genes are transduced in specific receptors, proteins or enzymes, that are then targeted after injection of a radio-labelled agent (Table 2). Since the gene can be passed with cell division, imaging can be performed at late time points by repeated injection of the radio-labelled agent, and the fate of the cells or their progeny can be followed until they die. The method is associated with a lower cytotoxicity than the direct ex vivo labelling method. However, the approach still suffers some limitations [32]. Firstly, special attention has to be taken to ensure no loss of cell function occurs due to the gene editing, and immunogenicity has to be avoided [32]. Furthermore, this approach has a significantly higher cost than the direct labelling method, and specialized equipment and training is necessary [32]. Finally, the clinical implementation of reporter gene-based cell-tracking methods comes with an important regulatory burden, which explains why clinical studies that use reporter genes for immune cell imaging have yet to start [32]. However, recent developments in gene-editing strategies make it possible to insert the desired reporter gene in safe harbor locations, making safe use of this method easier [48,49].
Other indirect approaches rely on specific radio-labelled monoclonal antibodies (mAbs) or peptides that bind to target antigens expressed on the plasma membrane of different cell subsets. An approach that avoids the need to manipulate immune cells ex vivo, involve administering radiotracers that can selectively identify endogenously expressed markers of immune cells in vivo (Table 3) [21]. This approach suffers less cytotoxicity problems than the direct loading method, and clinical translation is less troublesome, from a regulatory point of view, than reporter gene methods [32]. However, contrary to the direct labelling method, the tracers are subject to biodistribution effects of the body and high background signals can pose interpretation difficulties. The use of smaller constructs such as mini-bodies and peptides results in faster clearance and accompanying lower background than larger tracers, such as mAbs [76]. The potential of this approach is demonstrated by Rashidian and colleagues, who administered the CD8-targeting PET tracer [89Zr]Zr-PEG20-x118-VHH to wild type mice grafted with a B16 melanoma. The imaging results showed that strong therapy responders had a homogenous PET signal in tumors, due to CD8+ T cell infiltration, whereas weak responders had a more heterogenous signal distribution in the tumor [77].
3. Imaging of Markers of Activated Effector Cells
A limitation of the previous methods is lack of information on the functional status of cytotoxic immune cells. Therefore, the actual therapeutic effect of immunotherapy might be overestimated in patients where the function of the immune cells is downregulated, which could result in tumor progression. As a result, a large amount of research has been done in developing ways to assess treatment response more accurately. To this purpose, different tracers have been developed to image markers that are overexpressed or released by activated effector immune cells (e.g., CTLA-4 and granzyme B) to differentiate between active immune cells and exhausted immune cells [24,91,92]. Alternatively, the imaging of the metabolic switch associated with immune cell activation is another potential method to determine therapy response [93,94]. By focussing on active immune cells, rather than total tumor immune infiltrate, imaging biomarkers of cytotoxic immune cell activity may be more valuable for predicting response to cancer immunotherapy. The different tracers developed to target these markers are discussed in the following paragraphs (Figure 2).
3.1. Probes for Cell Surface Markers and Secreted Molecules
3.1.1. Granzyme B
Granzyme B is a serine protease stored in secretory vesicles in NK cells and CD8+ T cells that mediates cancer cell death after cell activation and sequential release from the vesicles [24]. Monitoring the secretion of granzyme B would provide a good indication of therapeutic response to immunotherapies, as this represents a major mechanism responsible for immune-mediated cell death [95].
Larimer et al. developed a granzyme B-targeted PET activity-based probe (GZP), bearing the granzyme B recognition sequence, Ile-Glu-Phe-Asp, attached to an aldehyde warhead. This ABP contained the radiometal chelator NOTA for radio-labelling with 68Ga yielding [68Ga]Ga-NOTA-GZP [24,96]. The in vitro results indicated that the tracer has high specificity for granzyme B over other granzyme family members, yet selectivity over closely related proteases was not demonstrated [24,97]. The tracer was tested in mice xenografted with CT26 cancer cells, which showed that the peptide is eliminated renally and that the uptake in the tumor is predictive for therapy response with anti-PD-1 and anti-CTLA-4 combination therapy [24]. In a large in vivo study, GZP accumulation in the tumor had an overall positive predictive value of 84% for anti-PD-1 and anti-CTLA-4 immunotherapy response in the murine colon cell lines CT26 and MC38-tumor- bearing mice (N=31) and a negative predictive value of 94% (N=35) [98]. Goggi and colleagues developed a [18F]AlF analog for the same IEFD recognition sequence, [18F]AlF-mNOTA-GZP (NOTA–β-Ala–Gly–Gly–Ile–Glu–Phe–Asp–CHO), that showed similar predictive results in CT26 and MC38-tumor-bearing mice as [68Ga]Ga-NOTA-GZP [92]. A distinct advantage of using 18F-tracers, instead of 68Ga-based tracers, is the improved imaging quality associated with 18F, and, in addition, the radiation burden is lower despite having a longer half-life, which is also preferable [74,99]. However, 68Ga is eluted from a generator, whereas 18F production requires a cyclotron, limiting its usage in facilities lacking the necessary equipment, in addition to the higher cost of production [74,99].
Although the structure and sequence of human granzyme B and mouse granzyme B are similar, their substrate specificity is different with human granzyme B preferring the tetrapeptide sequences IEPD, IETD or IEQD over the IEFD-sequence that is recognized specifically by mouse granzyme B, as determined by Casciola-Rosen and colleagues using positional scanning synthetic substrate combinatorial libraries [100]. Therefore, the same group developed an analogous biotinylated probe for human granzyme B by changing one amino acid of the tetrapeptide to create hGZP, which showed high specificity to human granzyme B in human melanoma biopsies [24]. Although the IEPD sequence can also be recognized by other proteases, such as caspase-8, the fact that granzyme B is released into the extracellular space from activated T cells, makes this protease preferentially accessible to binding by the imaging agent over intracellular counterparts [24,101].
Recently, a restricted interaction peptide (RIP) that consists of a labelled antimicrobial peptide fragment that integrates in the cell membrane, a cleavage sequence (recognized by granzyme B), and a peptide masking domain, was designed by Zhao et al. [102]. The group chose the octapeptide IEPDVSQV as cleavage site, due to the high specificity of IEPD for granzyme B over other human granzymes and the increased catalytic activity observed after addition of VSQV. Temporin L was used as the membrane interacting domain and the PAR1 peptide served as the peptide masking domain. To prove that it is the cleaved version of GRIB B that binds membranes, an in vitro assay demonstrated that membrane integration of [64Cu]Cu-GRIP B was significantly higher after co-incubation with granzyme B. Rapid renal excretion was demonstrated through biodistribution studies in nude BALB/c mice. A significantly higher tracer uptake was seen in the tumors and spleens of CT26 mice treated with anti-PD-1/anti-CTLA-4 than in a control group, and post-treatment tracer accumulation correlated with a decrease in tumor volume in wild-type mice treated with ICI [102]. One of the advantages that 64Cu-GRIP B has over the 18F and 68Ga probes is that the unique targeting method allows the imaging at a later time point (>4h), improving the contrast with background [101,102].
3.1.2. IFN-γ
Interferon gamma (IFN-γ) is a cytokine secreted by CD4+ T cells, CD8+ T cells and NK cells that plays a major role in tumor cell recognition and destruction through different pathways [103]. Binding of IFN-γ with IFN-γ receptor leads to dimerization of STAT1 and translocation to the nucleus where it binds its target genes, which leads to a diverse response, including upregulation of major histocompatibility complex (MHC) on APC and upregulation of the Fas/FasL pathway [104].
Gibson and colleagues developed a mAb [89Zr]Zr-anti-IFN-γ PET tracer to detect elevated IFN-γ levels after cancer treatment with immunotherapy as a biomarker for immune activation in tumors [103]. The tracer was tested in neu+ TUBO tumor-bearing BALB/c mice treated with HER2/neu DNA vaccination. Significantly higher tracer accumulation was seen in the tumor of treated mice, which was ex vivo correlated to immune cell infiltration. The researchers were able to distinguish in situ between activated and exhausted T cells using the tracer in the aforementioned mouse model by correlating a decreased tracer accumulation with an increased PD-1 expression on CD8+ T cells [103].
3.1.3. IL-2R
Interleukin-2 (IL-2) is a small glycoprotein secreted mainly by T cells during immune responses. Secreted IL-2 binds the IL-2 receptor (IL-2R), followed by lymphocyte proliferation, cytokine secretion and the expression of MHC II on T cells [105]. The IL-2R is expressed not only on activated cytotoxic T cells, but also on regulatory T cells. Therefore, quantitative imaging of IL-2R represents a good indicator of immune responses.
D’alessandria and colleagues developed a radio-labelled IL-2 probe, [99mTc]Tc-succinimidyl-6-hydrazinopyridine-3-carboxylate-IL2 ([99mTc]Tc-HYNIC-IL2), using a single-step synthesis [106]. A clinical study with 30 melanoma patients demonstrated that the tracer is safe and is able to visualize T cell activation [107]. Another SPECT tracer, [123I]I-IL-2, was developed for the same purpose and a clinical study in seventeen carcinoma patients showed that the tracer allows the imaging of IL-2R on TILs [108]. However, PET-tracers are preferred over SPECT-tracers in the clinic, due to their higher sensitivity and spatio-temporal resolution [109]. Therefore, different groups have worked on developing PET-probes to image IL-2R expression.
In that regard, an IL-2 PET tracer N-(4-[18F]-fluorobenzoyl)interleukin-2 ([18F]FB-IL2) was developed by the De Vries group [105]. The final construct was created by adding purified [18F]-fluorobenzoate ([18F]FSB) to IL-2 and purifying the labelled glycoprotein using RP-HPLC [105]. Ex vivo biodistribution studies in mice showed that the radiotracer is mainly excreted through the renal pathway and that bone uptake is minimal, indicating negligible in vivo defluorination [105]. The tracer was injected in SCID immune-incompetent mice with increasing amounts of human T lymphocytes grafted in the right shoulder. The PET scan showed increased activity in the right shoulder but also a considerable amount of activity in the control shoulder, due to activated T cell migration to the inflamed tissue. No correlation was found between activity in the right shoulder and number of human T cells injected. However, total activity in both shoulders did correlate with the amount of human T cells [105].
A small cohort of patients was administered [18F]FB-IL2 before and six weeks after start of immune checkpoint inhibition therapy with ipilimumab and/or nivolumab. High uptake was noted in the lymphoid system and the major excretory organs (liver and kidneys). Three of the 11 patients showed high uptake in the lungs, possibly due to the formation of tracer micro-aggregates. The study demonstrated that [18F]FB-IL2 is safe to use in patients at 200 MBq, 50 µM. However, the activity at the lesion site was counter-intuitively lower after therapy than at baseline. A possible explanation that the researchers gave for this is that IL-2R is only found on regulatory T cells in tumor lesions with no significant change over time, which would mean that [18F]FB-IL2 does image IL-2R in the TME, but is not, however, a good biomarker for therapy response. Other possibilities for the low uptake are the formation of anti-drug antibodies (ADA) and low binding due to competition with endogenous IL-2 [110]. Another drawback for clinical use of this tracer is that when translating the three-step, partly manual radiosynthesis to a fully automated, GMP compliant method to use the tracer in clinical studies, yields only enough for two patients per production [105,111] were acquired.
Van der Veen and colleagues developed two other IL-2 tracers with shorter production times, [18F]AlF-RESCA-IL2 and [68Ga]Ga-NODAGA-IL2. The chelator RESCA, or restrained complexing agent, is a relatively novel chelator with improved properties for binding metals to heat-sensitive biologicals, due to reasonably fast reaction kinetics at room temperature [112]. Both developed tracers only use one synthesis module in contrast to the two necessary for [18F]FB-IL2, and [18F]AlF-RESCA-IL2 yields were sufficient for multiple patients, making it more feasible for clinical implementation. [68Ga]Ga-NODAGA-IL2, however, was produced in lower yields than [18F]AlF-RESCA-IL2 and production still has to be optimized before clinical use. Both tracers showed an in vitro stability over 90%. The in vitro uptake in activated hPBMCs of [18F]AlF-RESCA-IL2 (73 ± 26.3%) and [68Ga]Ga-NODAGA-IL2 (12.7 ± 0.1%) were higher than the one of [18F]FB-IL2 (4.8 ± 2.8%). In contrast to [18F]FB-IL2, no uptake was seen in the control shoulder in immunodeficient mice with activated human peripheral blood mononuclear cells (hPBMCs) in Matrigel grafts. No uptake was seen in either shoulder after co-injection with a high dose of IL-2, proving the specificity of the tracers [113]. Ex vivo biodistribution studies in immunodeficient mice showed a similar profile to that of [18F]FB-IL2, with increased uptake in the liver and kidneys. At this time, the clinical results of IL-2R imaging are difficult to interpret and additional tracer optimization must be performed before the clinical utility of these imaging agents is demonstrated.
3.1.4. ICOS
The inducible T cell costimulatory receptor (ICOS), also known as CD28, decreases the activation threshold of T cells after interaction with CD80/B7.1 or CD86/B7.2 on APC and plays a regulatory role in adoptive T cell response [114]. ICOS is upregulated during T cell activation and has thus been identified as a potential biomarker for CAR T cell activation [115]. Interestingly, ICOS is not constitutively expressed on resting T cells, representing an exclusive biomarker for activated T cells [115].
Simonetta and colleagues studied [89Zr]Zr-DFO-ICOS mAb as an immuno-PET tracer for in vivo monitoring of CD19-specific CAR T cells for B cell lymphoma treatment in immuno-deficient BALB/c mice. Due to the large size of the antibody, [89Zr]Zr-DFO-ICOS mAb accumulated in well-vascularized organs, such as the heart, liver and spleen in untreated mice 48 h post-injection which restricts the detection of CAR T cells in the spleen. In the study, mice treated with CD19-specific CAR T cells showed a higher [89Zr]Zr-DFO-ICOS mAb uptake in bone marrow than both untreated mice and mice treated with untransduced T cells, which was indicative of higher ICOS expression in bone marrow. The higher ICOS expression was corroborated using flow cytometry analysis [115]. The administration of [89Zr]Zr-DFO-ICOS mAb showed no detectable change in CAR T cell proliferation and therapeutic effect, making it feasible for clinical translation [115].
3.1.5. OX40
The TNF receptor superfamily member OX40 is transiently expressed by CD4+ and CD8+ T cells following TCR stimulation and is transiently expressed on NK cells as well [116]. Thus, antigen-specific activated T cells are potential targets of OX40-directed monitoring of immune activation [117].
Alam et al. developed a PET-tracer based on a murine OX40-specific monoclonal antibody, [64Cu]Cu-DOTA-OX40 mAb, to non-invasively image OX40+ activated T cells in vivo. The researchers demonstrated that the cell-binding affinity of the DOTA-AbOX40 was comparable to the cell-binding affinity of the unmodified AbOX40 in an in vitro activated murine T cell-binding experiment [117]. A murine dual-tumor lymphoma model was used to image CD4+OX40+ T cells in tumors vaccinated with CpG oligodeoxynucleotide. Using this model, the researchers were able to observe significantly increased uptake in the tumors and tumor draining lymph nodes of treated mice compared to untreated mice. The increased uptake could also be measured in the spleen and more distal lymph nodes on day 2 after tracer administration [117]. The same group developed [89Zr]Zr-DFO-OX40 mAb, which has a longer half-life than 64Cu, and evaluated it in a murine glioblastoma model treated with CpG oligodeoxynucleotide to observe longer evaluation of the kinetics of the whole-body immune response to the vaccination. The in vivo PET scans showed an increased activity at days 1, 2 and 5 in the lymph nodes of the vaccinated mice compared to the lymph nodes of control mice. An interesting observation is that there was a higher accumulation in the brain of the control mice than of the treated mice. The fact that lymph nodes further away from the vaccination site also showed OX40+ T cells indicate that the immune reaction initiated by CpG-vaccination can be analyzed in the whole body. The specificity of the construct for OX40 was confirmed by comparing uptake to a 89Zr-labelled isotype control antibody. To confirm that the tracer uptake corresponded to the location of the inoculated brain tumor, the PET/CT images were compared to MRI imaging. These results also indicated that the extent of uptake might be dependent on tumor volume. The tracer amount of the probe had no inhibitory effect on the treatment and treatment response could be predicted with the tracer, making this a promising radiopharmaceutical for monitoring clinical cancer immunotherapy strategies [118].
3.1.6. NKp30 (NK Cells)
Natural killer cells are innate lymphoid cells that can kill targets without prior sensitization. NK cells kill cells that do not express the MHC class I molecules and can thus destroy tumor cells that evade T cell detection by downregulation of these molecules. NK cell-based therapies consist of adoptive cell transfer (CAR NK cells) or modulating NK cell response in situ. A 99mTc-radiolabelled antibody that images neural cell adhesion molecule (NCAM, CD56), expressed on NK cells, has already been developed. However, NCAM is expressed on many types of cells, such as tumor cells, T cells, dendritic cells and monocytes, which decreases tracer specificity [25].
Therefore, Shaffer et al. developed two immunoPET tracers that bind a natural cytotoxicity receptor expressed on NK cells, NKp30, which induces a strong cytotoxic effect when binding to its tumor ligand B7-H6 [119]. [64Cu]Cu-NKp30Ab was synthesized by labelling DOTA-derived NKp30Ab with 64Cu, whereas [89Zr]Zr-NKp30Ab made use of DFO as a chelator. [64Cu]Cu-NKp30Ab and [89Zr]Zr-NKp30Ab showed good in vitro immunoreactivity of 72.3% and 63.8%, respectively. [64Cu]Cu-NKp30Ab demonstrated specific in vitro binding to NK92MI cell line and primary human NK cells isolated from buffy coats. In vivo PET/CT imaging showed specific uptake of [64Cu]Cu-NKp30Ab in NKp30-expressing Hela tumor xenografts (15.2 ± 4.5 %ID/g) in comparison to NKp30-negative wild-type Hela-controls (5.8 ± 1.9 %ID/g). At the terminal time point (48 h post injection) the amount of [64Cu]Cu-NKp30Ab in the blood was still high (8.3% ID/g). In contrast, [89Zr]Zr-NKp30Ab showed an improved blood to tumor ratio at 120 h post injection, demonstrating that the longer half-life of 89Zr (78.4 h) aligns better with the long circulation time of mAbs [25].
3.2. Imaging of Metabolic Markers
The activation of T cells is accompanied by metabolic reprogramming, making use of adaptive metabolic pathways [120,121]. [18F]FDG has been explored to quantify immune response by measuring the increased glycolysis rate. However, due to non-specific uptake in all GLUT1 or GLUT3 expressing cells and increased uptake in any cell, due to inflammation, [18F]FDG is unsuitable for assessing immune cell involvement in immunotherapy [122]. An alternative method to monitor immune response imaging metabolic reprogramming, is to image DNA salvage pathways. By imaging specific enzymes of these metabolic pathways, a distinction can be made between activated and non-activated T cells [93]. Thymidine kinase 1 (TK1), deoxycytidine kinase (dCK) and deoxyguanosine kinase (dGK) have been evaluated as potential imaging targets by different groups due to their role in the DNA salvage pathway [93,123,124].
The radiotracers described here aim to target a metabolic process that is specific for T cells. After tracer injection, it is taken up by T cells due to its unique metabolic reactivity in these cells.
3.2.1. TK1
Thymidine kinase (TK) 1 is a DNA salvage pathway enzyme, which is upregulated during lymphocyte proliferation and is therefore a suitable target for imaging T cell activation [124]. After thymidine enters the cell, TK1 phosphorylates it to its monophosphate, whereafter it is converted to its triphosphate form ready for DNA synthesis [124]. [18F]FLT, a thymidine analog targeting DNA synthesis was developed to image cell proliferation [57]. [18F]FLT enters the cell through passive diffusion and carrier-mediated transport, and after phosphorylation by TK1, is trapped in the cell [125,126]. This radiotracer can be used to monitor lymphocyte activation in the lymph nodes, in good agreement with T cell proliferation, which was not observed with [18F]FDG [57]. However, it has been proven that TK1 levels are also increased in different types of cancers, such as lung, colon, breast and prostate, thus making imaging of immune cell activation at the tumor site unreliable [124]. Therefore, measurements of TK1 as a biomarker for immune activation are more relevant in the lymphatic system.
Aarntzen et al. measured [18F]FLT PET signal in patient lymph nodes after vaccination with antigen-loaded dendritic cells [57]. The reported results demonstrate that [18F]FLT accumulation correlates well with activated lymphocyte proliferation, and that [18F]FLT can be used to determine therapy response [57]. Ribas et al. evaluated [18F]FLT uptake in melanoma patients after treatment with tremelimumab, an anti-CTLA-4 antibody [28]. The [18F]FLT uptake in the spleen was increased after treatment, whereas the [18F]FDG spleen uptake did not change significantly. However, pre- and post-treatment scans at the tumor site did not differ significantly for either [18F]FLT or [18F]FDG, indicating that treatment response cannot be measured at the tumor site [28]. The PET scans to determine immunoactivation were done between one and two months after treatment, which is earlier than the five months’ median time to determine tumor response by CT scan [28]. Scarpelli et al. analysed [18F]FLT uptake after an intradermal injection of pTVG-HP vaccine in patients [94]. The results showed an increased uptake in draining lymph nodes compared to non-draining nodes. Another arm of the study received a combination of pTVG-HP vaccine and pembrolizumab. The splenic [18F]FLT uptake was the highest in this arm. However, increased splenic uptake was inversely correlated with progression-free survival time making interpretation of the results challenging. We can thus conclude that [18F]FLT will not work in the clinic for this purpose. Interestingly, researchers also noted that baseline FLT uptake in the thyroid was predictive for the occurrence of thyroid-related adverse events [94].
3.2.2. DCK
Deoxycytidine kinase (dCK) is a rate-limiting enzyme in the deoxyribonucleoside salvage pathway that is upregulated during lymphocyte proliferation and is therefore suitable for T cell activation imaging. After a deoxyribonucleoside enters the cell, it is phosphorylated to its monophosphate by dCK, whereafter its triphosphate form is incorporated into DNA during DNA replication [127].
1-(2′-deoxy-2′-[18F]fluoroarabinofuranosyl) cytosine ([18F]FAC), is a deoxycytidine analog that is predominantly incorporated into the salvage pathway for DNA synthesis in lymphoid organs and rapidly proliferating tissues. This tracer was developed as a high-affinity substrate for dCK to image immune activation in secondary lymphoid organs and is trapped inside the cell after phosphorylation [93]. It has been demonstrated that the uptake of this tracer is increased in activated CD8+ T cells compared to naïve T cells [93]. The tracer was produced with high chemical and radiochemical purity with late-stage radio-fluorination of the pyrimidine. However, [18F]FAC can be deaminated in vivo by cytidine deaminase [128,129]. The biodistribution data in C57/BL6 mice showed that there is a preferential retention in high dCK-expressing tissue, such as lymphocytes, bone-marrow cells and enterocytes. Using an onco-retrovirus tumor model in mice, increased dCK activity, due to T cell activation, could be measured. The results showed that at day 15 after injection, there was increased activity in the spleen and tumor draining lymph nodes and that effector CD8+ T cells had a four times higher retention of [18F]FAC than naïve T cells. [18F]FAC is more selective for lymphoid organs than [18F]FDG and [18F]FLT; however, the baseline retention in lymphoid organs is higher and could hinder the detection of weak immune responses [93]. Additionally, Chen et al. demonstrated that activated leukocytes labelled with [18F]FAC can cross the blood-brain-barrier and be used to visualize leukocyte accumulation in the brain using an experimental autoimmune encephalomyelitis model [130]. A drawback of this tracer is the long synthesis time and rapid in vivo deamination of [18F]FAC, making it less suitable for regular use in the clinic [131].
[18F]FAC analogs L-[18F]FMAC and L-[18F]FAC have similar specificity to dCK as [18F]FAC but higher metabolic stability than [18F]FAC and have reached the clinic [128,132]. Unfortunately, both tracers have a high uptake in the myocardium due to reactivity with TK2, which leads to high background uptake [128].
Another substrate of dCK, [18F]Clofarabine ([18F]CFA), was developed by Kim and colleagues for imaging lymphocyte activation in secondary lymphoid organs [133]. Unlike [18F]FAC, it is not a good substrate of TK2 and has high in vivo stability, making it a more suitable tracer to image dCK selectively. However, deoxycytidine (dC), which has a higher blood concentration in mice than in humans, is a competitive inhibitor of dCK, which makes immediate comparison between mice and humans impossible [133]. A first in human study showed that the tracer is cleared renally and that it distributes to dCK positive tissues (bone marrow, liver, spleen and axillary lymph nodes) of healthy volunteers [133].
3.2.3. DGK
Arabinofuranosylguanine (AraG), a modified sugar specifically cytotoxic for T lymphoblasts, is a substrate of mitochondrial deoxyguanosine kinase (dGk) that is upregulated in activated T cells [123]. Namavari et al. have adapted AraG to a PET-tracer, [18F]F-AraG, to visualize T lymphoblast and T lymphocyte immune activation and proliferation in cancer [123]. The group was able to develop [18F]F-AraG with a radiochemical, decay corrected, yield of 7–10% and a specific activity of 0.8–1.3 Ci/µM by direct fluorination of a trifylate precursor. Uptake in activated T cells was confirmed using in vitro assays in the CCRF-CEM cell line and primary murine T cells [123]. Ronald et al. investigated [18F]F-AraG imaging in the context of acute graft-versus-host disease due to allogenic cell transplant and demonstrated the T lymphocyte specific uptake of [18F]F-AraG in different immune cell lines and primary T cells isolated from Balb/C mice [134]. Levi et al. were able to predict treatment response to anti-PD-1 therapy in MC38 tumor-bearing mice using [18F]F-AraG imaging 48 h after treatment [135]. A first in human [18F]F-AraG biodistribution study was performed in six healthy volunteers which showed tracer accumulation in kidneys, liver and heart and proved the safety of [18F]F-AraG at tracer concentration [134]. Recently, the ability of [18F]F-AraG to visualize T cell infiltration and inflammatory demyelisation and to evaluate lesion heterogeneity in a multiple sclerosis model in mice was proven [136]. The NCT03311672 clinical trial that examined [18F]F-AraG accumulation in patients with lung cancer treated with pembrolizumab and either with, or without, radiation therapy was stopped due to low tracer uptake. However, a high number of clinical trials are being performed with this tracer in different stages for different cancers and viral diseases. Of those, the NCT04726215 trial that will enrol about 50 non-small cell lung cancer (NSCLC) patients to image T cell activation before and after anti-PD-1/PD-L1 therapy is the largest.
3.3. Imaging of Exhaustion Markers
Currently, ICI, that target exhaustion markers on immune cells and tumor cells, are the backbone of immunotherapy in oncology. Exhaustion markers, such as PD-1, CTLA-4 and LAG3, are transiently expressed on active immune cells. However, the co-expression of multiple exhaustion markers is characteristic for immune cell dysfunction [137]. To increase the percentage of successful tumor remission, these markers can be targeted using specific radiotracers and imaged, giving clinicians an indication of their expression levels, which can be used to predict the effectiveness of immunotherapy. In the following paragraphs, radiotracers for exhaustion markers on immune cells are discussed.
3.3.1. PD-1
Programmed cell-death protein 1 (PD-1) is an inhibitory receptor that is expressed mostly on the cell surface of T cells and NK cells [138]. Different ICI have been developed and approved to block PD-1/PD-L1 interaction and multiple clinical trials are still ongoing [139]. All the approved anti-PD-1 ICIs (pembrolizumab, nivolumab, cemiplimab and dostarlimab) are full-length antibodies and the developed radiopharmaceuticals are derived thereof [140,141].
Hettich et al. developed a [64Cu]Cu-NOTA-PD-1 mice mAb which showed specific uptake in lymph nodes and spleen and was able to visualize PD-1+ T cells tumor infiltration in a murine model treated with radiotherapy and CTLA-4/PD-L1 inhibitors [26]. Natarajan and colleagues developed two PET tracers, [64Cu]Cu-DOTA-pembrolizumab and [89Zr]Zr-DFO-pembrolizumab, with good immunoreactivity (74% and 72%, respectively) and tested them in a humanized NSG mouse model engrafted with hPBMCs isolated from human blood. [64Cu]Cu-DOTA-pembrolizumab showed a higher liver uptake and liver clearance time than [89Zr]Zr-DFO-pembrolizumab, however, at 24 hours after injection the tumor-to-blood ratio was three times higher for [64Cu]Cu-DOTA-pembrolizumab than for [89Zr]Zr-DFO-pembrolizumab, potentially due to higher chelation stability, making the former a more promising tracer [142].
This year, Kok and colleagues administered [89Zr]Zr-pembrolizumab to 7 NSCLC and 11 melanoma patients before and after ICI treatment. The tracer was safe and accumulated slowly in the spleen and tumor site with a maximum at day 7. Tumor uptake correlated with survival and progression free survival of the patients. Interestingly, tracer accumulation was also noted at other inflammation sites [143]. A previous clinical study performed by Niemeijer and colleagues administering [89Zr]Zr-pembrolizumab in 12 NSCLC patients had one grade 3 adverse event (myalgia). However, the tracer is still considered safe. In this study, no statistically significant correlation could be made between tracer uptake and treatment response, although a similar trend was reported by the researchers [144].
England and colleagues developed [89Zr]Zr-DFO-nivolumab that was able to bind PD-1+ T cells in vivo in the tumor and salivary glands of a murine model with a maximum uptake at 168 hours post-injection [145]. Cole and colleagues analysed the biodistribution of [89Zr]Zr-DFO-nivolumab in three non-human primates and noted tracer accumulation in the spleen, which was tremendously reduced after co-injection with unlabelled nivolumab, indicating specific binding to PD-1+ T cells [146]. Unfortunately, bone accumulation was observed, due to the release of 89Zr from the unstable complex formed with DFO, which should be solved by using next generation chelators resulting in a complex with increased stability [146].
Recently, [89Zr]Zr-nivolumab was administered to 13 patients with advanced NSCLC to evaluate biodistribution and safety. The results showed that (1) the tracer is safe; (2) the radiopharmaceutical is mainly excreted through the GI tract; (3) there is a high uptake in the spleen; and (4) that the tumor-to-background ratio is high enough for imaging. The researchers were able to correlate radiotracer uptake with PD-1+ immune cell aggregates in the tumors and with nivolumab therapy response in lesions larger than 20 mm. However, as expected, the tracer distribution from blood to target is slow and the optimal measuring time point is 5–7 days after injection, which complicates clinical application [147].
Multiple PD-L1 targeting tracers have been developed and assessed by different research groups to predict and assess treatment response [7].
3.3.2. CTLA-4
Cytotoxic T lymphocyte-associated antigen-4 (CTLA-4), also known as CD152, is a membrane protein expressed on CD4+ and CD8+ T cells that is involved in the downregulation of T cell immune response at the tumor site upon interaction with CD80/B7.1 and CD86/B7.2 on APC [91,148]. Importantly, CTLA-4 is also expressed in tumor cells [148]. CTLA-4 blockade therapy with the mAb ipilimumab and tremelimumab were developed, and ipilimumab has received FDA approval for treating advanced melanoma and other cancers in combination therapies [91]. Therefore, tracers targeting CTLA-4 have been developed to distinguish between treatment responders and non-responders and an ongoing clinical study performed with the full length mAb [89Zr]Zr-ipilimumab in patients diagnosed with metastatic melanoma has already shown promising preliminary results (NCT03313323) [149].
Higashikawa et al. developed a PET probe targeting murine CTLA-4, [64Cu]Cu-DOTA-anti-mouse CTLA-4 mAb, that showed 86.3 (±2.8%) immunoreactivity of the original CTLA-4 mAb. The results of PET and ex vivo biodistribution studies in immune deficient BALB/c mice grafted with syngeneic mouse tumor model (CT26), which expresses CTLA-4, indicated specific uptake of [64Cu]Cu-DOTA-anti-mouse CTLA-4 mAb when compared to the IgG control mAb [91]. Ehlerding and colleagues developed three different ipilimumab-based immunoPET tracers to image human CTLA-4. [64Cu]Cu-DOTA-ipilimumab, [64Cu]Cu-NOTA-ipilimumab and the antibody fragment [64Cu]Cu-NOTA-ipilimumab-F(ab’)2, all showing preserved immunoreactive fractions, were assessed in vivo in a NSCLC humanized mouse model. The use of NOTA instead of DOTA in the latter radiopharmaceuticals was motivated by an enhanced in vivo kinetic stability of the CuII-NOTA complexes [150]. Increased radiotracer accumulation of [64Cu]Cu-NOTA-ipilimumab was observed in human T cells in the murine models when compared to the antibody fragments; however, higher contrast was measured for the fragment, due to faster clearance [151]. At the moment, no clinical trials are being performed with any of these 64Cu-based tracers.
In an attempt to improve the clinical benefit of PD-1 blockade, Mazor and colleagues have developed a monovalent bispecific PD-1/CTLA-4 antibody, MEDI5752 [152]. MEDI5752 was radio-labelled with 89Zr to study the activity in vivo of this antibody using a transgenic mouse model that expresses human PD-1 and CTLA-4 on immune cells. They showed that the radiotracer accumulation in the tumor was higher when compared with a conventional anti-CTLA-4 mAb, but not with anti-PD-1 mAb [152]. This suggests that the biodistribution of MEDI5752 was dependent on PD-1 expression and binding. Different clinical trials with un-labelled bispecific mAb are already ongoing.
3.3.3. LAG-3
Recently, lymphocyte-activation gene 3 (LAG-3) has been identified as an immune checkpoint expressed on the surface of CD4+ and CD8+ T cells, NK cells, dendritic cells, regulatory T cells, B cells and macrophages [27]. Relatlimab was the first blocking antibody to be developed and is currently undergoing Phase II/III trials [27]. Recently, the combination of relatlimab with nivolumab was shown to be superior to nivolumab alone in preventing disease progression or death in patients with untreated metastatic or unresectable melanoma, making the development of a diagnostic tool for LAG-3 of value [153,154].
Therefore, Lecocq and colleagues developed a 99mTc-labeled single-domain antibody and evaluated it via SPECT/CT in tumor-bearing mice [27]. The tracer accumulated in the kidneys, bladder, and tumors at 80 minutes post-injection. An increased tracer uptake was observed in lymph nodes and tumor when mice were treated with PD-1 inhibitors, due to increased LAG-3 expression on TILs [27]. A PET tracer using 89Zr labelled to the human antibody REGN3767 with the bifunctional chelator DFO was developed by Kelly and colleagues and demonstrated high immunoreactivity in cell binding assays [155]. Tracer specificity for LAG-3 was confirmed in tumors expressing human LAG-3 in immune deficient mice by comparing uptake with a 89Zr-isotype control antibody. Furthermore, the ability to label intra-tumoral and splenic activated T cells was assessed by implanting Raji lymphoma cells with human peripheral blood mononuclear cells [155]. At the moment, interpretation of the results is difficult and the high accumulation in the liver is a nuisance. Additionally, the optimal timepoint for tracer administration has to be investigated. This tracer is currently under clinical investigation (NCT04566978).
4. Conclusions and Future Perspectives
In conclusion, molecular imaging of cytotoxic immune cells is a valuable tool to predict and evaluate immunotherapy treatment response and to aid clinical decision-making for treatment of tumors. However, each of the different cell-imaging strategies has strengths that can be exploited and weaknesses that must be mitigated. The value of direct in vivo imaging of lineage markers such as CD8 for CD8+ T cell accumulation at the tumor site has already been demonstrated and clinical studies with [89Zr]Zr-DFO-IAB22M2C are being performed [21,77]. However, in our opinion, tracers that target activation or exhaustion markers and give information on the functional state of the cells in addition to the immune cell infiltration in the tumor are the most promising, as these tracers can provide clinicians with more comprehensive information on (potential) treatment response. The high predictive value of [68Ga]Ga-NOTA-GZP in CT26 and MC38 colon cancer mice models further substantiates this claim [98]. However, some strategies have demonstrated unclear results, hindering the clinical use of the tracers, as seen for IL-2R targeting probes [110]. As of now, multiple tracers are being developed to target activation/exhaustion markers and several clinical studies are ongoing.
However, there are still opportunities to develop tracers for other activation/exhaustion markers. One of the most promising exhaustion targets, T cell immunoglobulin and mucin domain-3 (TIM3), is upregulated on CD4+ and CD8+ T cells after cell activation and is expressed on exhausted NK cells as well [156,157]. Immune cell death is induced after binding of TIM3 to its ligand galectin-9, thus inhibiting the immune response [156]. Multiple anti-TIM3 clinical trials are already ongoing, and therefore, it will be of value to be able to discriminate between patients that would benefit from this therapy early on [156]. Another exhaustion marker of interest is the T cell immunoreceptor with immunoglobulin and ITIM domain (TIGIT), that is expressed on both activated T cells and NK cells, and promotes immune cell exhaustion through multiple pathways [158]. Different therapies are being developed targeting TIGIT or its ligands and clinical trials are ongoing [158]. Similar to other exhaustion markers, a diagnostic tool would be of value to improve treatment efficacy once used in the clinic. A lot of research is being done in promoting the effector function of NK cells because of their ability to recognise and lyse MHC class I-deficient cells. Different targets, such as NKG2A and CD96, are being evaluated as therapeutic targets and diagnostic markers will be necessary in the future [157]. Another target of interest on NK cells is the NKp46 receptor, which is only expressed on NK cells, irrelevant of their functional status. The development of a NKp46-specific tracer could further elucidate the role of NK cells in immune response to cancer [159].
Conventionally, radio-labelled mAbs have been used to image targets in vivo due to their high specificity and, in some cases, their corresponding therapeutic usage. However, the large size of full-length antibodies limits their tumor penetration and the accompanying long half-life in the bloodstream decreases contrast due to high background activity [76]. Therefore, a trend seen in the development of new radiopharmaceuticals is to use smaller vectors. The smaller antigen-binding fragments (Fv) suffer lower stability and target affinity than antibodies, which may limit their usage [160]. The heavy chain-only antibodies from camelids, nanobodies, are being used more often because the affinity for antigens is sufficient and their molecular weight is only 12-15 kDa, allowing renal elimination [161]. Examples of this tendency are demonstrated in the development of CD8+ T cell-targeting probes (Table 3). Adnectins, even smaller constructs (10 kDa), have recently been explored for PET imaging of PD-L1 (18F-BMS-986192, 68Ga-BMS-986192) and have shown promising (pre-)clinical results [147,162,163]. All these results point towards the high potential of developing smaller constructs in immunoPET, increasing the imaging contrast and limiting the radiation burden for patients.
To obtain an optimal target/background ratio, the half-life of the radionuclide should approximate the plasma half-life of the tracer [164]. As the plasma half-life of peptides and antibody fragments is short, suitable radionuclides, such as 18F (t1/2 = 109.8 min) and 68Ga (t1/2 = 67.8 min), have to be used [164,165]. The many advances (e.g., late-stage radiofluorination) make the development of different 18F-and 68Ga-probes possible [166]. Another approach being investigated to reduce the dose delivered to patients, while retaining the high affinity of antibodies, is the use of pre-targeting strategies. These strategies consist of radionuclide administration a few days after administration of a modified antibody, making use of specific biorthogonal reactions, such as strain-promoted azide-alkyne cycloaddition, to couple the high antibody affinity with the favorable kinetic properties of small imaging probes [167,168].
To conclude, significant advances have been made in the molecular imaging of effector immune cells for evaluation of cancer treatment. Still, many challenges and opportunities exist to routinely use these in a clinical setting.
Author Contributions
Conceptualization, L.L., T.V.d.W. and F.E.; writing—original draft preparation, L.L.; writing—review and editing, L.L., E.S., T.V.d.W. and F.E.; supervision, F.E.; funding acquisition, F.E. All authors have read and agreed to the published version of the manuscript.
Funding
This work was funded by the Bijzonder onderzoeksfonds (BOF), University of Antwerp (DOCPRO 46060) and the Research Foundation Flanders (FWO) (postdoctoral fellowship 12T8821N).
Institutional Review Board Statement
Not applicable.
Informed Consent Statement
Not applicable.
Data Availability Statement
Not applicable.
Conflicts of Interest
The authors declare no conflict of interest.
References
- Baltussen, J.C.; Welters, M.J.P.; Verdegaal, E.M.E.; Kapiteijn, E.; Schrader, A.M.R.; Slingerland, M.; Liefers, G.-J.; van der Burg, S.H.; Portielje, J.E.A.; de Glas, N.A. Predictive biomarkers for outcomes of immune checkpoint inhibitors (ICIs) in melanoma: A systematic review. Cancers 2021, 13, 6366. [Google Scholar] [CrossRef]
- Dezfouli, A.B.; Yazdi, M.; Pockley, A.G.; Khosravi, M.; Kobold, S.; Wagner, E.; Multhoff, G. NK cells armed with chimeric antigen receptors (CAR): Roadblocks to successful development. Cells 2021, 10, 3390. [Google Scholar] [CrossRef] [PubMed]
- Addeo, A.; Friedlaender, A.; Giovannetti, E.; Russo, A.; de Miguel-Perez, D.; Arrieta, O.; Cardona, A.F.; Rolfo, C. A new generation of vaccines in the age of immunotherapy. Curr. Oncol. Rep. 2021, 23, 137. [Google Scholar] [CrossRef] [PubMed]
- Hegde, P.S.; Chen, D.S. Top 10 challenges in cancer immunotherapy. Immunity 2020, 52, 17–35. [Google Scholar] [CrossRef] [PubMed]
- Aureli, A.; Marziani, B.; Sconocchia, T.; del Principe, M.I.; Buzzatti, E.; Pasqualone, G.; Venditti, A.; Sconocchia, G. Immunotherapy as a Turning Point in the Treatment of Acute Myeloid Leukemia. Cancers 2021, 13, 6246. [Google Scholar] [CrossRef]
- Krekorian, M.; Fruhwirth, G.O.; Srinivas, M.; Figdor, C.G.; Heskamp, S.; Witney, T.H.; Aarntzen, E.H.J.G. Imaging of T-cells and their responses during anti-cancer immunotherapy. Theranostics 2019, 9, 7924. [Google Scholar] [CrossRef] [PubMed]
- Verhoeff, S.R.; van den Heuvel, M.M.; van Herpen, C.M.L.; Piet, B.; Aarntzen, E.H.J.G.; Heskamp, S. Programmed cell death-1/Ligand-1 PET imaging: A novel tool to optimize immunotherapy? PET Clin. 2020, 15, 35–43. [Google Scholar] [CrossRef] [PubMed] [Green Version]
- Zhang, X.; Beachler, D.C.; Masters, E.; Liu, F.; Yang, M.; Dinh, J.; Jamal-Allial, A.; Kolitsopoulos, F.; Lamy, F.-X. Health care resource utilization and costs associated with advanced or metastatic nonsmall cell lung cancer in the United States. J. Manag. Care Spec. Pharm. 2022, 28, 255–265. [Google Scholar] [CrossRef]
- Vago, L.; Gojo, I. Immune escape and immunotherapy of acute myeloid leukemia. J. Clin. Investig. 2020, 130, 1552. [Google Scholar] [CrossRef]
- Chen, D.S.; Mellman, I. Oncology meets immunology: The cancer-immunity cycle. Immunity 2013, 39, 1–10. [Google Scholar] [CrossRef] [Green Version]
- Lu, Y.; Zhang, J.; Chen, Y.; Kang, Y.; Liao, Z.; He, Y.; Zhang, C. Novel immunotherapies for osteosarcoma. Front. Oncol. 2022, 12, 830546. [Google Scholar] [CrossRef] [PubMed]
- Vaidyanathan, R.; Soon, R.H.; Zhang, P.; Jiang, K.; Lim, C.T. Cancer diagnosis: From tumor to liquid biopsy and beyond. Lab Chip 2018, 19, 11–34. [Google Scholar] [CrossRef] [PubMed]
- Ulaner, G.A. 16α-18F-fluoro-17β-fluoroestradiol (FES): Clinical applications for patients with breast cancer. Semin. Nucl. Med. 2022, in press. [Google Scholar] [CrossRef] [PubMed]
- Iravani, A.; Hicks, R.J. Imaging the cancer immune environment and its response to pharmacologic intervention, part 1: The Role of 18F-FDG PET/CT. J. Nucl. Med. 2020, 61, 943–950. [Google Scholar] [CrossRef] [PubMed]
- Eisenhauer, E.A.; Therasse, P.; Bogaerts, J.; Schwartz, L.H.; Sargent, D.; Ford, R.; Dancey, J.; Arbuck, S.; Gwyther, S.; Mooney, M.; et al. New response evaluation criteria in solid tumors: Revised RECIST guideline (version 1.1). Eur. J. Cancer 2009, 45, 228–247. [Google Scholar] [CrossRef]
- Morote, J.; Aguilar, A.; Planas, J.; Trilla, E. Definition of castrate resistant prostate cancer: New insights. Biomedicines 2022, 10, 689. [Google Scholar] [CrossRef]
- Borcoman, E.; Kanjanapan, Y.; Champiat, S.; Kato, S.; Servois, V.; Kurzrock, R.; Goel, S.; Bedard, P.; le Tourneau, C. Novel patterns of response under immunotherapy. Ann. Oncol. 2019, 30, 385–396. [Google Scholar] [CrossRef]
- Chen, M.-Y.; Zeng, Y.-C. Pseudoprogression in lung cancer patients treated with immunotherapy. Crit. Rev. Oncol. Hematol. 2022, 169, 103531. [Google Scholar] [CrossRef]
- Beroske, L.; van den Wyngaert, T.; Stroobants, S.; van der Veken, P.; Elvas, F. Molecular imaging of apoptosis: The case of caspase-3 radiotracers. Int. J. Mol. Sci. 2021, 22, 3948. [Google Scholar] [CrossRef]
- van der Meulen, N.P.; Strobel, K.; Lima, T.V.M. New radionuclides and technological advances in SPECT and PET scanners. Cancers 2021, 13, 6183. [Google Scholar] [CrossRef]
- Farwell, M.D.; Gamache, R.F.; Babazada, H.; Hellmann, M.D.; Harding, J.J.; Korn, R.; Mascioni, A.; Le, W.; Wilson, I.; Gordon, M.S.; et al. Title: CD8-targeted PET imaging of tumor infiltrating T cells in patients with cancer: A phase I first-in-human study of 89 Zr-Df-IAB22M2C, a radiolabeled anti-CD8 minibody. J. Nucl. Med. 2022, 63, 720–726. [Google Scholar] [CrossRef] [PubMed]
- Shalaby, N.; Dubois, V.P.; Ronald, J. Molecular imaging of cellular immunotherapies in experimental and therapeutic settings, cancer immunology. Immunotherapy 2021. [Google Scholar] [CrossRef]
- Zhang, Z.; Wang, T.; Wang, X.; Zhang, Y.; Song, S.; Ma, C. Improving the ability of CAR-T cells to hit solid tumors: Challenges and strategies. Pharmacol. Res. 2022, 175, 106036. [Google Scholar] [CrossRef] [PubMed]
- Larimer, B.M.; Wehrenberg-Klee, E.; Dubois, F.; Mehta, A.; Kalomeris, T.; Flaherty, K.; Boland, G.; Mahmood, U. Granzyme B PET imaging as a predictive biomarker of immunotherapy response. Cancer Res. 2017, 77, 2318. [Google Scholar] [CrossRef] [PubMed] [Green Version]
- Shaffer, T.M.; Aalipour, A.; Schurch, C.M.; Gambhiry, S.S. PET imaging of the natural killer cell activation receptor NKp30. J. Nucl. Med. 2020, 61, 1348. [Google Scholar] [CrossRef] [PubMed]
- Hettich, M.; Braun, F.; Bartholomä, M.D.; Schirmbeck, R.; Niedermann, G. High-resolution PET imaging with therapeutic antibody-based PD-1/PD-L1 checkpoint tracers. Theranostics 2016, 6, 1629–1640. [Google Scholar] [CrossRef]
- Lecocq, Q.; Awad, R.M.; de Vlaeminck, Y.; de Mey, W.; Ertveldt, T.; Goyvaerts, C.; Raes, G.; Thielemans, K.; Keyaerts, M.; Devoogdt, N.; et al. Single-domain antibody nuclear imaging allows noninvasive quantification of LAG-3 expression by tumor-infiltrating leukocytes and predicts response of immune checkpoint blockade. J. Nucl. Med. 2021, 62, 1638–1644. [Google Scholar] [CrossRef]
- Ribas, A.; Benz, M.R.; Allen-Auerbach, M.S.; Radu, C.; Chmielowski, B.; Seja, E.; Williams, J.L.; Gomez-Navarro, J.; McCarthy, T.; Czernin, J. Imaging of CTLA4 blockade–induced cell replication with 18F-FLT PET in patients with advanced melanoma treated with tremelimumab. J. Nucl. Med. 2010, 51, 340–346. [Google Scholar] [CrossRef] [Green Version]
- Unterrainer, M.; Ruzicka, M.; Fabritius, M.P.; Mittlmeier, L.M.; Winkelmann, M.; Rübenthaler, J.; Brendel, M.; Subklewe, M.; von Bergwelt-Baildon, M.; Ricke, J.; et al. PET/CT imaging for tumor response assessment to immunotherapy: Current status and future directions. Eur. Radiol. Exp. 2020, 4, 63. [Google Scholar] [CrossRef]
- Ebrahimiyan, H.; Tamimi, A.; Shokoohian, B.; Minaei, N.; Memarnejadian, A.; Hossein-Khannazer, N.; Hassan, M.; Vosough, M. Novel insights in CAR-NK cells beyond CAR-T cell technology; promising advantages. Int. Immunopharmacol. 2022, 106, 108587. [Google Scholar] [CrossRef]
- Fridman, W.H.; Zitvogel, L.; Sautès-Fridman, C.; Kroemer, G. The immune contexture in cancer prognosis and treatment. Nat. Rev. Clin. Oncol. 2017, 14, 717–734. [Google Scholar] [CrossRef] [PubMed]
- Xiao, Z.; Pure, E. Imaging of T-cell responses in the context of cancer immunotherapy. Cancer Immunol. Res. 2021, 9, 490. [Google Scholar] [CrossRef] [PubMed]
- Minn, I.; Huss, D.J.; Ahn, H.H.; Chinn, T.M.; Park, A.; Jones, J.; Brummet, M.; Rowe, S.P.; Sysa-Shah, P.; Du, Y.; et al. Imaging CAR T cell therapy with PSMA-targeted positron emission tomography. Sci. Adv. 2019, 5, 5096. [Google Scholar] [CrossRef] [Green Version]
- Lechermann, L.M.; Lau, D.; Attili, B.; Aloj, L.; Gallagher, F.A. In vivo cell tracking using PET: Opportunities and challenges for clinical translation in oncology. Cancers 2021, 13, 4042. [Google Scholar] [CrossRef] [PubMed]
- Yusufi, N.; Mall, S.; Bianchi, H.d.; Steiger, K.; Reder, S.; Klar, R.; Audehm, S.; Mustafa, M.; Nekolla, S.; Peschel, C.; et al. In-depth characterization of a TCR-specific tracer for sensitive detection of tumor-directed transgenic T cells by immuno-PET. Theranostics 2017, 7, 2402. [Google Scholar] [CrossRef] [PubMed]
- Sorace, A.G.; Elkassem, A.A.; Galgano, S.J.; Lapi, S.E.; Larimer, B.M.; Partridge, S.C.; Quarles, C.C.; Reeves, K.; Napier, T.S.; Song, P.N.; et al. Imaging for response assessment in cancer clinical trials: Seminars in nuclear medicine. Semin. Nucl. Med. 2020, 50, 488. [Google Scholar] [CrossRef]
- Roca, M.; de Vries, E.F.J.; Jamar, F.; Israel, O.; Signore, A. Guidelines for the labelling of leucocytes with 111In-oxine. Eur. J. Nucl. Med. Mol. Imaging 2010, 37, 835. [Google Scholar] [CrossRef] [Green Version]
- Bansal, A.; Pandey, M.K.; Demirhan, Y.E.; Nesbitt, J.J.; Crespo-Diaz, R.J.; Terzic, A.; Behfar, A.; DeGrado, T.R. Novel 89Zr cell labeling approach for PET-based cell trafficking studies. EJNMMI Res. 2015, 5, 19. [Google Scholar] [CrossRef] [Green Version]
- Lauri, C.; Signore, A.; Glaudemans, A.W.J.M.; Treglia, G.; Gheysens, O.; Slart, R.H.J.A.; Iezzi, R.; Prakken, N.H.J.; Debus, E.S.; Honig, S.; et al. Evidence-based guideline of the European association of nuclear medicine (EANM) on imaging infection in vascular grafts. Eur. J. Nucl. Med. Mol. Imaging 2022, 2022, 1–22. [Google Scholar] [CrossRef]
- Chomet, M.; Schreurs, M.; Bolijn, M.J.; Verlaan, M.; Beaino, W.; Brown, K.; Poot, A.J.; Windhorst, A.D.; Gill, H.; Marik, J.; et al. Head-to-head comparison of DFO* and DFO chelators: Selection of the best candidate for clinical 89Zr-immuno-PET. Eur. J. Nucl. Med. Mol. Imaging 2021, 48, 694. [Google Scholar] [CrossRef]
- Meier, R.; Piert, M.; Piontek, G.; Rudelius, M.; Oostendorp, R.A.; Senekowitsch-Schmidtke, R.; Henning, T.D.; Wels, W.S.; Uherek, C.; Rummeny, E.J.; et al. Tracking of [18F]FDG-labeled natural killer cells to HER2/neu-positive tumors. Nucl. Med. Biol. 2008, 35, 579–588. [Google Scholar] [CrossRef] [PubMed]
- Sato, N.; Wu, H.; Asiedu, K.O.; Szajek, L.P.; Griffiths, G.L.; Choyke, P.L. 89Zr-oxine complex PET cell imaging in monitoring cell-based therapies. Radiology 2015, 275, 490. [Google Scholar] [CrossRef] [PubMed] [Green Version]
- Kurebayashi, Y.; Choyke, P.L.; Sato, N. Imaging of cell-based therapy using 89Zr-oxine ex vivo cell labeling for positron emission tomography. Nanotheranostics 2021, 5, 27. [Google Scholar] [CrossRef] [PubMed]
- Pittet, M.J.; Grimm, J.; Berger, C.R.; Tamura, T.; Wojtkiewicz, G.; Nahrendorf, M.; Romero, P.; Swirski, F.K.; Weissleder, R. In vivo imaging of T cell delivery to tumors after adoptive transfer therapy. Proc. Natl. Acad. Sci. USA 2007, 104, 12457. [Google Scholar] [CrossRef] [Green Version]
- Najjar, A.M. Radiolabeling and imaging of adoptively transferred immune cells by positron emission tomography. Methods Mol. Biol. 2020, 2097, 267–272. [Google Scholar] [CrossRef]
- Adonai, N.; Nguyen, K.N.; Walsh, J.; Iyer, M.; Toyokuni, T.; Phelps, M.E.; McCarthy, T.; McCarthy, D.W.; Gambhir, S.S. Ex vivo cell labeling with 64Cu–pyruvaldehyde-bis(N4-methylthiosemicarbazone) for imaging cell trafficking in mice with positron-emission tomography. Proc. Natl. Acad. Sci. USA 2002, 99, 3030. [Google Scholar] [CrossRef] [Green Version]
- Hoffmann, S.H.L.; Maurer, A.; Reck, D.I.; Reischl, G.; Pichler, B.J.; Kneilling, M.; Griessinger, C.M. Murine lymphocyte labeling by 64Cu-antibody receptor targeting for in vivo cell trafficking by PET/CT. J. Vis. Exp. JoVE 2017, 2017, 55270. [Google Scholar] [CrossRef]
- Bressan, R.B.; Dewari, P.S.; Kalantzaki, M.; Gangoso, E.; Matjusaitis, M.; Garcia-Diaz, C.; Blin, C.; Grant, V.; Bulstrode, H.; Gogolok, S.; et al. Efficient CRISPR/Cas9-assisted gene targeting enables rapid and precise genetic manipulation of mammalian neural stem cells. Development 2017, 144, 635. [Google Scholar] [CrossRef] [Green Version]
- Ostrominski, J.W.; Yada, R.C.; Sato, N.; Klein, M.; Blinova, K.; Patel, D.; Valadez, R.; Palisoc, M.; Pittaluga, S.; Peng, K.W.; et al. CRISPR/Cas9–mediated introduction of the sodium/iodide symporter gene enables noninvasive in vivo tracking of induced pluripotent stem cell–derived cardiomyocytes. Stem Cells Transl. Med. 2020, 9, 1203. [Google Scholar] [CrossRef]
- Min, J.J.; Iyer, M.; Gambhir, S.S. Comparison of [18F]FHBG and [14C]FIAU for imaging of HSV1-tk reporter gene expression: Adenoviral infection vs stable transfection. Eur. J. Nucl. Med. Mol. Imaging 2003, 30, 1547–1560. [Google Scholar] [CrossRef]
- Li, X.; Yin, G.; Ji, W.; Liu, J.; Zhang, Y.; Wang, J.; Zhu, X.; Zhu, L.; Dai, D.; Ma, W.; et al. 18F-FHBG PET-CT reporter gene imaging of adoptive CIK cell transfer immunotherapy for breast cancer in a mouse model. OncoTargets Ther. 2020, 13, 11659. [Google Scholar] [CrossRef] [PubMed]
- Mangner, T.J.; Klecker, R.W.; Anderson, L.; Shields, A.F. Synthesis of 2′-deoxy-2′-[18F]fluoro-β-D-arabinofuranosyl nucleosides, [18F]FAU, [18F]FMAU, [18F]FBAU and [18F]FIAU, as potential PET agents for imaging cellular proliferation: Synthesis of [18F]labelled FAU, FMAU, FBAU, FIAU. Nucl. Med. Biol. 2003, 30, 215–224. [Google Scholar] [CrossRef]
- Cavaliere, A.; Probst, K.C.; Paisey, S.J.; Marshall, C.; Dheere, A.K.H.; Aigbirhio, F.; McGuigan, C.; Westwell, A.D. Radiosynthesis of [18F]-labelled pro-nucleotides (ProTides). Molecules 2020, 25, 704. [Google Scholar] [CrossRef] [PubMed] [Green Version]
- Najjar, A.M.; Manuri, P.R.; Olivares, S.; Flores, L.; Mi, T.; Huls, H.; Shpall, E.J.; Champlin, R.E.; Turkman, N.; Paolillo, V.; et al. Imaging of sleeping beauty-modified CD19-specific T cells expressing HSV1-thymidine kinase by positron emission tomography. Mol. Imaging Biol. 2016, 18, 838. [Google Scholar] [CrossRef] [Green Version]
- Alauddin, M.M.; Conti, P.S.; Mazza, S.M.; Hamzeh, F.M.; Lever, J.R. Synthesis of 9-[(3-[18F]-fluoro-1-hydroxy-2-propoxy)methyl]guanine ([18F]-FHPG): A potential imaging agent of viral infection and gene therapy using PET. Nucl. Med. Biol. 1996, 23, 787–792. [Google Scholar] [CrossRef]
- Chang, C.W.; Lin, M.; Wu, S.Y.; Hsieh, C.H.; Liu, R.S.; Wang, S.J.; Huang, K.L.; Chen, C.H.; Wang, H.E. A high yield robotic synthesis of 9-(4-[18F]-fluoro-3-hydroxymethylbutyl)guanine([18F]FHBG) and 9-[(3-[18F]fluoro-1-hydroxy-2-propoxy)methyl]guanine([18F] FHPG) for gene expression imaging. Appl. Radiat. Isot. 2007, 65, 57–63. [Google Scholar] [CrossRef]
- Aarntzen, E.H.J.G.; Srinivas, M.; de Wilt, J.H.W.; Jacobs, J.F.M.; Lesterhuis, W.J.; Windhorst, A.D.; Troost, E.G.; Bonenkamp, J.J.; van Rossum, M.M.; Blokx, W.A.M.; et al. Early identification of antigen-specific immune responses in vivo by [18F]-labeled 3’-fluoro-3’-deoxy-thymidine ([18F]FLT) PET imaging. Proc. Natl. Acad. Sci. USA 2011, 108, 18396–18399. [Google Scholar] [CrossRef] [Green Version]
- Huang, H.L.; Chiang, L.W.; Chen, J.R.; Yang, W.K.; Jeng, K.C.; Chen, J.T.; Duh, T.S.; Lin, W.J.; Farn, S.S.; Chiang, C.S.; et al. Study of [18F]FLT and [123I]IaraU for cellular imaging in HSV1 tk-transfected murine fibrosarcoma cells: Evaluation of the tracer uptake using 5-fluoro, 5-iodo and 5-iodovinyl arabinosyl uridines as competitive probes. Nucl. Med. Biol. 2012, 39, 371–376. [Google Scholar] [CrossRef]
- Alauddin, M.M.; Shahinian, A.; Gordon, E.M.; Conti, P.S. Evaluation of 2′-Deoxy-2′-Flouro-5-Methyl-1-β-d-Arabinofuranosyluracil as a potential gene imaging agent for HSV-tk expression in vivo. Mol. Imaging 2002, 1, 74–81. [Google Scholar] [CrossRef]
- Li, J.; van Valkenburgh, J.; Conti, P.S.; Chen, K. Exploring solvent effects in the radiosynthesis of 18F-Labeled thymidine analogues toward clinical translation for positron emission tomography imaging. ACS Pharmacol. Transl. Sci. 2021, 4, 266–275. [Google Scholar] [CrossRef]
- Tjuvajev, J.G.; Avril, N.; Oku, T.; Sasajima, T.; Miyagawa, T.; Joshi, R.; Safer, M.; Beattie, B.; DiResta, G.; Daghighian, F.; et al. Imaging herpes virus thymidine kinase gene transfer and expression by positron emission tomography. Cancer Res. 1998, 58, 4333–4341. [Google Scholar] [PubMed]
- Cho, S.Y.; Rowe, S.P.; Jain, S.K.; Schon, L.C.; Yung, R.C.; Nayfeh, T.A.; Bingham, C.O.; Foss, C.A.; Nimmagadda, S.; Pomper, M.G. Evaluation of Musculoskeletal and Pulmonary Bacterial Infections With [124I]FIAU PET/CT. Mol. Imaging 2020, 19, 1536012120936876. [Google Scholar] [CrossRef] [PubMed]
- Nishii, R.; Volgin, A.Y.; Mawlawi, O.; Mukhopadhyay, U.; Pal, A.; Bornmann, W.; Gelovani, J.G.; Alauddin, M.M. Evaluation of 2′-deoxy-2′-[18F]fluoro-5-methyl-1- β-l-arabinofuranosyluracil ([18F]-l-FMAU) as a PET imaging agent for cellular proliferation: Comparison with [18F]-d-FMAU and [ 18F]FLT. Eur. J. Nucl. Med. Mol. Imaging 2008, 35, 990–998. [Google Scholar] [CrossRef] [PubMed]
- Lee, J.T.; Zhang, H.; Moroz, M.A.; Likar, Y.; Shenker, L.; Sumzin, N.; Lobo, J.; Zurita, J.; Collins, J.; van Dam, R.M.; et al. Comparative analysis of human nucleoside kinase-based reporter systems for PET imaging. Mol. Imaging Biol. 2016, 19, 100–108. [Google Scholar] [CrossRef] [PubMed] [Green Version]
- Terrovitis, J.; Kwok, K.F.; Lautamäki, R.; Engles, J.M.; Barth, A.S.; Kizana, E.; Miake, J.; Leppo, M.K.; Fox, J.; Seidel, J.; et al. Ectopic expression of the sodium-iodide symporter enables imaging of transplanted cardiac stem cells in vivo by single-photon emission computed tomography or positron emission tomography. J. Am. Coll. Cardiol. 2008, 52, 1652–1660. [Google Scholar] [CrossRef] [PubMed] [Green Version]
- Volpe, A.; Lang, C.; Lim, L.; Man, F.; Kurtys, E.; Ashmore-Harris, C.; Johnson, P.; Skourti, E.; de Rosales, R.T.M.; Fruhwirth, G.O. Spatiotemporal PET imaging reveals differences in CAR-t tumor retention in triple-negative breast cancer models. Mol. Ther. 2020, 28, 2271. [Google Scholar] [CrossRef] [PubMed]
- Park, S.; Shevlin, E.; Vedvyas, Y.; Zaman, M.; Park, S.; Hsu, Y.M.S.; Min, I.M.; Jin, M.M. Micromolar affinity CAR T cells to ICAM-1 achieves rapid tumor elimination while avoiding systemic toxicity. Sci. Rep. 2017, 7, 14366. [Google Scholar] [CrossRef] [PubMed] [Green Version]
- Vedvyas, Y.; Shevlin, E.; Zaman, M.; Min, I.M.; Amor-Coarasa, A.; Park, S.; Park, S.; Kwon, K.-W.; Smith, T.; Luo, Y.; et al. Longitudinal PET imaging demonstrates biphasic CAR T cell responses in survivors. JCI Insight 2016, 1, e90064. [Google Scholar] [CrossRef] [PubMed]
- Moroz, M.A.; Zhang, H.; Lee, J.; Moroz, E.; Zurita, J.; Shenker, L.; Serganova, I.; Blasberg, R.; Ponomarev, V. Comparative analysis of T cell imaging with human nuclear reporter genes. J. Nucl. Med. 2015, 56, 1055. [Google Scholar] [CrossRef] [Green Version]
- Sellmyer, M.A.; Lee, I.; Hou, C.; Lieberman, B.P.; Zeng, C.; Mankoff, D.A.; Mach, R.H. Quantitative PET reporter gene imaging with [11C] trimethoprim. Mol. Ther. 2017, 25, 120. [Google Scholar] [CrossRef] [Green Version]
- Shao, F.; Long, Y.; Ji, H.; Jiang, D.; Lei, P.; Lan, X. Radionuclide-based molecular imaging allows CAR-T cellular visualization and therapeutic monitoring. Theranostics 2021, 11, 6800. [Google Scholar] [CrossRef]
- Sellmyer, M.A.; Richman, S.A.; Lohith, K.; Hou, C.; Weng, C.C.; Mach, R.H.; O’Connor, R.S.; Milone, M.C.; Farwell, M.D. Imaging CAR T cell trafficking with eDHFR as a PET reporter gene. Mol. Ther. 2020, 28, 42. [Google Scholar] [CrossRef] [PubMed]
- Rowe, S.P.; Gage, K.L.; Faraj, S.F.; Macura, K.J.; Cornish, T.C.; Gonzalez-Roibon, N.; Guner, G.; Munari, E.; Partin, A.W.; Pavlovich, C.P.; et al. 18F-DCFBC PET/CT for PSMA-based detection and characterization of primary prostate cancer. J. Nucl. Med. 2015, 56, 1003. [Google Scholar] [CrossRef] [PubMed] [Green Version]
- Kesch, C.; Kratochwil, C.; Mier, W.; Kopka, K.; Giesel, F.L. 68Ga or 18F for Prostate Cancer Imaging? J. Nucl. Med. 2017, 58, 687–688. [Google Scholar] [CrossRef] [PubMed] [Green Version]
- Giesel, F.L.; Knorr, K.; Spohn, F.; Will, L.; Maurer, T.; Flechsig, P.; Neels, O.; Schiller, K.; Amaral, H.; Weber, W.A.; et al. Detection efficacy of 18F-PSMA-1007 PET/CT in 251 patients with biochemical recurrence of prostate cancer after radical prostatectomy. J. Nucl. Med. 2019, 60, 362. [Google Scholar] [CrossRef] [PubMed] [Green Version]
- Lv, G.; Sun, X.; Qiu, L.; Sun, Y.; Li, K.; Liu, Q.; Zhao, Q.; Qin, S.; Lin, J. PET imaging of tumor PD-L1 Expression with a highly specific nonblocking single-domain antibody. J. Nucl. Med. 2020, 61, 117. [Google Scholar] [CrossRef]
- Rashidian, M.; Ingram, J.R.; Dougan, M.; Dongre, A.; Whang, K.A.; LeGall, C.; Cragnolini, J.J.; Bierie, B.; Gostissa, M.; Gorman, J.; et al. Predicting the response to CTLA-4 blockade by longitudinal noninvasive monitoring of CD8 T cells. J. Exp. Med. 2017, 214, 2243. [Google Scholar] [CrossRef]
- Tavaré, R.; McCracken, M.N.; Zettlitz, K.A.; Knowles, S.M.; Salazar, F.B.; Olafsen, T.; Witte, O.N.; Wu, A.M. Engineered antibody fragments for immuno-PET imaging of endogenous CD8 + T cells in vivo. Proc. Natl. Acad. Sci. USA 2014, 111, 1108–1113. [Google Scholar] [CrossRef] [Green Version]
- Nagle, V.L.; Henry, K.E.; Hertz, C.A.J.; Graham, M.S.; Campos, C.; Parada, L.F.; Pandit-Taskar, N.; Schietinger, A.; Mellinghoff, I.K.; Lewis, J.S. Imaging tumor-infiltrating lymphocytes in brain tumors with [64 Cu]Cu-NOTA-anti-CD8 PET. Clin. Cancer Res. 2021, 27, 1958–1966. [Google Scholar] [CrossRef]
- Kasten, B.B.; Houson, H.A.; Coleman, J.M.; Leavenworth, J.W.; Markert, J.M.; Wu, A.M.; Salazar, F.; Tavaré, R.; Massicano, A.V.F.; Gillespie, G.Y.; et al. Positron emission tomography imaging with 89Zr-labeled anti-CD8 cys-diabody reveals CD8+ cell infiltration during oncolytic virus therapy in a glioma murine model. Sci. Rep. 2021, 11, 15384. [Google Scholar] [CrossRef]
- Tavaré, R.; Escuin-Ordinas, H.; Mok, S.; McCracken, M.N.; Zettlitz, K.A.; Salazar, F.B.; Witte, O.N.; Ribas, A.; Wu, A.M. An effective immuno-PET imaging method to monitor CD8-dependent responses to immunotherapy. Cancer Res. 2016, 76, 73. [Google Scholar] [CrossRef] [PubMed] [Green Version]
- Tavaré, R.; McCracken, M.N.; Zettlitz, K.A.; Salazar, F.B.; Olafsen, T.; Witte, O.N.; Wu, A.M. ImmunoPET of murine T cell reconstitution post-adoptive stem cell transplant using anti-CD4 and anti-CD8 cys-diabodies. J. Nucl. Med. 2015, 56, 1258. [Google Scholar] [CrossRef] [Green Version]
- Olafsen, T.; Torgov, M.; Zhang, G.G.; Romero, J.; Zampila, C.; Marchioni, F.; Jiang, K.; Gudas, J.; Satpayev, D. Pet imaging of cytotoxic human T cells using an 89Zr-labeled anti-CD8 minibody. J. Immunother. Cancer 2015, 3, P388. [Google Scholar] [CrossRef] [Green Version]
- Mattila, J.T.; Beaino, W.; Maiello, P.A.; Coleman, M.T.; White, A.G.; Scanga, C.A.; Flynn, J.L.; Anderson, C.J. PET imaging of macaques with tuberculosis identifies temporal changes in granuloma glucose metabolism and integrin α4β1-expressing immune cells. J. Immunol. 2017, 199, 806. [Google Scholar] [CrossRef] [Green Version]
- Bellavia, M.C.; Nyiranshuti, L.; Latoche, J.D.; van Ho, K.; Fecek, R.J.; Taylor, J.L.; Day, K.E.; Nigam, S.; Pun, M.; Gallazzi, F.; et al. PET Imaging of VLA-4 in a new BRAF V600E mouse model of melanoma. Mol. Imaging Biol. 2021, 9, 1–9. [Google Scholar] [CrossRef]
- Mall, S.; Yusufi, N.; Wagner, R.; Klar, R.; Bianchi, H.; Steiger, K.; Straub, M.; Audehm, S.; Laitinen, I.; Aichler, M.; et al. Immuno-PET imaging of engineered human T cells in tumors. Cancer Res. 2016, 76, 4113–4123. [Google Scholar] [CrossRef] [PubMed] [Green Version]
- Griessinger, C.M.; Maurer, A.; Kesenheimer, C.; Kehlbach, R.; Reischl, G.; Ehrlichmann, W.; Bukala, D.; Harant, M.; Cay, F.; Brück, J.; et al. 64Cu antibody-targeting of the T-cell receptor and subsequent internalization enables in vivo tracking of lymphocytes by PET. Proc. Natl. Acad. Sci. USA 2015, 112, 1161–1166. [Google Scholar] [CrossRef] [Green Version]
- Gosmann, D.; Russelli, L.; Weber, W.A.; Schwaiger, M.; Krackhardt, A.M.; D’Alessandria, C. Promise and challenges of clinical non-invasive T-cell tracking in the era of cancer immunotherapy. EJNMMI Res. 2022, 12, 5. [Google Scholar] [CrossRef]
- van Elssen, C.H.M.J.; Rashidian, M.; Vrbanac, V.; Wucherpfennig, K.W.; el Habre, Z.; Sticht, J.; Freund, C.; Jacobsen, J.T.; Cragnolini, J.; Ingram, J.; et al. Noninvasive imaging of human immune responses in a human xenograft model of graft-versus-host disease. J. Nucl. Med. 2017, 58, 1003. [Google Scholar] [CrossRef] [Green Version]
- Galli, F.; Rapisarda, A.S.; Stabile, H.; Malviya, G.; Manni, I.; Bonanno, E.; Piaggio, G.; Gismondi, A.; Santoni, A.; Signore, A. In vivo imaging of natural killer cell trafficking in tumors. J. Nucl. Med. 2015, 56, 1575–1580. [Google Scholar] [CrossRef] [Green Version]
- Higashikawa, K.; Yagi, K.; Watanabe, K.; Kamino, S.; Ueda, M.; Hiromura, M.; Enomoto, S. 64Cu-DOTA-Anti-CTLA-4 mAb enabled PET visualization of CTLA-4 on the T-cell infiltrating tumor tissues. PLoS ONE 2014, 9, e109866. [Google Scholar] [CrossRef] [PubMed]
- Goggi, J.L.; Tan, Y.X.; Hartimath, S.v.; Jieu, B.; Hwang, Y.Y.; Jiang, L.; Boominathan, R.; Cheng, P.; Yuen, T.Y.; Chin, H.X.; et al. Granzyme B PET imaging of immune checkpoint inhibitor combinations in colon cancer phenotypes. Mol. Imaging Biol. 2020, 22, 1392. [Google Scholar] [CrossRef] [PubMed]
- Radu, C.G.; Shu, C.J.; Nair-Gill, E.; Shelly, S.M.; Barrio, J.R.; Satyamurthy, N.; Phelps, M.E.; Witte, O.N. Molecular imaging of lymphoid organs and immune activation using positron emission tomography with a new 18F-labeled 2′-deoxycytidine analog. Nat. Med. 2008, 14, 783. [Google Scholar] [CrossRef] [PubMed] [Green Version]
- Scarpelli, M.; Zahm, C.; Perlman, S.; McNeel, D.G.; Jeraj, R.; Liu, G. FLT PET/CT imaging of metastatic prostate cancer patients treated with pTVG-HP DNA vaccine and pembrolizumab. J. Immunother. Cancer 2019, 7, 23. [Google Scholar] [CrossRef]
- Tuomela, K.; Ambrose, A.R.; Davis, D.M. Escaping death: How cancer cells and infected cells resist cell-mediated cytotoxicity. Front. Immunol. 2022, 13, 867098. [Google Scholar] [CrossRef]
- Hartimath, S.V.; Ramasamy, B.; Xuan, T.Y.; Rong, T.J.; Khanapur, S.; Cheng, P.; Hwang, Y.Y.; Robins, E.G.; Goggi, J.L. Granzyme B PET imaging in response to in situ vaccine therapy combined with αPD1 in a murine colon cancer model. Pharmaceutics 2022, 14, 150. [Google Scholar] [CrossRef]
- Janiszewski, T.; Kołt, S.; Kaiserman, D.; Snipas, S.J.; Li, S.; Kulbacka, J.; Saczko, J.; Bovenschen, N.; Salvesen, G.; Drag, M.; et al. Noninvasive optical detection of granzyme B from natural killer cells with enzyme-activated fluorogenic probes. J. Biol. Chem. 2020, 295, 9567–9582. [Google Scholar] [CrossRef]
- Larimer, B.M.; Bloch, E.; Nesti, S.; Austin, E.E.; Wehrenberg-Klee, E.; Boland, G.; Mahmood, U. The effectiveness of checkpoint inhibitor combinations and administration timing can be measured by Granzyme B PET imaging. Clin. Cancer Res. 2019, 25, 1196. [Google Scholar] [CrossRef] [Green Version]
- Fersing, C.; Bouhlel, A.; Cantelli, C.; Garrigue, P.; Lisowski, V.; Guillet, B. A comprehensive review of non-covalent radiofluorination approaches using aluminum [18F]fluoride: Will [18F]AlF replace 68Ga for metal chelate labeling? Molecules 2019, 24, 2866. [Google Scholar] [CrossRef] [Green Version]
- Casciola-Rosen, L.; Garcia-Calvo, M.; Bull, H.G.; Becker, J.W.; Hines, T.; Thornberry, N.A.; Rosen, A. Mouse and human Granzyme B have distinct tetrapeptide specificities and abilities to recruit the bid pathway. J. Biol. Chem. 2007, 282, 4545–4552. [Google Scholar] [CrossRef] [Green Version]
- Ren, H.; Li, X.; Zhao, Y.; Zhang, Y.; Du, N. Tumor necrosis factor α stimulates her-2 cleavage by activated caspase-8. Cell. Physiol Biochem. 2012, 30, 889–897. [Google Scholar] [CrossRef]
- Zhao, N.; Bardine, C.; Lourenço, A.L.; Wang, Y.H.; Huang, Y.; Cleary, S.J.; Wilson, D.M.; Oh, D.Y.; Fong, L.; Looney, M.R.; et al. In vivo measurement of granzyme proteolysis from activated immune cells with PET. ACS Cent. Sci. 2021, 7, 1638. [Google Scholar] [CrossRef] [PubMed]
- Gibson, H.M.; McKnight, B.N.; Malysa, A.; Dyson, G.; Wiesend, W.N.; McCarthy, C.E.; Reyes, J.; Wei, W.Z.; Viola-Villegas, N.T. Interferon-γ PET imaging as a predictive tool for monitoring response to tumor immunotherapy. Cancer Res. 2018, 78, 5706. [Google Scholar] [CrossRef] [PubMed] [Green Version]
- Zaidi, M.R.; Merlino, G. The two faces of interferon-g in cancer. Clin Cancer Res. 2011, 17, 6118–6124. [Google Scholar] [CrossRef] [PubMed] [Green Version]
- di Gialleonardo, V.; Signore, A.; Glaudemans, A.W.J.M.; Dierckx, R.A.J.O.; de Vries, E.F.J. N-(4-18F-Fluorobenzoyl)Interleukin-2 for PET of human-activated T lymphocytes. J. Nucl. Med. 2012, 53, 679–686. [Google Scholar] [CrossRef] [PubMed] [Green Version]
- D’Alessandria, C.; di Gialleonardo, V.; Chianelli, M.; Mather, S.J.; de Vries, E.F.J.; Scopinaro, F.; Dierck, R.A.; Signore, A. Synthesis and optimization of the labeling procedure of 99mtc-hynic-interleukin-2 for in vivo imaging of activated t lymphocytes. Mol. Imaging Biol. 2010, 12, 539. [Google Scholar] [CrossRef]
- Signore, A.; Annovazzi, A.; Barone, R.; Bonanno, E.; D’alessandria, C.; Chianelli, M.; Mather, S.J.; Bottoni, U.; Chiara Panetta, D.; Innocenzi, F.; et al. 99m Tc-interleukin-2 scintigraphy as a potential tool for evaluating tumor-infiltrating lymphocytes in melanoma lesions: A validation study. Clin. Trial 2004, 45, 1647–1652. [Google Scholar]
- Loose, D.; Signore, A.; Staelens, L.; Bulcke, K.v.; Vermeersch, H.; Dierckx, R.A.; Bonanno, E.; van de Wiele, C. 123I-Interleukin-2 uptake in squamous cell carcinoma of the head and neck carcinoma. Eur. J. Nucl. Med. Mol. Imaging 2008, 35, 281–286. [Google Scholar] [CrossRef] [Green Version]
- Werner, R.A.; Chen, X.; Hirano, M.; Rowe, S.P.; Lapa, C.; Javadi, M.S.; Higuchi, T. SPECT vs. PET in cardiac innervation imaging: Clash of the titans. Clin. Transl. Imaging 2018, 6, 293. [Google Scholar] [CrossRef] [Green Version]
- van de Donk, P.P.; Wind, T.T.; Hooiveld-Noeken, J.S.; van der Veen, E.L.; Glaudemans, A.W.J.M.; Diepstra, A.; Jalving, M.; de Vries, E.G.E.; de Vries, E.F.J.; Hospers, G.A.P. Interleukin-2 PET imaging in patients with metastatic melanoma before and during immune checkpoint inhibitor therapy. Eur. J. Nucl. Med. Mol. Imaging 2021, 48, 4369. [Google Scholar] [CrossRef]
- van der Veen, E.L.; Antunes, I.F.; Maarsingh, P.; Hessels-Scheper, J.; Zijlma, R.; Boersma, H.H.; Jorritsma-Smit, A.; Hospers, G.A.P.; de Vries, E.G.E.; Hooge, M.N.L.; et al. Clinical-grade N-(4-[18F]fluorobenzoyl)-interleukin-2 for PET imaging of activated T-cells in humans. EJNMMI Radiopharm. Chem. 2019, 4, 15. [Google Scholar] [CrossRef] [PubMed] [Green Version]
- Cleeren, F.; Lecina, J.; Ahamed, M.; Raes, G.; Devoogdt, N.; Caveliers, V.; McQuade, P.; Rubins, D.J.; Li, W.; Verbruggen, A.; et al. Al18F-labeling of heat-sensitive biomolecules for positron emission tomography imaging. Theranostics 2017, 7, 2924. [Google Scholar] [CrossRef] [PubMed]
- van der Veen, E.L.; Suurs, F.v.; Cleeren, F.; Bormans, G.; Elsinga, P.H.; Hospers, G.A.P.; Hooge, M.N.L.; de Vries, E.G.E.; de Vries, E.F.J.; Antunes, I.F. Development and evaluation of interleukin-2–derived radiotracers for PET imaging of T cells in mice. J. Nucl. Med. 2020, 61, 1355. [Google Scholar] [CrossRef] [PubMed]
- Xu, C.; Nunes, J.A.; Viola, A.; Zumerle, S.; Molon, B. Membrane rafts in T cell activation: A spotlight on CD28 costimulation. Front. Immunol. 2017, 8, 1467. [Google Scholar] [CrossRef]
- Simonetta, F.; Alam, I.S.; Lohmeyer, J.K.; Sahaf, B.; Good, Z.; Chen, W.; Xiao, Z.; Hirai, T.; Scheller, L.; Engels, P.; et al. Molecular imaging of chimeric antigen receptor T cells by ICOS-ImmunoPET. Clin. Cancer Res. 2021, 27, 1058. [Google Scholar] [CrossRef]
- Turaj, A.H.; Cox, K.L.; Penfold, C.A.; French, R.R.; Mockridge, C.I.; Willoughby, J.E.; Tutt, A.L.; Griffiths, J.; Johnson, P.W.M.; Glennie, M.J.; et al. Augmentation of CD134 (OX40)-dependent NK anti-tumor activity is dependent on antibody cross-linking. Sci. Rep. 2018, 8, 2278. [Google Scholar] [CrossRef] [Green Version]
- Alam, I.S.; Mayer, A.T.; Sagiv-Barfi, I.; Wang, K.; Vermesh, O.; Czerwinski, D.K.; Johnson, E.M.; James, M.L.; Levy, R.; Gambhir, S.S. Imaging activated T cells predicts response to cancer vaccines. J. Clin. Investig. 2018, 128, 2569. [Google Scholar] [CrossRef]
- Nobashi, T.W.; Mayer, A.T.; Xiao, Z.; Chan, C.T.; Chaney, A.M.; James, M.L.; Gambhir, S.S. Whole-body PET imaging of T-cell response to glioblastoma. Clin. Cancer Res. 2021, 27, 6445–6456. [Google Scholar] [CrossRef]
- Pinheiro, P.F.; Justino, G.C.; Marques, M.M. NKp30—A prospective target for new cancer immunotherapy strategies. Br. J. Pharmacol. 2020, 177, 4563. [Google Scholar] [CrossRef]
- Griffith, D.A.; Jarvis, S.M. Nucleoside and nucleobase transport systems of mammalian cells. Biochim. Biophys. Acta Rev. Biomembr. 1996, 1286, 153–181. [Google Scholar] [CrossRef]
- Wik, J.A.; Skålhegg, B.S. T cell metabolism in infection. Front. Immunol. 2022, 13, 840610. [Google Scholar] [CrossRef] [PubMed]
- Abousaway, O.; Rakhshandehroo, T.; van den Abbeele, A.D.; Kircher, M.F.; Rashidian, M. Noninvasive imaging of cancer immunotherapy. Nanotheranostics 2021, 5, 90. [Google Scholar] [CrossRef] [PubMed]
- Namavari, M.; Chang, Y.F.; Kusler, B.; Yaghoubi, S.; Mitchell, B.S.; Gambhir, S.S. Synthesis of 2’-Deoxy-2’-[18F]fluoro-9-β-D arabinofuranosylguanine: A novel agent for imaging T-cell activation with PET. Mol. Imaging Biol. 2011, 13, 812–818. [Google Scholar] [CrossRef]
- Bitter, E.E.; Townsend, M.H.; Erickson, R.; Allen, C.; O’Neill, K.L. Thymidine kinase 1 through the ages: A comprehensive review. Cell Biosci. 2020, 10, 138. [Google Scholar] [CrossRef] [PubMed]
- Been, L.B.; Suurmeijer, A.J.H.; Cobben, D.C.P.; Jager, P.L.; Hoekstra, H.J.; Elsinga, P.H. [18F]FLT-PET in oncology: Current status and opportunities. Eur. J. Nucl. Med. Mol. Imaging 2004, 31, 1659–1672. [Google Scholar] [CrossRef]
- Burchardt, E.; Warenczak-Florczak, Z.; Cegła, P.; Piotrowski, A.; Cybulski, Z.; Burchardt, W.; Roszak, A.; Cholewiński, W. Differences between [18F]FLT and [18F]FDG uptake in PET/CT imaging in CC depend on vaginal bacteriology. Diagnostics 2022, 12, 70. [Google Scholar] [CrossRef]
- Shu, C.J.; Campbell, D.O.; Lee, J.T.; Tran, A.Q.; Wengrod, J.C.; Witte, O.N.; Phelps, M.E.; Satyamurthy, N.; Czernin, J.; Radu, C.G. Novel PET probes specific for deoxycytidine kinase. J. Nucl. Med. 2010, 51, 1092–1098. [Google Scholar] [CrossRef] [Green Version]
- Schwarzenberg, J.; Radu, C.G.; Benz, M.; Fueger, B.; Tran, A.Q.; Phelps, M.E.; Witte, O.N.; Satyamurthy, N.; Czernin, J.; Schiepers, C. Human biodistribution and radiation dosimetry of novel PET probes targeting the deoxyribonucleoside salvage pathway. Eur. J. Nucl. Med. Mol. Imaging 2011, 38, 711. [Google Scholar] [CrossRef] [Green Version]
- Meyer, J.P.; Probst, K.C.; Trist, I.M.L.; McGuigan, C.; Westwell, A.D. A novel radiochemical approach to 1-(2’-deoxy-2’-[18F]fluoro-β-d-arabinofuranosyl)cytosine (18F-FAC). J. Label. Compd. Radiopharm. 2014, 57, 637–644. [Google Scholar] [CrossRef]
- Chen, B.Y.; Ghezzi, C.; Villegas, B.; Quon, A.; Radu, C.G.; Witte, O.N.; Clark, P.M. 18F-FAC PET visualizes brain-infiltrating leukocytes in a mouse model of multiple sclerosis. J. Nucl. Med. 2020, 61, 757. [Google Scholar] [CrossRef] [Green Version]
- Sergeeva, O.; Kepe, V.; Zhang, Y.; Miller-Atkins, G.A.; Keynon, J.D.; Iyer, R.; Sexton, S.; Awadallah, A.; Xin, W.; Saunthararajah, Y.; et al. [18F] clofarabine for PET imaging of hepatocellular carcinoma. Cancers 2019, 11, 1748. [Google Scholar] [CrossRef] [PubMed] [Green Version]
- Mosessian, S.; Duarte-Vogel, S.M.; Stout, D.B.; Roos, K.P.; Lawson, G.W.; Jordan, M.C.; Ogden, A.; Matter, C.; Sadeghi, S.; Mills, G.Q.; et al. INDs for PET molecular imaging probes—Approach by an academic institution. Mol. Imaging Biol. 2014, 16, 441. [Google Scholar] [CrossRef] [PubMed] [Green Version]
- Kim, W.; Le, T.M.; Wei, L.; Poddar, S.; Bazzy, J.; Wang, X.; Uong, N.T.; Abt, E.R.; Capri, J.R.; Austin, W.R.; et al. [18F] CFA as a clinically translatable probe for PET imaging of deoxycytidine kinase activity. Proc. Natl. Acad. Sci. USA 2016, 113, 4027–4032. [Google Scholar] [CrossRef] [PubMed] [Green Version]
- Ronald, J.A.; Kim, B.S.; Gowrishankar, G.; Namavari, M.; Alam, I.S.; D’Souza, A.; Nishikii, H.; Chuang, H.Y.; Ilovich, O.; Lin, C.F.; et al. A PET imaging strategy to visualize activated T cells in acute graft-versus-host disease elicited by allogenic hematopoietic cell transplant. Cancer Res. 2017, 77, 2893. [Google Scholar] [CrossRef] [PubMed] [Green Version]
- Levi, J.; Lam, T.; Goth, S.R.; Yaghoubi, S.; Bates, J.; Ren, G.; Jivan, S.; Huynh, T.L.; Blecha, J.E.; Khattri, R.; et al. Imaging of activated T cells as an early predictor of immune response to anti-PD-1 therapy. Cancer Res. 2019, 79, 3455. [Google Scholar] [CrossRef] [Green Version]
- Guglielmetti, C.; Levi, J.; Huynh, T.L.; Tiret, B.; Blecha, J.; Tang, R.; van Brocklin, H.F.; Chaumeil, M.M. Longitudinal imaging of T-cells and inflammatory demyelination in a preclinical model of multiple sclerosis using 18F-FAraG PET and MRI. J. Nucl. Med. 2021, 63, 140–146. [Google Scholar] [CrossRef]
- Rha, M.S.; Shin, E.C. Activation or exhaustion of CD8+ T cells in patients with COVID-19. Cell. Mol. Immunol. 2021, 18, 2325. [Google Scholar] [CrossRef]
- Buckle, I.; Guillerey, C. Inhibitory receptors and immune checkpoints regulating natural killer cell responses to cancer. Cancers 2021, 13, 4263. [Google Scholar] [CrossRef]
- George, A.S.; Fernandez, C.J.; Eapen, D.; Pappachan, J.M. Organ-specific adverse events of immune checkpoint inhibitor therapy, with special reference to endocrinopathies. TouchREVIEWS Endocrinol. 2021, 17, 21. [Google Scholar] [CrossRef]
- Twomey, J.D.; Zhang, B. Cancer immunotherapy update: FDA-approved checkpoint inhibitors and companion diagnostics. AAPS J. 2021, 23, 39. [Google Scholar] [CrossRef]
- Takei, S.; Kawazoe, A.; Shitara, K. The new era of immunotherapy in gastric cancer. Cancers 2022, 14, 1054. [Google Scholar] [CrossRef] [PubMed]
- Natarajan, A.; Mayer, A.T.; Reeves, R.E.; Nagamine, C.M.; Gambhir, S.S. Development of novel ImmunoPET tracers to image human PD-1 checkpoint expression on tumor-infiltrating lymphocytes in a humanized mouse model. Mol. Imaging Biol. 2017, 19, 903–914. [Google Scholar] [CrossRef] [PubMed] [Green Version]
- Kok, I.C.; Hooiveld, J.S.; van de Donk, P.P.; Giesen, D.; van der Veen, E.L.; Hooge, M.N.L.; Brouwers, A.H.; Hiltermann, T.J.N.; van der Wekken, A.J.; Hijmering-Kappelle, L.B.M.; et al. 89Zr-pembrolizumab imaging as a non-invasive approach to assess clinical response to PD-1 blockade in cancer. Ann. Oncol. 2022, 33, 80–88. [Google Scholar] [CrossRef]
- Niemeijer, A.-L.N.; Oprea-Lager, D.E.; Huisman, M.C.; Hoekstra, O.S.; Boellaard, R.; der Veen, B.J.de.; Bahce, I.; Vugts, D.J.; van Dongen, G.A.; Thunnissen, E.; et al. First-in-human study of 89Zr-pembrolizumab PET/CT in patients with advanced stage non-small-cell lung cancer. J. Nucl. Med. 2021, 63, 362–367. [Google Scholar] [CrossRef] [PubMed]
- England, C.G.; Jiang, D.; Ehlerding, E.B.; Rekoske, B.T.; Ellison, P.A.; Hernandez, R.; Barnhart, T.E.; McNeel, D.G.; Huang, P.; Cai, W. 89Zr-labeled nivolumab for imaging of T-cell infiltration in a humanized murine model of lung cancer. Eur. J. Nucl. Med. Mol. Imaging 2018, 45, 110. [Google Scholar] [CrossRef]
- Cole, E.L.; Kim, J.; Donnelly, D.J.; Smith, R.A.; Cohen, D.; Lafont, V.; Morin, P.E.; Huang, R.Y.C.; Chow, P.L.; Hayes, W.; et al. Radiosynthesis and preclinical PET evaluation of 89Zr-nivolumab (BMS-936558) in healthy non-human primates. Bioorg. Med. Chem. 2017, 25, 5407–5414. [Google Scholar] [CrossRef] [PubMed]
- Niemeijer, A.N.; Leung, D.; Huisman, M.C.; Bahce, I.; Hoekstra, O.S.; van Dongen, G.A.M.S.; Boellaard, R.; Du, S.; Hayes, W.; Smith, R.; et al. Whole body PD-1 and PD-L1 positron emission tomography in patients with non-small-cell lung cancer. Nat. Commun. 2018, 9, 4664. [Google Scholar] [CrossRef]
- Contardi, E.; Palmisano, G.L.; Tazzari, P.L.; Martelli, A.M.; Falà, F.; Fabbi, M.; Kato, T.; Lucarelli, E.; Donati, D.; Polito, L.; et al. CTLA-4 is constitutively expressed on tumor cells and can trigger apoptosis upon ligand interaction. Int. J. Cancer 2005, 117, 538–550. [Google Scholar] [CrossRef]
- Miedema, I.H.; Zwezerijnen, G.J.; van Dongen, G.A.; Vugts, D.J.; Huisman, M.C.; Hoekstra, O.S.; de Gruijl, T.D.; Verheul, H.M.; Menke, C.W.; van den Eertwegh, A.J. Abstract 1136: Tumor uptake and biodistribution of 89Zirconium-labeled ipilimumab in patients with metastatic melanoma during ipilimumab treatment. Cancer Res. 2019, 79, 1136. [Google Scholar] [CrossRef]
- Ehlerding, E.B.; England, C.G.; Majewski, R.L.; Valdovinos, H.F.; Jiang, D.; Liu, G.; McNeel, D.G.; Nickles, R.J.; Cai, W. ImmunoPET imaging of CTLA-4 expression in mouse models of non-small cell lung cancer. Mol. Pharm. 2017, 14, 1782. [Google Scholar] [CrossRef] [Green Version]
- Ehlerding, E.B.; Lee, H.J.; Jiang, D.; Ferreira, C.A.; Zahm, C.D.; Huang, P.; Engle, J.W.; McNeel, D.G.; Cai, W. Antibody and fragment-based PET imaging of CTLA-4+ T-cells in humanized mouse models. Am. J. Cancer Res. 2019, 9, 53. Available online: https://0-www-ncbi-nlm-nih-gov.brum.beds.ac.uk/pmc/articles/PMC6356917/ (accessed on 28 January 2022). [PubMed]
- Mazor, Y.; Discovery, A.; Dovedi, S.J.; Elder, M.J.; Yang, C.; Sitnikova, S.I.; Irving, L.; Hansen, A.; Hair, J.; Jones, D.C.; et al. Design and efficacy of a Monovalent Bispecific PD-1/cTLa4 antibody That enhances cTLa4 Blockade on PD-1 + activated T cells. AACR J. Org Cancer Discov. 2021, 11, 1100–1117. [Google Scholar] [CrossRef]
- Zaremba, A.; Eggermont, A.M.M.; Robert, C.; Dummer, R.; Ugurel, S.; Livingstone, E.; Ascierto, P.A.; Long, G.v.; Schadendorf, D.; Zimmer, L. The concepts of rechallenge and retreatment with immune checkpoint blockade in melanoma patients. Eur. J. Cancer 2021, 155, 268–280. [Google Scholar] [CrossRef] [PubMed]
- Tawbi, H.A.; Schadendorf, D.; Lipson, E.J.; Ascierto, P.A.; Matamala, L.; Gutiérrez, E.C.; Rutkowski, P.; Gogas, H.J.; Lao, C.D.; de Menezes, J.J.; et al. Relatlimab and nivolumab versus nivolumab in untreated advanced melanoma. N. Engl. J. Med. 2022, 386, 24–34. [Google Scholar] [CrossRef] [PubMed]
- Kelly, M.P.; Tavare, R.; Giurleo, J.T.; Makonnen, S.; Hickey, C.; Danton, M.A.; Arnold, T.C.; Ma, D.; Dai, J.; Pei, J.; et al. Abstract 3033: Immuno-PET detection of LAG-3 expressing intratumoral lymphocytes using the zirconium-89 radiolabeled fully human anti-LAG-3 antibody REGN3767. Cancer Res. 2018, 78, 3033. [Google Scholar] [CrossRef]
- Friedlaender, A.; Addeo, A.; Banna, G. New emerging targets in cancer immunotherapy: The role of TIM3. ESMO Open 2019, 4, 497. [Google Scholar] [CrossRef] [Green Version]
- Ben-Shmuel, A.; Biber, G.; Barda-Saad, M. Unleashing natural killer cells in the tumor microenvironment–The next generation of immunotherapy? Front. Immunol. 2020, 11, 275. [Google Scholar] [CrossRef] [Green Version]
- Chauvin, J.M.; Zarour, H.M. TIGIT in cancer immunotherapy. J. Immunother. Cancer 2020, 8, 957. [Google Scholar] [CrossRef]
- Barrow, A.D.; Martin, C.J.; Colonna, M. The natural cytotoxicity receptors in health and disease. Front. Immunol. 2019, 10, 909. [Google Scholar] [CrossRef] [Green Version]
- Yap, M.L.; McFadyen, J.D.; Wang, X.; Zia, N.A.; Hohmann, J.D.; Ziegler, M.; Yao, Y.; Pham, A.; Harris, M.; Donnelly, P.S.; et al. Targeting activated platelets: A unique and potentially universal approach for cancer imaging. Theranostics 2017, 7, 2565. [Google Scholar] [CrossRef] [Green Version]
- Dun, Y.; Huang, G.; Liu, J.; Wei, W. ImmunoPET imaging of hematological malignancies: From preclinical promise to clinical reality. Drug Discov. Today 2021, 27, 1196–1203. [Google Scholar] [CrossRef] [PubMed]
- Stutvoet, T.S.; van der Veen, E.L.; Kol, A.; Antunes, I.F.; de Vries, E.F.J.; Hospers, G.A.P.; de Vries, E.G.E.; de Jong, S.; Hooge, L.-D.M.N. Molecular imaging of PD-L1 expression and dynamics with the adnectin-based PET tracer 18F-BMS-986192. J. Nucl. Med. 2020, 61, 1839–1844. [Google Scholar] [CrossRef] [PubMed]
- Robu, S.; Richter, A.; Gosmann, D.; Seidl, C.; Leung, D.; Hayes, W.; Cohen, D.; Morin, P.; Donnelly, D.J.; Lipovšek, D.; et al. Synthesis and preclinical evaluation of a 68Ga-labeled adnectin, 68Ga-BMS-986192, as a PET agent for imaging PD-L1 expression. J. Nucl. Med. 2021, 62, 1228–1234. [Google Scholar] [CrossRef] [PubMed]
- Vermeulen, K.; Vandamme, M.; Bormans, G.; Cleeren, F. Design and challenges of radiopharmaceuticals. Semin. Nucl. Med. 2019, 49, 339–356. [Google Scholar] [CrossRef]
- Lepareur, N. Cold kit labeling: The future of 68Ga radiopharmaceuticals? Front. Med. 2022, 9, 59. [Google Scholar] [CrossRef]
- Ajenjo, J.; Destro, G.; Cornelissen, B.; Gouverneur, V. Closing the gap between 19F and 18F chemistry. EJNMMI Radiopharm. Chem. 2021, 6, 33. [Google Scholar] [CrossRef]
- Kraeber-Bodéré, F.; Rousseau, C.; Bodet-Milin, C.; Frampas, E.; Faivre-Chauvet, A.; Rauscher, A.; Sharkey, R.M.; Goldenberg, D.M.; Chatal, J.F.; Barbet, J. A pretargeting system for tumor PET imaging and radioimmunotherapy. Front. Pharmacol. 2015, 6, 54. [Google Scholar] [CrossRef]
- Derks, Y.H.W.; Rijpkema, M.; Amatdjais-Groenen, H.I.V.; Loeff, C.C.; de Roode, K.E.; Kip, A.; Laverman, P.; Lütje, S.; Heskamp, S.; Löwik, D.W.P.M. Strain-promoted azide–alkyne cycloaddition-based PSMA-targeting ligands for multimodal intraoperative tumor detection of prostate cancer. Bioconjug. Chem. 2022, 33, 194–205. [Google Scholar] [CrossRef]
Figure 1.
Schematic illustration representing the different methods to image immune cells with PET and SPECT radiopharmaceuticals. (A) direct ex vivo labelling, (B) receptor gene imaging and (C) direct in vivo targeting. Created with Biorender.com.
Figure 1.
Schematic illustration representing the different methods to image immune cells with PET and SPECT radiopharmaceuticals. (A) direct ex vivo labelling, (B) receptor gene imaging and (C) direct in vivo targeting. Created with Biorender.com.

Figure 2.
Tracers that image cytotoxic immune cells’ functional state. Created with BioRender.com.


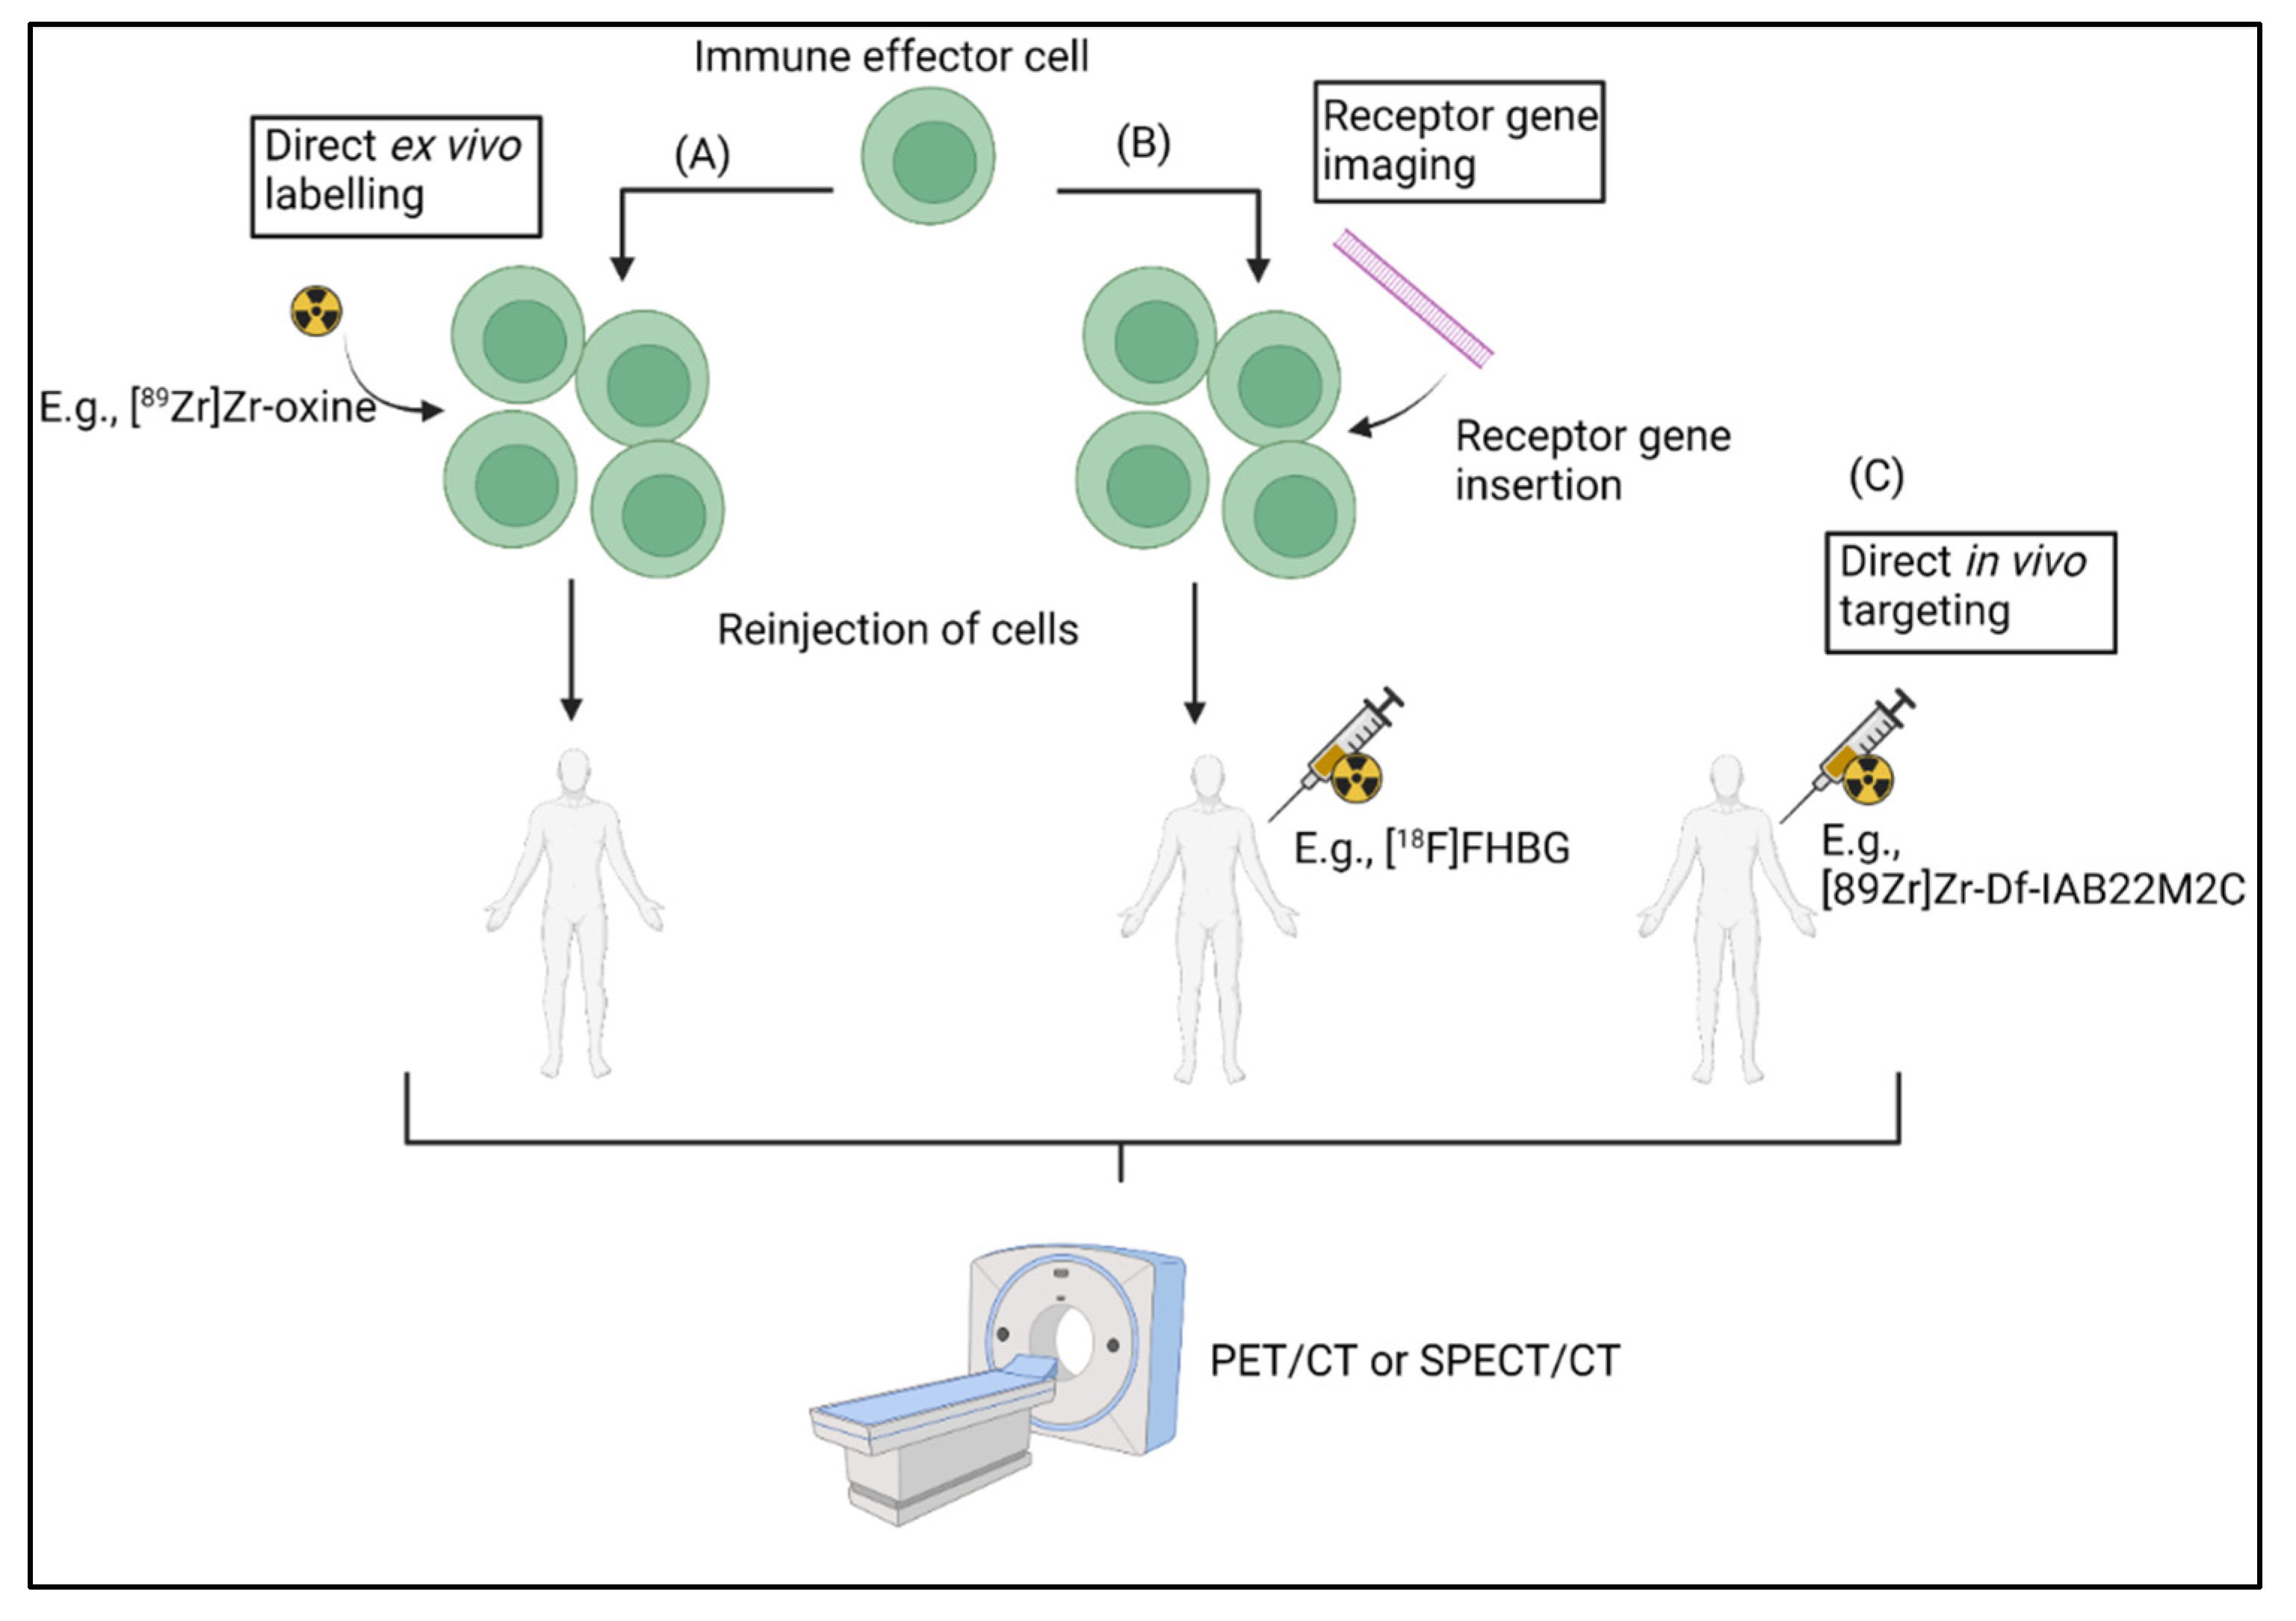
Table 1.
Tracers and targets of the direct ex vivo labelling method used in adoptive cell transfer.
| Direct Ex Vivo Labelling | |||
|---|---|---|---|
| Target | Tracer | Type | Stage |
| Metabolic tracer | [18F]FDG | Small molecule [39,41] | Clinical |
| Intracellular trapping | [89Zr]Zr-oxine | Small molecule [42,43] | Clinical |
| Intracellular trapping | [111In]In-oxine | Small molecule [39,44] | Clinical |
| Cell surface proteins | [89Zr]Zr-DFO-Bz-NCS | Small molecule [45] | Preclinical |
| Intracellular trapping | [64Cu]Cu-PTSM | Small molecule [46,47] | Preclinical |
Table 2.
Tracers and targets of the reporter gene method used in adoptive cell transfer.
| Reporter Gene Strategy | |||
|---|---|---|---|
| Reporter Gene | Tracer | Type | Stage |
| HSV1-TK | [18F]FHBG | Small molecule [50,51] | Clinical (NCT00185848) |
| [18F]FIAU | Small molecule [52,53] | Preclinical | |
| [18F]FEAU | Small molecule [54] | Preclinical | |
| [18F]FHPG | Small molecule [55,56] | Preclinical | |
| [18F]FLT | Small molecule [57,58] | Clinical (e.g., NCT00585741) | |
| [18F]FMAU | Small molecule [59,60] | Clinical (e.g., NCT04752267) | |
| [124I]FIAU | Small molecule [61,62] | Clinical (NCT01337466) | |
| hdCKDM | [18F]FEAU | Small molecule [54] | Preclinical |
| [124I]FIAU | Small molecule [61,62] | Clinical (NCT01337466) | |
| L-[18F]FMAU | Small molecule [63,64] | Preclinical | |
| Sodium iodide symporter (NIS) | [99mTc]pertechnate | Small molecule [32,65] | Clinical (e.g., NCT04563780) |
| [18F]FTB | Small molecule [66] | Preclinical | |
| Somatostatin receptor 2 (SSTR2) | [18F]AlF-NOTA-octreotide | Small molecule [67] | Clinical (e.g., NCT04552847) |
| [68Ga]Ga-DOTATOC | Small molecule [68] | Clinical (e.g., NCT02359500) | |
| Norepinephrine transporter (NET) | [18F]MFBG | Small molecule [69] | Clinical (e.g., NCT04258592) |
| [124I]MIBG | Small molecule [69] | Clinical (e.g., NCT01583842) | |
| eDHFR | [11C]TMP | Small molecule [70,71] | Preclinical |
| [18F]F-TMP | Small molecule [72] | Clinical (NCT04263792) | |
| PSMA | [18F]DCFPyL | ABP [33] | Clinical (NCT03424525) |
| [18F]F-DCFBC | Small molecule [73] | Clinical (e.g., NCT01815515) | |
| [18F]PSMA-1007 | peptide [74,75] | Clinical (e.g., NCT04487847) | |
Table 3.
Tracers and targets of the direct in vivo labelling method.
| Direct In Vivo Labelling | |||
|---|---|---|---|
| Target | Tracer | Type | Stage |
| CD8 | [89Zr]Zr-PEG20-x118-VHH | Heavy chain only IgG (VHH) [77] | Preclinical |
| [64Cu]Cu-NOTA-2.43 | Minibody (Mb) [78,79] | Preclinical | |
| [64Cu]Cu-NOTA-YTS169 | Mb [78,80] | Preclinical | |
| [89Zr]Zr-malDFO-169 | Mb [80,81] | Preclinical | |
| [89Zr]Zr-malDFO-2.43 | Bivalent antibody fragment (cDb) [79,82] | Preclinical | |
| [89Zr]Zr-DFO-IAB22M2C | Mb [83] | Clinical (NCT03802123, NCT03107663, NCT04955262) | |
| VLA-4 | [64Cu]Cu-LLP2A | Peptide [84,85] | Preclinical |
| TCR | [89Zr]Zr-DFO-aTCRmu-F(ab’)2 | Antibody (Ab) [34,86] | Preclinical |
| [64Cu]Cu-DOTA-cOVA-TCR | mAb [87,88] | Preclinical | |
| HLA-DR | 64Cu-labelled VHH | VHH [89] | Preclinical |
| NCAM (=CD56) (NK cells) | 99mTc-labelled anti-CD56 mAb | mAb [90] | preclinical |
Publisher’s Note: MDPI stays neutral with regard to jurisdictional claims in published maps and institutional affiliations. |
© 2022 by the authors. Licensee MDPI, Basel, Switzerland. This article is an open access article distributed under the terms and conditions of the Creative Commons Attribution (CC BY) license (https://creativecommons.org/licenses/by/4.0/).
Share and Cite
MDPI and ACS Style
Lauwerys, L.; Smits, E.; Van den Wyngaert, T.; Elvas, F. Radionuclide Imaging of Cytotoxic Immune Cell Responses to Anti-Cancer Immunotherapy. Biomedicines 2022, 10, 1074. https://0-doi-org.brum.beds.ac.uk/10.3390/biomedicines10051074
AMA Style
Lauwerys L, Smits E, Van den Wyngaert T, Elvas F. Radionuclide Imaging of Cytotoxic Immune Cell Responses to Anti-Cancer Immunotherapy. Biomedicines. 2022; 10(5):1074. https://0-doi-org.brum.beds.ac.uk/10.3390/biomedicines10051074
Chicago/Turabian StyleLauwerys, Louis, Evelien Smits, Tim Van den Wyngaert, and Filipe Elvas. 2022. "Radionuclide Imaging of Cytotoxic Immune Cell Responses to Anti-Cancer Immunotherapy" Biomedicines 10, no. 5: 1074. https://0-doi-org.brum.beds.ac.uk/10.3390/biomedicines10051074
Note that from the first issue of 2016, this journal uses article numbers instead of page numbers. See further details here.