Figure 1.
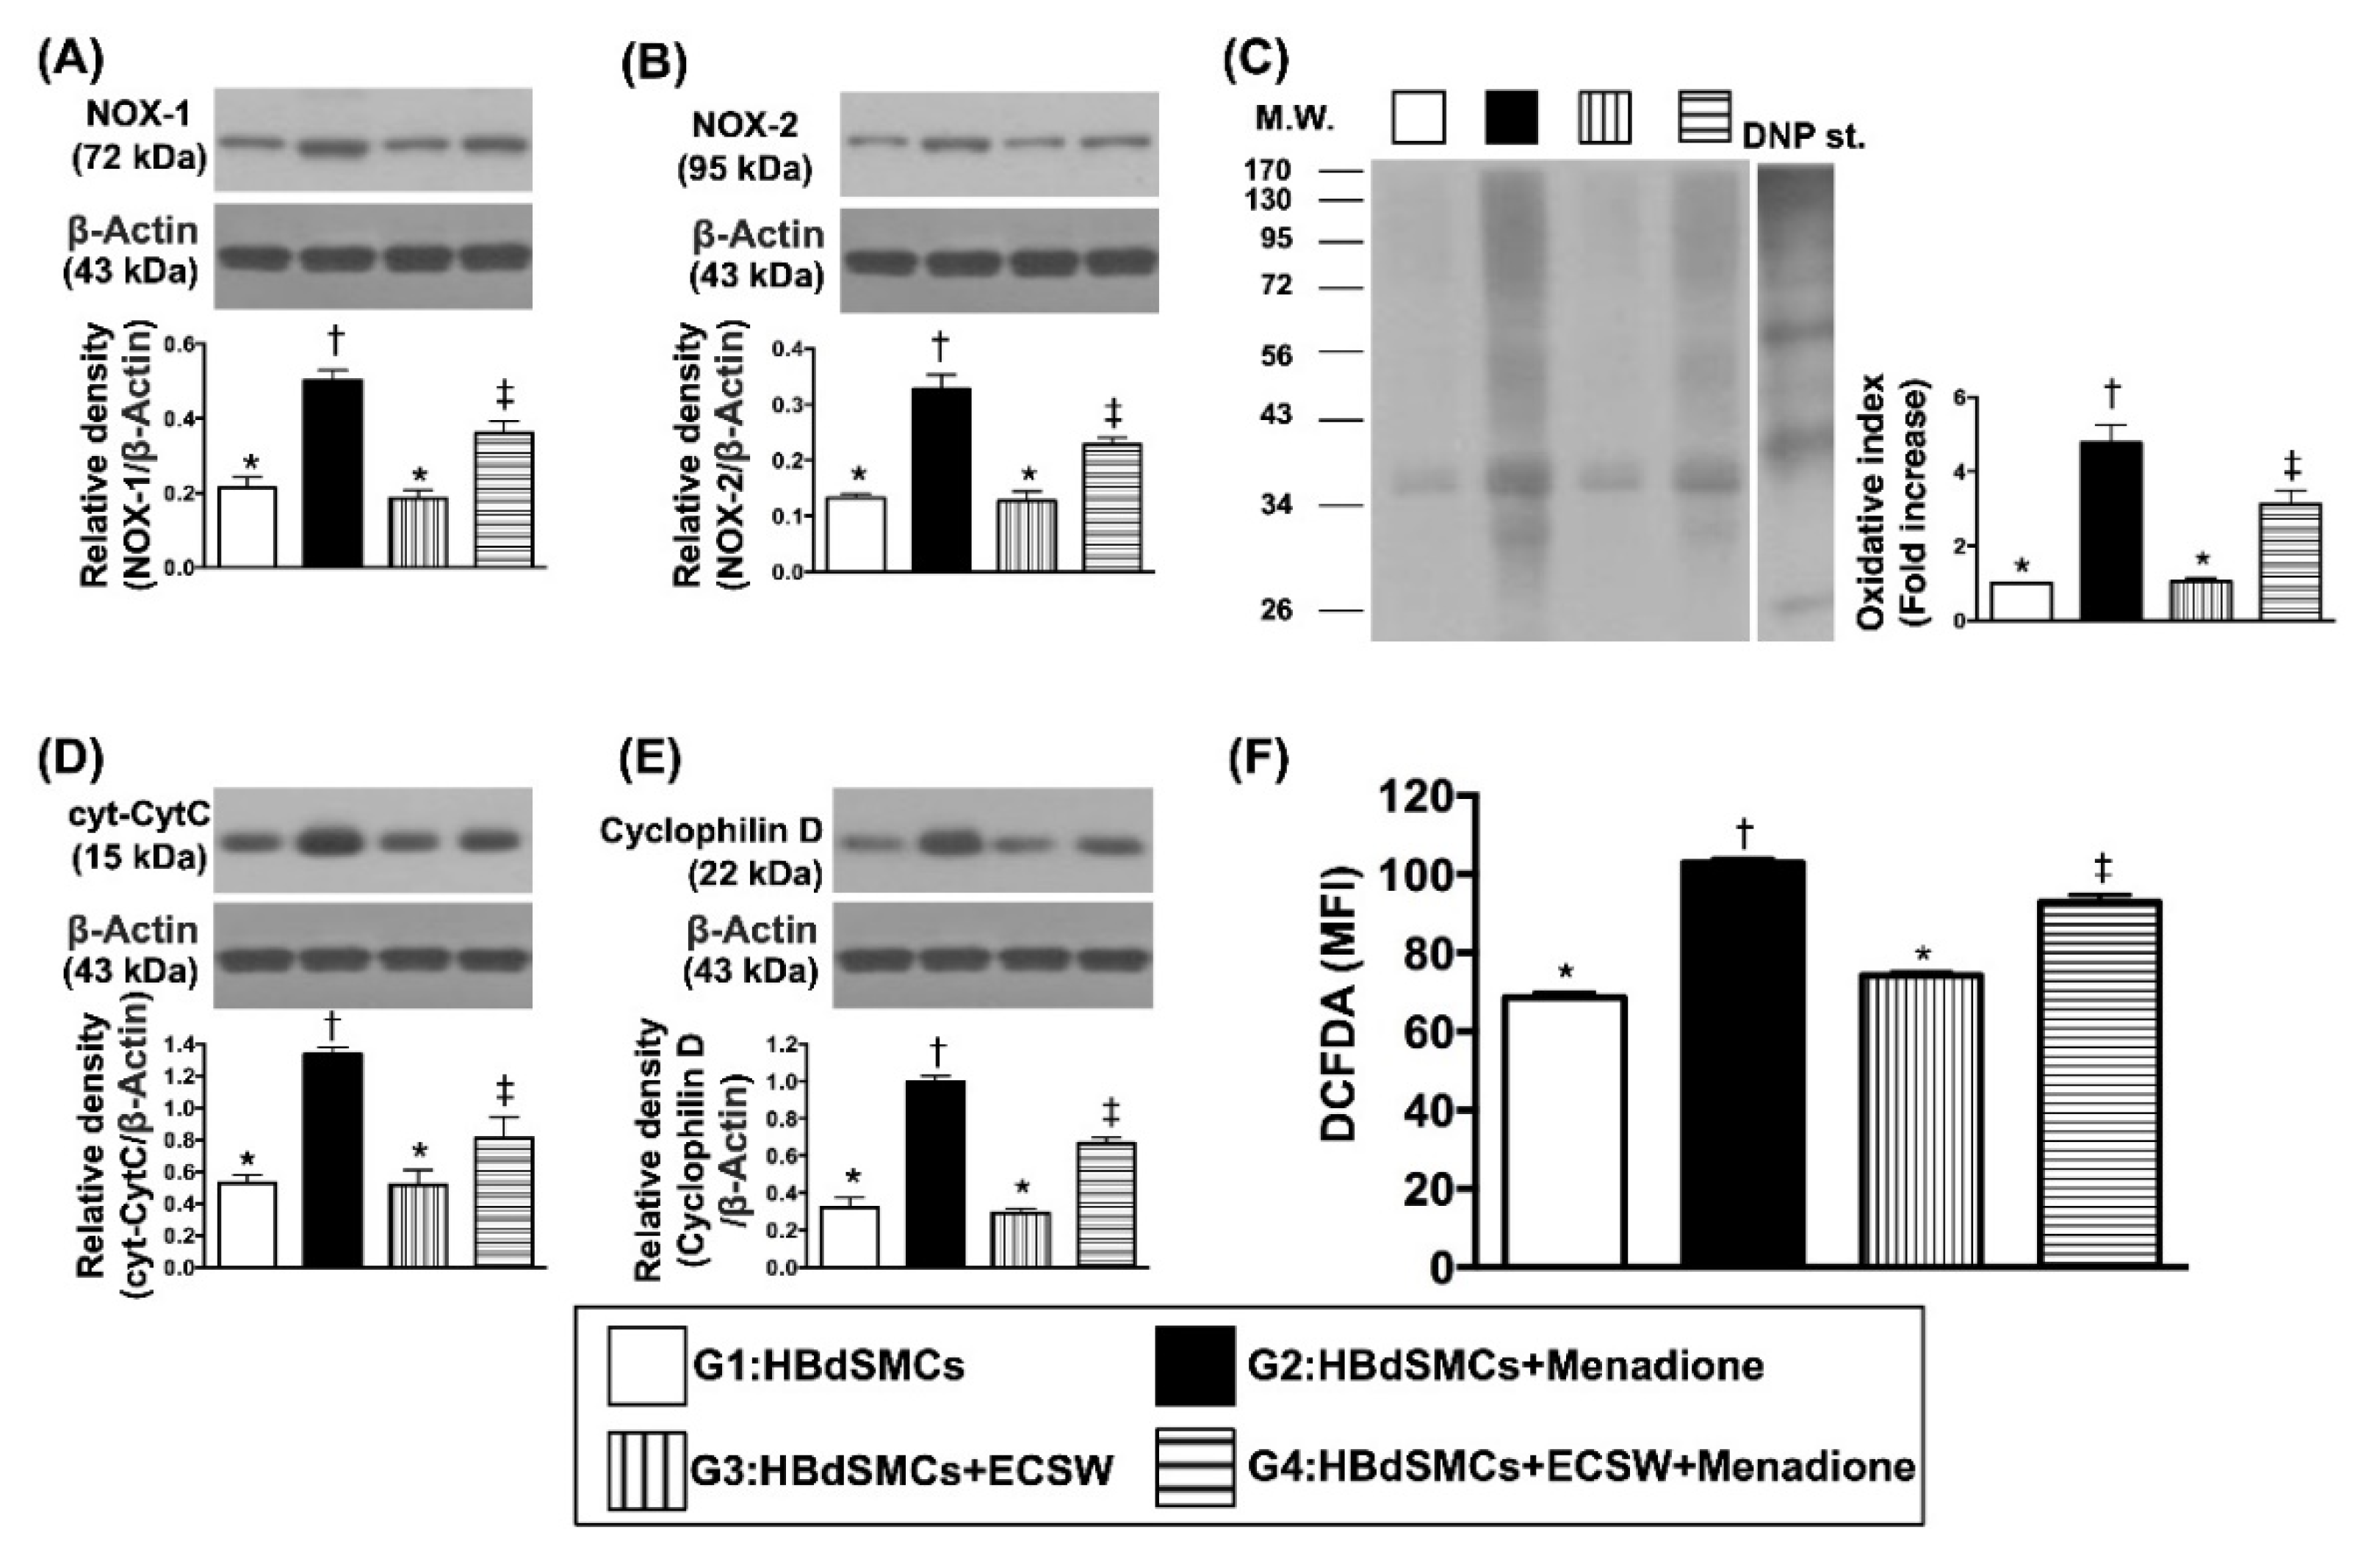
ECSW therapy protected the rat bladder smooth muscle cells (RBdSMCs) against oxidative stress and mitochondrial damage. (A) Protein expression of NXO-1, * vs. other groups with different symbols (†, ‡), p < 0.001. (B) Protein expression of NOX-2, * vs. other groups with different symbols (†, ‡), p < 0.001. (C) The oxidized protein expression, * vs. other groups with different symbols (†, ‡), p < 0.001 (Note: The left and right lanes shown on the upper panel represent protein molecular weight marker and control oxidized molecular protein standard, respectively). M.W. = molecular weight; DNP = 1–3 dinitrophenylhydrazone. (D) Protein expression of cytosolic cytochrome C (cyt-CytC), * vs. other groups with different symbols (†, ‡), p < 0.001. (E) Protein expression of cyclophilin D (cyc-D), * vs. other groups with different symbols (†, ‡), p < 0.001. (F) Flow cytometric analysis of mean fluorescent intensity (MFI) of DCFDA [i.e., reactive oxygen species (ROS)], * vs. other groups with different symbols (†, ‡), p < 0.001. All statistical analyses were performed by one-way ANOVA, followed by Bonferroni multiple comparison post hoc test (n = 6 for each group). Symbols (*, †, ‡) indicate significance (at 0.05 level). ECSW = extracorporeal shock wave; RBdSMCs = rat bladder smooth muscle cells.
Figure 1.
ECSW therapy protected the rat bladder smooth muscle cells (RBdSMCs) against oxidative stress and mitochondrial damage. (A) Protein expression of NXO-1, * vs. other groups with different symbols (†, ‡), p < 0.001. (B) Protein expression of NOX-2, * vs. other groups with different symbols (†, ‡), p < 0.001. (C) The oxidized protein expression, * vs. other groups with different symbols (†, ‡), p < 0.001 (Note: The left and right lanes shown on the upper panel represent protein molecular weight marker and control oxidized molecular protein standard, respectively). M.W. = molecular weight; DNP = 1–3 dinitrophenylhydrazone. (D) Protein expression of cytosolic cytochrome C (cyt-CytC), * vs. other groups with different symbols (†, ‡), p < 0.001. (E) Protein expression of cyclophilin D (cyc-D), * vs. other groups with different symbols (†, ‡), p < 0.001. (F) Flow cytometric analysis of mean fluorescent intensity (MFI) of DCFDA [i.e., reactive oxygen species (ROS)], * vs. other groups with different symbols (†, ‡), p < 0.001. All statistical analyses were performed by one-way ANOVA, followed by Bonferroni multiple comparison post hoc test (n = 6 for each group). Symbols (*, †, ‡) indicate significance (at 0.05 level). ECSW = extracorporeal shock wave; RBdSMCs = rat bladder smooth muscle cells.
![Biomedicines 09 01391 g001]()
Figure 2.
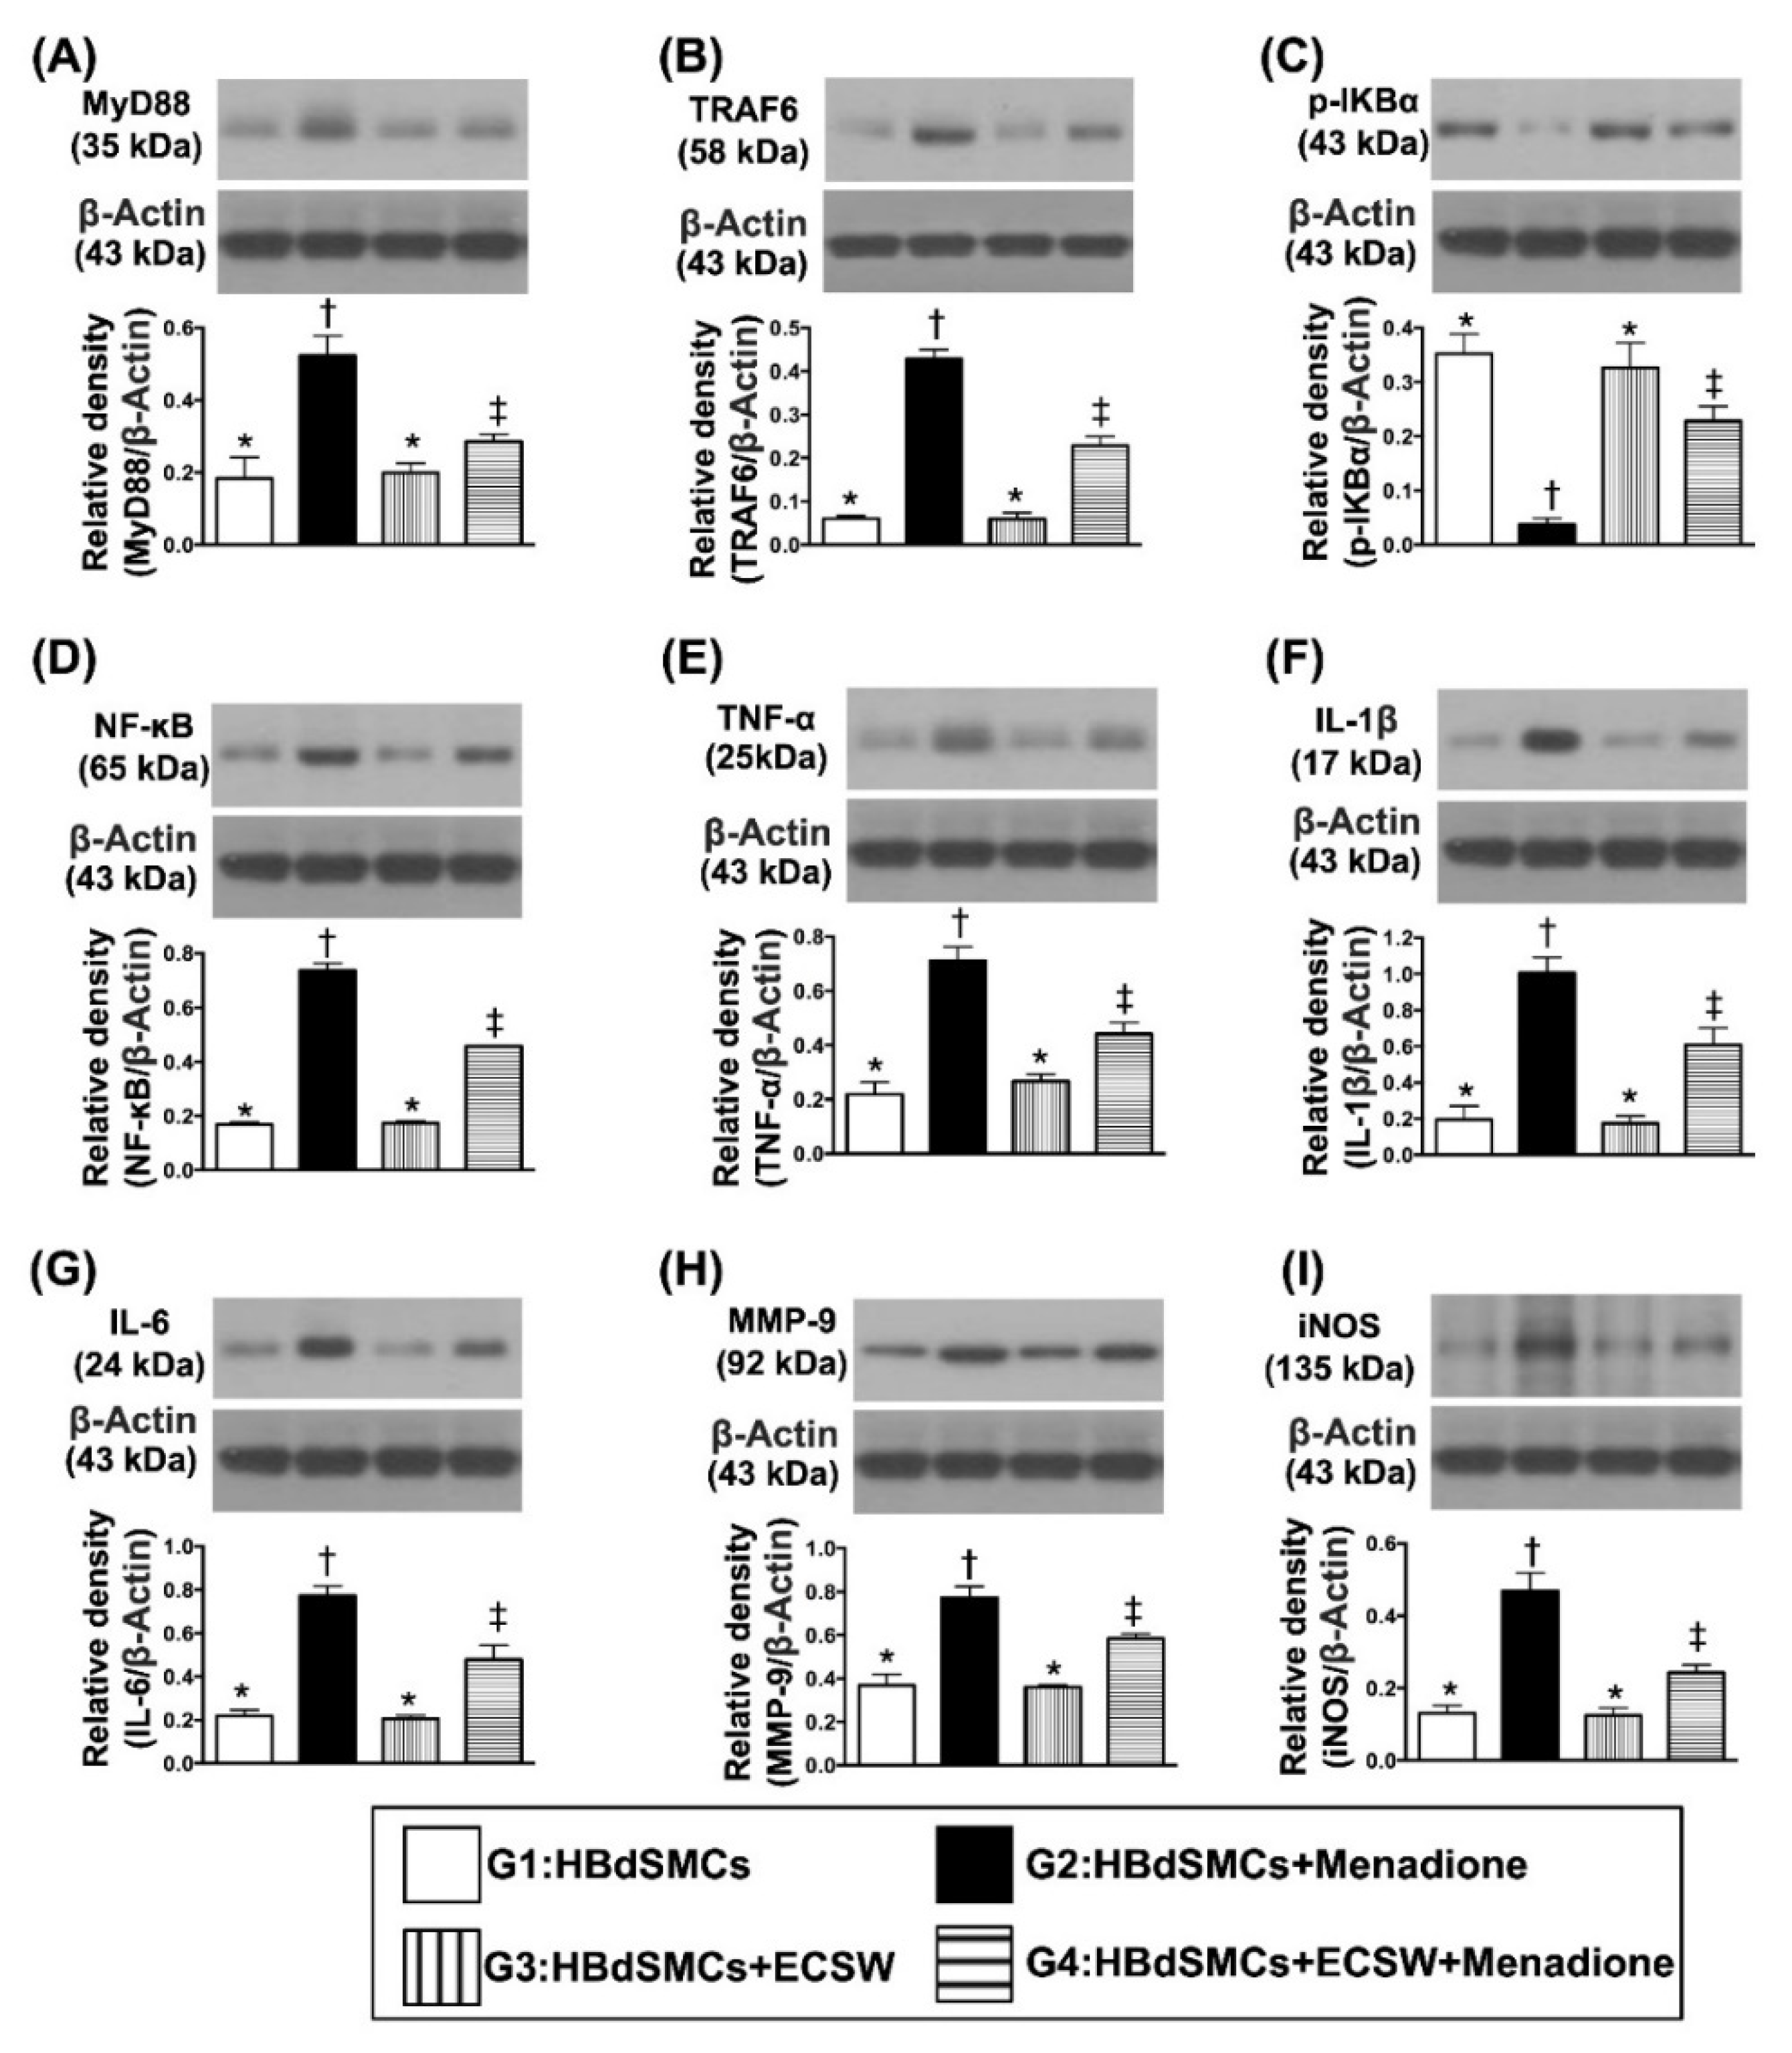
ECSW therapy markedly suppressed menadione-induced inflammatory reaction in RBdSMCs. (A) Protein expression of myeloid differentiation primary response 88 (MyD88), MyD88, * vs. other groups with different symbols (†, ‡), p < 0.001. (B) Protein expression of TNF receptor associated factor 6 (TRAF6), * vs. other groups with different symbols (†, ‡), p < 0.001. (C) Protein expression of phosphorylated (p)-IKB-α, * vs. other groups with different symbols (†, ‡), p < 0.001. (D) Protein expression of nuclear factor-κB (NF-κB), * vs. other groups with different symbols (†, ‡), p < 0.001. (E) Protein expression of phosphorylated tumor necrosis factor alpha (TNF-α), * vs. other groups with different symbols (†, ‡), p < 0.001. (F) Protein expression of interleukin (IL)-1ß, * vs. other groups with different symbols (†, ‡), p < 0.001. (G) Protein expression of IL-6, * vs. other groups with different symbols (†, ‡), p < 0.001. (H) Protein expression of matrix metalloproteinase 9 (MMP-9), * vs. other groups with different symbols (†, ‡), p < 0.001. (I) Protein expression of induced nitric oxide synthase (iNOS), * vs. other groups with different symbols (†, ‡), p < 0.001. All statistical analyses were performed by one-way ANOVA, followed by Bonferroni multiple comparison post hoc test (n = 6 for each group). Symbols (*, †, ‡) indicate significance (at 0.05 level). ECSW = extracorporeal shock wave; RBdSMCs = rat bladder smooth muscle cells.
Figure 2.
ECSW therapy markedly suppressed menadione-induced inflammatory reaction in RBdSMCs. (A) Protein expression of myeloid differentiation primary response 88 (MyD88), MyD88, * vs. other groups with different symbols (†, ‡), p < 0.001. (B) Protein expression of TNF receptor associated factor 6 (TRAF6), * vs. other groups with different symbols (†, ‡), p < 0.001. (C) Protein expression of phosphorylated (p)-IKB-α, * vs. other groups with different symbols (†, ‡), p < 0.001. (D) Protein expression of nuclear factor-κB (NF-κB), * vs. other groups with different symbols (†, ‡), p < 0.001. (E) Protein expression of phosphorylated tumor necrosis factor alpha (TNF-α), * vs. other groups with different symbols (†, ‡), p < 0.001. (F) Protein expression of interleukin (IL)-1ß, * vs. other groups with different symbols (†, ‡), p < 0.001. (G) Protein expression of IL-6, * vs. other groups with different symbols (†, ‡), p < 0.001. (H) Protein expression of matrix metalloproteinase 9 (MMP-9), * vs. other groups with different symbols (†, ‡), p < 0.001. (I) Protein expression of induced nitric oxide synthase (iNOS), * vs. other groups with different symbols (†, ‡), p < 0.001. All statistical analyses were performed by one-way ANOVA, followed by Bonferroni multiple comparison post hoc test (n = 6 for each group). Symbols (*, †, ‡) indicate significance (at 0.05 level). ECSW = extracorporeal shock wave; RBdSMCs = rat bladder smooth muscle cells.
![Biomedicines 09 01391 g002]()
Figure 3.
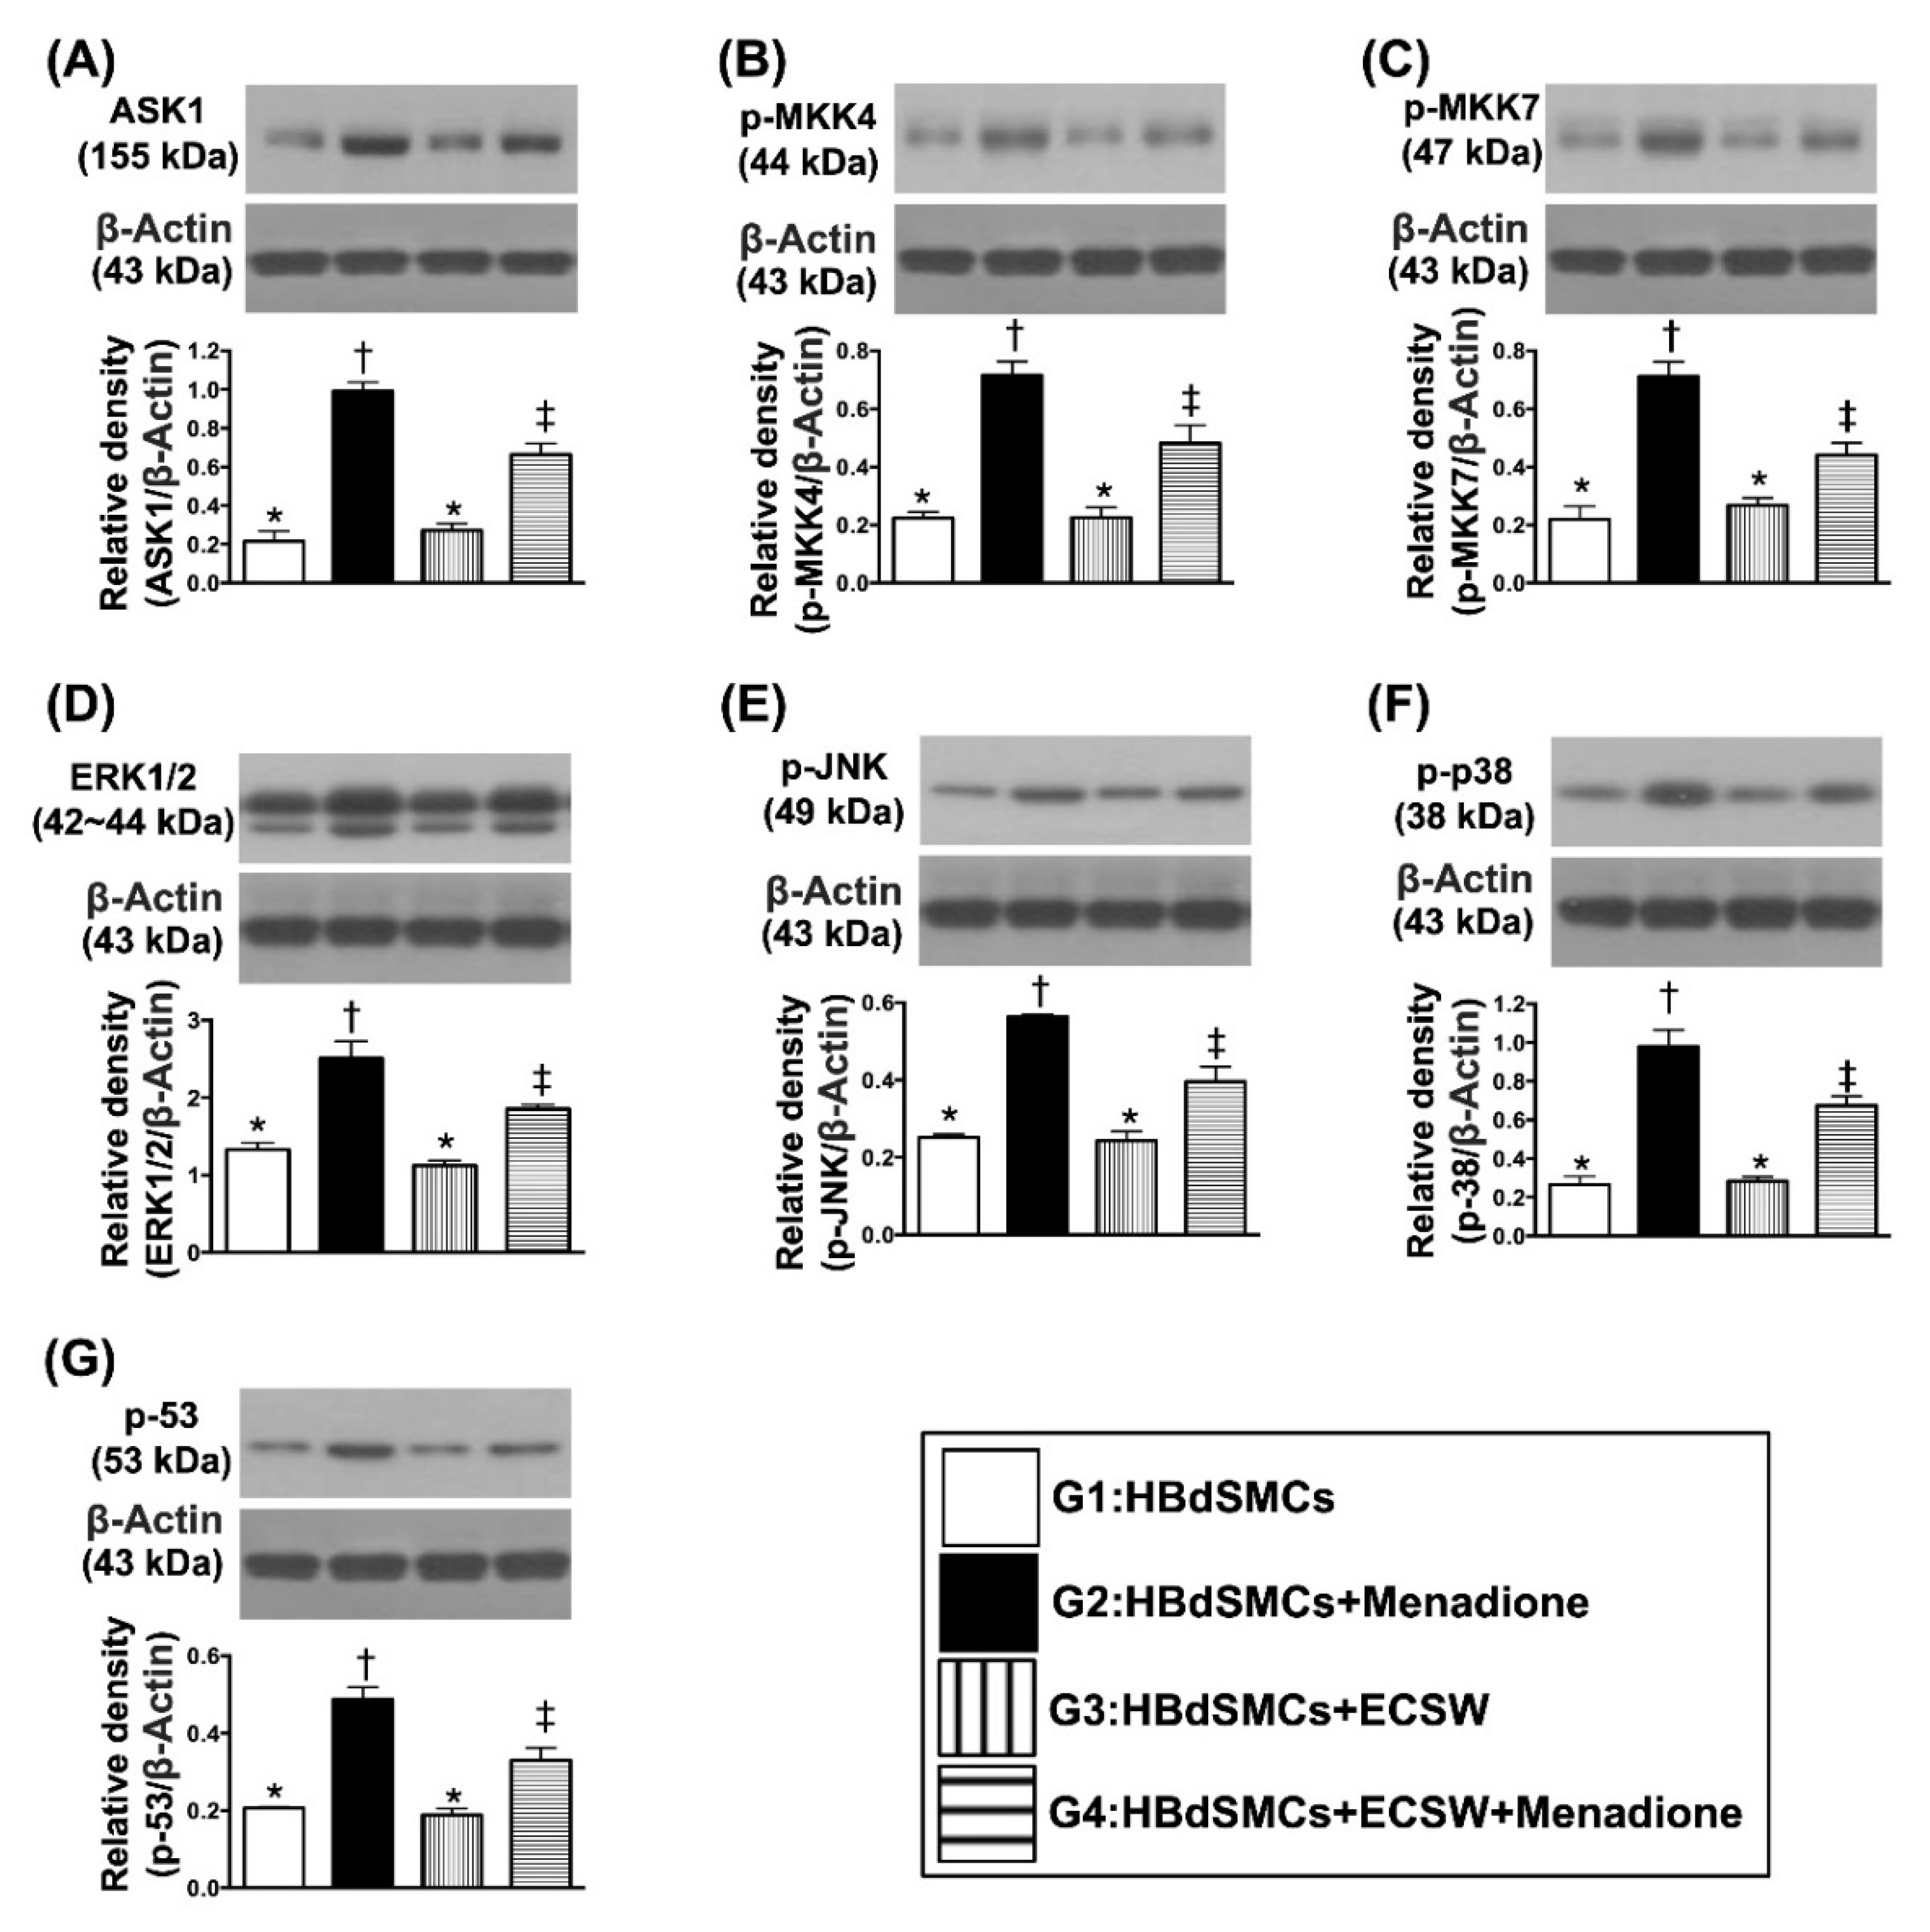
ECSW therapy regulated the cell-stress signaling in RBdSMCs. (A) Protein expression of Apoptosis signal-regulating kinase 1 (ASK1), * vs. other groups with different symbols (†, ‡), p < 0.001. (B) Protein expression of phosphorylated Mitogen-activated protein kinase kinase 4 (p-MKK4), * vs. other groups with different symbols (†, ‡), p < 0.001. (C) Protein expression of p-MKK7, * vs. other groups with different symbols (†, ‡), p < 0.001. (D) Protein expression of ERK1/2, * vs. other groups with different symbols (†, ‡), p < 0.001. (E) Protein expression of phosphorylated c-Jun N-terminal kinases (p-JNK), * vs. other groups with different symbols (†, ‡), p < 0.001. (F) Protein expression of p-p38, * vs. other groups with different symbols (†, ‡), p < 0.001. (G) Protein expression of p-53, * vs. other groups with different symbols (†, ‡), p < 0.001. All statistical analyses were performed by one-way ANOVA, followed by Bonferroni multiple comparison post hoc test (n = 6 for each group). Symbols (*, †, ‡) indicate significance (at 0.05 level). ECSW = extracorporeal shock wave; RBdSMCs = rat bladder smooth muscle cells.
Figure 3.
ECSW therapy regulated the cell-stress signaling in RBdSMCs. (A) Protein expression of Apoptosis signal-regulating kinase 1 (ASK1), * vs. other groups with different symbols (†, ‡), p < 0.001. (B) Protein expression of phosphorylated Mitogen-activated protein kinase kinase 4 (p-MKK4), * vs. other groups with different symbols (†, ‡), p < 0.001. (C) Protein expression of p-MKK7, * vs. other groups with different symbols (†, ‡), p < 0.001. (D) Protein expression of ERK1/2, * vs. other groups with different symbols (†, ‡), p < 0.001. (E) Protein expression of phosphorylated c-Jun N-terminal kinases (p-JNK), * vs. other groups with different symbols (†, ‡), p < 0.001. (F) Protein expression of p-p38, * vs. other groups with different symbols (†, ‡), p < 0.001. (G) Protein expression of p-53, * vs. other groups with different symbols (†, ‡), p < 0.001. All statistical analyses were performed by one-way ANOVA, followed by Bonferroni multiple comparison post hoc test (n = 6 for each group). Symbols (*, †, ‡) indicate significance (at 0.05 level). ECSW = extracorporeal shock wave; RBdSMCs = rat bladder smooth muscle cells.
![Biomedicines 09 01391 g003]()
Figure 4.
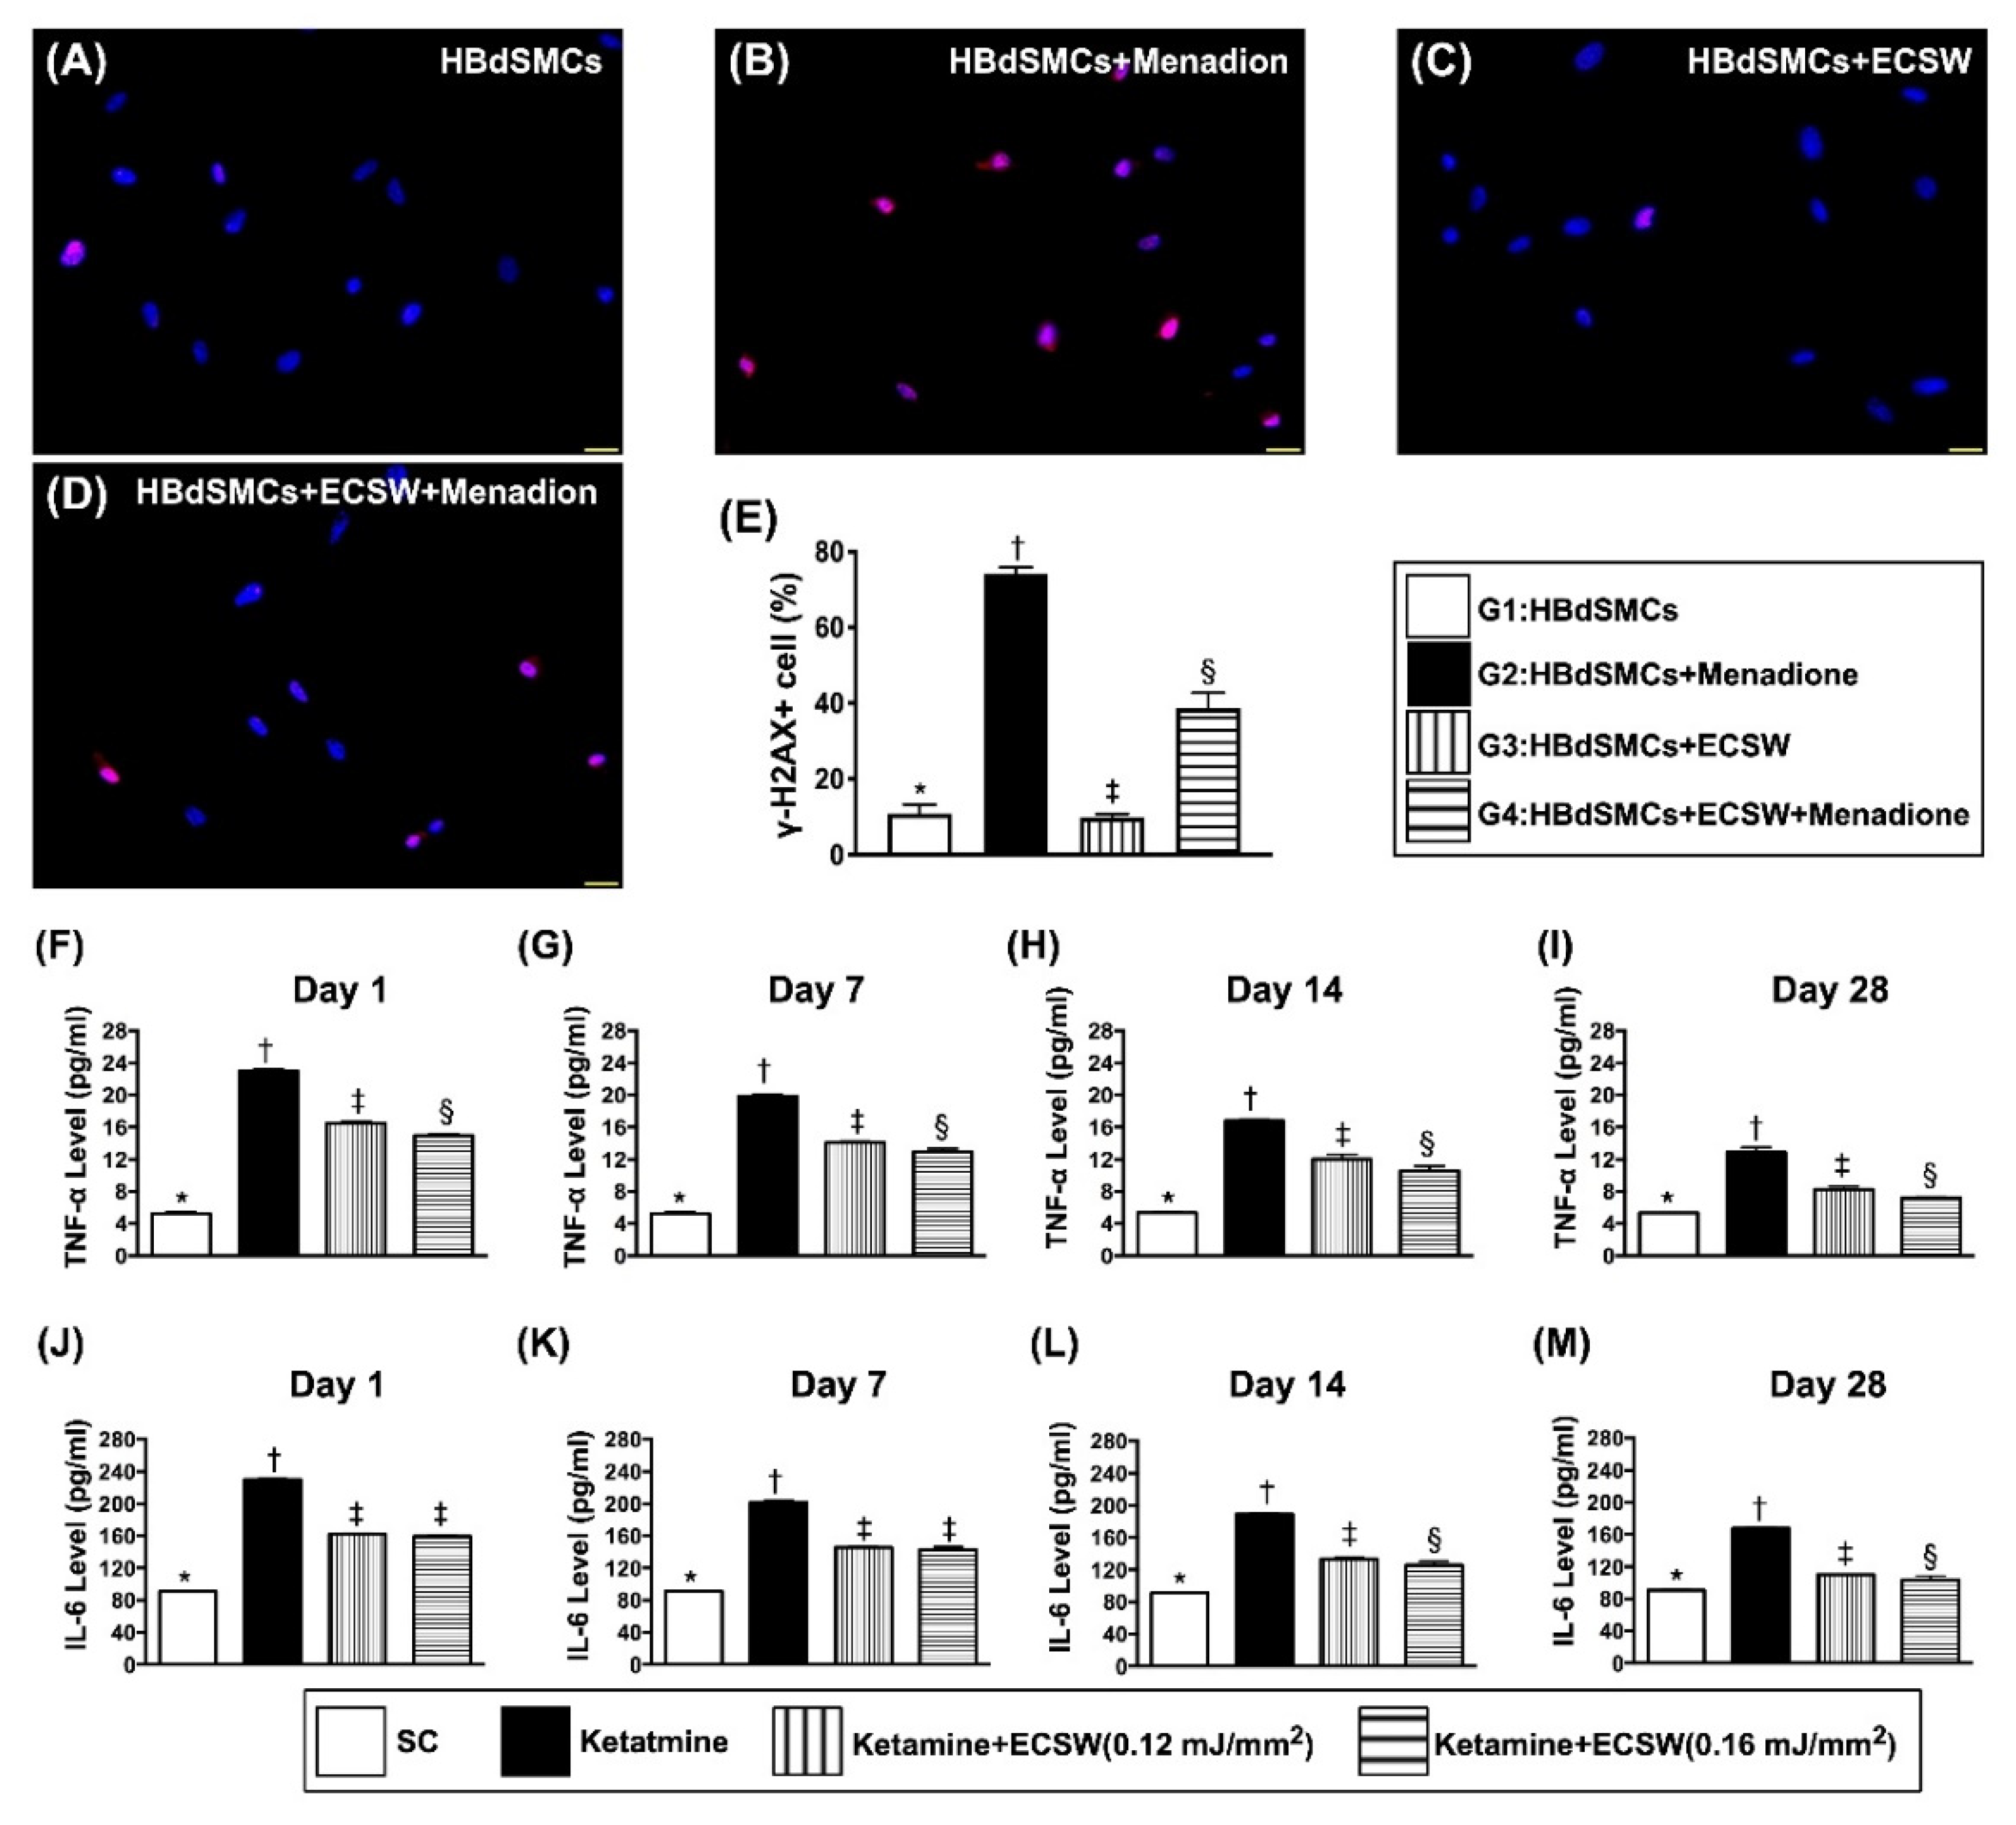
ECSW therapy attenuated menadione-induced DNA damage in RBdSMCs and time courses of urinary level of inflammatory biomarkers. (A–D) Illustrating the immunofluorescent microscopic finding (400×) for identification of positively stained γ-H2AX cells (pink color). (E) Analytical result of number of γ-H2AX+ cells, * vs. other groups with different symbols (†, ‡, §), p < 0.0001. Scale bar in right lower corner represents 20 µm. (F–I) The urine levels of tumor necrosis factor (TNF)-α by days 1 (F), 7 (G), 14 (H) and 28 (I), respectively, analytical result of TNF-α in urine, * vs. other groups with different symbols (†, ‡, §), p < 0.0001. (J–M) The urine levels of interleukin (IL)-6 by days 1 (J), 7 (K), 14 (L) and 28 (M), respectively, analytical result of interleukin (IL)-6 in urine, analytical result of IL-6 in urine, for days 1 and 7, * vs. other groups with different symbols (†, ‡), p < 0.0001; for days 14 and 28, * vs. other groups with different symbols (†, ‡, §), p < 0.0001. All statistical analyses were performed by one-way ANOVA, followed by Bonferroni multiple comparison post hoc test (n = 6 for each group). Symbols (*, †, ‡) indicate significance (at 0.05 level). ECSW = extracorporeal shock wave; RBdSMCs = rat bladder smooth muscle cells.
Figure 4.
ECSW therapy attenuated menadione-induced DNA damage in RBdSMCs and time courses of urinary level of inflammatory biomarkers. (A–D) Illustrating the immunofluorescent microscopic finding (400×) for identification of positively stained γ-H2AX cells (pink color). (E) Analytical result of number of γ-H2AX+ cells, * vs. other groups with different symbols (†, ‡, §), p < 0.0001. Scale bar in right lower corner represents 20 µm. (F–I) The urine levels of tumor necrosis factor (TNF)-α by days 1 (F), 7 (G), 14 (H) and 28 (I), respectively, analytical result of TNF-α in urine, * vs. other groups with different symbols (†, ‡, §), p < 0.0001. (J–M) The urine levels of interleukin (IL)-6 by days 1 (J), 7 (K), 14 (L) and 28 (M), respectively, analytical result of interleukin (IL)-6 in urine, analytical result of IL-6 in urine, for days 1 and 7, * vs. other groups with different symbols (†, ‡), p < 0.0001; for days 14 and 28, * vs. other groups with different symbols (†, ‡, §), p < 0.0001. All statistical analyses were performed by one-way ANOVA, followed by Bonferroni multiple comparison post hoc test (n = 6 for each group). Symbols (*, †, ‡) indicate significance (at 0.05 level). ECSW = extracorporeal shock wave; RBdSMCs = rat bladder smooth muscle cells.
![Biomedicines 09 01391 g004]()
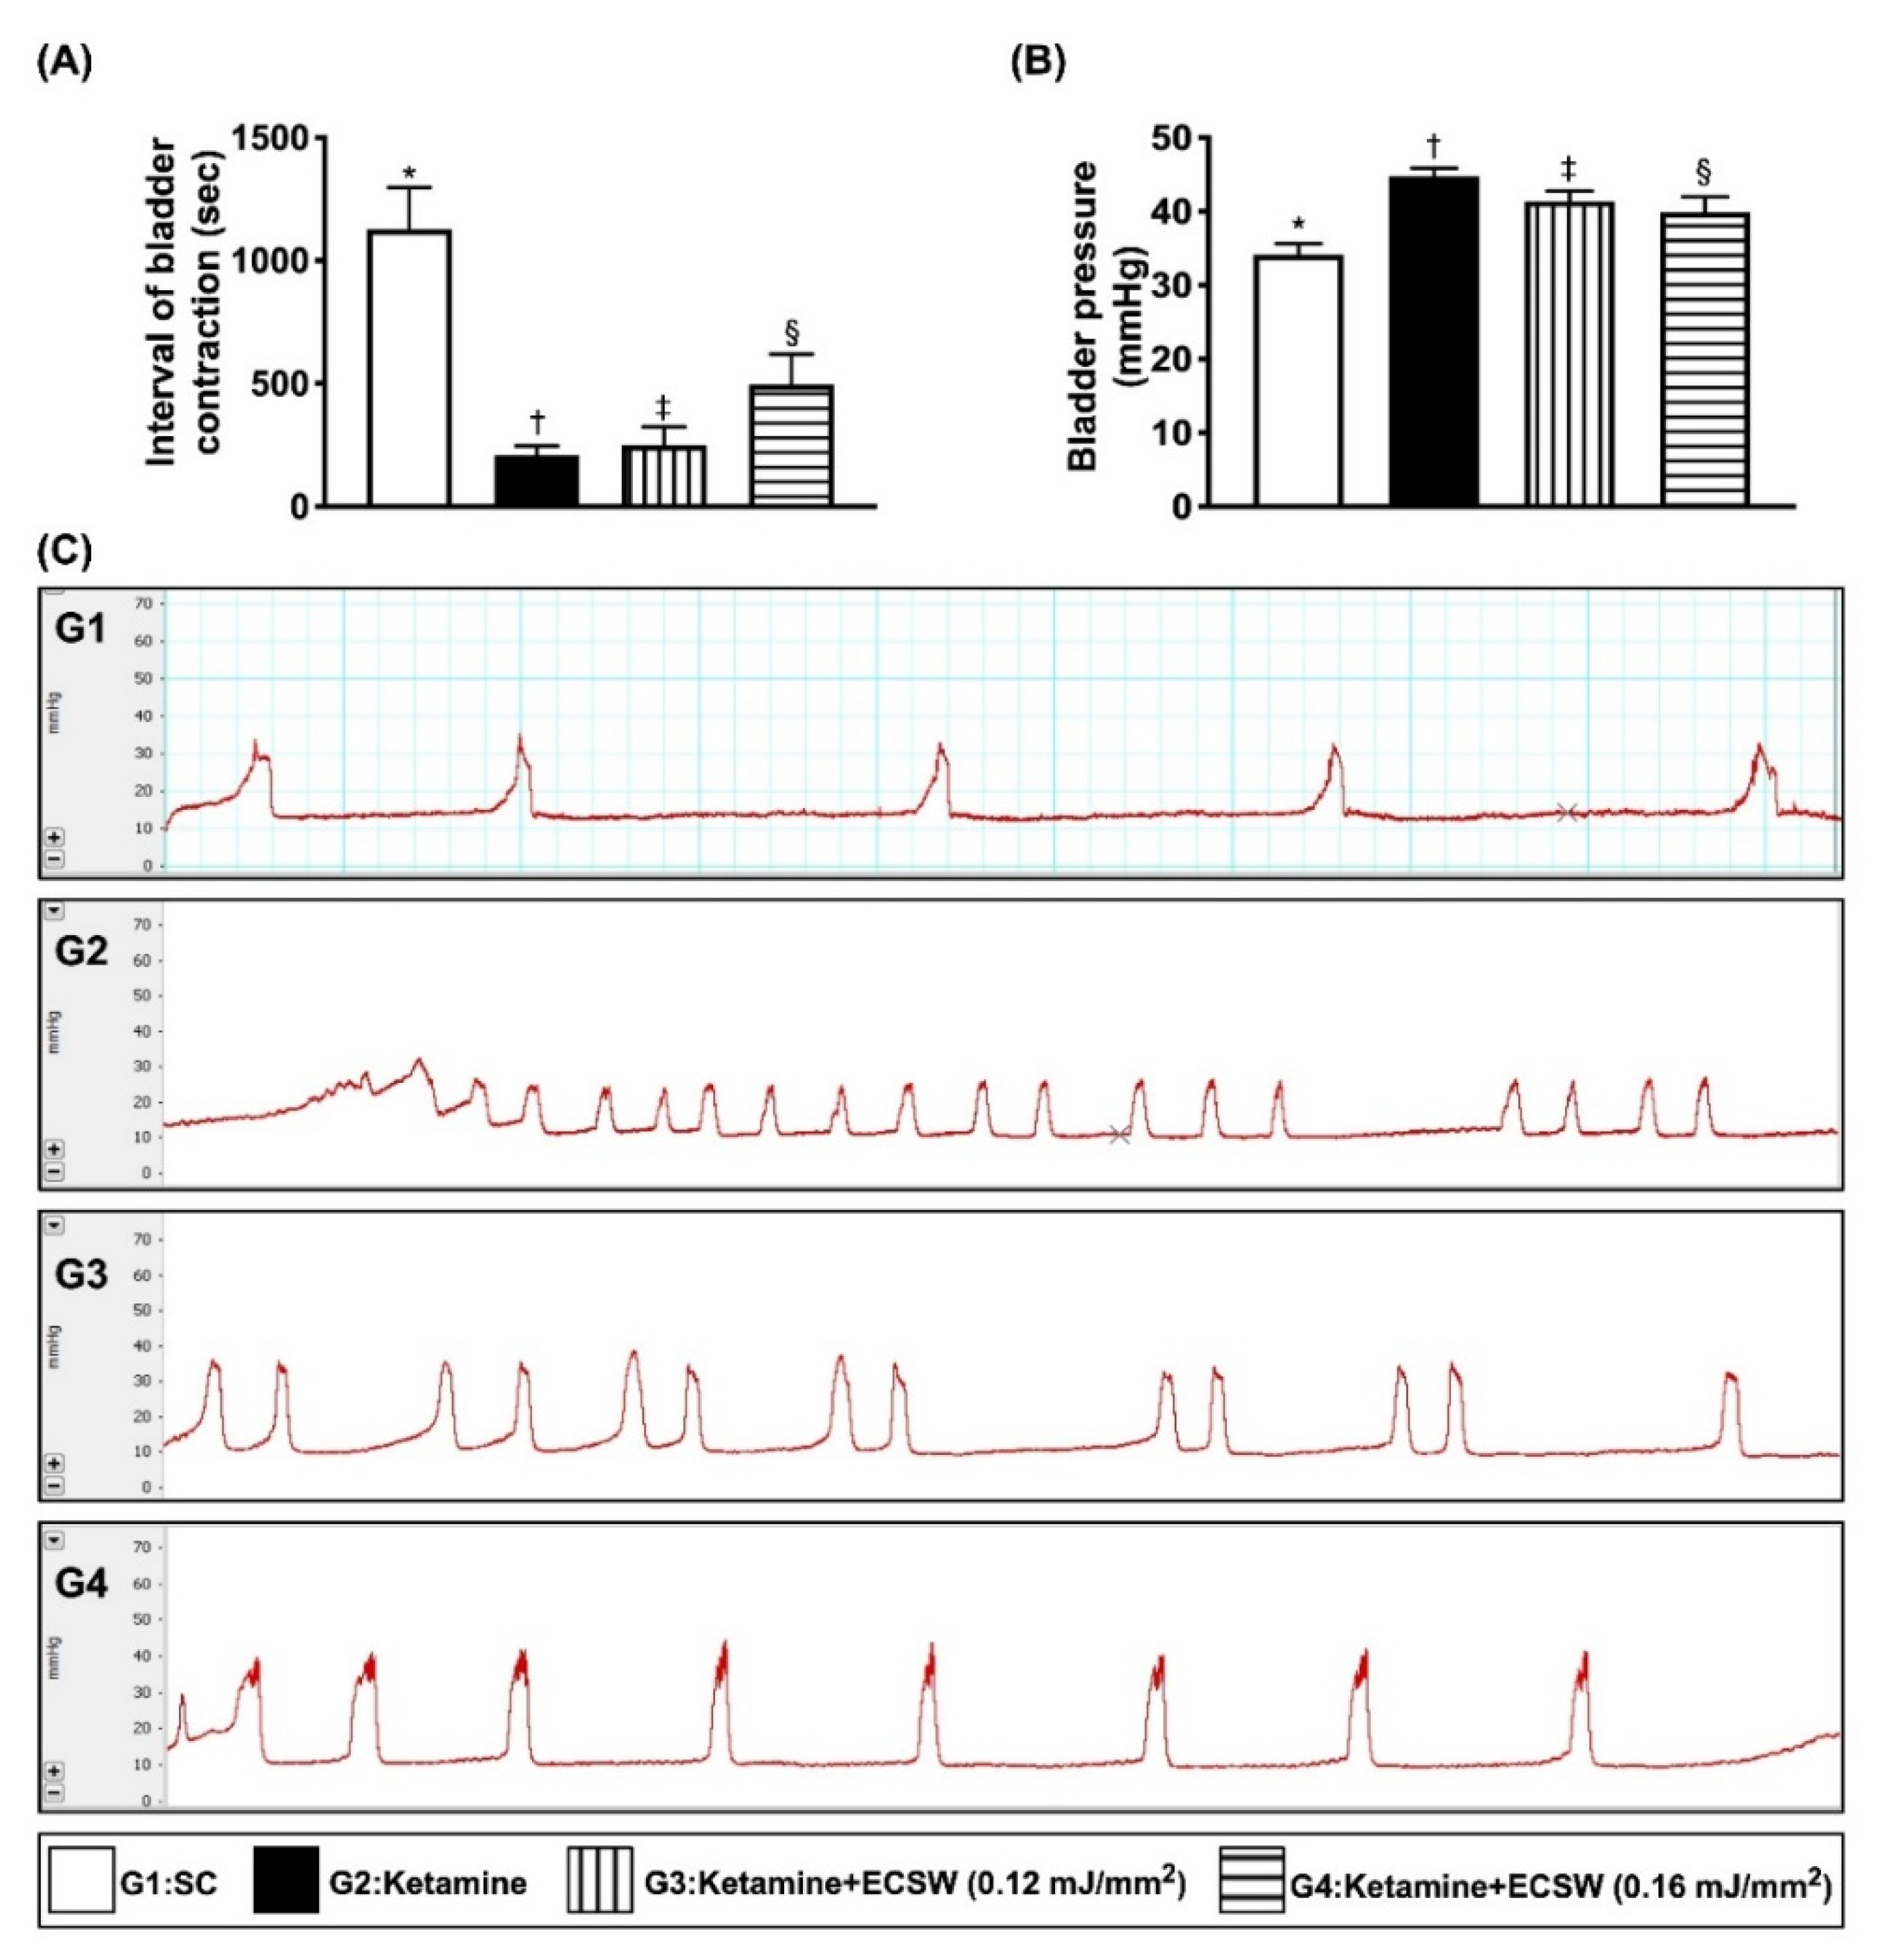
Figure 5.
ECSW therapy inhibited ketamine-induced urine frequency, time interval of bladder contraction and bladder maximal pressure. (A) The time interval of urinary bladder contraction, * vs. other groups with different symbols (†, ‡, §), p < 0.0001. (B) Maximal urinary bladder pressure, * vs. other groups with different symbols (†, ‡, §), p < 0.0001. (C) Illustrating the time interval of urinary bladder contraction (i.e., the frequency) among the four groups. The frequency of urinary bladder contraction in G2 was remarkably increased as compared with G3 and G4 and more remarkably increased as compared with G1 (i.e., sham-control). All statistical analyses were performed by one-way ANOVA, followed by Bonferroni multiple comparison post hoc test (n = 6 for each group). Symbols (*, †, ‡, §) indicate significance (at 0.05 level). ECSW = extracorporeal shock wave.
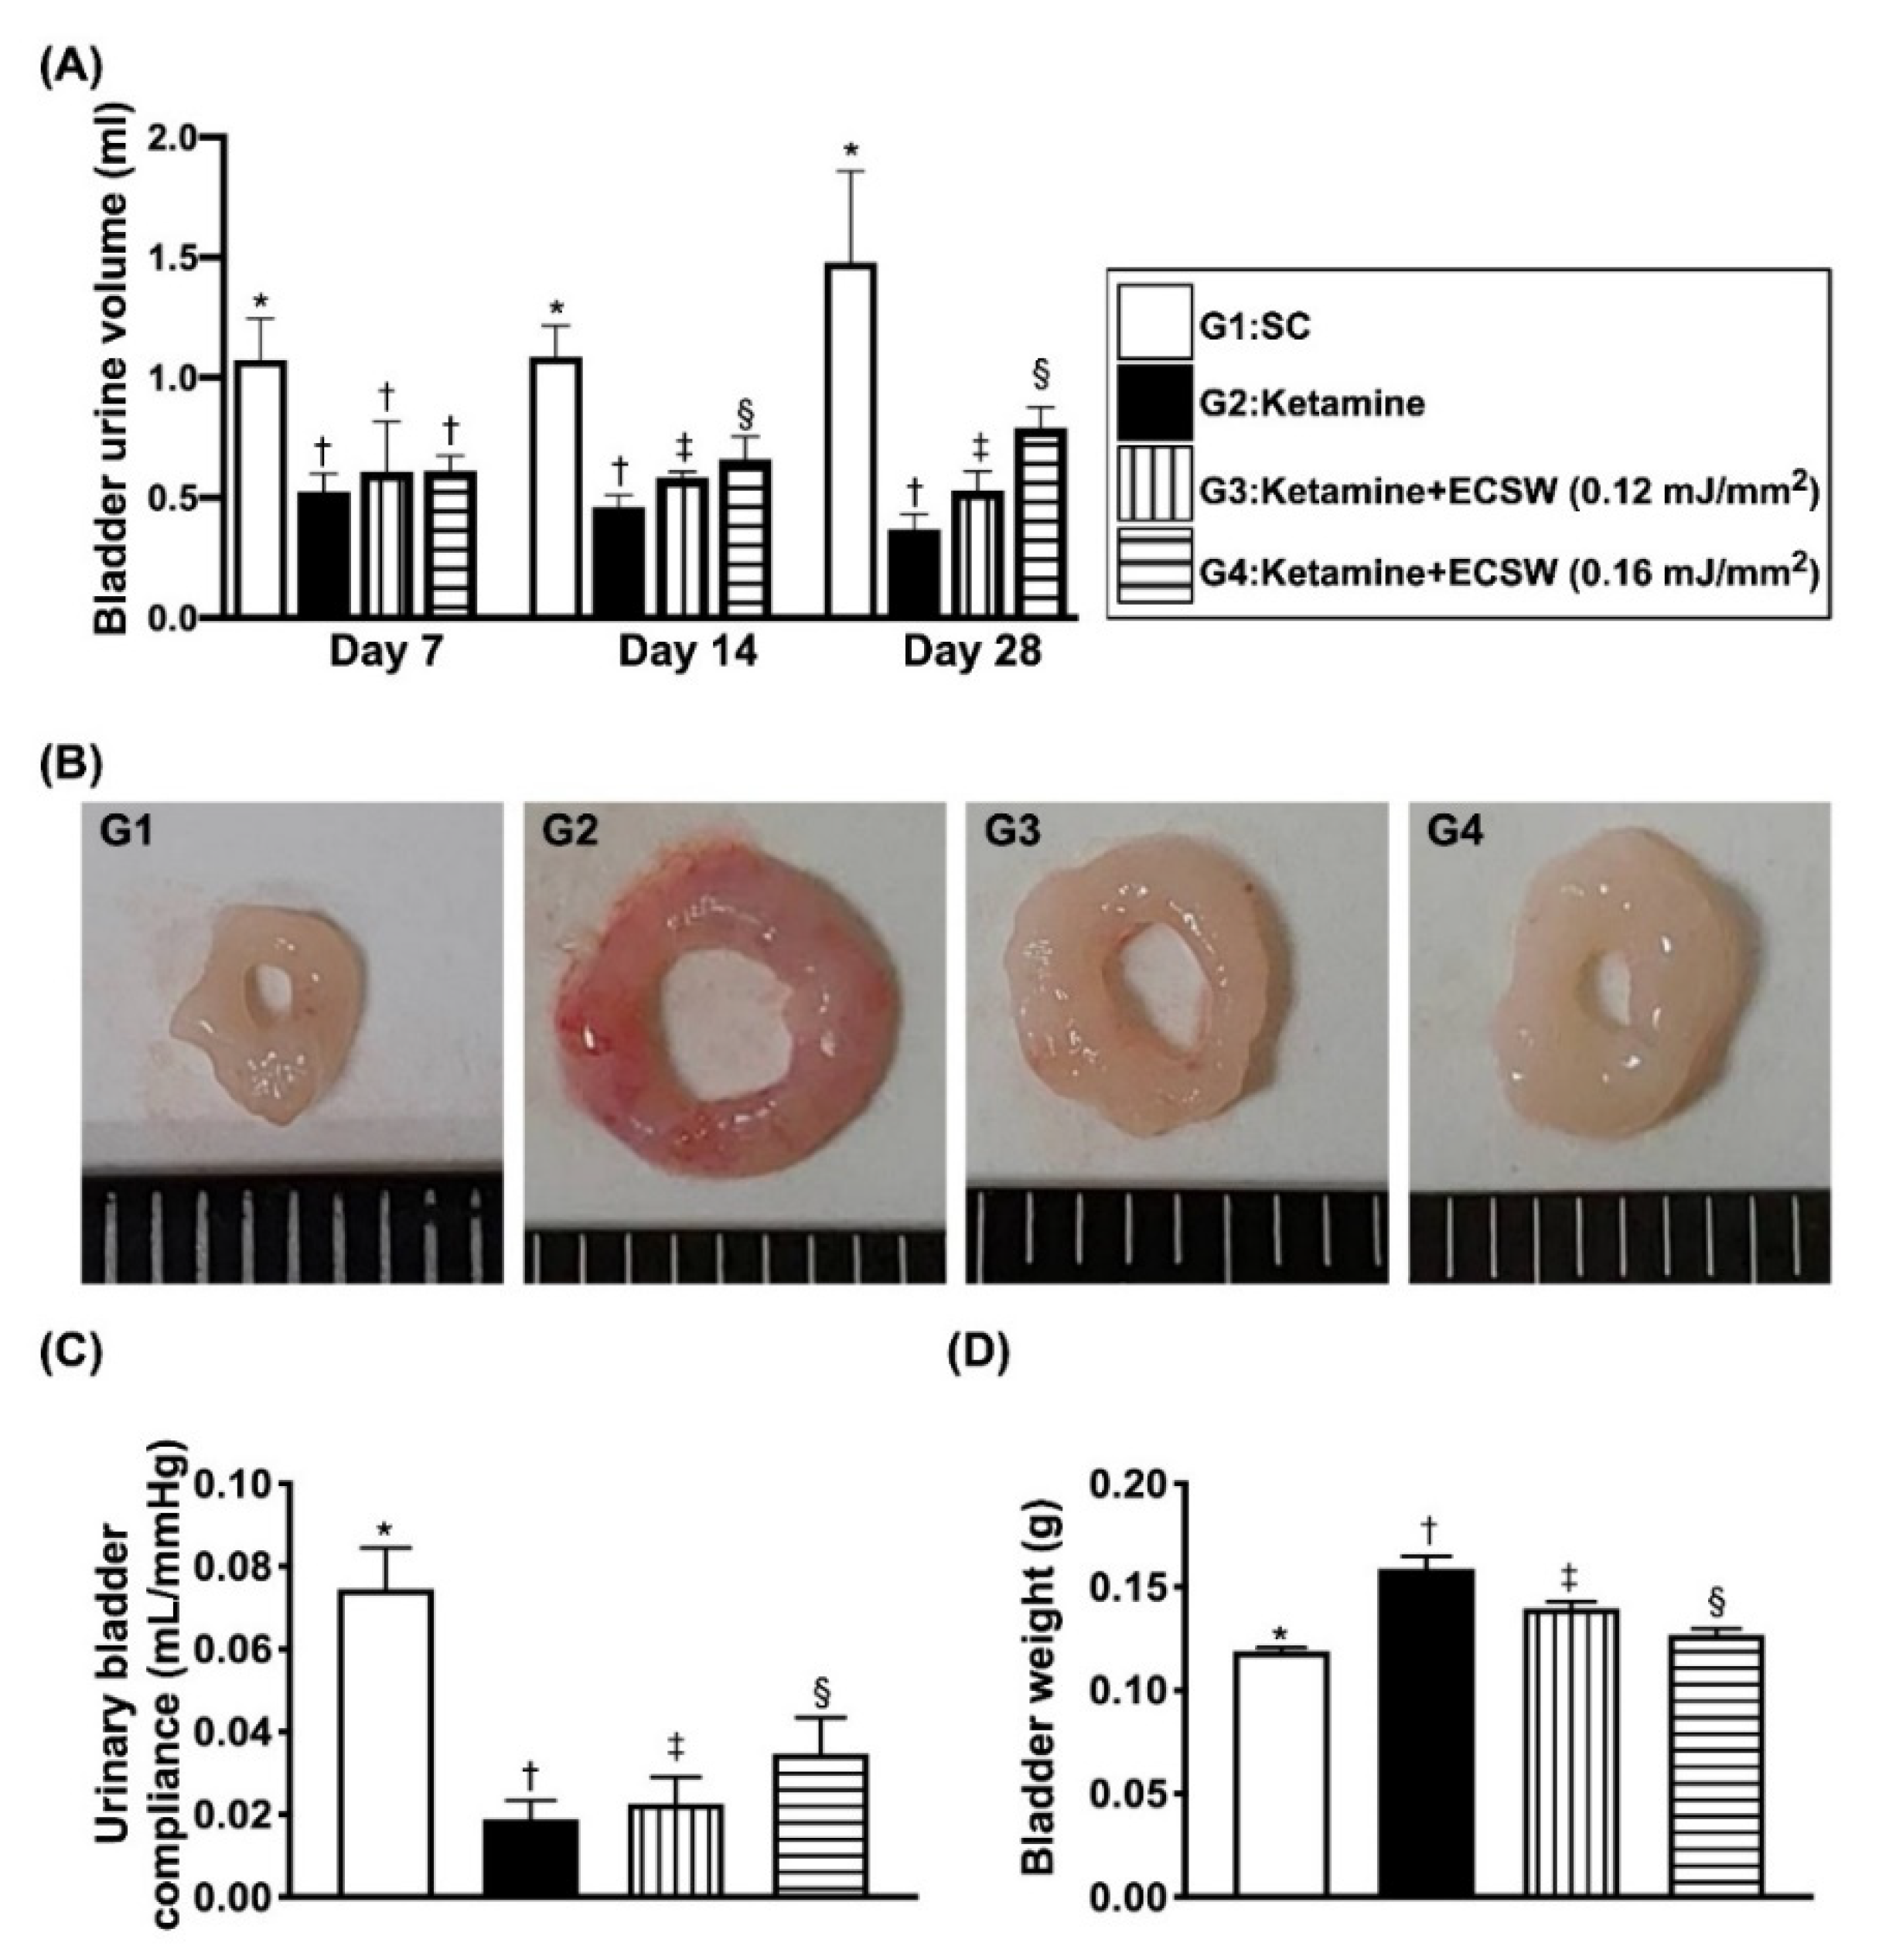
Figure 6.
Time courses of mean maximal bladder urine volume per time interval prior to micturition (i.e., within 18 h collection of urine divided by total number of urination) and urinary bladder compliance, and the urinary bladder weight by day 42 after ketamine administration. (A) By day 7, the mean of urine volume prior to micturition, * vs. †, p < 0.001; by day 14, the mean of urine volume prior to micturition, * vs. other groups with different symbols (†, ‡, §), p < 0.0001; by day 28, the mean of urine volume prior to micturition, * vs. other groups with different symbols (†, ‡, §), p < 0.0001. (B) Illustrating the anatomical features of urinary bladder by day 42 after ketamine treatment. The appearance of urinary bladder was remarkably enlarged and swelling in G2 moreso than in G3 and G4 and more remarkably enlarged and swelling than in G1. (C) By day 28, the urinary bladder compliance, * vs. other groups with different symbols (†, ‡, §), p < 0.0001. (D) Analytical result of bladder weight, * vs. other groups with different symbols (†, ‡, §), p < 0.001. All statistical analyses were performed by one-way ANOVA, followed by Bonferroni multiple comparison post hoc test (n = 6 for each group). Symbols (*, †, ‡, §) indicate significance (at 0.05 level). ECSW = extracorporeal shock wave.
![Biomedicines 09 01391 g006]()
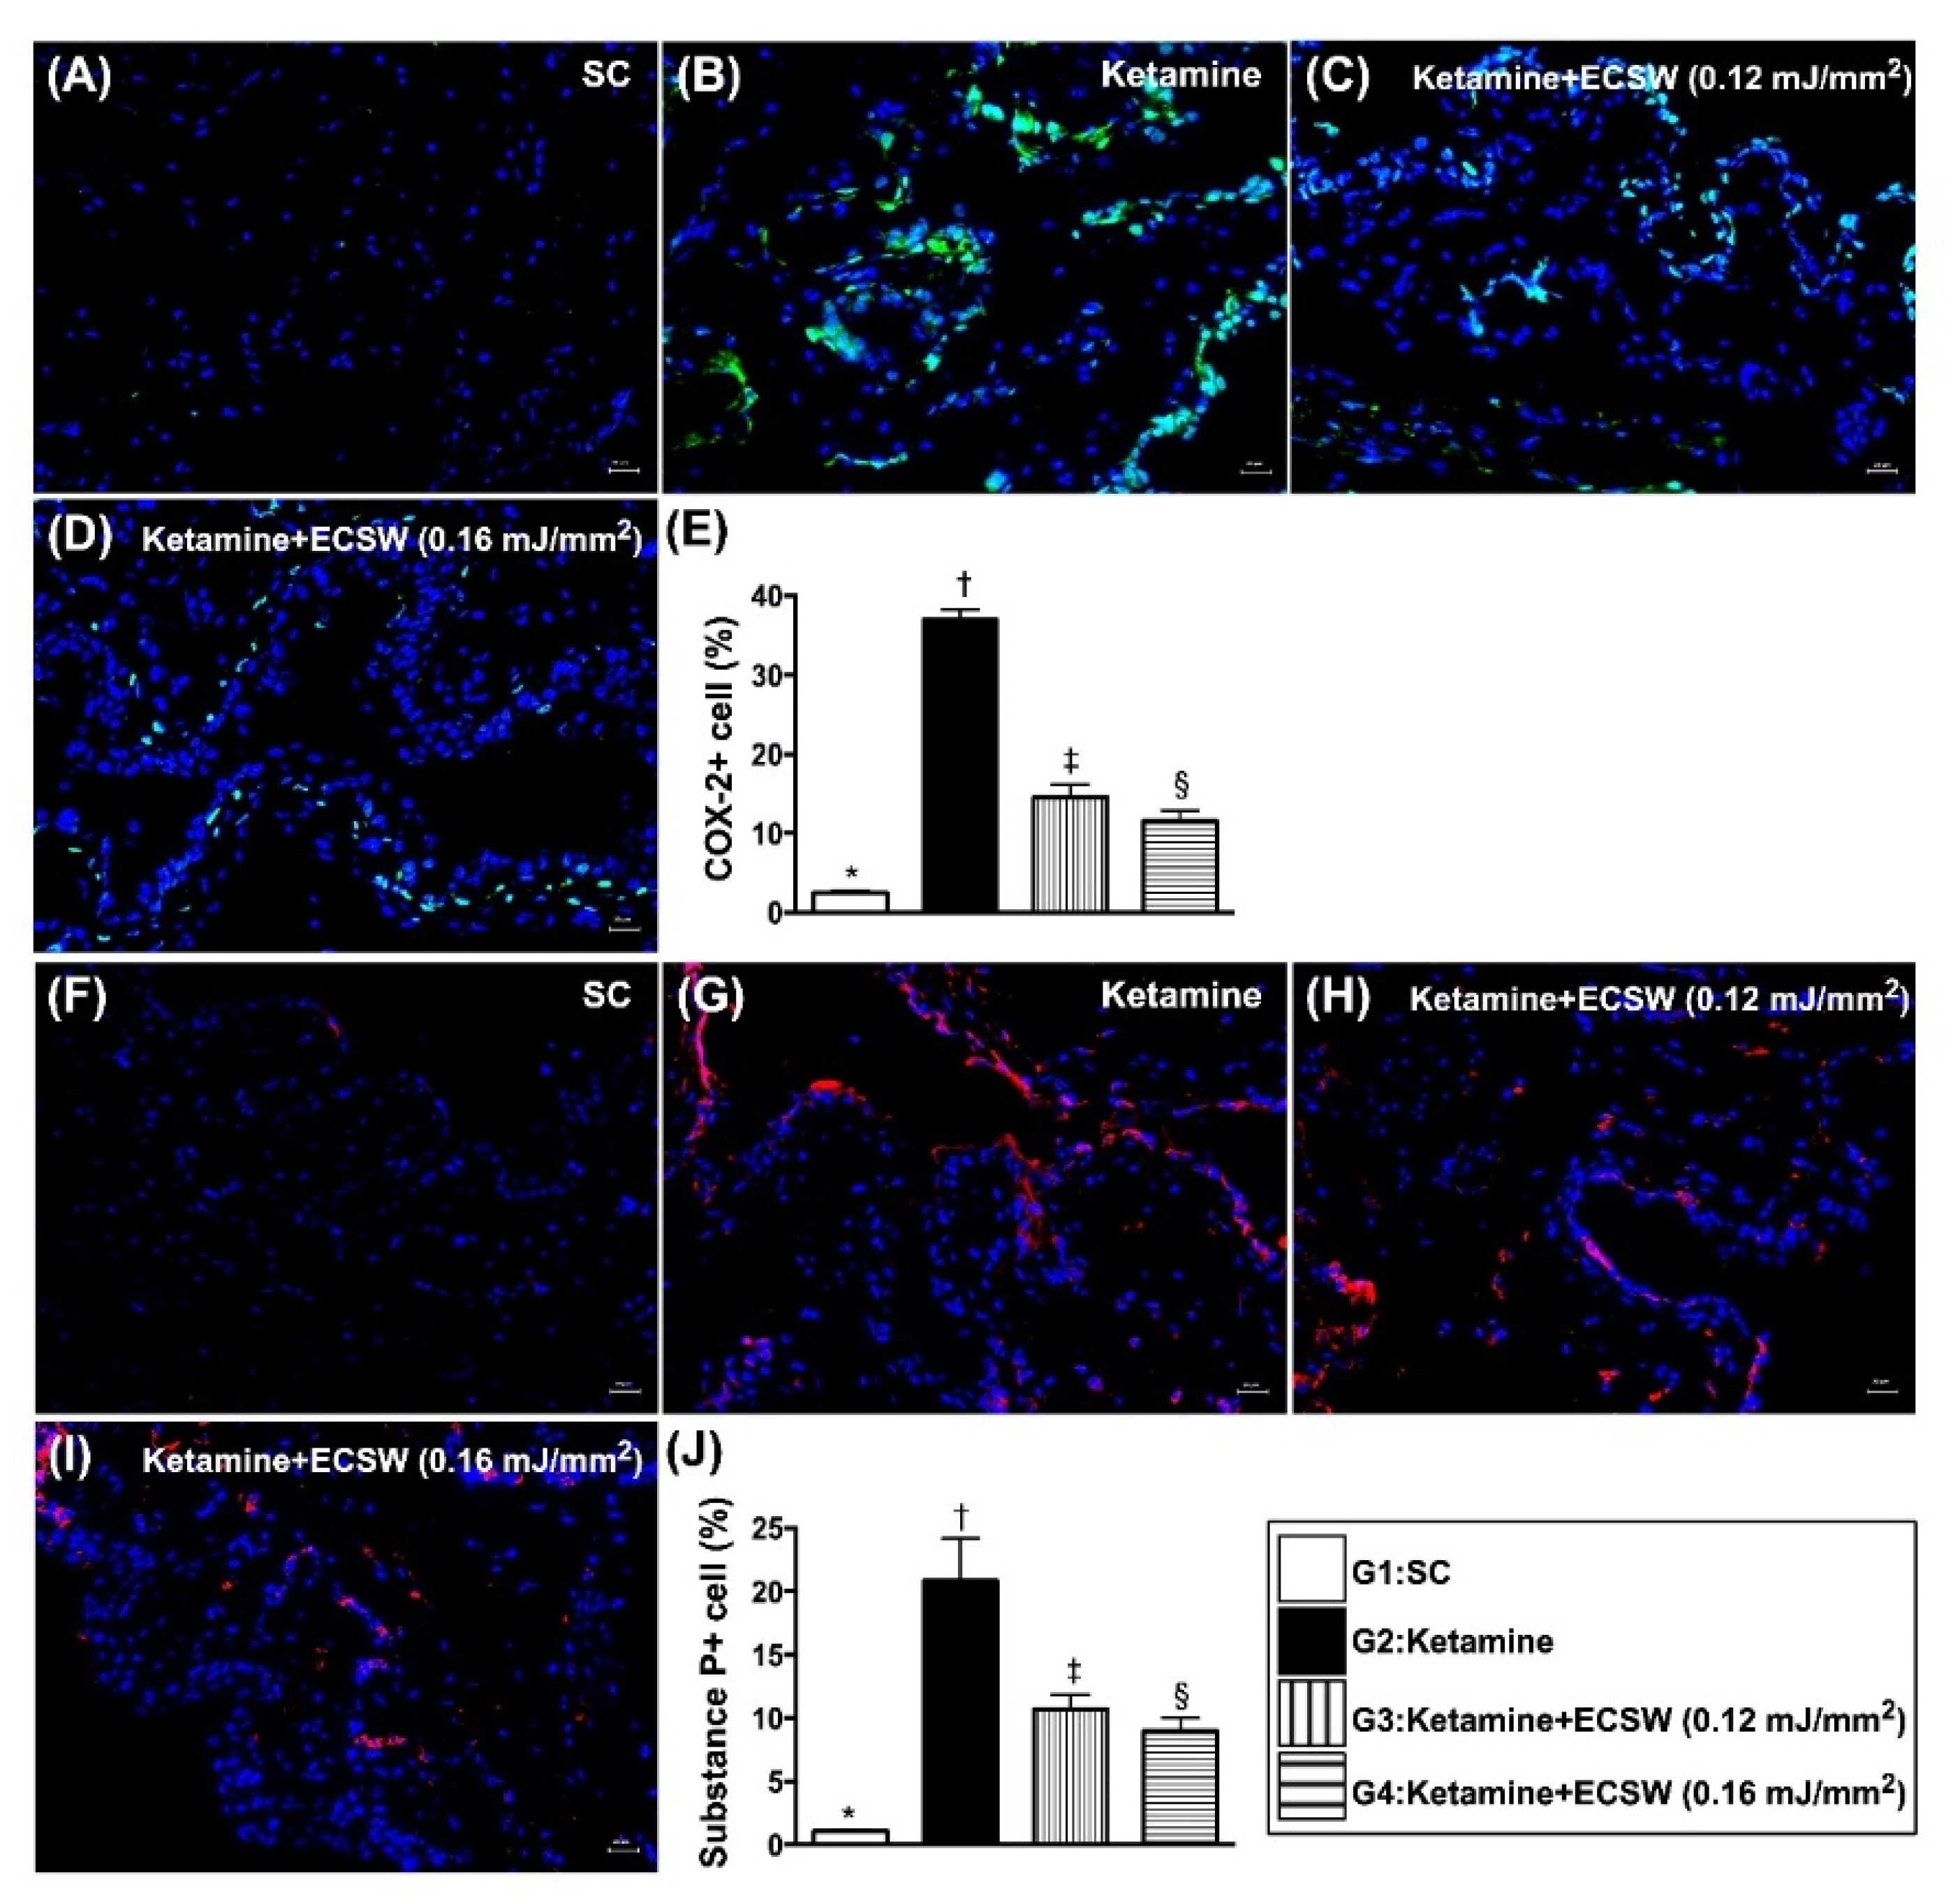
Figure 7.
ECSW therapy reduced the ketamine-induced inflammatory cell infiltration in rat urinary bladder by day 42 after ketamine administration. (A–D) Illustrating the immunofluorescent (IF) microscopic finding (400×) for identification of positively-stained COX-2 cells (green color). (E) Analytical result of percentage of COX-2+ cells in high-power field, * vs. other groups with different symbols (†, ‡, §), p < 0.0001. (F–I) Illustrating the IF microscopic finding (400×) for identification of positively-stained substance P cells (red color). (J) Analytical result of percentage of substance P+ cells in high-power field, * vs. other groups with different symbols (†, ‡, §), p < 0.0001. Scale bar in right lower corner represents 20 µm. All statistical analyses were performed by one-way ANOVA, followed by Bonferroni multiple comparison post hoc test (n = 6 for each group). Symbols (*, †, ‡, §) indicate significance (at 0.05 level). ECSW = extracorporeal shock wave.
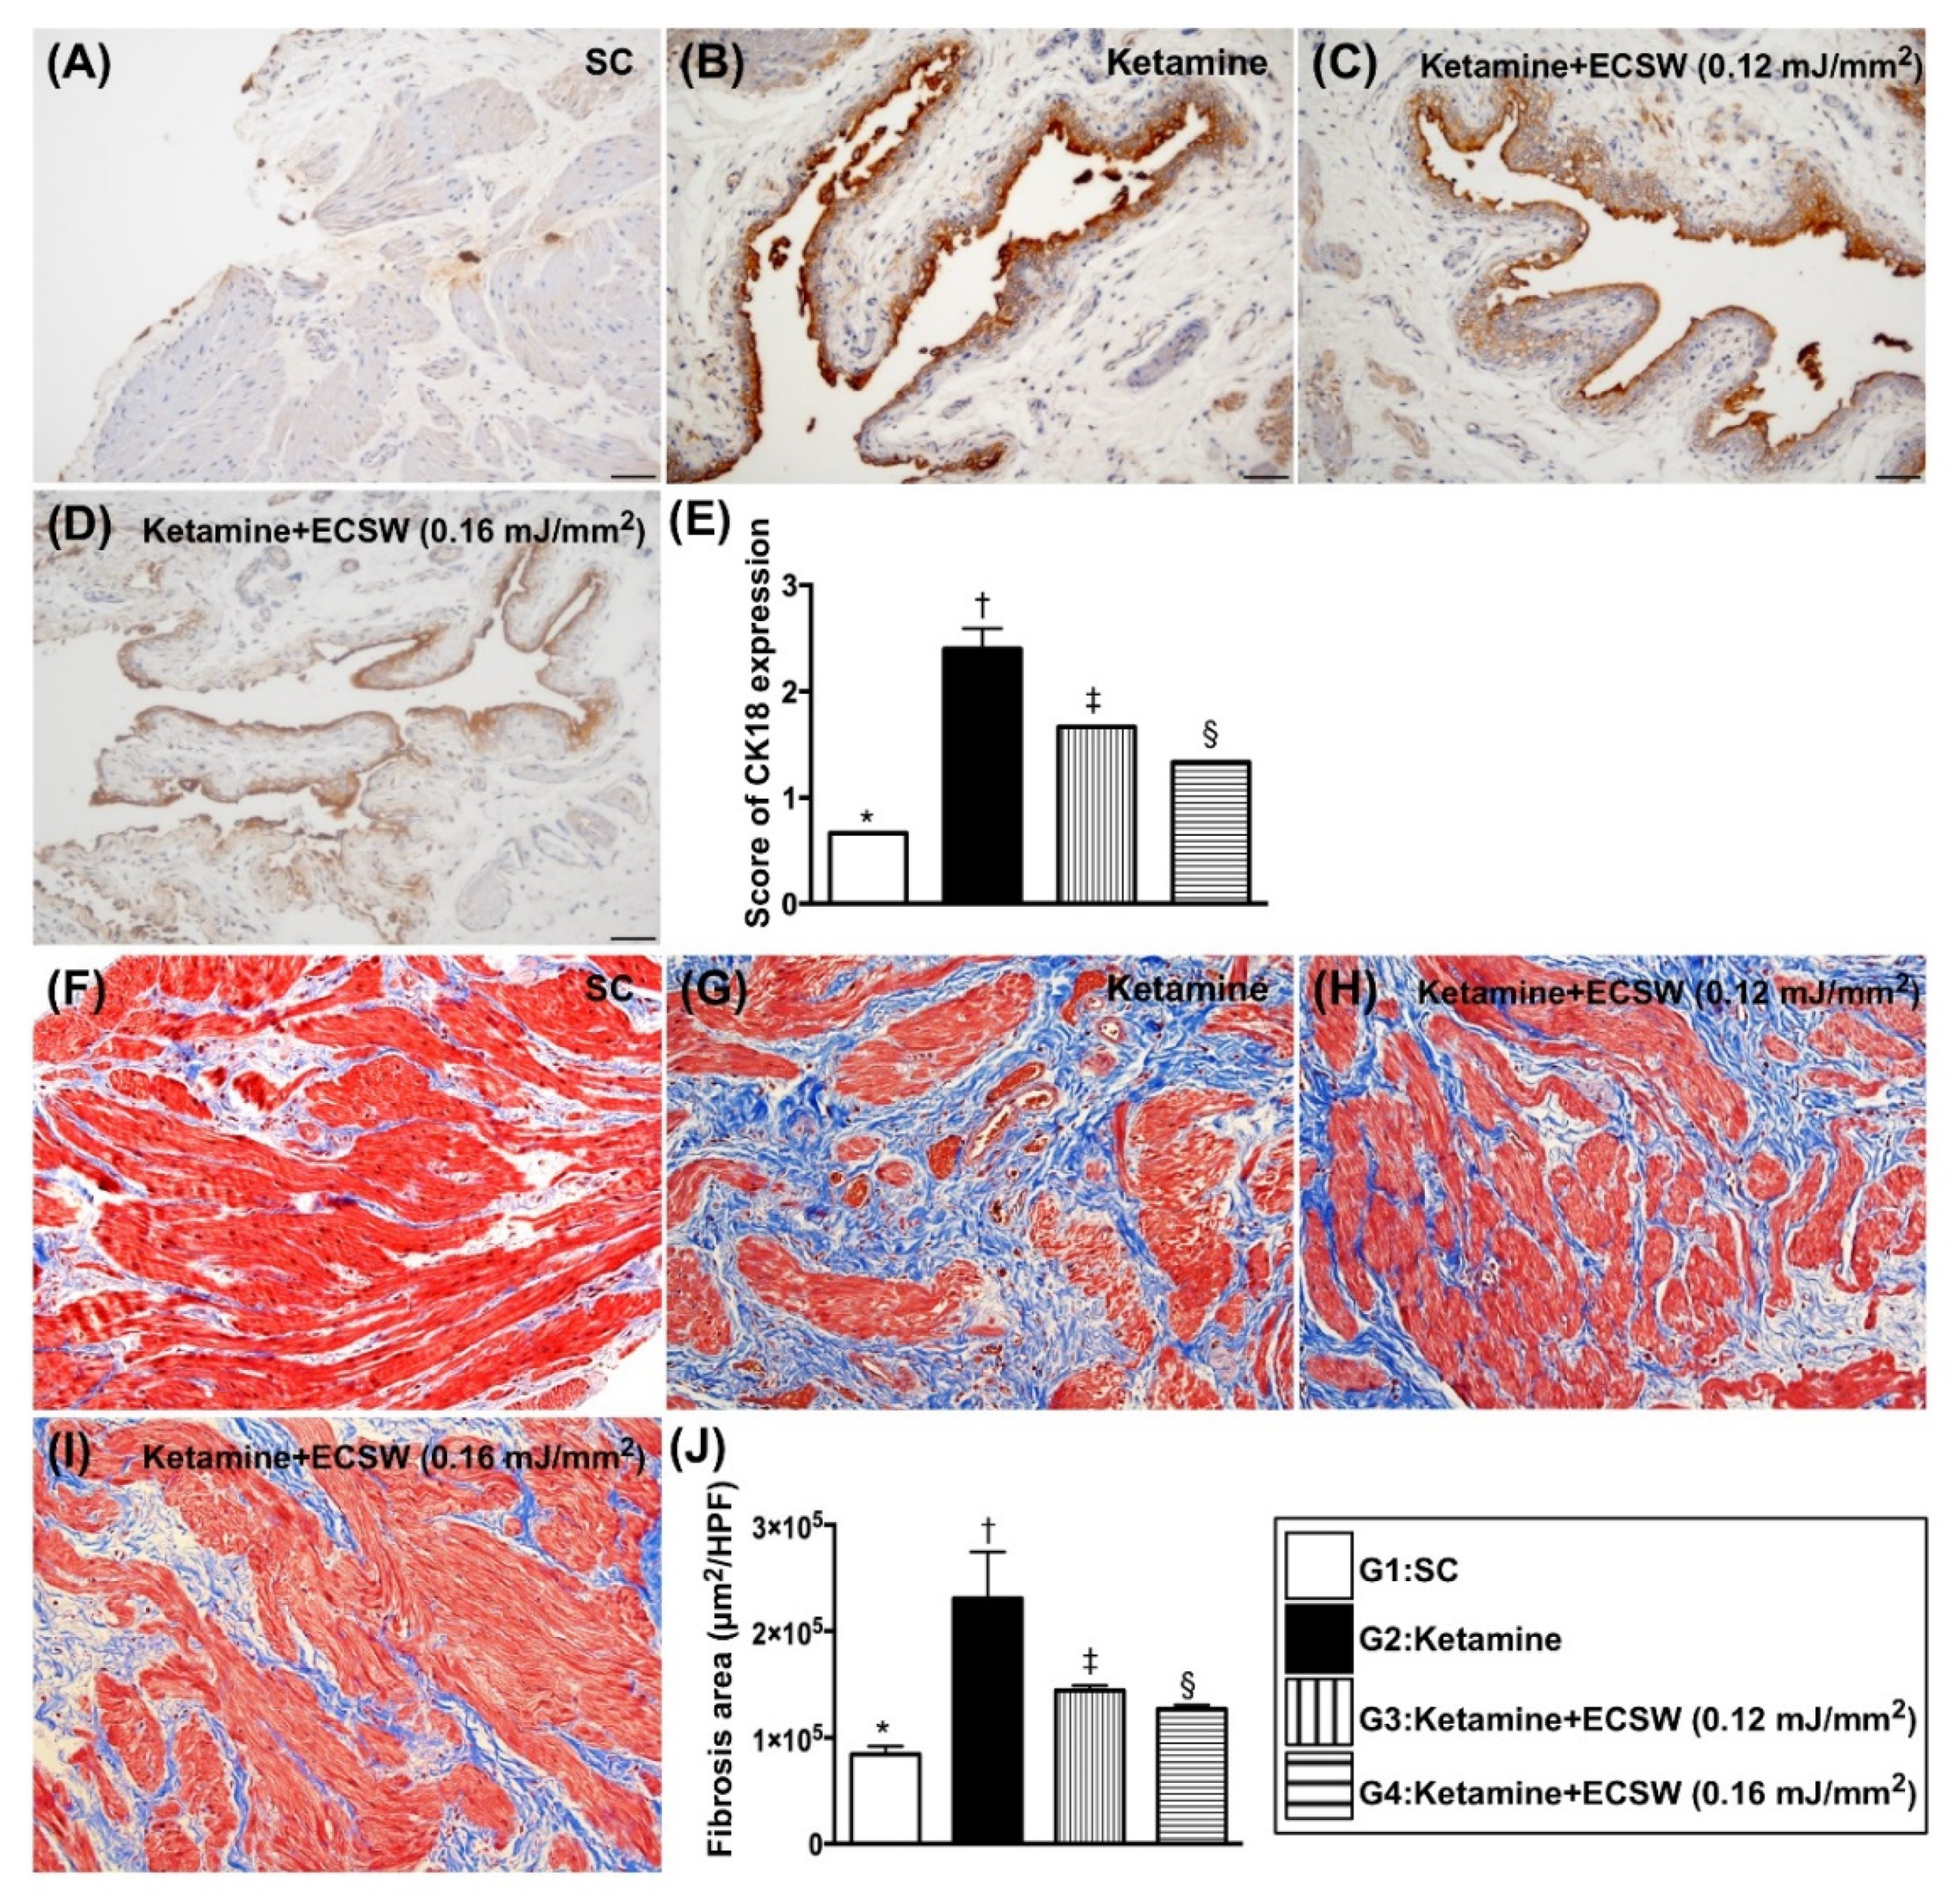
Figure 8.
ECSW therapy reduced the ketamine-induced fibrosis and keratinization of urinary bladder by day 42 after ketamine administration. (A–D) Illustrating the immunohistochemical (IHC) microscopic finding (200×) for identification of IHC stained intensity of CK18 in urinary bladder epithelial layer (gray color). (E) Scoring intensity of CK18 positively-stained expression, * vs. other groups with different symbols (†, ‡, §), p < 0.0001. (F–I) Illustrating the Masson’s trichrome stain (200×) for identification of fibrosis area in urinary bladder muscle (blue color). (J) Analytical result of fibrotic area, * vs. other groups with different symbols (†, ‡, §), p < 0.0001. Scale bar in right lower corner represents 50 µm. All statistical analyses were performed by one-way ANOVA, followed by Bonferroni multiple comparison post hoc test (n = 6 for each group). Symbols (*, †, ‡, §) indicate significance (at 0.05 level). ECSW = extracorporeal shock wave.
Figure 9.
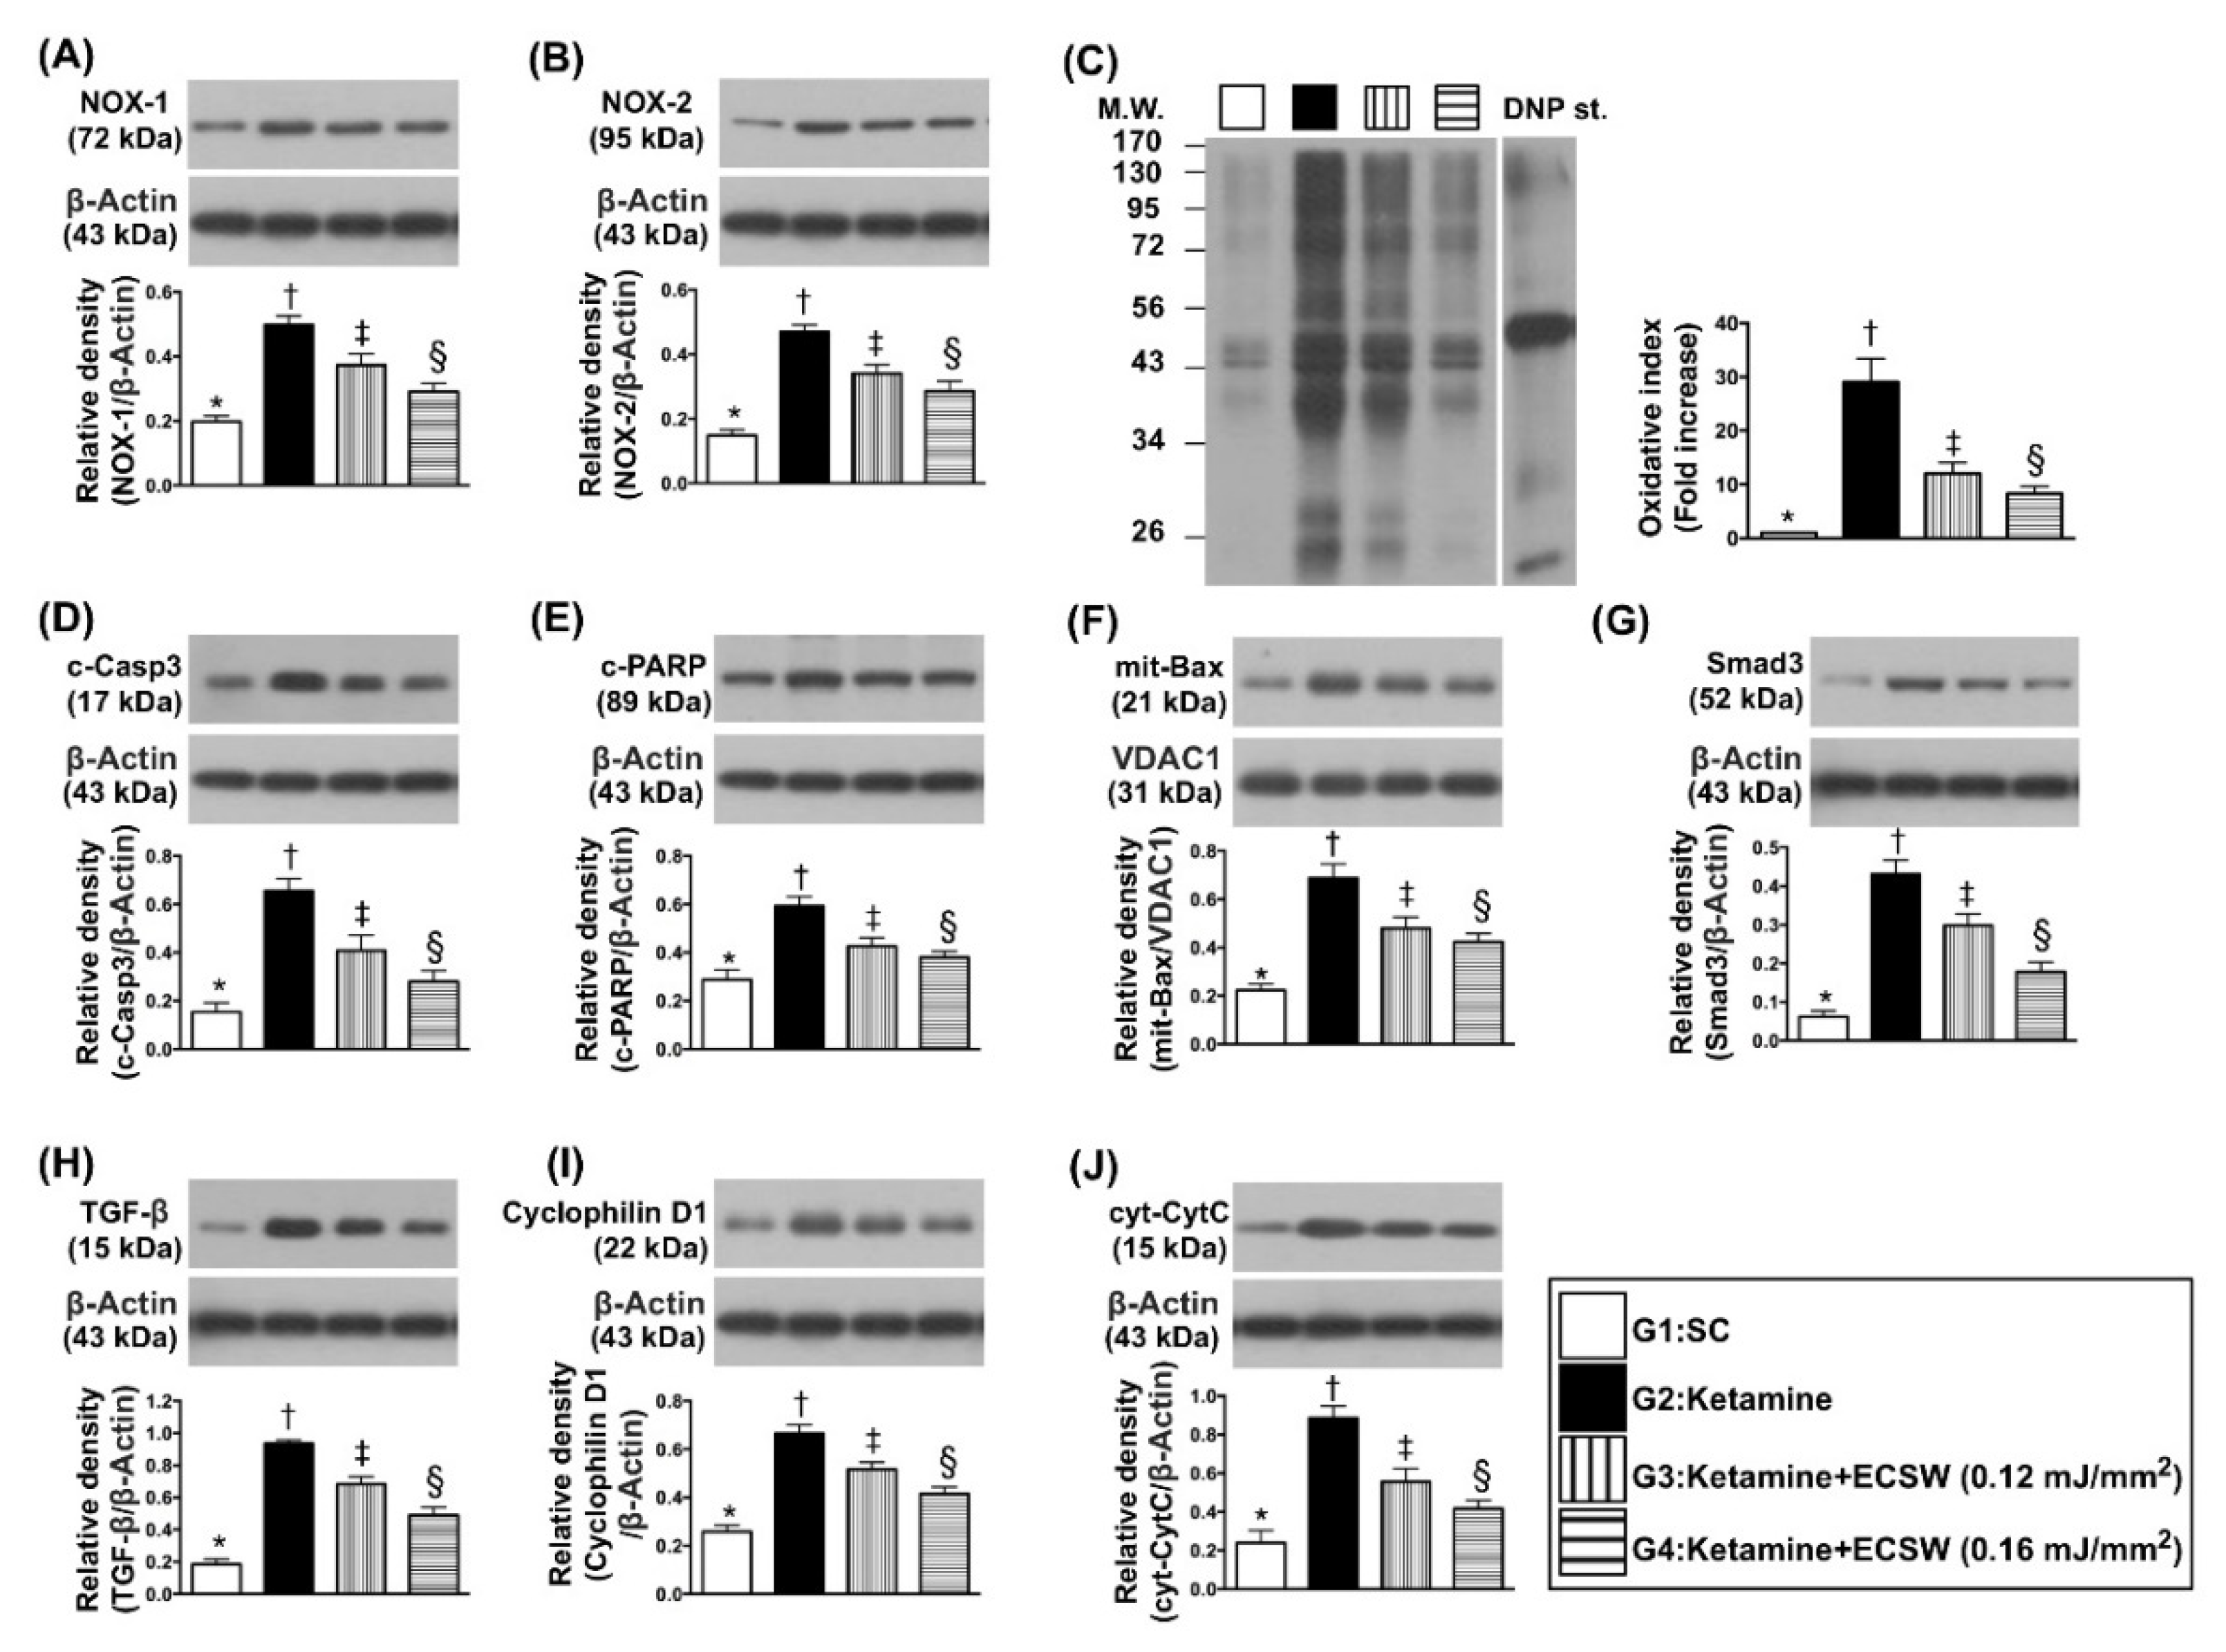
ECSW suppressed the protein levels of oxidative stress, apoptosis, fibrosis and mitochondrial damage in rat urinary bladder by day 42 after ketamine administration. (A) Protein expression of NOX-1, * vs. other groups with different symbols (†, ‡, §), p < 0.0001. (B) Protein expression of NOX-2, * vs. other groups with different symbols (†, ‡, §), p < 0.0001. (C) The oxidized protein expression, * vs. other groups with different symbols (†, ‡, §), p < 0.0001 (Note: The left and right lanes shown on the upper panel represent protein molecular weight marker and control oxidized molecular protein standard, respectively). M.W. = molecular weight; DNP = 1–3 dinitrophenylhydrazone. (D) Protein expression of cleaved caspase 3 (c-Casp3), * vs. other groups with different symbols (†, ‡, §), p < 0.0001. (E) Protein expression of cleaved Poly ADP-ribose polymerase (c-PARP), * vs. other groups with different symbols (†, ‡, §), p < 0.0001. (F) Protein expression of mitochondrial (mit)-Bax, * vs. other groups with different symbols (†, ‡, §), p < 0.0001. (G) Protein expression of Smad3, * vs. other groups with different symbols (†, ‡, §), p < 0.0001. (H) Protein expression of transforming growth factor (TGF)-ß, * vs. other groups with different symbols (†, ‡, §), p < 0.0001. (I) Protein expression of cyclophilin D, * vs. other groups with different symbols (†, ‡, §), p < 0.0001. (J) Protein expression of cytosolic cytochrome c (cyt-CytC), * vs. other groups with different symbols (†, ‡, §), p < 0.0001. All statistical analyses were performed by one-way ANOVA, followed by Bonferroni multiple comparison post hoc test (n = 6 for each group). Symbols (*, †, ‡, §) indicate significance (at 0.05 level). ECSW = extracorporeal shock wave.
Figure 9.
ECSW suppressed the protein levels of oxidative stress, apoptosis, fibrosis and mitochondrial damage in rat urinary bladder by day 42 after ketamine administration. (A) Protein expression of NOX-1, * vs. other groups with different symbols (†, ‡, §), p < 0.0001. (B) Protein expression of NOX-2, * vs. other groups with different symbols (†, ‡, §), p < 0.0001. (C) The oxidized protein expression, * vs. other groups with different symbols (†, ‡, §), p < 0.0001 (Note: The left and right lanes shown on the upper panel represent protein molecular weight marker and control oxidized molecular protein standard, respectively). M.W. = molecular weight; DNP = 1–3 dinitrophenylhydrazone. (D) Protein expression of cleaved caspase 3 (c-Casp3), * vs. other groups with different symbols (†, ‡, §), p < 0.0001. (E) Protein expression of cleaved Poly ADP-ribose polymerase (c-PARP), * vs. other groups with different symbols (†, ‡, §), p < 0.0001. (F) Protein expression of mitochondrial (mit)-Bax, * vs. other groups with different symbols (†, ‡, §), p < 0.0001. (G) Protein expression of Smad3, * vs. other groups with different symbols (†, ‡, §), p < 0.0001. (H) Protein expression of transforming growth factor (TGF)-ß, * vs. other groups with different symbols (†, ‡, §), p < 0.0001. (I) Protein expression of cyclophilin D, * vs. other groups with different symbols (†, ‡, §), p < 0.0001. (J) Protein expression of cytosolic cytochrome c (cyt-CytC), * vs. other groups with different symbols (†, ‡, §), p < 0.0001. All statistical analyses were performed by one-way ANOVA, followed by Bonferroni multiple comparison post hoc test (n = 6 for each group). Symbols (*, †, ‡, §) indicate significance (at 0.05 level). ECSW = extracorporeal shock wave.
![Biomedicines 09 01391 g009]()
Figure 10.
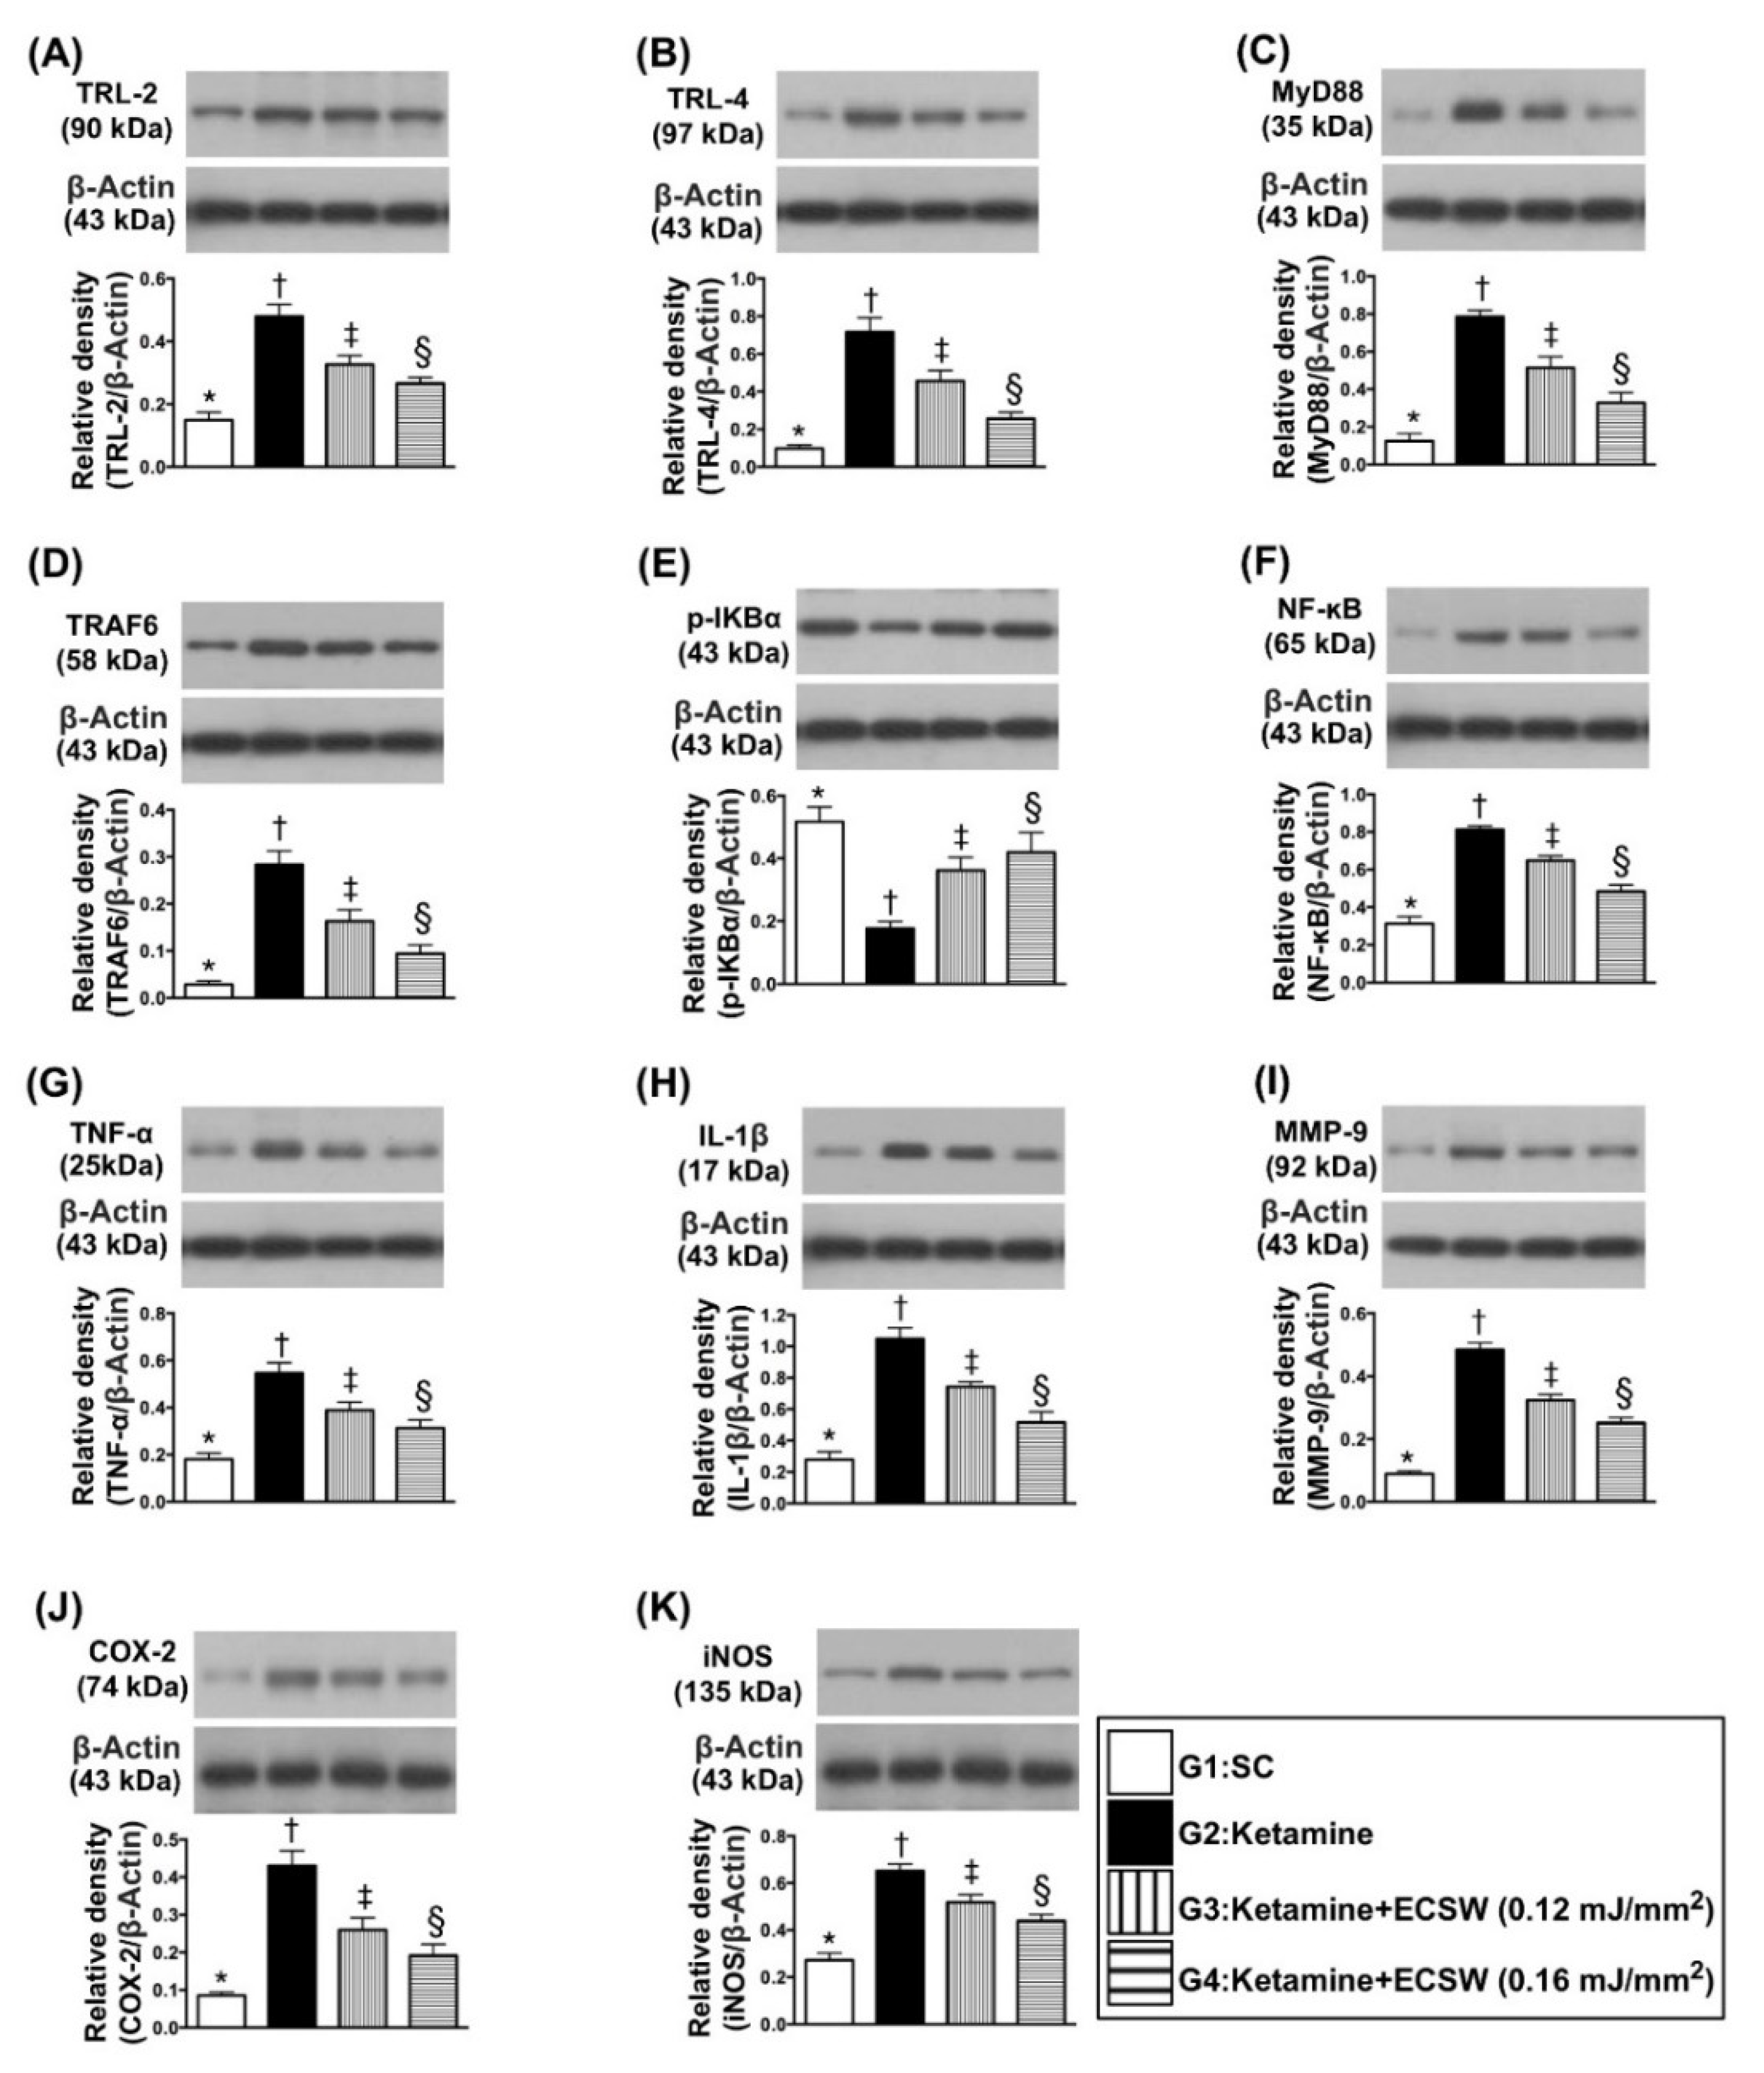
ECSW therapy suppressed the protein levels of inflammatory signalings in rat urinary bladder by day 42 after ketamine administration. (A) Protein expression of Toll-like receptor (TLR)-2, * vs. other groups with different symbols (†, ‡, §), p < 0.0001. (B) Protein expression of TLR-4, * vs. other groups with different symbols (†, ‡, §), p < 0.0001. (C) Protein expression of MyD88, * vs. other groups with different symbols (†, ‡, §), p < 0.0001. (D) Protein expression of TRAF6, * vs. other groups with different symbols (†, ‡, §), p < 0.0001. (E) Protein expression of p-IKB-α, * vs. other groups with different symbols (†, ‡, §), p < 0.0001. (F) Protein expression of NF-κB, * vs. other groups with different symbols (†, ‡, §), p < 0.0001. (G) Protein expression of TNF-α, * vs. other groups with different symbols (†, ‡, §), p < 0.0001. (H) Protein expression of interleukin (IL)-1ß, * vs. other groups with different symbols (†, ‡, §), p < 0.0001. (I) Protein expression of MMP-9, * vs. other groups with different symbols (†, ‡, §), p < 0.0001. (J) Protein expression of COX-2, * vs. other groups with different symbols (†, ‡, §), p < 0.0001. (K) Protein expression of and iNOS, * vs. other groups with different symbols (†, ‡, §), p < 0.0001. All statistical analyses were performed by one-way ANOVA, followed by Bonferroni multiple comparison post hoc test (n = 6 for each group). Symbols (*, †, ‡, §) indicate significance (at 0.05 level). ECSW = extracorporeal shock wave.
Figure 10.
ECSW therapy suppressed the protein levels of inflammatory signalings in rat urinary bladder by day 42 after ketamine administration. (A) Protein expression of Toll-like receptor (TLR)-2, * vs. other groups with different symbols (†, ‡, §), p < 0.0001. (B) Protein expression of TLR-4, * vs. other groups with different symbols (†, ‡, §), p < 0.0001. (C) Protein expression of MyD88, * vs. other groups with different symbols (†, ‡, §), p < 0.0001. (D) Protein expression of TRAF6, * vs. other groups with different symbols (†, ‡, §), p < 0.0001. (E) Protein expression of p-IKB-α, * vs. other groups with different symbols (†, ‡, §), p < 0.0001. (F) Protein expression of NF-κB, * vs. other groups with different symbols (†, ‡, §), p < 0.0001. (G) Protein expression of TNF-α, * vs. other groups with different symbols (†, ‡, §), p < 0.0001. (H) Protein expression of interleukin (IL)-1ß, * vs. other groups with different symbols (†, ‡, §), p < 0.0001. (I) Protein expression of MMP-9, * vs. other groups with different symbols (†, ‡, §), p < 0.0001. (J) Protein expression of COX-2, * vs. other groups with different symbols (†, ‡, §), p < 0.0001. (K) Protein expression of and iNOS, * vs. other groups with different symbols (†, ‡, §), p < 0.0001. All statistical analyses were performed by one-way ANOVA, followed by Bonferroni multiple comparison post hoc test (n = 6 for each group). Symbols (*, †, ‡, §) indicate significance (at 0.05 level). ECSW = extracorporeal shock wave.
![Biomedicines 09 01391 g010]()
Figure 11.
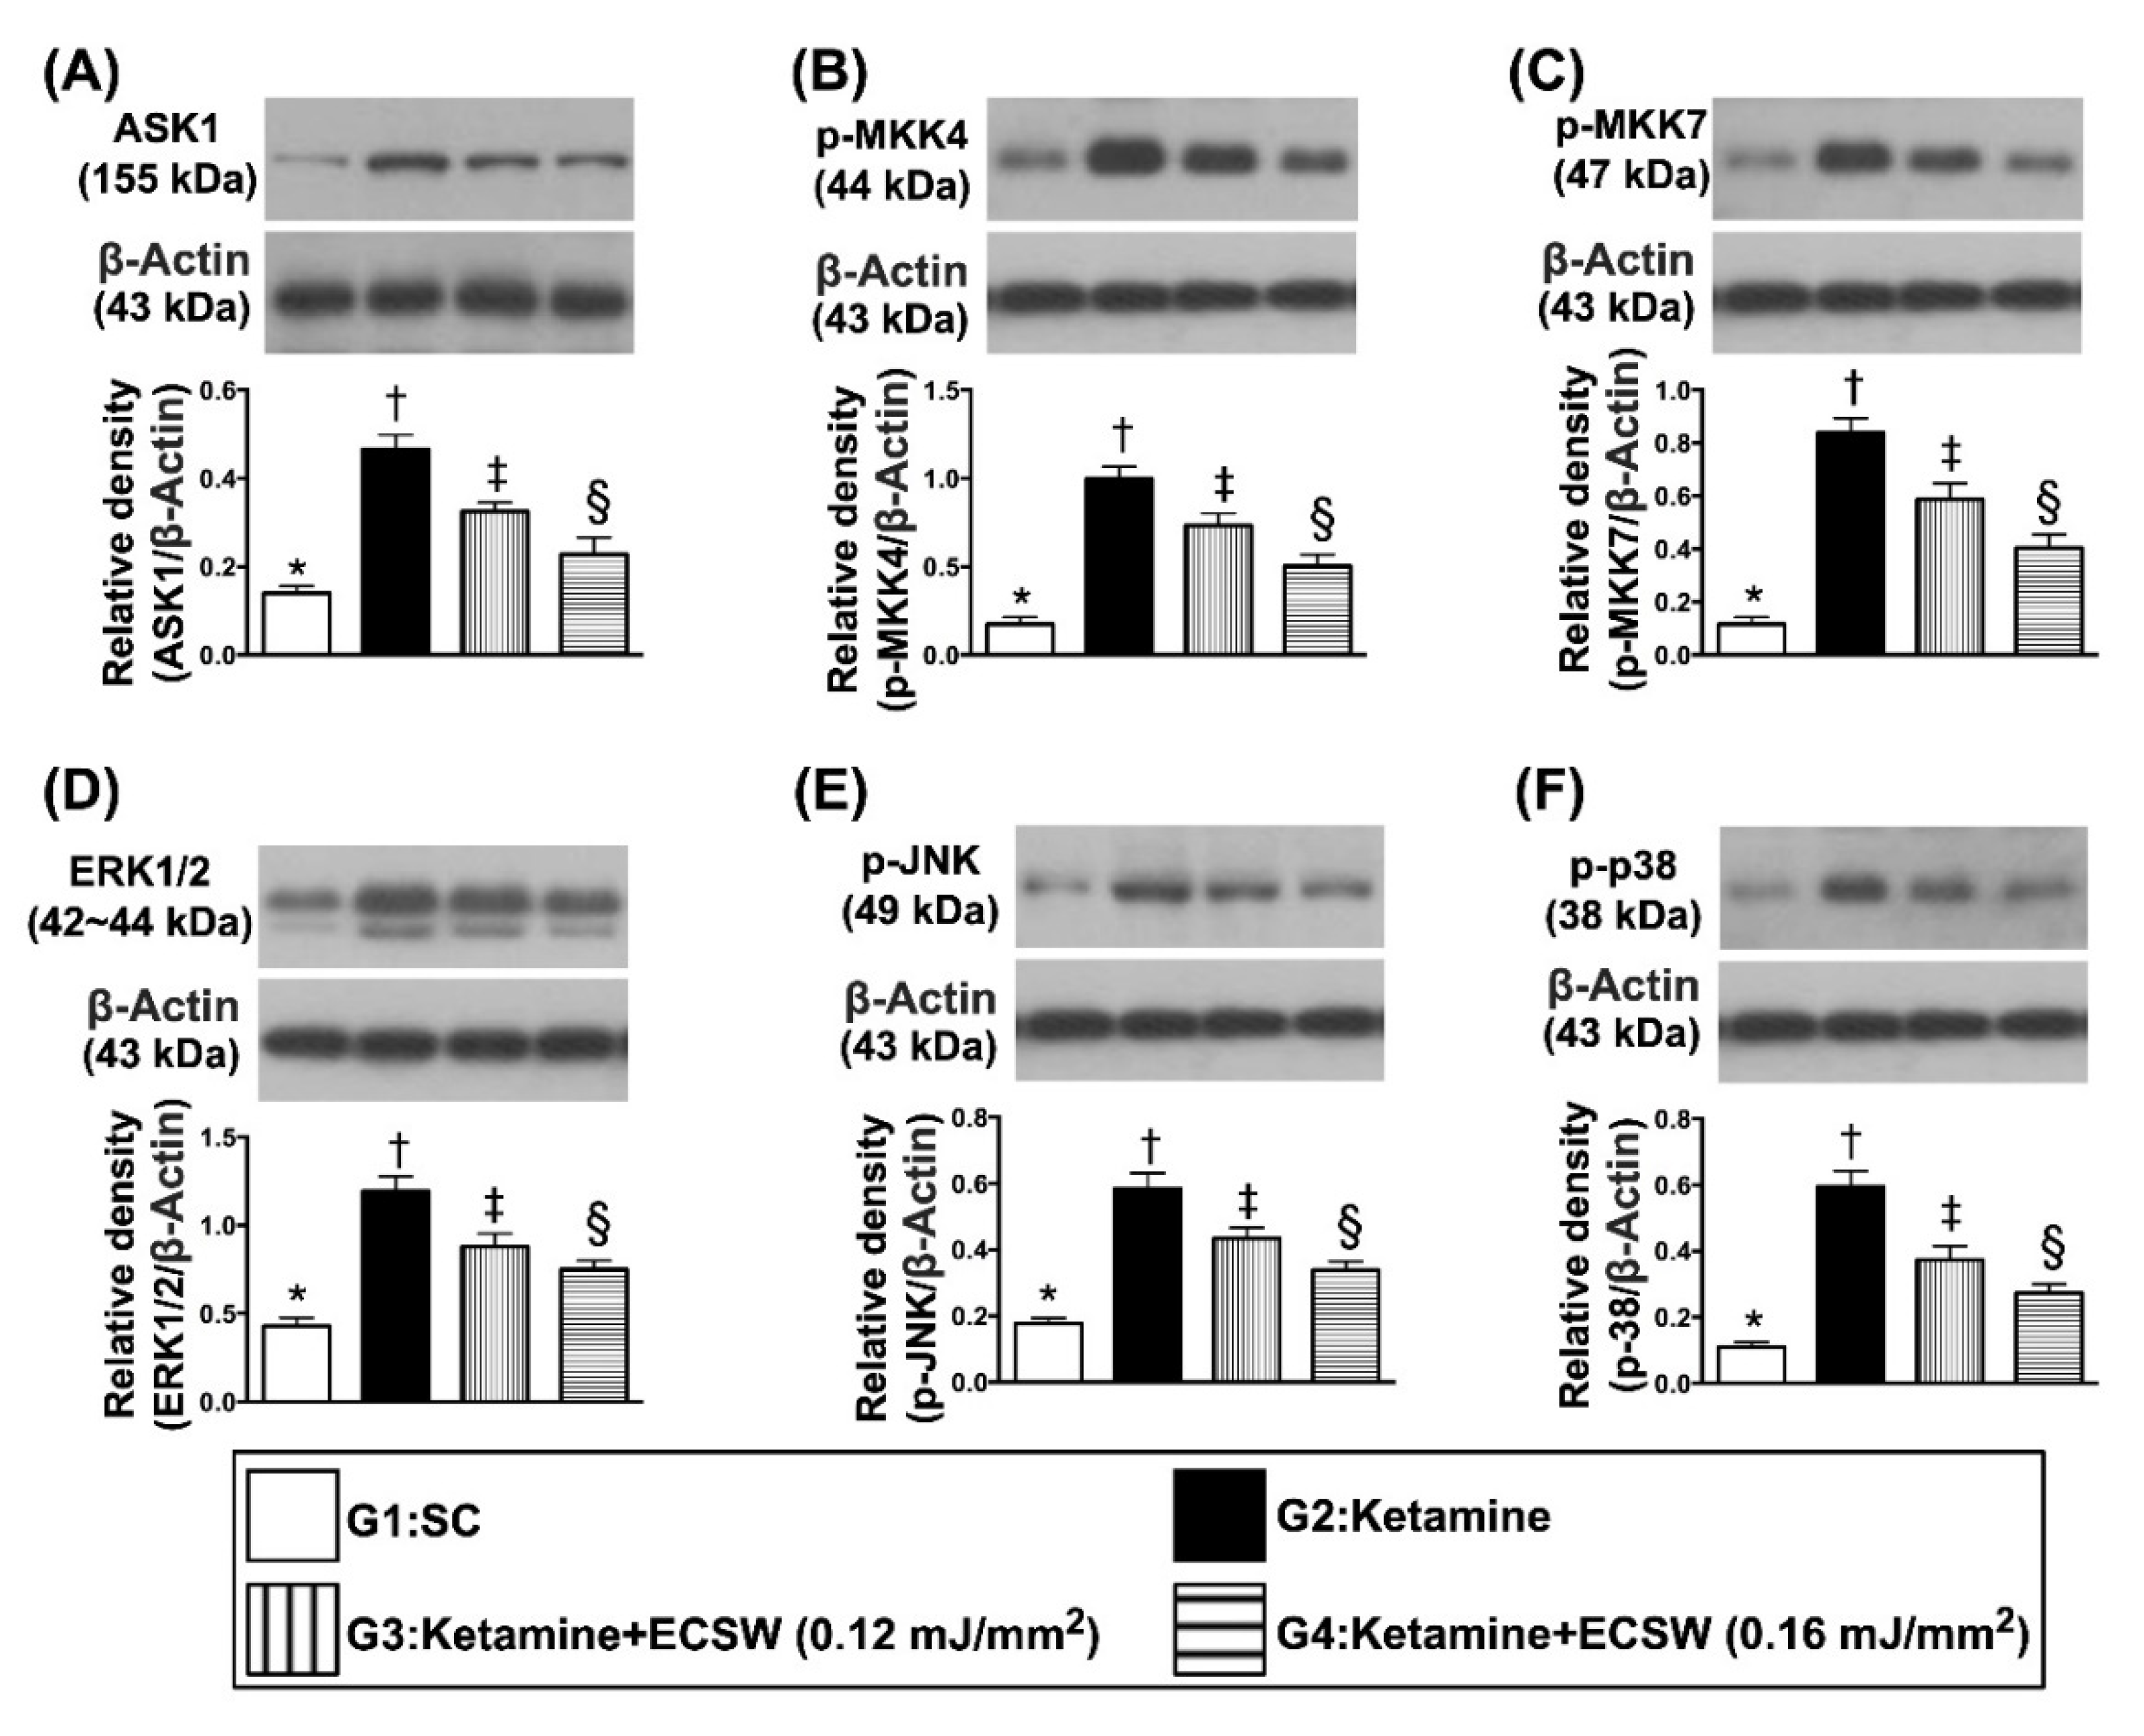
ECSW therapy regulated the protein levels of cell-stress response signalings in rat urinary bladder by day 42 after ketamine administration. (A) Protein expression of ASK1, * vs. other groups with different symbols (†, ‡, §), p < 0.0001. (B) Protein expression of p-MKK4, * vs. other groups with different symbols (†, ‡, §), p < 0.0001. (C) Protein expression of p-MKK7, * vs. other groups with different symbols (†, ‡, §), p < 0.0001. (D) Protein expression of ERK1/2, * vs. other groups with different symbols (†, ‡, §), p < 0.0001. (E) Protein expression of p-JNK, * vs. other groups with different symbols (†, ‡, §), p < 0.0001. (F) Protein expression of p-p38, * vs. other groups with different symbols (†, ‡, §), p < 0.0001. All statistical analyses were performed by one-way ANOVA, followed by Bonferroni multiple comparison post hoc test (n = 6 for each group). Symbols (*, †, ‡, §) indicate significance (at 0.05 level). ECSW = extracorporeal shock wave.
Figure 11.
ECSW therapy regulated the protein levels of cell-stress response signalings in rat urinary bladder by day 42 after ketamine administration. (A) Protein expression of ASK1, * vs. other groups with different symbols (†, ‡, §), p < 0.0001. (B) Protein expression of p-MKK4, * vs. other groups with different symbols (†, ‡, §), p < 0.0001. (C) Protein expression of p-MKK7, * vs. other groups with different symbols (†, ‡, §), p < 0.0001. (D) Protein expression of ERK1/2, * vs. other groups with different symbols (†, ‡, §), p < 0.0001. (E) Protein expression of p-JNK, * vs. other groups with different symbols (†, ‡, §), p < 0.0001. (F) Protein expression of p-p38, * vs. other groups with different symbols (†, ‡, §), p < 0.0001. All statistical analyses were performed by one-way ANOVA, followed by Bonferroni multiple comparison post hoc test (n = 6 for each group). Symbols (*, †, ‡, §) indicate significance (at 0.05 level). ECSW = extracorporeal shock wave.


 ,
, 


