
Carbon Dioxide Reactivity of Brain Tissue Oxygenation after Pediatric Traumatic Brain Injury


1
Barrow Neurological Institute at Phoenix Children’s Hospital, Phoenix, AZ 85016, USA
2
Department of Neurology, University of Colorado School of Medicine, Aurora, CO 80045, USA
*
Author to whom correspondence should be addressed.
Children 2022, 9(3), 409; https://0-doi-org.brum.beds.ac.uk/10.3390/children9030409
Submission received: 30 January 2022
/
Revised: 7 March 2022
/
Accepted: 11 March 2022
/
Published: 14 March 2022
(This article belongs to the Special Issue Pediatric Neurocritical Care and Neurotrauma Recovery)
Abstract
:Background: We investigated how changes in partial pressure of brain tissue oxygenation (PbtO2) relate to end-tidal carbon dioxide (EtCO2) after pediatric traumatic brain injury (TBI). Methods: Dynamic structural equation modeling (DSEM) was used to investigate associations between EtCO2 and PbtO2, with positive associations indicating intact CO2 reactivity of PbtO2, and negative associations indicating impaired reactivity. Sub-analyses were performed to investigate associations of PbtO2 to intracranial pressure (ICP), arterial blood pressure (ABP) and cerebral regional oximetry (rSO2). Results: Among 14 patients, a positive association between PbtO2 and EtCO2 was demonstrated (SRC 0.05, 95% CI [0.04, 0.06]), with 9 patients demonstrating intact CO2 reactivity and 5 patients demonstrating impaired reactivity. Patients demonstrating intact CO2 reactivity had positive associations between PbtO2 and ICP (0.22 [0.21, 0.23]), whereas patients with impaired reactivity had negative associations (−0.28 [−0.29, −0.28]). Patients demonstrating intact CO2 reactivity had negative associations between PbtO2 and rSO2 (−0.08 [−0.09, −0.08]), whereas patients with impaired reactivity had positive associations (−0.15 [0.14, 0.16]). Compared to patients with intact CO2 reactivity, those with impaired reactivity had increased ICP (p < 0.0000), lower PbtO2 (p < 0.0000) and higher PRx (p = 0.0134). Conclusion: After TBI, CO2 reactivity of PbtO2 can be heterogenous, necessitating further work investigating factors contributing toward impaired reactivity.
1. Introduction
Traumatic brain injury (TBI) is the most common cause of death and disability among children and young adults worldwide [1,2]. Current management of TBI is based on Brain Trauma Foundation (BTF) guidelines [3]; however, these include only Level II and III recommendations. Despite numerous clinical trials, high quality evidence is still absent to guide clinical management of TBI toward optimization of long-term functional outcomes [4]. Existing management strategies focus on the prevention of secondary brain insults that may contribute toward worsened outcomes, including but not limited to maintenance of adequate cerebral blood flow (CBF) and oxygenation.
In order to mitigate secondary brain injury and improve long-term outcomes, optimization of brain tissue oxygenation is an important element to pediatric TBI management. Continuous measurements of the partial pressure of brain tissue oxygenation (PbtO2) can be monitored using a micro-Clark electrode surgically implanted within brain parenchyma [5]. Level III recommendations exist in current TBI guidelines to maintain PbtO2 values > 10 mmHg [3]. The mechanisms to optimize brain tissue oxygenation and avoid hypoxia include maintenance of appropriate cerebral perfusion and adjustment of ventilation to influence arterial content of partial pressure of carbon dioxide (PaCO2) [6]. Carbon dioxide is a potent vasodilator of cerebral small vessel arterioles, with changes in PaCO2 directionally related to alterations in CBF [7]. Cerebrovascular carbon dioxide (CO2) reactivity is a relatively linear response within physiological ranges. However, beyond the limits of vasoconstrictive and vasodilatory capacity, alterations in PaCO2 may induce derangements in CBF [7]. Since carbon dioxide (CO2) also affects cerebrovascular resistance, deliberate changes in CO2 partial pressure have been considered as useful to manipulate CBF regulation in an environment of impaired autoregulation and disrupted blood brain barrier (BBB) [8]. However, limited information is available regarding temporal relations of PbtO2 and PaCO2 after severe TBI. In a few studies, researchers reported that hyperventilation to induce cerebral vasoconstriction and reduce CBF, intracranial pressure (ICP), and cerebral blood volume may unintentionally lead to brain tissue hypoxia after TBI. Furthermore, adjustments in PaCO2 to optimize PbtO2 may not be effective if CO2 vasoreactivity is diminished [7]. The magnitude and extent of BBB breakdown carries potential critical implications regarding what neuroprotective measures in neurocritical care may optimize or even deteriorate brain oxygenation and homeostasis [9].
In this study, we aimed to identify times series associations between end-tidal carbon dioxide content (EtCO2) and PbtO2 as well as their relationships with intracranial pressure (ICP), arterial blood pressure (ABP) and cerebral regional oxygen saturation (rSO2). We hypothesized that in the context of time series, and EtCO2 and PbtO2 are associated with each other, but the direction of the association may change depending on the status of the systemic and local tissue characteristics of the injured brain.
2. Materials and Methods
2.1. Study Design
This is a retrospective study from a prospective clinical database. The study was conducted at Phoenix Children’s Hospital (PCH) and was approved by the PCH Institutional Review Board (IRB: 20-284).
Pediatric patients (<21 years of age) with TBI from a single pediatric intensive monitoring unit were retrospectively analyzed, undergoing multimodality neurologic monitoring that included continuous synchronized measurements of ICP, ABP, EtCO2, rSO2 and PbtO2. ABP monitoring was assessed from a radial arterial line. ICP monitoring was performed using an intraparenchymal probe (Codman ICP Monitor, Integra Life Sciences, Billerica, MA, USA). EtCO2 was monitored by capnograph connected to the endotracheal tube. PbtO2 monitoring was performed using an intraparenchymal micro-Clark electrode (Integra Life Sciences, Billerica MA, USA). rSO2 monitoring was monitored using the Covidien INVOS System (Medtronic, Minneapolis, MN, USA). Patients were managed according to institutional guidelines founded upon the most up to date pediatric TBI guidelines at the time [3,10].
2.2. Patients
Demographic patient information included age, sex, and race. Injury characteristics included Glasgow Coma Scale (GCS) score at presentation on day of admission. GCS scores range from 3 to 15 with lower scores indicative of higher injury severity. Primary injury mechanisms were also described including closed, crush, and penetrating injuries [11]. Functional outcome characteristics included Glasgow Outcome Scale—Extended Pediatrics (GOSE-Peds) collected at 12 months post-injury [12]. GOSE-Peds scores range from 1 to 8 with higher scores indicative of worsened outcomes.
2.3. Physiologic Data
Patients underwent multimodality neurologic monitoring (MMM), which included integration of ICP, ABP, EtCO2, rSO2, and PbtO2 monitoring. Patients underwent rSO2 monitoring either with a single probe on the forehead or bilateral probes on each hemisphere. When bilateral rSO2 monitoring was performed, the monitoring data ipsilateral to the PbtO2 probe was assessed. Continuous physiologic data from all of the monitoring devices were collected and time-synchronized using an MMM device (Moberg CNS200; Moberg ICU Solutions, Philadelphia, PA, USA). ICM+ software (Cambridge, UK) was used to visualize data and export synchronized time series physiologic data at 1 Hz. Data was collected in 5-h epochs on the first day of recording and after PbtO2 calibration was complete. In addition to the above-described physiologic data, we also collected the pressure reactivity index (PRx). PRx is a moving Pearson correlation coefficient relating ICP and ABP with a calculation period of 300 s updated every 60 s. PRx is an indicator of cerebrovascular pressure reactivity (CVPR) with values approaching −1 representing efficient CVPR and vales approaching 1 representing inefficient CVPR [13,14,15]. We implemented artifact reduction by excluding timepoints in which there were missing values for any physiologic variable, as well as epochs in which physiologic values were sub-physiologic or supraphysiologic of acceptable ranges. This included utilizing normative ranges of ICP between >0 and 90 mmHg, EtCO2 between 0 and 60 mmHg, ABP between 25 and 140 mmHg, rSO2 between 5–99%, and PbtO2 between >0 and 90 mmHg. Serum hemoglobin levels were drawn during the analysis period or just before it was collected. ABP, ICP, EtCO2, rSO2, PbtO2, PRx and hemoglobin data were summarized using descriptive statistics including the median value and interquartile range [IQR].
2.4. Pharmacologic Data
To explore whether pharmacological agents may play a role in physiologic patterns, we described the use of sedative, vasoactive, and hyperosmolar agents used during the analysis period for each patient. Sedative pharmacotherapy included fentanyl, morphine, propofol and dexmedetomidine. Vasoactive agents included norepinephrine and epinephrine. Hyperosmolar agents included 3% hypertonic saline.
2.5. Statistical Analyses
Demographic data was summarized using descriptive statistics including median and IQR. The strength of association of PbtO2 to ABP, ICP, rSO2 and EtCO2 was investigated using multivariate dynamic structural equation modeling (DSEM) both at the subject level as well as through grouped and sub-grouped analyses. DSEM is estimated with Bayesian inference methods using the Markov chain Monte Carlo Gibbs sampler and the Metropolis-Hasting sample and is used for analyzing intensive longitudinal data where observations from single or multiple subjects are collected at many points in time [16]. Statistical significance for associations was determined by ascertaining that the 95% credible interval (95% CI) for the standardized regression coefficient (SRC) from DSEM models did not include 0. Significant differences in strength of associations were determined by observing absence of overlap in 95% CI between the groups investigated. The value of SRC reflects the strength of linear associations between the studied physiologic variables. Given known properties of chemoregulation of CBF and its association with cerebral oxygenation, intact CO2 reactivity of PbtO2 was characterized as having a significant positive relationship with EtCO2. Likewise, impaired CO2 reactivity of PbtO2 was characterized as having a significant negative relationship between PbtO2 and EtCO2. Subgroup DSEM analyses were performed to investigate relationships of physiologic variables to PbtO2 within patients who had either intact or impaired CO2 reactivity of PbtO2. Wilcoxon ranked sum test was used to investigate differences in median ICP, PbtO2, EtCO2, rSO2, ABP, PRx, and GOSE-Peds values between patients with intact and impaired CO2 reactivity of PbtO2. Statistical analyses were performed using the statistical software packages SAS 9.4 (SAS Institute, Cary, NC, USA), R Studio Version 3.4.1, and Mplus 8.1 (Muthen and Muthen 1998–2018, Los Angeles, CA, USA).
3. Results
3.1. Patient Characteristics
Patient, trauma, clinical and neuroimaging characteristics together with neurosurgical and pharmacological interventions for each patient are summarized in Table 1. Fraction of inspired oxygen (FiO2) and values for hemoglobin and all of the physiologic data are summarized in Table 2. Fourteen patients were identified with severe TBI who underwent MMM with synchronized monitoring of ABP, ICP, EtCO2, rSO2, and PbtO2. A total of 11 patients (79%) were male. Ages ranged from 3 to 20 years (median 14.0 [IQR 11–17]). Moreover, patients (79%) were involved in a motor vehicle accident of which were automobile vs. pedestrian, 8 automobile vs. bicycle, 1 automobile vs. motorcycle, and 1 all-terrain vehicle (ATV) accident. Among the 3 patients who sustained falls, 1 experienced a crush injury from a ground-level fall, 1 experienced a blast injury after a ground level fall, and 1 patient suffered a closed head injury from a fall greater than 3 feet. GCS scores on admission ranged from 3 to 7 (median 4.0 [IQR 3.3–5.8]). GOSE-Peds scores at 12-months post-injury ranged from 1–8 (median 5.0 [IQR 3.0–5.8]). Among all, eleven patients had reactive pupils to light while one had unilaterally and two bilaterally fixed pupils on admission. Neuroimaging of the patients revealed diverse pathologic findings described in Table 1. All but 2 patients underwent neurosurgical interventions including decompressive craniectomy (8/12), hematoma evacuation (9/12) and external ventricular drainage catheter insertion (4/12). Furthermore 5 out of 14 patients (36%) underwent multimodality neurologic monitoring without a decompressive craniectomy or intracranial hematoma evacuation. All of the patients were intubated and mechanically ventilated. FiO2 values ranged from 30 to 95% for patients during their time of analysis. Among all, 8 patients (57%) received infusions of vasoactive agents during their analysis period, with all eight patients receiving norepinephrine infusion and two patients receiving a concurrent epinephrine or vasopressin infusion. All of the patients received sedative infusion therapies with fentanyl in 14 (100%), propofol in 8 (57%), dexmedetomidine in 4 (29%), and pentobarbital in 2 (14%). A total of 9 (64%) patients received hypertonic saline while 3 (21%) received additional mannitol infusion prior to or during their analysis period.
3.2. CO2 Reactivity of PbtO2
Correlations of physiologic variables for each individual patient and overall group are presented in Table 3. We observed that at the level of grouped analysis, there was a weak positive association between PbtO2 and EtCO2 (SRC 0.05, 95% CI [0.04, 0.06]) with 9 patients demonstrating positive associations (intact CO2 reactivity of PbtO2) and 5 patients demonstrating negative associations (impaired CO2 reactivity of PbtO2). Grouped analysis demonstrated a weak positive association between PbtO2 and ICP (SRC 0.02, 95% CI [0.02, 0.03]) with 7 patients demonstrating positive associations and seven patients demonstrating negative associations. With respect to ABP, grouped analysis revealed a positive association with PbtO2, with all of the patients demonstrating such positive associations (SRC 0.36. 95% CI [0.35,0.36]. Grouped analysis demonstrated a positive association between PbtO2 and rSO2 (SRC 0.02, 95% CI [0.01, 0.02]) with 7 patients demonstrating positive associations and 7 patients demonstrating negative associations.
Subgroup analysis of patients with intact and impaired CO2 reactivity of PbtO2 is summarized in Table 4, and differences in physiologic values between each group is summarized in Table 5. We observed a positive association between PbtO2 and ICP in patients with intact CO2 reactivity of PbtO2 (SRC 0.22, 95% CI [0.21, 0.23]), whereas we observed a negative association between ICP and PbtO2 in the impaired group (SRC −0.28, 95% CI [−0.29, −0.28]. We observed a negative association between PbtO2 and rSO2 in patients with intact CO2 reactivity of PbtO2 (SRC −0.08, 95% CI [−0.09, −0.08]), whereas we observed a positive association between PbtO2 and rSO2 in the impaired group (SRC 0.15, 95% CI [0.14, 0.16]. In comparison to patients with intact CO2 reactivity of PbtO2, those with impaired reactivity were observed to have decreased values of PbtO2, EtCO2 and ABP, as well as increased values of ICP, PRx, and rSO2. Lower GOSE-PEDs scores, reflective of improved functional outcomes, were observed in patients with intact CO2 reactivity of PbtO2 as compared to patients with impaired CO2 reactivity of PbtO2.
4. Discussion
In this exploratory study, we have investigated CO2 reactivity of PbtO2 by analyzing temporal relationships of PbtO2 and EtCO2 in pediatric severe TBI patients. Whereas most patients had an expected positive association between PbtO2 and EtCO2, we identified a subset of patients who had impaired CO2 reactivity of PbtO2. Patients within this subset had negative associations between ICP and PbtO2 in addition to higher ICP and PRx values, lower PbtO2 values and increased GOSE-Peds scores reflective of unfavorable outcome. These results support the notion that EtCO2 changes may be inversely coupled with PbtO2 in select pediatric TBI patients with a physiologic profile that manifests with increased BBB breakdown, impaired CVPR, increased risk of brain tissue hypoxia and increased risk of long-term functional impairments.
A growing body of evidence supports the argument that brain tissue hypoxia is associated with unfavorable outcomes after pediatric TBI. One cohort study of 46 children with TBI observed that PbtO2 levels of ≥30 mmHg represented the highest sensitivity and specificity for favorable outcome [17], and a separate pediatric TBI observational cohort study of 52 children suggested that PbtO2 levels < 10 mmHg are associated with unfavorable outcomes [18]. This work has helped formulate the most recent level III recommendations in pediatric TBI guidelines to maintain PbtO2 levels > 10 mmHg in children [3]. The recent BOOST II study represented a randomized clinical trial of adult patients with TBI in which patients randomized to ICP plus PbtO2 monitoring had reduced time with brain tissue hypoxia and trends toward improved outcomes, as compared to patients undergoing ICP monitoring alone [19]. This has formulated the ongoing BOOST III clinical trial, which is powered to investigate whether PbtO2-based therapy improves outcomes in adults with TBI (ClinicalTrials.gov Identifier: NCT03754114). While evidence links low PbtO2 values with poor outcomes, the proposed interventions to optimize levels include raising ABP with vasopressors, optimizing hemoglobin concentration, and increasing PaCO2 to augment CBF [6]. Such proposed interventions arise from both adult literature and other underling etiologies (i.e., aneurysmal subarachnoid hemorrhage), making them potentially less translatable to pediatric TBI where diverse pathophysiology can arise. A more comprehensive understanding is needed in pediatric TBI patients to understand situations in which PbtO2 is influenced by ABP, PaCO2, or ICP in order to optimize its value and potentially improve outcomes.
The risk of disruption in the BBB is high after pediatric TBI. An intact BBB is essential for maintaining brain volume at a very constant level [20]. When BBB is disrupted, an increase in transcapillary hydrostatic pressure, such as through an increase in ABP or decrease in transcapillary oncotic pressure might lead toward intracranial hypertension and resultant vasogenic edema. In the injured brain, ineffective CVPR can contribute toward increased hydrostatic capillary pressure further complicating intracranial hypertension [9]. In such a microenvironment where the BBB is not intact and the CVPR is inefficient, an increase in PaCO2 may contribute to an increase in cerebral edema by increasing CBF and cerebral blood volume and result in a decrease in PbtO2 and increase in ICP. The findings we observed are supportive of this notion. Patients we observed with intact CO2 reactivity of PbtO2 had positive associations of PbtO2 and ICP, reflecting that increases in ICP may relate to increases in cerebral blood volume blood volume with concordant rises in PbtO2 (Figure 1). In contrast, patients with impaired CO2 reactivity of PbtO2 had negative associations of PbtO2 and ICP, which may reflect increases in cerebral edema with concomitant intracranial hypertension may reduce PbtO2. Concordant monitoring with continuous transcranial Doppler ultrasound in Case 14 further demonstrate such phenomena with changes in CBF (Figure 2). Furthermore, increased PRx values, reflective of decreased CVPR efficiency, were observed in the subgroup with impaired CO2 reactivity, also consistent with the notion that such patients have worsened cerebral edema and BBB breakdown. From these findings, we speculate that disrupted BBB and ineffective CVPR may contribute toward an inverse relationship between EtCO2 and PbtO2.
Another explanation to the inverse correlation between PbtO2 and EtCO2 might be impaired CO2 vasoreactivity. In a previous study, Lee et al. found that ICP > 20 mm Hg, low baseline CPP, early post-injury hypotension and hypoxia were associated with impairment of CO2 reactivity [21]. They showed that during the first 2 weeks after moderate and severe TBI, CO2 reactivity remained relatively intact but cerebral autoregulation variably was impaired. As our recordings were in the very acute stages of the injury, this explanation might not be valid for our patients.
We also observed that patients with intact CO2 reactivity of PbtO2 had negative associations between PbtO2 and rSO2, whereas patients with impaired reactivity had positive associations between each measure of cerebral oximetry. Furthermore, higher values of rSO2 were observed in the impaired group as compared to the intact group. These findings may reflect that patients with intact CO2 reactivity had increased oxygen extraction with increased metabolic demand, which may reflect better in rSO2 values that are more likely to reflect venous blood [22]. rSO2 does carry substantial technical limitations in its ability to reflect true changes in brain tissue oxygenation, and thus we adopt caution in our interpretation of these findings.
This study was limited by single-center data collection, small sample size, and a retrospective design. Considering this, 5-h epochs were selected to minimize the impact that external factors (e.g., increasing scalp edema, fluctuating FiO2 levels) might have to compound PbtO2 and rSO2 values, although bias may arise from selection of those epochs. Outside of unique circumstances such as described in Figure 2, direct measures of CBF were not investigated in this study. Relationships of PbtO2 with other hemodynamic factors may change with respect to longer periods of time and specific medical interventions, and this requires additional investigation. While we speculate that differences in physiologic inter-relationships of PbtO2 and EtCO2 may be related to BBB breakdown, we did not investigate neuroimaging or serological biomarkers of BBB breakdown, and this would be helpful in future studies to investigate the physiologic impact of BBB integrity. Despite our attempts to minimize and remove all artifacts, there is a possibility that remaining artifacts might also cause this inverse correlation as well. We did observe lower GOSE-Peds scores at 12-months post-injury in patients with intact CO2 reactivity of PbtO2, as compared to impaired reactivity. This raises the possibility that patients with intact CO2 reactivity may have improved outcomes, and further work is needed in this regard. Patients with impaired CO2 reactivity of PbtO2 may benefit from alternative strategies to augment PbtO2 levels and improve their recovery trajectory. Our study is intended as an exploratory study for hypothesis generation, and it is not powered to assess the degree to which impaired CO2 reactivity of PbtO2 may impact secondary brain insult propagation and long-term functional outcomes. Larger prospective studies are needed in TBI patients who undergo concurrent PbtO2 and MMM with standardized approaches to ABP and EtCO2 manipulation to understand factors that influence PbtO2 trends, and individualized clinical management strategies that may optimize PbtO2 values and improve functional outcomes.
5. Conclusions
After pediatric TBI, CO2 reactivity of PbtO2 can be heterogenous. Further research is needed to clarify the clinical value to which trends in EtCO2 monitoring can evaluate changes in cerebral oxygenation in pediatric TBI management, and to investigate individualized management strategies that can optimize PbtO2 levels and improve functional outcomes.
Author Contributions
Conceptualization, D.H., A.O., M.T., P.D.A. and B.A.; methodology, D.H., A.O., M.T. and B.A.; formal analysis, D.H., A.O., M.T. and B.A.; investigation, D.H., A.O., M.T., B.A. and P.D.A.; resources, D.H., A.O., M.T., B.A.; D.H., A.O., M.T. and B.A.; writing—original draft preparation, D.H., A.O. and B.A.; writing—review and editing, D.H., A.O., M.T., P.D.A. and B.A.; visualization, D.H., A.O. and B.A.; funding acquisition, A.O. and B.A. All authors have read and agreed to the published version of the manuscript.
Funding
This work was funded in part by the Phoenix Children’s Hospital Graduate Medical Education Learner Fund.
Institutional Review Board Statement
The study approved by the Institutional Review of Phoenix Children’s Hospital (IRB #19-284, approval date 17 November 2021).
Informed Consent Statement
Not applicable.
Data Availability Statement
The raw data supporting the conclusions of this article can be made available by the corresponding author, without undue reservation.
Acknowledgments
We thank Geetika Chahal, MBBS for research coordination and Jorge Arango, MD for assistance in research administration.
Conflicts of Interest
Appavu reports completed research grants from Moberg ICU Solutions, the United States Department of Defense Congressionally Directed Medical Research Programs and American Heart Association, outside of the scope of the submitted work. The other co-authors have no relevant conflict of interest to disclose.
References
- Hawley, C.A.; Ward, A.B.; Long, J.; Owen, D.W.; Magnay, A.R. Prevalence of traumatic brain injury amongst children admitted to hospital in one health district: A population based study. Injury 2003, 354, 256–260. [Google Scholar] [CrossRef] [Green Version]
- Maas, A.I.R.; Menon, D.K.; Adelson, P.D.; Andelic, N.; Bell, M.J.; Belli, A.; Bragge, P.; Brazinova, A.; Büki, A.; Chesnut, R.M.; et al. Traumatic brain injury: Integrated approaches to improve prevention, clinical care, and research. Lancet Neurol. 2017, 16, 987–1048. [Google Scholar] [CrossRef] [Green Version]
- Kochanek, P.M.; Tasker, R.C.; Carney, N.; Totten, A.M.; Adelson, P.D.; Selden, N.R.; Davis-O’Reilly, C.; Hart, E.L.; Bell, M.J.; Bratton, S.L.; et al. Guidelines for the management of pediatric severe traumatic brain injury, third edition: Update of the brain trauma foundation guidelines. Pediatr. Crit. Care Med. 2019, 20 (Suppl. 1), S1–S82. [Google Scholar] [CrossRef] [PubMed] [Green Version]
- Appavu, B.; Foldes, S.T.; Adelson, P.D. Clinical trials for pediatric traumatic brain injury: Definition of insanity? J. Neurosurg. Pediatr. 2019, 23, 661–669. [Google Scholar] [CrossRef] [Green Version]
- Figaji, A.A.; Zwane, E.; Thompson, C.; Fieggen, A.G.; Argent, A.C.; Le Roux, P.D.; Peter, J.C. Brain tissue oxygen tension monitoring in pediatric severe traumatic brain injury. Part 1: Relationship with outcome. Child Nerv. Syst. 2009, 25, 1325–1333. [Google Scholar] [CrossRef] [PubMed]
- Rass, V.; Solari, D.; Ianosi, B.; Gaasch, M.; Kofler, M.; Schiefecker, A.J.; Miroz, J.-P.; Morelli, P.; Thomé, C.; Beer, R.; et al. Protocolized Brain Oxygen Optimization in Subarachnoid Hemorrhage. Neurocritical Care 2019, 31, 263–272. [Google Scholar] [CrossRef] [PubMed] [Green Version]
- Chesler, M. Regulation and modulation of pH in the brain. Physiol. Rev. 2003, 83, 1183. [Google Scholar] [CrossRef] [PubMed]
- Sahuquillo, J.; Munar, F.; Baguena, M.; Poca, M.A.; Pedraza, S.; Rodríguez-Baeza, A. Evaluation of Cerebrovascular CO2-Reactivity and Autoregulation in Patients with Post-Traumatic Diffuse Brain Swelling (Diffuse Injury III). In Intracranial Pressure and Neuromonitoring in Brain Injury; Marmarou, A., Bullock, R., Eds.; Springer: Vienna, Italy, 1998; pp. 233–236. [Google Scholar] [CrossRef]
- Grande, P.O. Critical Evaluation of the Lund Concept for Treatment of Severe Traumatic Head Injury, 25 Years after Its Introduction. Front. Neurol. 2017, 8, 315. [Google Scholar] [CrossRef] [Green Version]
- Kochanek, P.; Carney, N.; Adelson, P.D.; Ashwal, S.; Bell, M.J.; Bratton, S.; Carson, S.; Chesnut, R.; Ghajar, J.; Goldstein, B.; et al. Guidelines for the acute management of severe traumatic brain injury in infants, children and adolescents–second edition. Pediatr Crit. Care Med. 2012, 13 (Suppl. 1), S1–S82. [Google Scholar] [CrossRef]
- Adelson, P.D.; Pineda, J.; Bell, M.J.; Abend, N.S.; Berger, R.P.; Giza, C.C.; Hotz, G.; Wainwright, M.S. Common data elements for pediatric traumatic brain injury: Recommendations from the working group on demographics and clinical assessment. J. Neurotrauma 2012, 29, 639–653. [Google Scholar] [CrossRef] [Green Version]
- Beers, S.R.; Wisniewski, S.R.; Garcia-Filion, P.; Tian, Y.; Hahner, T.; Berger, R.P.; Bell, M.J.; Adelson, P.D. Validity of a pediatric version of the Glasgow Outcome Scale—Extended. J. Neurotrauma 2012, 29, 1126–1139. [Google Scholar] [CrossRef] [PubMed] [Green Version]
- Steiner, L.A.; Czosnyka, M.; Piechnik, S.K.; Smielewski, P.; Chatfield, D.; Menon, D.K.; Pickard, J.D. Continuous monitoring of cerebrovascular pressure reactivity allows determination of optimal cerebral perfusion pressure in patients with traumatic brain injury. Crit. Care Med. 2002, 30, 7338. [Google Scholar] [CrossRef] [PubMed]
- Lewis, P.M.; Czosnyka, M.; Carter, B.G.; Rosenfeld, J.V.; Paul, E.; Singhal, N.; Butt, W. Cerebrovascular pressure reactivity in children with traumatic brain injury. Pediatr. Crit. Care Med. 2015, 16, 739–749. [Google Scholar] [CrossRef] [PubMed]
- Appavu, B.; Temkit, M.; Foldes, S.; Burrows, B.T.; Kuwabara, M.; Jacobson, A.; Adelson, P.D. Association of Outcomes with Model-Based Indices of Cerebral Autoregulation After Pediatric Traumatic Brain Injury. Neurocritical Care 2021, 35, 640–650. [Google Scholar] [CrossRef]
- Asparouhov, T.; Harraker, E.L.; Muthen, B. Dynamic structural equation models: Structural equation modeling. A Multidiscip. J. 2018, 25, 359–388. [Google Scholar] [CrossRef]
- Stippler, M.; Ortiz, V.; Adelson, P.D.; Chang, Y.-F.; Tyler-Kabara, E.C.; Wisniewski, S.R.; Fink, E.L.; Kochanek, P.M.; Brown, S.D.; Bell, M.J. Brain tissue oxygen monitoring after severe traumatic brain injury in children: Relation to outcome and association with other clinical parameters. J. Neurosurg. Pediatr. 2012, 10, 383–391. [Google Scholar] [CrossRef] [PubMed]
- Figaji, A.A.; Zwane, E.; Thompson, C.; Fieggen, A.G.; Argent, A.C.; Le Roux, P.D.; Peter, J.C. Brain tissue oxygen monitoring in pediatric severe traumatic brain injury. Part 2: Relationship with clinical, physiological, and treatment factors. Childs Nerv. Syst. 2009, 25, 1335–1343. [Google Scholar] [CrossRef] [PubMed]
- Okonkwo, D.O.; Shutter, L.; Moore, C.; Temkin, N.R.; Puccio, A.M.; Madden, C.J.; Andaluz, N.; Chesnut, R.; Bullock, M.R.; Grant, G.A.; et al. Brain Oxygen Optimization in Severe Trauamtic Brain Injury Phase II: A Phase II Randomized Trial. Crit. Care Med. 2017, 45, 1907–1914. [Google Scholar] [CrossRef] [PubMed]
- Lochhead, J.J.; Yang, J.; Ronaldson, P.T.; Davis, T.P. Structure, Function, and Regulation of the Blood-Brain Barrier Tight Junction in Central Nervous System Disorders. Front Physiol. 2020, 11, 914. [Google Scholar] [CrossRef]
- Lee, J.H.; Kelly, D.F.; Oertel, M.; McArthur, D.; Glenn, T.; Vespa, P.; Boscardin, W.J.; Martin, N. Carbon dioxide reactivity, pressure autoregulation, and metabolic suppression reactivity after head injury: A transcranial Doppler study. J. Neurosurg. 2001, 95, 222–232. [Google Scholar] [CrossRef] [Green Version]
- Watzman, H.M.; Kurth, C.D.; Montenegro, L.M.; Rome, J.; Steven, J.M.; Nicolson, S.C. Arterial and venous contributions to near-infrared cerebral oximetry. Anesthesiology 2000, 93, 947–953. [Google Scholar] [CrossRef] [PubMed]
Figure 1.
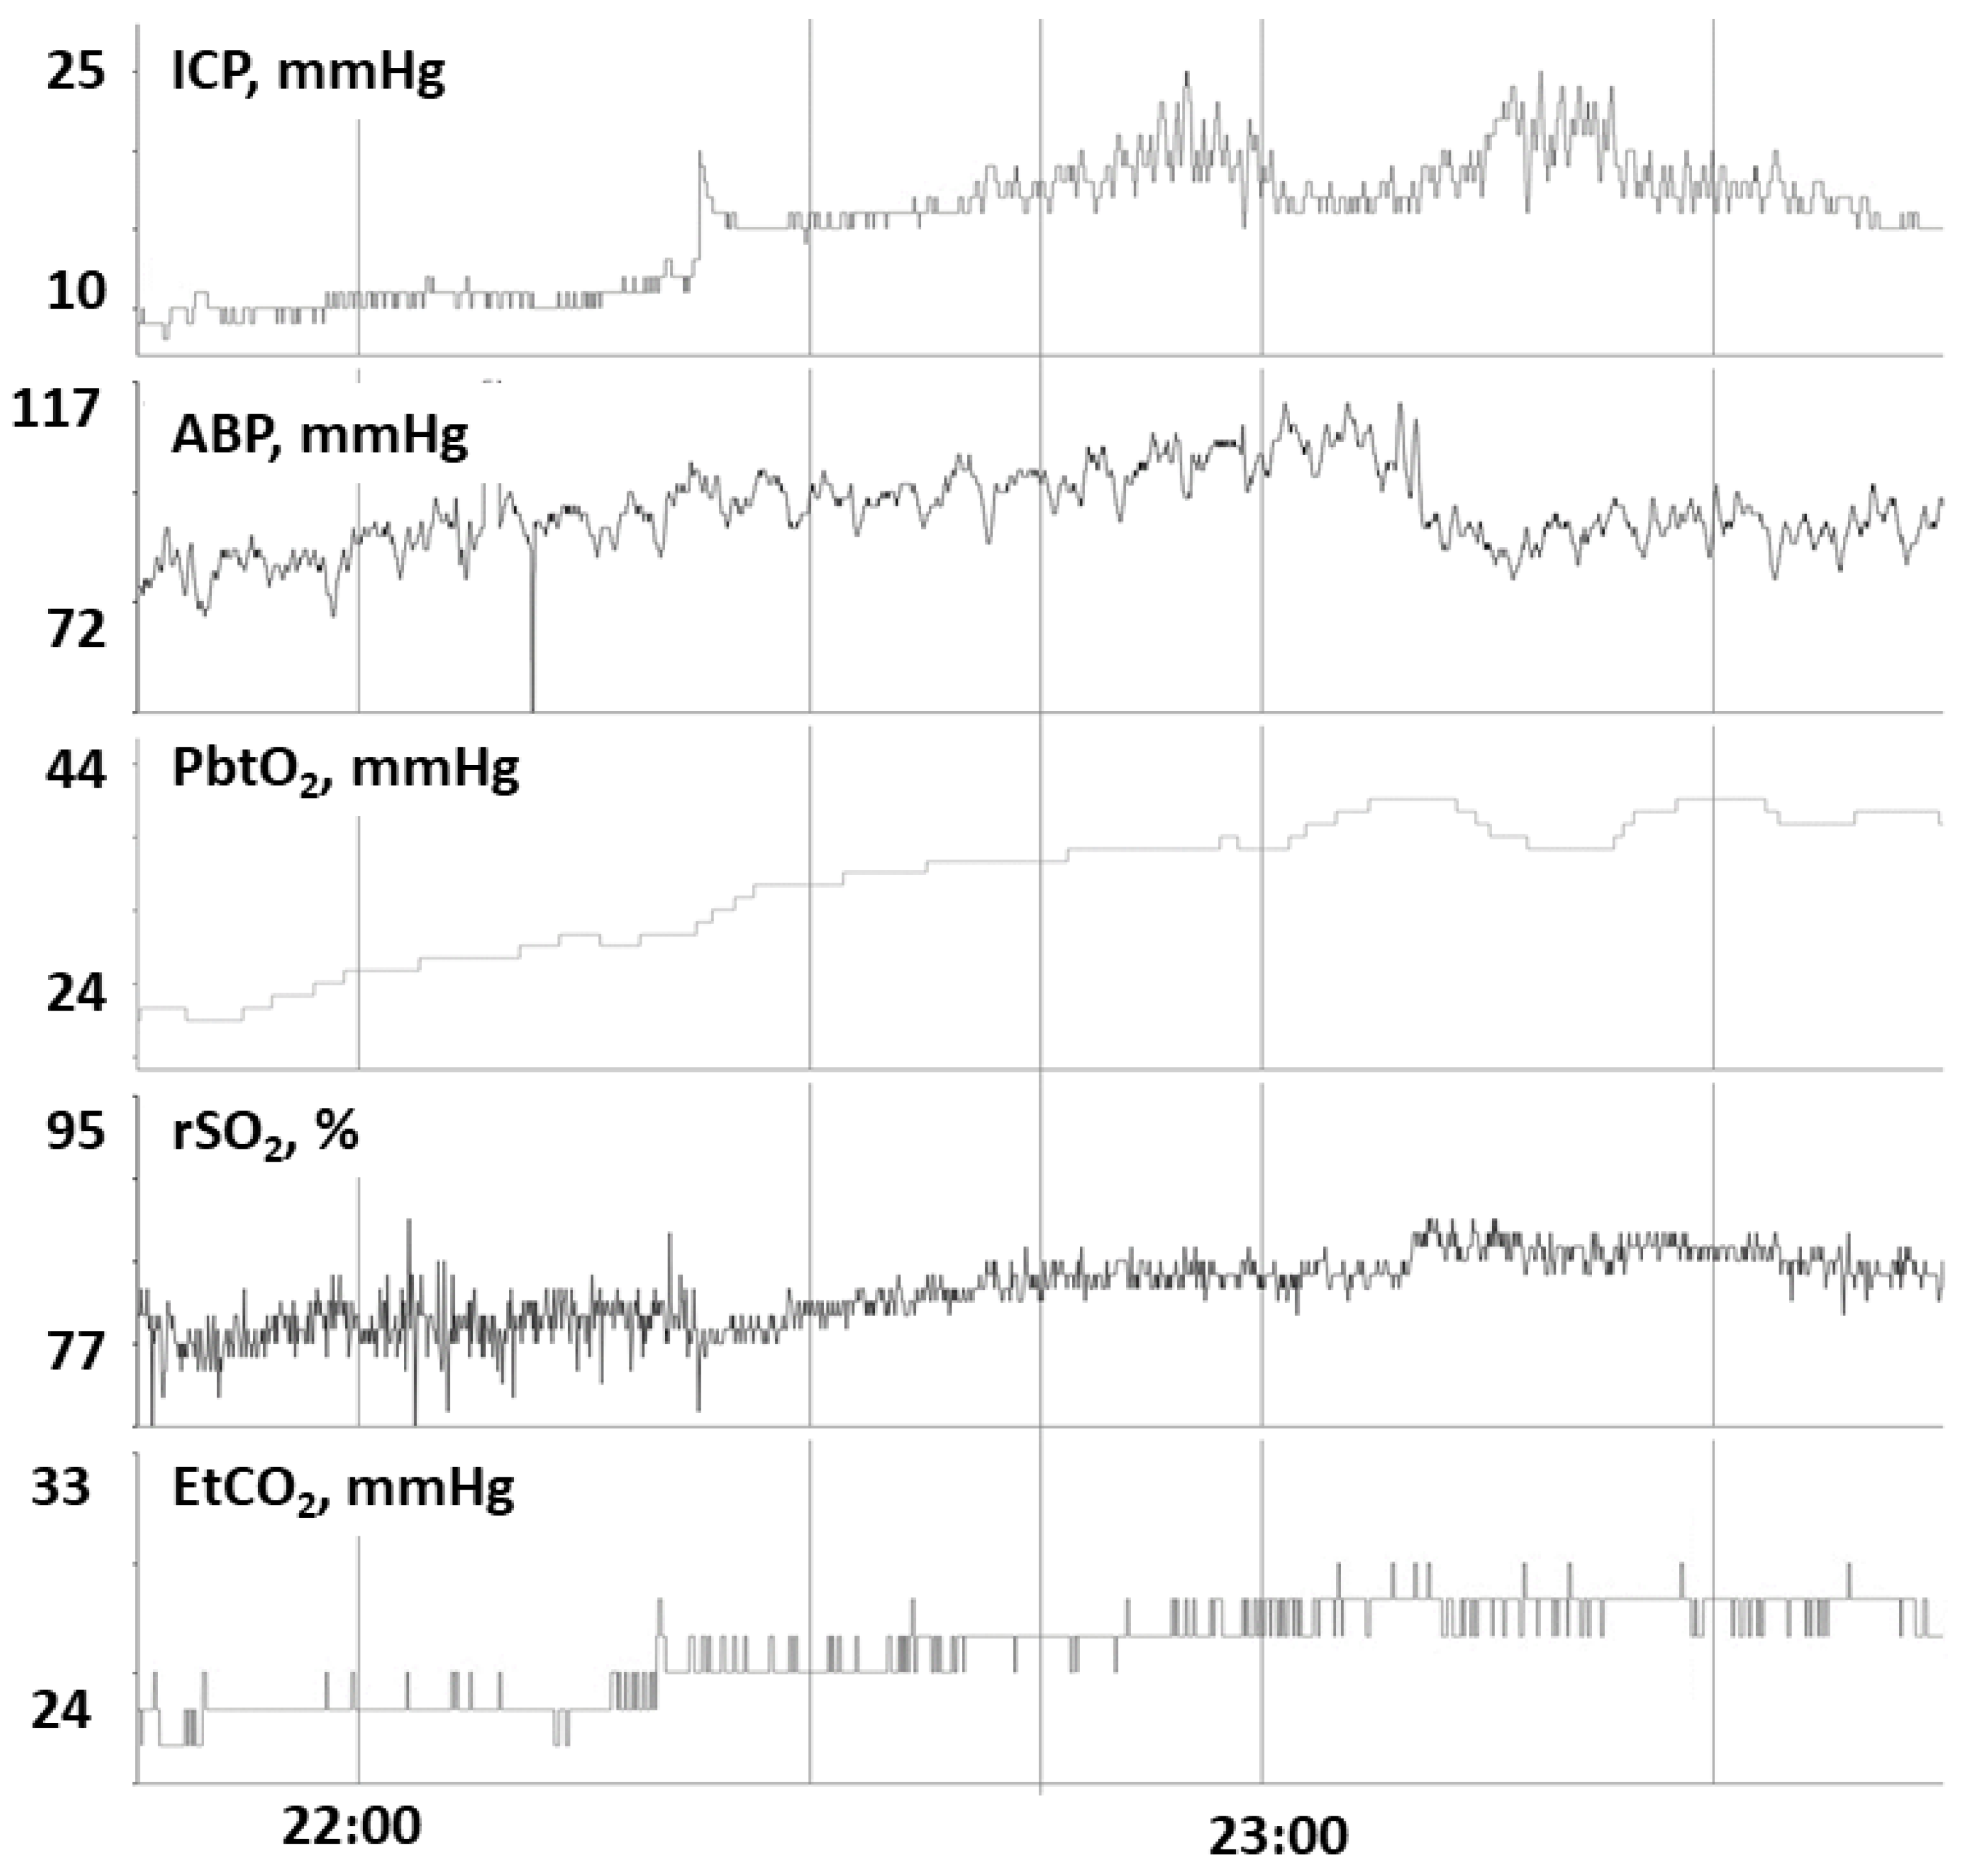
In patient 6, we observe that a rise in EtCO2 corresponds with a concordant rise in PbtO2, rSO2 and ICP, consistent with intact CO2 reactivity to PbtO2. Abbreviations: ICP, intracranial pressure; ABP, arterial blood pressure; PbtO2, partial pressure of brain tissue oxygenation; rSO2, cerebral regional somatic oximetry; EtO2, end-tidal carbon dioxide; mmHg, millimeters of mercury; %, percentage.
Figure 1.
In patient 6, we observe that a rise in EtCO2 corresponds with a concordant rise in PbtO2, rSO2 and ICP, consistent with intact CO2 reactivity to PbtO2. Abbreviations: ICP, intracranial pressure; ABP, arterial blood pressure; PbtO2, partial pressure of brain tissue oxygenation; rSO2, cerebral regional somatic oximetry; EtO2, end-tidal carbon dioxide; mmHg, millimeters of mercury; %, percentage.

Figure 2.
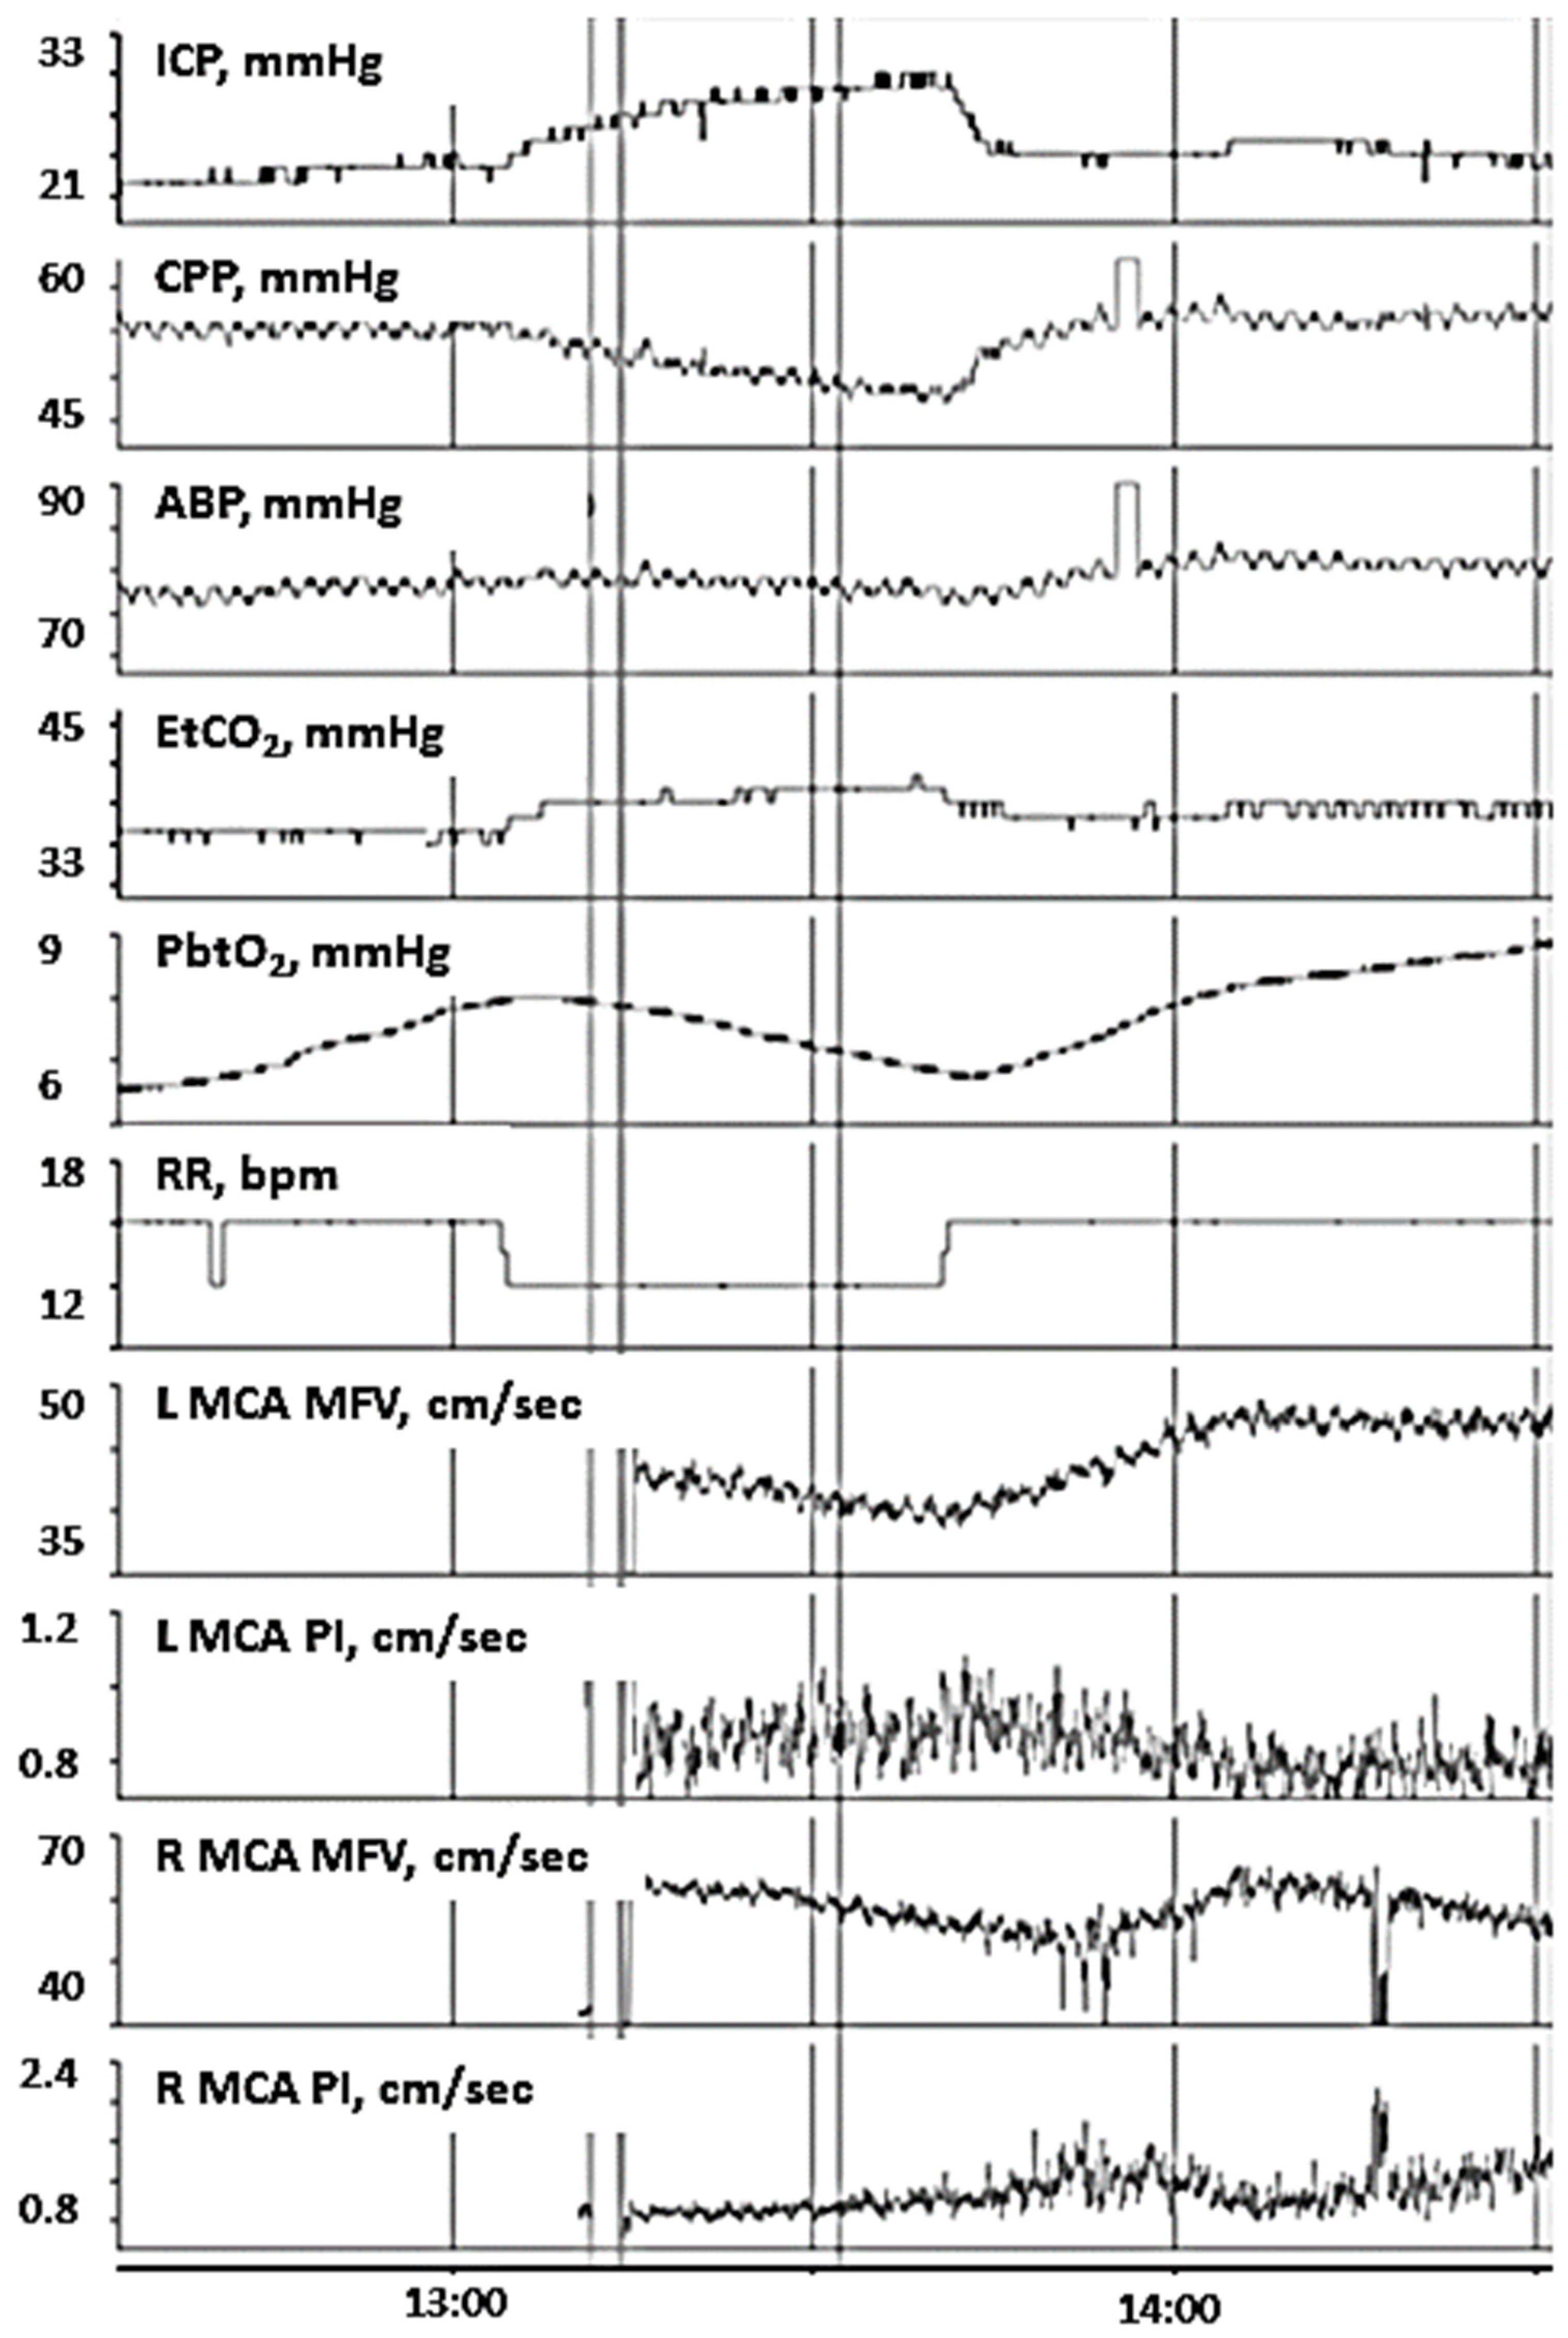
In patient 14, changes in EtO2 are positively associated with changes in ICP but is negatively associated with changes in PbtO2. This is indicative of impaired CO2 reactivity to PbtO2. Continuous transcranial Doppler ultrasound (TCD) is performed at the same time to assess changes in CBF, demonstrating changes in EtO2 are negatively associated with bilateral MCA MFV and positively associated with PIs. These findings suggest that increased EtO2 may increase cerebral edema and lead to resultant intracranial hypertension, brain tissue hypoxia, and resistive CBF in the major basal arteries. Abbreviations: ICP, intracranial pressure; CPP, cerebral perfusion pressure; ABP, arterial blood pressure; EtO2, end-tidal carbon dioxide; PbtO2, partial pressure of brain tissue oxygenation; RR, respiratory rate; bpm, breaths per minute; L, left; R, right; MCA, middle cerebral artery; MFV, mean flow velocities; PI, pulsatility index; cm, centimeters; sec, second; mmHg, millimeters of mercury.
Figure 2.
In patient 14, changes in EtO2 are positively associated with changes in ICP but is negatively associated with changes in PbtO2. This is indicative of impaired CO2 reactivity to PbtO2. Continuous transcranial Doppler ultrasound (TCD) is performed at the same time to assess changes in CBF, demonstrating changes in EtO2 are negatively associated with bilateral MCA MFV and positively associated with PIs. These findings suggest that increased EtO2 may increase cerebral edema and lead to resultant intracranial hypertension, brain tissue hypoxia, and resistive CBF in the major basal arteries. Abbreviations: ICP, intracranial pressure; CPP, cerebral perfusion pressure; ABP, arterial blood pressure; EtO2, end-tidal carbon dioxide; PbtO2, partial pressure of brain tissue oxygenation; RR, respiratory rate; bpm, breaths per minute; L, left; R, right; MCA, middle cerebral artery; MFV, mean flow velocities; PI, pulsatility index; cm, centimeters; sec, second; mmHg, millimeters of mercury.


Table 1.
Patient Demographics.
| Patient | Sex | Race | Age (Years) | TBI Cause | TBI Mechanism | TBI Type | GCS | GOSE-Peds, 12 Months Post-Injury | Radiographic Neuropathology (CT/MRI) | Neurosurgical Procedures before Monitoring | Sedation | Vasoactive Agents | Hyperosmolar Therapy | PbtO2 Location |
|---|---|---|---|---|---|---|---|---|---|---|---|---|---|---|
| 1 | F | Hispanic | 12 | MVA (Auto vs. pedestrian) | Closed | DI | 4 | 3 | Diffuse cerebral edema R convexity SDH, Mid-line shift, Cerebellar tonsillar herniation | DC and epidural hematoma evacuation | FNT (1 mcg/hg/h), PRP (50 mcg/kg/min) | None | HTS (bolus) | LF |
| 2 | M | Hispanic | 3 | Fall from trampoline | Crush | FFT | 6 | 5 | R SDH R to L mid-line shift. Skull base frx | Subdural hematoma evacuation | FNT (1 mcg/kg/h), Dex (0.4 mcg/kg/h) | None | None | LF |
| 3 | M | Asian | 16 | FL | Blast | GLF | 4 | 1 | R scalp hematoma R parietal skull frx R- frontotemporal and parietal SDH R to L mid-line shift R frontal tSAH | DC and subdural hematoma evacuation | FNT (2 mcg/kg/h), Pentobarbital (1 mg/kg/h) | NE | None | RF |
| 4 | M | Hispanic | 11 | MVA (Auto vs. pedestrian) | Closed | DI | 4 | 8 | L parietal scalp hematoma, EDH extending from CCJ to supraclinoid region, tSAH, diffuse cerebral edema, DAI, cerebellar edema and contusion, AO dislocation, T12-L1 frx | Bedside EVD | FNT (1 mcg/kg/h) | Antihypertensives | HTS (bolus) | LF |
| 5 | M | Native American | 15 | MVA (Auto vs. pedestrian) | Closed | DI | 3 | 3 | L frontotemporal and parietal skull fractures, B/L temporal contusions, B/L SDH, diffuse cerebral edema, pneumocephalus, diffuse tSAH at basal cisterns, cerebellar herniation, L to R mid-line shift | DC and epidural hematoma evacuation | FNT (1 mcg/kg/h) | NE | HTS (infusion) | RF |
| 6 | M | Caucasian | 14 | Fall from height | Closed | FFT | 3 | 2 | R temporal bone, occipital condyle and sphenoid sinus frx, cortical contusion on the L mid frontal region of lateral ventricles, SDH | No operation | FNT (2 mcg/kg/h) | NE | HTS (infusion) | RF |
| 7 | M | Caucasian | 15 | MVA (Auto vs. bicycle (w/o helmet)) | Closed | DI | 3 | 7 | L-post scalp hematoma, B/L SDH, tSAH, punctate parenchymal hemorrhages, basal cistern effaced, L- Temporal frx | EVD placement at the OR | DEX (0.6 mcg/kg/h), FNT (1 mcg/kg/h), PRP (0.25 mcg/kg/min) | None | None | LF |
| 8 | M | Caucasian | 14 | MVA (Auto vs. motorcycle (w/o helmet)) | Closed | DI | 4 | 2 | B/L EDH, SDH, effacement of basal cistern, diffuse cerebral edema | DC and epidural hematoma evacuation | DEX (1 mcg/kg/h), PRP (50 mcg/kg/min), FNT (1 mcg/kg/h) | NE | Mannitol, HTS (infusion) | RF |
| 9 | M | Hispanic | 14 | MVA (Auto vs. pedestrian) | Closed | DI | 5 | 5 | L post scalp hematoma, L frontal SDH, IVH, punctate parenchymal hemorrhages | N/A | FNT (1 mcg/kg/h), PRP (50 mcg/kg/min) | EPI, NE | None | LF |
| 10 | F | Caucasian | 17 | MVA (Auto vs. pedestrian) | Closed | DI | 3 | 5 | Scalp hematoma, posterior sutural diastases, pneumocephalus, right sigmoid sinus and superior sagittal sinus thrombus, B/L frontal lobe contusions, tSAH, SDH | DC, evacuation of R frontal contusion | FNT (1 mcg/kg/h), PRP (60 mcg/kg/min) | NE | HTS (infusion), Mannitol | LF |
| 11 | F | Native American | 7 | MVA (Auto vs. pedestrian) | Closed | DI | 6 | 4 | B/L frontal, parietal, temporal bone frx, open and depressed, skull base and MF frx, pneumocephalus, EDH, SDH, tSAH | DC and epidural hematoma evacuation | FNT (1 mcg/kg/h), Pentobarbital (2 mg/kg/h) | NE, Vasopressin | HTS (bolus and infusion) | RF |
| 12 | M | Hispanic | 17 | MVA (Auto vs. Pedestrian) | Closed | DI | 5 | 5 | Central midbrain hemorrhage, B/L IVH, R temporal lobe ICH, tSAH, SDH | EVD placement | DEX (0.2 mcg/kg/h), FNT (3 mcg/kg/h), PRP (25 mcg/kg/min) | None | None | RF |
| 13 | M | Hispanic | 20 | MVA (ATV head on head crush (w/o helmet)) | Closed | DI | 7 | 6 | R- frontotemporal scalp hematoma, depressed frx and contusion, R-FPT and occipital ICH, IVH, diffuse cerebral edema, R-to-L midline shift | DC and intraparenchymal hematoma evacuation, partial frontal lobectomy, EVD placement | FNT (3 mcg/kg/h), PRP (25 mcg/kg/min) | None | Mannitol (bolus) HTS (bolus) | RF |
| 14 | M | Caucasian | 14 | MVA (Auto vs. pedestrian) | Closed | DI | 7 | 6 | R parietal scalp hematoma, R-TFP ICH, retroclinoid extradural hematoma, tSAH | DC and hematoma evacuation | FNT (1 mcg/kg/h), PRP (30 mcg/kg/min) | NE | HTS (bolus) | RF |
Abbreviations: TBI, traumatic brain injury; GCS, Glasgow Coma Scale; GOSE-Peds, Glasgow Outcome Scale—Extended Pediatrics; CT, computed tomography; MRI, magnetic resonance imaging; Auto, automobile; FL, fall; w/o, without; DI, diffuse impact; FFT, fall from greater than 3 feet; GLF, ground level fall; R, right; SDH, subdural hematoma; L, left; tSAH, traumatic subarachnoid hemorrhage; B/L, bilateral; DC, frx, fracture; CCJ, cervicocranial junction; DAI, diffuse axonal injury; AO, atlanto-occipital; IVH, intraventricular hemorrhage; decompressive craniectomy; EVD, external ventricular drain; FNT, Fentanyl; DEX, Dexmetomidine; EPI, epinephrine; PRP, propofol; NE, norepinephrine; HTS, hypertonic saline; mcg, micrograms; kg, kilograms; min, minute; h, hour; LF, left frontal; RF, right frontal.
Table 2.
Patient PbtO2 Location, Hemoglobin Concentration, and Physiologic Values.
| Patient | PbtO2 Location | Hemoglobin Concentration (g/dL) | FiO2, sta% | Median PbtO2, mmHg | Median EtCO2, mmHg | Median ABP, mmHg | Median ICP, mmHg | Median rSO2, % | Median PRx |
|---|---|---|---|---|---|---|---|---|---|
| 1 | LF | 10.9 | 70–90 | 10.0 [9.0, 13.0] | 38.0 [33.0, 41.0] | 79.0 [77.0, 81.6] | 14.0 [11.0, 14.0] | 95.0 [93.0, 95.0] | −0.06 [−0.34, 0.12] |
| 2 | LF | 10.6 | 40–50 | 69.0 [65.0, 73.0] | 32.0 [31.0, 32.0] | 93.0 [91.0, 97.0] | 20.0 [17.0, 21.0] | 76.1 [74.2, 77.0] | 0.18 [−0.51, 0.28] |
| 3 | RF | 11.1 | 55–60 | 21.0 [19.0, 24.0] | 33.0 [32.0, 35.0] | 87.0 [83.0, 90.0] | 11.0 [10.0, 15.0] | 77.0 [76.0, 84.4] | −0.40 [−0.73, −0.22] |
| 4 | LF | 13.5 | 50 | 54.0 [47.0, 58.0] | 30.0 [29.0, 32.0] | 92.0 [90.0, 94.0] | 7.0 [7.0, 8.0] | 79.0 [78.0, 80.0] | 0.19 [−0.03, 0.47] |
| 5 | RF | 7.5 | 5–50 | 52.0 [50.0, 64.0] | 38.0 [37.0, 40.0] | 76.8 [73.1, 79.0] | 6.0 [5.0, 7.0] | 75.0 [71.5, 76.7] | 0.29 [0.06, 0.51] |
| 6 | RF | 10.2 | 35–80 | 39.0 [37.0, 44.0] | 32.0 [31.0, 36.0] | 109.0 [100.0, 111.0] | 11.0 [10.0, 12.0] | 71.4 [70.1, 73.0] | 0.25 [0.02, 0.48] |
| 7 | LF | 11.4 | 45–60 | 27.0 [25.0, 28.0] | 33.0 [32.0, 34.0] | 91.0 [84.0, 98.0] | 6.0 [5.0, 8.0] | 69.0 [64.8, 71.0] | −0.11 [−0.30, 0.07] |
| 8 | RF | 11.6 | 50–65 | 7.0 [5.0, 10.0] | 37.0 [35.0, 39.0] | 78.0 [75.0, 82.0] | 15.0 [14.0, 16.0] | 91.0 [89.0, 92.0] | 0.07 [−0.21, 0.35] |
| 9 | LF | 6.2 | 40–60 | 21.1 [14.5, 27.1] | 28.0 [27.0, 29.0] | 76.0 [73.0, 78.0] | 7.0 [7.0, 10.0] | 82.0 [81.0, 84.0] | 0.67 [0.54, 0.82] |
| 10 | LF | 9.0 | 30–95 | 14.2 [12.6, 18.6] | 32.0 [31.0, 33.0] | 81.0 [76.0, 83.5] | 12.0 [10.0, 13.0] | 95.0 [94.0, 95.0] | −0.06 [−0.30, 0.18] |
| 11 | RF | 9.8 | 60–85 | 26.0 [25.0, 28.0] | 33.0 [32.0, 34.0] | 100.0 [960, 103.0] | 11.0 [7.0, 14.0] | 33.0 [70.0, 75.4] | 0.07 [−0.29, 0.40] |
| 12 | LF | 11 | 40–50 | 76.6 [74.9, 78.9] | 36.0 [34.0, 39.0] | 75.0 [68.0, 80.0] | 16.0 [9.0, 19.0] | 71.8 [70.0, 73.1] | −0.02 [−0.22, 0.20] |
| 13 | RF | 15.9 | 30–100 | 36.0 [32.0, 38.0] | 33.0 [33.0, 34.0] | 93.0 [91.0, 99.0] | 14.0 [12.1, 15.0] | 74.8 [73.0, 75.9] | 0.15 [−0.01, 0.29] |
| 14 | RF | 16.2 | 40–50 | 8.5 [6.9, 9.1] | 37.0 [33.0, 38.0] | 81.0 [78.0, 87.7] | 23.0 [22.0, 24.0] | 95.0 [95.0, 95.0] | 0.13 [−0.05, 0.31] |
Median data is presented with both the median value as well as the interquartile range in brackets. Abbreviations: PbtO2, brain tissue oxygenation; g, gram; dL, deciliter; FiO2, fraction of inspired oxygen; mmHg, millimeters of mercury; LF, left frontal; RF, right frontal, %, percentage; IQR, interquartile range.
Table 3.
Physiologic Relationships of PbtO2 to ICP, ABP and rSO2.
| Patient | PbtO2 to EtCO2 [SRC (95% CI)] | PbtO2 to ICP [SRC (95% CI)] | PbtO2 to ABP [SRC (95% CI)] | PbtO2 to rSO2 [SRC (95% CI)] |
|---|---|---|---|---|
| 1 | 0.06 (0.05, 0.08) | 0.30 (0.28, 0.31) | 0.06 (0.05, 0.08) | 0.24 (0.22, 0.25) |
| 2 | −0.06 (−0.07, −0.05) | 0.04 (0.03, 0.06) | 0.14 (0.13, 0.15) | 0.24 (0.22, 0.25) |
| 3 | 0.20 (0.19, 0.22) | −0.04 (−0.05, −0.02) | 0.23 (0.21, 0.24) | −0.35 (−0.36, −0.33) |
| 4 | 0.26 (0.24, 0.27) | 0.14 (0.12, 0.15) | 0.48 (0.47, 0.49) | −0.24 (−0.25, −0.22) |
| 5 | 0.18 (0.17, 0.20) | 0.49 (0.48, 0.50) | 0.21, (0.20, 0.22) | 0.37 (0.36, 0.38) |
| 6 | 0.83 (0.82, 0.83) | 0.57 (0.56, 0.59) | 0.53 (0.52, 0.55) | 0.39 (0.37, 0.41) |
| 7 | 0.64 (0.63, 0.64) | −0.54 (−0.55, −0.53) | 0.38 (0.37, 0.39) | −0.44 (−0.45, −0.42) |
| 8 | 0.14 (0.12, 0.15) | 0.14 (0.13, 0.16) | 0.63 (0.62, 0.63) | −0.33 (−0.34, −0.32) |
| 9 | −0.44 (−0.45, −0.42) | −0.25 (−0.26, −0.24) | 0.66 (0.65, 0.67) | 0.20 (0.19, 0.21) |
| 10 | −0.45 (−0.46, −0.43) | −0.40 (−0.41, −0.39) | 0.46 (0.45, 0.47) | 0.26 (0.25, 0.28) |
| 11 | −0.65 (−0.66, −0.65) | −0.58 (−0.59, −0.57) | 0.03 (0.02, 0.05) | −0.48 (−0.49, −0.47) |
| 12 | 0.09 (0.08, 0.11) | −0.03 (−0.04, −0.01) | 0.42 (0.41, 0.43) | 0.08 (0.06, 0.09) |
| 13 | 0.59 (0.58, 0.60) | 0.16 (0.15, 0.18) | 0.67 (0.67, 0.68) | −0.21 (−0.23, −0.20) |
| 14 | −0.45 (−0.47, −0.44) | −0.23 (−0.24, 0.22) | 0.48 (0.46, 0.49) | −0.12 (−0.14, −0.11) |
| Grouped Analysis | 0.05 (0.04, 0.06) | 0.02 (0.02, 0.03) | 0.36 (0.35, 0.36) | 0.02 (0.01, 0.02) |
Abbreviations: PbtO2, partial pressure of brain tissue oxygenation; EtCO2, end-tidal carbon dioxide; ICP, intracranial pressure; ABP, arterial blood pressure; rSO2, cerebral regional somatic oximetry; SRC, standardized regression coefficient; CI, credible interval.
Table 4.
Subgroup Analysis of Patients with Intact and Impaired CO2 Reactivity of PbtO2.
| CO2 Reactivity of PbtO2 | PbtO2 to EtCO2 [SRC (95% CI)] | PbtO2 to rSO2 [SRC (95% CI)] | PbtO2 to ICP [SRC (95% CI)] | PbtO2 to ABP [SRC (95% CI)] |
|---|---|---|---|---|
| Intact | 0.44 (0.44, 0.45) | −0.08 (−0.09, −0.08) | 0.22 (0.21, 0.23) | 0.38 (0.38, 0.39) |
| Impaired | −0.38 (−0.39, −0.37) | 0.15 (0.14, 0.16) | −0.28 (−0.29, −0.28) | 0.31 (0.31, 0.32) |
Abbreviations: CO2, carbon doixide; PbtO2, partial pressure of brain tissue oxygenation; EtCO2, end-tidal carbon dioxide; ICP, intracranial pressure; ABP, arterial blood pressure; rSO2, cerebral regional somatic oximetry; SRC, standardized regression coefficient; CI, credible interval.
Table 5.
Physiologic and Outcome Differences Between Patients with Intact and Impaired CO2 Reactivity of PbtO2.
Table 5.
Physiologic and Outcome Differences Between Patients with Intact and Impaired CO2 Reactivity of PbtO2.
| CO2 Reactivity to PbtO2 | Intact CO2 Reactivity of PbtO2, Median [IQR] | Impaired CO2 Reactivity of PbtO2, Median [IQR] | p-Value |
|---|---|---|---|
| PbtO2 | 36.0 [21.0, 52.0] | 21.1 [14.2, 26.0] | 0.0000 |
| ICP | 11.0 [7.0, 14.0] | 12.0 [11.0, 20.0] | 0.0000 |
| PRx | 0.07 [−0.06, 0.19] | 0.13 [0.07, 0.18] | 0.0134 |
| ABP | 87.0 [78.0, 92.0] | 81.0 [81.0, 93.0] | 0.0000 |
| EtCO2 | 33.0 [33.0, 37.0] | 32.0 [32.0, 33.0] | 0.0000 |
| rSO2 | 75.0 [71.8, 79.0] | 82.0 [76.1, 95.0] | 0.0000 |
| GOSE-Peds, 12 months post-injury | 3.0 [2.0, 6.0] | 5.0 [5.0, 5.0] | 0.0000 |
Median data is presented with both the median value as well as the interquartile range in brackets. Abbreviations: CO2, carbon dioxide; PbtO2, partial pressure of brain tissue oxygenation; EtCO2, end-tidal carbon dioxide; ICP, intracranial pressure; ABP, arterial blood pressure; rSO2, cerebral regional somatic oximetry; PRx, pressure reactivity index; IQR, interquartile range.
Publisher’s Note: MDPI stays neutral with regard to jurisdictional claims in published maps and institutional affiliations. |
© 2022 by the authors. Licensee MDPI, Basel, Switzerland. This article is an open access article distributed under the terms and conditions of the Creative Commons Attribution (CC BY) license (https://creativecommons.org/licenses/by/4.0/).
Share and Cite
MDPI and ACS Style
Hanalioglu, D.; Oh, A.; Temkit, M.; Adelson, P.D.; Appavu, B. Carbon Dioxide Reactivity of Brain Tissue Oxygenation after Pediatric Traumatic Brain Injury. Children 2022, 9, 409. https://0-doi-org.brum.beds.ac.uk/10.3390/children9030409
AMA Style
Hanalioglu D, Oh A, Temkit M, Adelson PD, Appavu B. Carbon Dioxide Reactivity of Brain Tissue Oxygenation after Pediatric Traumatic Brain Injury. Children. 2022; 9(3):409. https://0-doi-org.brum.beds.ac.uk/10.3390/children9030409
Chicago/Turabian StyleHanalioglu, Damla, Ann Oh, M’Hamed Temkit, P. David Adelson, and Brian Appavu. 2022. "Carbon Dioxide Reactivity of Brain Tissue Oxygenation after Pediatric Traumatic Brain Injury" Children 9, no. 3: 409. https://0-doi-org.brum.beds.ac.uk/10.3390/children9030409
Note that from the first issue of 2016, this journal uses article numbers instead of page numbers. See further details here.