
Trends in BMI Percentile and Body Fat Percentage in Children 12 to 17 Years of Age


1
Department of Exercise Sciences, Brigham Young University, Provo, UT 84602, USA
2
Department of Statistics, Brigham Young University, Provo, UT 84602, USA
*
Author to whom correspondence should be addressed.
Children 2022, 9(5), 744; https://0-doi-org.brum.beds.ac.uk/10.3390/children9050744
Submission received: 21 March 2022
/
Revised: 28 April 2022
/
Accepted: 16 May 2022
/
Published: 19 May 2022
(This article belongs to the Special Issue Childhood and Adolescent Obesity and Weight Management: 2nd Edition)
Abstract
:This study evaluates the cross-sectional trends in body fat percentage (BF%) and body mass index (BMI) percentile rank, and the relationship between the two in 332 (177 boys, 155 girls) 12- to 17-year-old children. Body mass index (BMI) was calculated using measured height and body mass, and sex-specific BMI for age percentile rank was determined using CDC growth charts. Body fat percentage (BF%) was measured with DEXA. Fat mass index (FMI) and fat-free mass index (FFMI) were calculated by normalizing the fat mass and fat-free mass for height. Compared to boys of the same age, girls had significantly higher BF% and FMI values and lower FFMI values. Compared to boys, at a given BMI percentile rank, females had a higher BF% and FMI, and a lower FFMI. In both boys and girls, there was an exponential increase in adiposity above the 70th percentile rank. BMI percentile rank is not an equivalent indicator of body fatness in boys and girls. Other measures of body composition can further inform the practitioner of a child’s adiposity.
1. Introduction
Childhood obesity is a major public health concern because of its many adverse health outcomes [1,2,3] and because childhood obesity (and its comorbidities) can continue into adulthood [4,5]. Childhood obesity is a result of the complex interaction of environmental, genetic, behavioral, and socioeconomic factors [2,5]. Although the prevalence of childhood obesity varies between countries, the global prevalence of childhood obesity rose from 4% in 1975 to 18% in 2016 [6]. The prevalence of childhood overweight and obesity in the U.S. is well-reported [7,8,9,10,11,12,13]. For example, the prevalence of overweight tripled between 1980 and 2000 [3]; between 1999 and 2018, obesity increased from 13.9% to 19.3%, and severe obesity rose from 3.6% to 6.1% [7,8,14]. A recent study estimated that more than half of U.S. children between 2 and 19 years of age in 2016 will be obese by the age of 35 [5]. The probability that an obese child will still be obese at age 35 increases with age, from 74.9% for an obese 2-year-old child to 88.2% for an obese 19-year-old adolescent. The probability that a nonobese child will be obese at age 35 decreases with age, from 57.8% for a nonobese 2-year-old to 44.4% for a nonobese 19-year-old adolescent [5].
The body mass index (BMI), calculated from simple measurements of height and weight, is used to classify an adult’s or child’s weight status as underweight, healthy weight, overweight, or obese [15,16]. Nevertheless, there are limitations in the use of BMI to assess adiposity, namely, it is not a direct measure of body fat, does not distinguish between fat mass (FM) and fat-free mass (FFM), and changes in BMI do not always parallel changes in FM or FFM [17,18]. The Centers for Disease Control and Prevention (CDC) describe BMI as a “screening tool” [16] because of the strong correlation between BMI and adverse health outcomes related to obesity. In adults, overweight and obesity are defined by threshold BMI values regardless of age or gender [16]. The use of BMI in children is complicated by age, sex, race, differences in height velocity, timing of puberty, sexual maturation, and development of FM, FFM, and body fat percentage (BF%) [19,20]. The use of absolute BMI (kg/m2) to evaluate adiposity assumes that children with a similar BMI would have a similar body fat percentage (BF%), but previous research indicated that BMI is not an equivalent measure of BF% among children of different age, sex, race, or stage of sexual maturation [19,21,22,23]. Data from previous studies also suggest that there are age, sex, and race differences in the development of FM and FFM [21,24,25,26,27]. To better understand the changes that normally occur in growing children, BMI was partitioned into the FM index (FMI) and the FFM index (FFMI) [20,27,28], but this requires a measurement of body composition. The increase in BMI with age in boys is primarily attributed to an increase in FFMI, whereas in girls, it is primarily attributed to an increase in the FMI [18,22,28]. Because of differences in the normal changes during growth between children, the BMI can easily be misinterpreted and misleading [29,30]. The BMI of children should be interpreted in the context of age and sex [31]. In the U.S., children are considered to be overweight or obese if their body mass index (BMI) exceeds the 85th or 95th percentile, respectively, of the sex-specific BMI for age growth charts published by the CDC [15].
Because adiposity is related to adverse health outcomes, BMI is perhaps the most common surrogate measure of overweight and obesity in clinical, public-health, and community-based programs [32]. Body composition is also one of the components of health-related physical fitness that is frequently assessed in public schools as part of health and physical education programs. Schools play an important role in addressing obesity because almost all children attend school, and school curricula and programs have promoted physical activity and healthy eating [33]. School-based assessments of height, weight, and adiposity serve important surveillance and screening purposes [33]. On an individual level, these assessments can be used to inform and educate children and their parents, and monitor changes that occur over time.
Given the relationship among childhood obesity, health, and later disease risk, it is important to evaluate sex-specific BMI for age percentiles as a proxy measure of adiposity. We undertook this study to evaluate age-related trends in and relationships among BF%, BMI percentile, FMI, and FFMI in children.
2. Materials and Methods
2.1. Participants
Data reported in this paper were collected as part of a larger study designed to compare multiple methods of assessing BF% in children and adolescents [34]. Data analysis here has not been previously performed or reported. In total, 332 Caucasian U.S. children (177 boys, 155 girls) 12 to 17 years of age participated in this study. Children who self-reported or their parents reported that their child was anemic, anorexic, bulimic, currently being treated for an illness, taking any medications, or had any signs of edema were excluded from the study. Prior to the collection of any data, this study was reviewed and approved by an institutional review board (IRB) for the use of human subjects. Participating children completed an assent form, and parents of the participating children provided written permission for their child to participate in the study.
2.2. Procedures
As participation in this study involved the assessment of body composition, participants were instructed to refrain from eating or exercising for at least four hours prior to their participation in this study. The height (cm) of each participant was measured to the nearest 0.5 cm using a calibrated wall scale. The body mass (kg) of each participant was measured using a digital scale (Ohaus Model CD-33, Ohaus Corporation, Pine Brook, NJ, USA) to the nearest one-tenth of a kilogram. Body mass index (BMI; kg/m2) was calculated using measured height and body mass values. Body composition of each participant was assessed using dual-energy X-ray absorptiometry (DEXA). All DEXA scans were performed using a Hologic QDR4500 Elite Acclaim Series scanner (Hologic Inc., Bedford, MA, USA) and software version 11.2 with supplemental pediatric software. A single-scan mode was used for all participants. Manufacturer-recommended operating procedures for whole-body scans followed. A state-certified DEXA technician performed and analyzed all scans to determine the body fat percentage (BF%) of each participant.
2.3. Data Analysis
The variables of interest in this study were height, body mass, BMI, BMI percentile rank, weight category based on BMI percentile, BF%, FMI, and FFMI. Each participant’s BMI percentile rank was determined using an online calculator [35] on the basis of sex-specific BMI for CDC age growth charts [13,36]. Each participant was then classified as underweight (<5th percentile), normal weight (5th to <85th percentile), overweight (85th to <95th percentile), or obese (≥95th percentile) [15]. The FM and FFM calculated using the DEXA BF% were used to calculate the FMI and FFMI by normalizing FM and FFM for height [20,37,38].
The Statistical Package for Social Sciences statistical software (Version 27) was used to evaluate differences between boys and girls, and between BMI categories in each variable of interest. An a priori alpha level was set at 0.05. Sex difference in height (m), body mass (kg), BMI, BF%, FMI and FFMI were determined using one-way analyses of variance and post hoc analysis with Bonferroni correction for multiple tests.
Trends in BF%, BMI percentile, FMI, and FFMI across the age span of the 12- to 17- year-old children were of particular interest in this study. These trends must be interpreted in the context of cross-sectional data as opposed to longitudinal data of the same children over time. The models and production of the plots showing the trends in BMI percentile rank and BF% across the ages of boys and girls, and the relationship between BMI percentile rank and BF%, FMI, and FFMI were developed in R statistical software [39]. Best-fit lines were generated using linear basis functions with 8 knots using the nlme [40] package in R. This package can be utilized to perform linear basis function fits and produce confidence intervals for the lines as described in Ngo and Wand [41]. Places where the lines have nonoverlapping 95% confidence intervals are a conservative method to demonstrate statistical difference at the alpha = 0.05 level [42]. The truncated line basis is a well-established method for smoothing data that exhibit highly nonlinear patterns. The smoothed curves and confidence intervals that we generated appropriately show the complicated relationships in the data and allow the reader to easily see differences between boys and girls.
3. Results
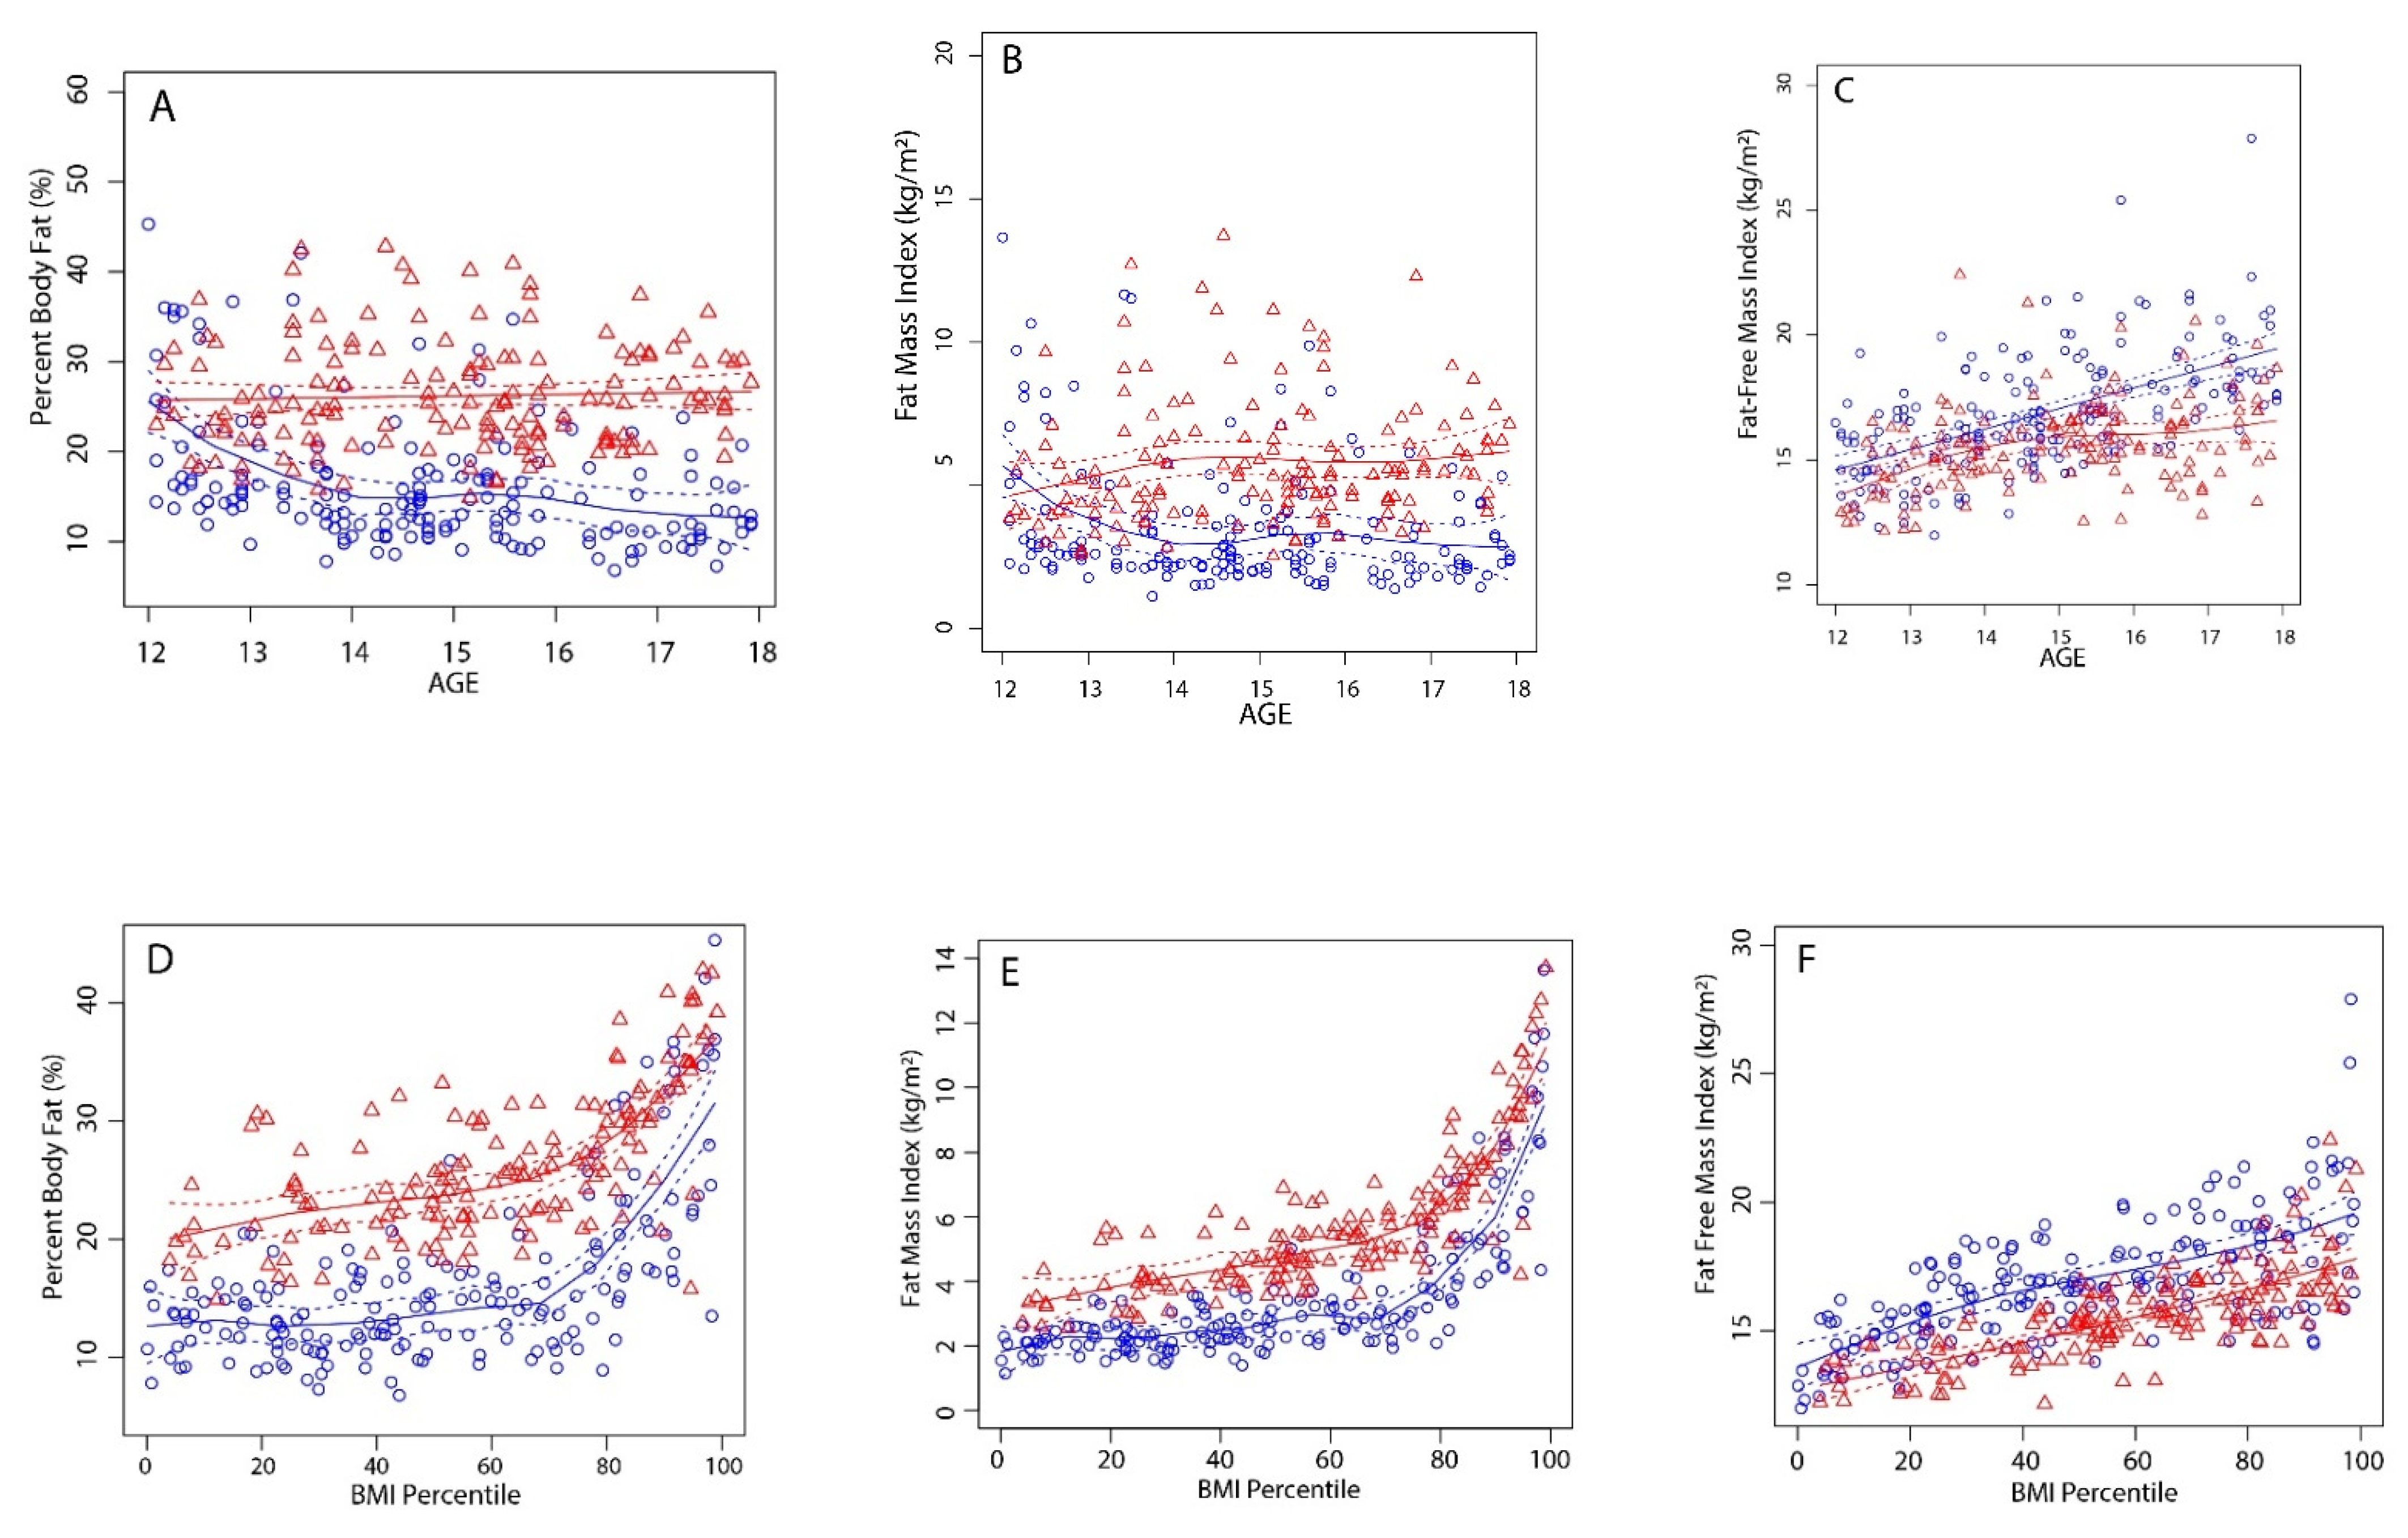
Descriptive participant information regarding sex and age is shown in Table 1. Overall, boys tended to be taller and heavier than girls of the same age. With the exception of 14-year-old children, boys and girls of the same age had similar BMI values (Table 1). Despite having similar BMI values, girls had significantly higher BF% (Table 1 and Figure 1A) and FMI (Table 1 and Figure 1B) values and lower FFMI (Table 1 and Figure 1C) values compared to those of boys of the same age. Compared to boys, at a given BMI percentile rank, females had a higher BF% (Figure 1D) and FMI (Figure 1E) and a lower FFMI (Figure 1F).
Descriptive participant information by weight category is shown in Table 2. Of the 332 participants in this study, 12 (10 boys, 2 girls) were classified as underweight, 260 (135 boys, 125 girls) were classified as normal-weight, 41 (21 boys, 20 girls) were classified as overweight, and 19 (11 boys, 8 girls) were classified as obese. None of the participants were classified as having severe obesity (20% higher than the cutoff for the 95th percentile) [14]. There were few differences in BMI, BF%, FMI and FFMI between underweight and normal-weight boys and girls. The overall trend was a significant increase in BMI, BF%, FMI and FFMI from normal-weight to overweight to obese-weight categories in both boys and girls (Table 2).
4. Discussion
In light of the increasing prevalence of childhood overweight and obesity, it is prudent to gain a better understanding of BMI percentile rank as a proxy measure of adiposity in children. The results of this study indicate (a) sex differences in the trends in BF%, FMI, and FFMI between boys and girls 12 to 17 years of age, and that (b) at any given BMI percentile, females had higher BF% and FMI values, and lower FFMI values than those of boys.
4.1. Trends in Adiposity by Age
In this study, there was a small increase in BMI at 12 to 17 years of age in both boys and girls (Table 1). The increase in BMI in boys was primarily a result of an increase in FFMI and a decrease in FMI between 12 and 14 years of age, and the stabilization of FMI after age 14 (Table 1 and Figure 1B,C). In girls, on the other hand, the gradual increase in BMI was due to small increases in both the FMI and FFMI between 12 and 14 years of age, after which there was only a small increase in FFMI (Table 1 and Figure 1B,C). Our data concur with the results of previous studies that reported a linear increase in FMI across the age span in girls, but increased in boys only to about age 12–14 and then decreased [22,28]. In this study, with the exception of 12-year-olds, girls of all ages had higher FMI values than those of boys (Table 1 and Figure 1B). In girls and boys, FFMI increased to about age 14, after which FFMI continued to increase in boys in a linear fashion but tended to plateau in girls (Figure 1C). Hattori et al. also reported that in 11 to 14 year old boys, there was an increase in FFMI with no concomitant increase in FMI, whereas in girls there was a simultaneous increase in both FFMI and FMI [18].
From 12 to 18 years of age, the BF% of boys in this study declined from about 21 BF% to about 13 BF% while the BF% in girls remained steady between 24 to 27 BF% (Table 1 and Figure 1A). Our data concur with previous reports [21,43] that, even though BMI values were similar in boys and girls, there were clear sex differences (Table 1 and Figure 1A) in BF% across the age span. Our data also concur with the recent study by Stierman [28] in which there was a decline in BF% in boys at about age 11, whereas BF% in girls increased at ages 8–19. Age-related trends in adiposity reported in this and recent studies align with the preadolescent trends described 45 years ago [44], namely, an increase in fatness after about age 8 that continues to increase throughout the adolescent and adult years in girls, whereas boys experience a late adolescent decline in body fatness.
Results from previous studies indicate that age-related changes in adiposity during childhood may be associated with stage of maturation. Daniels et al. [19] reported that the stage of maturation was a more important determinant of body fat percentage than age was. Likewise, Mihalopoulos et al. [45] reported that, although there were no differences in BMI between boys and girls, at pubertal stages 2 through 5, girls had significantly higher BF% values. There are sex differences in the timing and magnitude of the regional distribution of fat [46]. Girls accumulate a higher portion of their total adult FM during puberty than their total adult FFM [47]. The increase in FM in adolescent girls is likely related to the normal transition through developmental stages. These changes include changes in regional fat distribution (truncal vs. peripheral), breast development, age of menarche, resting energy expenditure, neuroendocrine factors, and gonadal steroid hormones [26,48].
4.2. Relationship between BMI Percentile Rank, and Adiposity
Although BMI is often used to evaluate and classify overweight and obesity in adults, due to the normal changes in height and weight during growth, BMI itself is not typically used to assess adiposity in children. Data from this study clearly indicate that although boys and girls had similar BMI values, girls had significantly higher BF% values (Table 1). Our data concur with previous studies that also reported that, at an equivalent BMI, girls have greater amounts of body fat than boys do [19,23,49,50].
In this study, boys and girls who were classified as underweight or normal-weight had similar BF% values (Table 2). Overweight and obese boys and girls had significantly higher BF% than that of underweight or normal-weight boys and girls (Table 2). Obese boys had higher BF% values than those of overweight boys, whereas obese and overweight girls had similar BF% values (Table 2). Weight classifications based on BMI percentile rank appropriately distinguish BF% between normal-weight and overweight or obese children. At any given sex-specific BMI for age percentile rank, girls had a higher BF% (Figure 1D) and FMI (Figure 1E), and a lower FFMI (Figure 1F) than boys did. Thus, BMI percentile rank is not an equivalent indicator of adiposity in boys and girls. In both boys and girls, an increase in BMI percentile rank was associated with a linear increase in FFMI (Figure 1F) and a nonlinear increase in body fatness. Because FMI is calculated from the BF%, the trend in FMI (Figure 1E) is similar to the trend in BF% (Figure 1D). In both boys and girls, an increase in BMI percentile rank is not accompanied by an appreciable increase in BF% or FMI until about the 70th percentile, after which there is an exponential increase in BF% and FMI (Figure 1D,E). This suggests that the ability of BMI percentile rank to track adiposity in children improves with body size [49], and that substantial increases in body fatness would only be expected at high percentile ranks (>70th percentile). Our findings concur with previously reported data. Demereth et al. [21] reported that depending on age, BF% values > 20% were associated with BMI percentile ranks greater than the 70th percentile. Our and previously reported data support the use of high sex-specific BMI percentile rank cut-point criteria to classify overweight (e.g., 85th percentile) and obesity (e.g., 95th percentile) in children. The health consequences of obesity in children were also linked to cut points of roughly 20% and 30% body fat in body and girls, respectively [50,51]. Two previous studies [37,45] reported that a BMI for age at or above the 95th percentile is associated with excess adiposity in children. This is in agreement with our data indicating that a 95th BMI percentile rank is associated with a BF% of approximately 30% body fat in boys and 35% body fat in girls (Figure 1D).
Meta-analysis of previously reported data indicates that BMI had low sensitivity in detecting excess adiposity and fails to identify more than 25% of children with excess body fat percentage [52]. Children with a high BMI percentile rank are almost definitively obese, but a secondary analysis of body composition may help define or rule out obesity in children categorized as “normal” weight [52]. The inclusion of secondary measures of adiposity was suggested in the evaluation of children suspected of being obese despite a normal BMI percentile [52,53,54]. Anthropometric measurements such as waist circumference and skinfold measurements of subcutaneous fat are easy to perform in a variety of settings. In addition, tracking of these measurements may aid in the overall assessment of adiposity. Skinfold measurements have been used to assess adiposity of children in public schools in the U.S. [55]. A 2007 study in the Netherlands reported that skinfold measurements during adolescence were a better predictor of adult obesity than BMI is [54]. A recent study of school children reported that bioelectrical impedance discriminated between adolescents with and without abdominal obesity and that waist circumference was a robust assessment of visceral (central) adiposity [56].
5. Limitations and Directions for Future Research
Limitations to the current study include its cross-sectional design and that the data may not reflect other populations of children. In this study, we did not assess the pubertal development and biological age of the participants due to the sensitive nature of the assessment in our research setting. Although comparing the relationship between BMI percentile rank and BF% after controlling for maturation would clarify this relationship, the common use of growth charts do not consider the stage of maturation. In a clinical setting, clinicians can interpret BMI percentile rank and data such as that presented in this study in the light of stage of maturation. Assessing maturation in future studies may be beneficial, and extend the results of this and previous studies and the interpretation of BMI percentile rank in clinical settings. Future studies can also evaluate the relationship between BMI and BMI percentile rank, and measures of central adiposity and visceral fat.
6. Conclusions
Obesity during childhood and adolescence predicts obesity in adulthood; hence, it is important to have persistent efforts to promote healthy lifestyle choices, and track changes in adiposity during childhood and adolescence. The results of this study indicate that there are significant sex differences in age-related trends in BF%, FMI, and FFMI, and that, at any given BMI percentile rank, girls have a higher BF% and FMI, and lower FFMI than boys do. A BMI percentile rank > 70% is associated with exponential increases in BF% in both boys and girls. Although the BMI percentile rank is not intended to compare boys and girls, one cannot assume that a boy and girl with the same BMI for age percentile rank have similar levels of adiposity. This has implications for the use of BMI percentile rank as a proxy measure of adiposity in various settings. Although the measurement of body composition in children has its own set of limitations, assessing or tracking changes in adiposity may best be accomplished through the simultaneous measurement of body composition, BMI for age percentile rank, and other anthropometric data. Data from multiple assessments provides additional information that can help clarify the interpretation of BMI percentile rank and better inform and educate children (and their parents) about their current health status and the benefits of reducing adiposity and adopting and maintaining healthy lifestyles.
Author Contributions
Conceptualization, P.R.V., G.W.F., A.M. and L.K.; methodology, P.R.V., G.W.F., A.M. and L.K.; formal analysis, P.R.V. and G.W.F.; investigation, P.R.V., G.W.F., A.M. and L.K.; resources, P.R.V.; writing—original draft preparation, P.R.V.; writing—review and editing, P.R.V. and G.W.F.; project administration, P.R.V., A.M. and L.K. All authors have read and agreed to the published version of the manuscript.
Funding
This research received no external funding.
Institutional Review Board Statement
The study was conducted according to the guidelines of the Declaration of Helsinki and approved by the Institutional Review Board of Brigham Young University (protocol 080153; 5 May 2010).
Informed Consent Statement
Informed child assent was obtained from all subjects involved in the study, and parental informed consent was obtained from parents.
Data Availability Statement
Data presented in this study are available upon request from the corresponding author. The data are not publicly available.
Conflicts of Interest
The authors declare no conflict of interest.
References
- Asayama, K.; Ozeki, T.; Sugihara, S.; Ito, K.; Okada, T.; Tamai, H.; Takaya, R.; Hanaki, K.; Murata, M. Criteria for medical intervention in obese children: A new definition of “obesity disease” in Japanese children. Pediatr. Int. 2003, 45, 642–646. [Google Scholar] [CrossRef] [PubMed]
- Atay, Z.; Bereket, A. Current status on obesity in childhood and adolescence: Prevalence, etiology, co-morbidities and management. Obes. Med. 2016, 3, 1–9. [Google Scholar] [CrossRef]
- Daniels, S.R.; Arnett, D.K.; Eckel, R.H.; Gidding, S.S.; Hayman, L.L.; Kumanyika, S.; Robinson, T.N.; Scott, B.J.; St Jeor, S.; Williams, C.L. Overweight in children and adolescents: Pathophysiology, consequences, prevention and treatment. Circulation 2005, 111, 1999–2012. [Google Scholar] [CrossRef] [Green Version]
- Horesh, A.; Tsur, A.M.; Bardugo, A.; Twig, G. Adoescent and childhood obesity and excess morbidity and mortality in young adulthood—A systematic review. Curr. Obes. Rep. 2021, 10, 301–310. [Google Scholar] [CrossRef] [PubMed]
- Ward, Z.J.; Long, M.W.; Resch, S.C.; Giles, C.M.; Cradock, A.L.; Gortmaker, S.L. Simulation of growth trajectories of childhood obesity into adulthood. N. Engl. J. Med. 2017, 377, 2145–2153. [Google Scholar] [CrossRef]
- Caprio, S.; Santorio, N.; Weiss, R. Childhood obesity and the associated rise in cardiometabolic complications. Nature Metab. 2020, 2, 223–232. [Google Scholar] [CrossRef] [PubMed]
- Fryar, C.D.; Kruszon-Moran, D.; Gu, Q.; Carroll, M.; Ogden, C.L. Mean body weight, height, waist circumferene, and body mass index amoung children and adolescents: Unites States, 1999–2018. In National Health Statistics Reports; Number 160; National Center for Health Statistics: Hyattsville, MD, USA, 2021. [Google Scholar] [CrossRef]
- Hales, C.M.; Fryar, C.C. QuickStats: Prevalences of obesity and severe obesity amoung persons aged 2–19 years—National Health and Nutrition Examination Survey, 1999–2000 through 2017–2018. Morb. Mortal. Wkl. Rep. 2020, 69, 390. [Google Scholar]
- Ogden, C.L.; Carroll, M.D.; Curtin, L.R.; Lamb, M.M.; Flegal, K.M. Prevalence of high body mass index in US children and adolescents, 2007–2008. J. Am. Med. Assoc. 2010, 303, 242–249. [Google Scholar] [CrossRef] [Green Version]
- Ogden, C.L.; Carroll, M.D.; Curtin, L.R.; McDowell, M.A.; Tabak, C.J.; Flegal, K.M. Prevalence of overweight and obesity in the United States, 1999–2004. J. Am. Med. Assoc. 2006, 295, 1549–1555. [Google Scholar] [CrossRef]
- Ogden, C.L.; Carroll, M.D.; Flegal, K.M. High body mass index for age among US chidren and adolescent, 2003–2006. J. Am. Med. Assoc. 2008, 299, 2401–2405. [Google Scholar] [CrossRef] [Green Version]
- Ogden, C.L.; Flegal, K.M.; Carroll, M.D.; Johnson, C.L. Prevalence and trends in overweight among US children and adolescents, 1999–2000. J. Am. Med. Assoc. 2002, 288, 1728–1732. [Google Scholar] [CrossRef] [PubMed] [Green Version]
- Ogden, C.L.; Kuczmarski, R.J.; Flegal, K.M.; Mei, Z.; Guo, S.; Wei, R.; Grummer-Strawn, L.M.; Curtin, L.R.; Roche, A.F.; Johnson, C.L. Centers for Disease Control and Prevention 2000 Growth Charts for the United States: Improvements to the 1977 National Center for Health Statistics Verson. Pediatrics 2002, 109, 45–60. [Google Scholar] [CrossRef] [PubMed] [Green Version]
- Fryar, C.D.; Carroll, M.D.; Afful, J. Prevalence of Overweight, Obesity, and Severe Obesity among Children and Adolescents Aged 2–19 Years: United States, 1963–1965 through 2017–2018. HCHS Heath E-States. Available online: https://www.cdc.gov/nchs/data/hestat/obesity-child-17-18/obesity-child.htm (accessed on 10 August 2021).
- Centers for Disease Control and Prevention. About Teen and Child BMI. Available online: https://www.cdc.gov/healthyweight/assessing/bmi/childrens_bmi/about_childrens_bmi.html#HowIsBMIUsed (accessed on 14 April 2022).
- Centers for Disease Control and Prevention. Defining Adult Overweight and Obesity. Available online: https://www.cdc.gov/obesity/basics/adult-defining.html?CDC_AA_refVal=https%3A%2F%2Fwww.cdc.gov%2Fobesity%2Fadult%2Fdefining.html (accessed on 14 April 2022).
- Daniels, S.R. The use of BMI in the clinical setting. Pediatrics 2009, 124, S35–S41. [Google Scholar] [CrossRef] [PubMed] [Green Version]
- Hattori, K.; Tahara, Y.; Moji, K.; Aoyagi, K.; Furusawa, T. Chart analysis of body composition change among pre- and postadolescent Japanese subjects assessed by under-water weighing method. Int. J. Obes. 2004, 28, 520–524. [Google Scholar] [CrossRef] [Green Version]
- Daniels, S.R.; Khoury, P.R.; Morrison, J.A. The utility of body mass index as ameasure of body fatness in children and adolescents: Difference by race and gender. Pediatrics 1977, 99, 804–807. [Google Scholar] [CrossRef]
- VanItalie, T.B.; Yang, M.U.; Heymsfield, S.B.; Funk, R.C.; Boileau, R.A. Height-normalized indices of the body’s fat-free mass and fat mass: Potentially useful indicators of nutritional status. Am. J. Clin. Nutr. 1990, 52, 953–959. [Google Scholar] [CrossRef] [Green Version]
- Demerath, E.W.; Schubert, C.M.; Maynard, L.M.; Sun, S.S.; Chumlea, W.C.; Pickoff, A.; Czerwinski, S.A.; Towne, B.; Siervogel, R.M. Do changes in body mass index percentile reflect changes in body composition in children? Data from the Fels Longitudinal Study. Pediatrics 2006, 117, e487–e495. [Google Scholar] [CrossRef] [Green Version]
- Maynard, L.M.; Wisemandle, W.; Roche, A.F.; Chumlea, W.C.; Gou, S.S.; Siervogel, R.M. Childhood body composition in relation to body mass index. Pediatrics 2001, 107, 344–350. [Google Scholar] [CrossRef]
- Morimoto, A.; Nishimura, R.; Sano, H.; Matsudaira, T.; Miyashita, Y.; Shirasawa, T.; Koide, S.; Takahashi, E.; Tajima, N. Gender differences in the relationship between percent body fat (%BF) and body mass index (BMI) in Japanese children. Diabetes Res. Clin. Pract. 2007, 78, 123–125. [Google Scholar] [CrossRef]
- Shypailo, R.J.; Wong, W.W. Fat and fat-free mass index references in children and young adults: Assessments along racial and ethnic lines. Am. J. Clin. Nutr. 2020, 112, 566–575. [Google Scholar] [CrossRef]
- Srdic, B.; Obradovic, B.; Dimitric, G.; Stokic, E.; Babovic, S.S. Relationship between body mass index and body fat in children—age and gender differences. Obes. Res. Clin. Pract. 2012, 6, e167–e173. [Google Scholar] [CrossRef]
- Vink, E.E.; van Coeverden, S.C.; van Mil, E.G.; Felius, B.A.; van Leerdam, F.J.M.; Delamarre-vas de Waal, H.A. Changes and tracking of fat mass in pubertal girls. Obesity 2010, 18, 1247–1251. [Google Scholar] [CrossRef] [PubMed]
- Wells, J.C. A critique of the expression of paediatic body composition data. Arch. Dis. Child. 2001, 85, 67–72. [Google Scholar] [CrossRef] [PubMed] [Green Version]
- Stierman, B.; Ogden, C.L.; Yanowski, J.A.; Martin, C.B.; Sarafrazi, N.; Hales, C.M. Changes in adiposity among children and adolescents in the United States, 1999–2006 to 2011–2018. Am. J. Clin. Nutr. 2021, 114, 1495–1504. [Google Scholar] [CrossRef] [PubMed]
- Doak, C.M.; Hoffman, D.J.; Norris, S.A.; Ponce, M.C.; Polman, K.; Griffiths, P.L. Is body mass index an appropriate proxy for body fat in children? Glob. Food Secur. 2013, 2, 65–71. [Google Scholar] [CrossRef]
- Prentice, A.M.; Jebb, S.A. Beyond body mass index. Obes. Rev. 2001, 2, 141–147. [Google Scholar] [CrossRef]
- Field, A.E.; Laird, N.; Steinberg, E.; Fallon, E.; Semega-Janneh, M.; Yanovski, J.A. Which metric of relative weight best captures body fatness in children? Obes. Res. 2003, 11, 1345–1352. [Google Scholar] [CrossRef] [Green Version]
- Himes, J.H. Challenges of accurately measuring and using BMI and other indictors of obesity in children. Pediatrics 2009, 124, S3–S22. [Google Scholar] [CrossRef] [Green Version]
- Nihiser, A.J.; Lee, S.M.; Wechsler, H.; McKenna, M.; Odom, E.; Reinold, C.; Thompson, D.; Grummer-Strawn, L. BMI measurment in Schools. Pediatrics 2009, 124, S89–S97. [Google Scholar] [CrossRef] [Green Version]
- Mooney, A.; Kelsey, L.; Fellingham, G.W.; George, J.D.; Hager, R.L.; Myrer, J.W.; Vehrs, P.R. Assessing body composition of children and adolescents using dual-energy X-ray absorptiometry, skinfolds, and electrical impedance. Meas. Phys. Educ. Exerc. Sci. 2011, 15, 2–17. [Google Scholar] [CrossRef]
- Centers for Disease Control and Prevention. BMI and BMI Percentile Calculator. Available online: https://www.cdc.gov/healthyweight/xls/bmi-group-calculator-us-062018-508.xlsm (accessed on 1 July 2021).
- Centers for Disease Control and Prevention. CDC Growth Charts: United States; National Center for Health Statistics: Hyattsville, MD, USA, 2020. Available online: http://www.cdc.gov/growthcharts (accessed on 14 April 2022).
- Freedman, D.S.; Sherry, B. The validity of BMI as an indicator of body fatness among children. Pediatrics 2009, 124, S23–S34. [Google Scholar] [CrossRef] [Green Version]
- Schutz, Y.; Kyle, U.U.G.; Pichard, C. Fat-free mass index and fat mass index percentiles in Caucasians aged 18–98 y. Int. J. Obes. 2002, 26, 953–960. [Google Scholar] [CrossRef] [Green Version]
- R Core Team. R: A Language and Environments for Statistical Computing. Available online: https://www.r-project.org/ (accessed on 13 August 2021).
- Pinheiro, J.; Bates, D.; DebRoy, S.; Sarkar, D.; R Core Team. {nlme}: Linear and Nonlinear Mixed Effects Models. Available online: https://cran.r-project.org/web/packages/nlme/index.html (accessed on 13 August 2021).
- Ngo, L.; Wand, M. Smoothing with mixed model software. J. Stat. Softw. 2004, 9, 1–54. [Google Scholar] [CrossRef]
- Payton, M.; Greenstone, M.; Schneker, N. Overlapping confidence intervals or standard error intervals: What do they mean in terms of statistical significance? J. Insect Sci. 2003, 3, 34. [Google Scholar] [CrossRef]
- Nevill, A.M.; Reuter, C.P.; Brand, C.; Gaya, A.R.; Mota, J.; Renner, J.D.P.; Duncan, M.J. BMI fails to reflect the developmental changes in body fatness between boys and girls during adolescence. Int. J. Environ. Res. Public Health 2021, 18, 7833. [Google Scholar] [CrossRef]
- Garn, S.M.; Clark, D.C. Trends in fatness and origins of obesity. Pediatrics 1976, 57, 443–456. [Google Scholar] [CrossRef]
- Mihalopoulos, N.L.; Holubkov, R.; Young, P.; Dai, S.; Labarthe, D.R. Expected changes in clinical measures of adiposity during puberty. J. Adolesc. Health 2010, 47, 360–366. [Google Scholar] [CrossRef] [Green Version]
- Taylor, R.W.; Grant, A.M.; Williams, S.M.; Gouldinig, A. Sex differences in regional fat distribution from pre- to postpuberty. Obesity 2010, 18, 1410–1416. [Google Scholar] [CrossRef]
- Goulding, A.; Taylor, R.W.; Gold, E.; Lewis-Barned, N.J. Regional body fat distibution in relation to pubertal stage: A dual-energy X-ray absorptiometry study of New Zealand girls and young women. Am. J. Clin. Nutr. 1996, 64, 546–551. [Google Scholar] [CrossRef] [Green Version]
- Hillman, J.B.; Biro, F.M. Dynamic changes in adiposity during purberty: Life may not be linear. J. Adolesc. Health 2010, 47, 322–323. [Google Scholar] [CrossRef] [Green Version]
- Freedman, D.S.; Wang, J.; Maynard, L.M.; Thorton, J.C.; Mei, Z.; Pierson, R.N.; Dietz, W.H.; Horlick, M. Relation of BMI to fat and fat-free mass amoung children and adolescents. Int. J. Obes. 2005, 29, 1–8. [Google Scholar] [CrossRef] [Green Version]
- Lee, K.; Lee, S.; Kim, S.Y.; Kim, S.J.; Kim, Y.J. Percent body fat cutoff values for classifying overweight and obesity recommended by the International Obesity Task Force (IOTF) in Korean children. Asia Pac. J. Clin. Nutr. 2007, 16, 649–655. [Google Scholar]
- Dwyer, T.; Blizzard, C.L. Defining obesity in children by biological endpoint rather than population distribution. Int. J. Obes. Relat. Metab. Disord. 1996, 20, 472–480. [Google Scholar]
- Javed, A.; Jumean, M.; Murad, M.H.; Okorodudu, D.; Kumar, S.; Someers, V.K.; Sochor, O.; Lopez-Jimenez, F. Diagnostic performance of body mass index to identify obesity as defined by adiposity in children and adolescents: A systemic review and meta-analysis. Pediatr. Obes. 2015, 10, 234–244. [Google Scholar] [CrossRef]
- da Viega, G.V.; Dias, P.C.; don Anjos, L.A. A comparison of distribution curves of body mass index from Brazil and the United States for assessing overweight and obesity in Brazilian adolescents. Rev. Panam. Salud Publ. 2001, 10, 79–85. [Google Scholar]
- Nooyens, A.C.J.; Koppes, L.L.J.; Visscher, T.L.S.; Twizk, J.W.R.; Kemper, H.C.G.; Schuit, A.J.; van Mechelen, W.; Seidell, J.C. Adolescent skinfold thickness is a better predictor of high body fatness in adults than is body mass index: The Amsterdam Growth and Health Longitudingal Study. Am. J. Clin. Nutr. 2007, 85, 1533–1539. [Google Scholar] [CrossRef] [Green Version]
- Pate, R.R.; Blimkie, C.; Castelli, D.; Corbin, C.B.; Daniels, S.R.; Kohl, H.W.; Malina, R.M.; Sacheck, J.; Stodden, D.; Whitt-Glover, M.; et al. Report Brief. Fitness Measures and Health Outcomes in Youth; Institute of Medicine of the National Academies: Washington, DC, USA, 2012. [Google Scholar]
- Bacopoulou, F.; Landis, G.L.; Palasz, A.; Tsitsika, A.; Vlachakis, D.; Tsarouhas, K.; Tsitsimpikou, C.; Stefanaki, C.; Kouretas, D.; Efthymiou, V. Identifying early abdominal obesity risk in adolescents by telemedicine: A cross-sectional study in Greece. Food Chem. Toxicol. 2020, 144, 111532. [Google Scholar] [CrossRef]
Figure 1.
Cross-sectional trends in (A) body fat percentage, (B) fat mass index, and (C) fat-free mass index by age, and the relationship between BMI percentile rank and (D) body fat percentage, (E) fat mass index, and (F) fat-free mass index. Blue markers and lines = boys; red markers and lines = girls; lines of best fit are solid; 95% confidence intervals are dashed lines. Lines of best fit with nonoverlapping 95% confidence intervals conservatively demonstrate statistical difference (p = 0.05).


Table 1.
Descriptive participant characteristics.
| Sex/Age | Height (cm) | Body Mass (kg) | BMI (kg/m2) | Percent Body Fat | FMI | FFMI | |
|---|---|---|---|---|---|---|---|
| Boys | |||||||
| 12 | (n = 36) | 155.4 ± 5.9 | 47.8 ± 11.4 | 19.7 ± 3.9 | 21.6 ± 9.0 | 4.5 ± 2.9 | 15.1 ± 1.6 * |
| 13 | (n = 28) | 161.9 ± 10.7 | 50.4 ± 10.9 | 19.2 ± 3.7 | 17.2 ± 7.9 * | 3.5 ± 2.5 * | 15.6 ± 1.9 |
| 14 | (n = 36) | 166.8 ± 7.1 * | 53.7 ± 7.9 * | 19.2 ± 2.4 * | 14.1 ± 4.6 * | 2.7 ± 1.2 * | 16.4 ± 1.7 |
| 15 | (n = 35) | 172.8 ± 7.4 * | 63.5 ± 14.1 * | 21.1 ± 3.8 | 15.9 ± 6.2 * | 3.5 ± 2.0 * | 17.6 ± 2.3 * |
| 16 | (n = 18) | 173.9 ± 9.3 * | 64.8 ± 8.8 * | 21.5 ± 3.2 | 13.3 ± 5.4 * | 2.9 ± 1.7 * | 18.5 ± 1.9 * |
| 17 | (n = 24) | 178.2 ± 6.6 * | 69.6 ± 7.2 * | 22.0 ± 3.0 | 13.0 ± 4.1 * | 2.9 ± 1.2 * | 19.1 ± 2.4 * |
| Total | (n = 177) | 167.1 ± 10.9 | 57.2 ± 13.1 | 20.3 ± 3.5 | 16.3 ± 7.2 * | 3.4 ± 2.1 | 16.9 ± 2.4 * |
| Girls | |||||||
| 12 | (n = 21) | 152.1 ± 7.8 | 43.6 ± 7.9 | 18.7 ± 2.6 | 24.6 ± 5.5 | 4.7 ± 1.6 | 14.1 ± 1.4 |
| 13 | (n = 31) | 159.0 ± 7.8 | 52.7 ± 10.6 | 20.8 ± 3.5 | 25.9 ± 6.4 | 5.6 ± 2.3 | 15.2 ± 1.8 |
| 14 | (n = 19) | 161.1 ± 7.3 | 59.6 ± 12.1 | 22.9 ± 4.2 | 29.4 ± 7.0 | 6.9 ± 2.8 | 15.9 ± 1.7 |
| 15 | (n = 42) | 162.6 ± 6.5 | 57.4 ± 7.7 | 21.7 ± 2.8 | 25.6 ± 6.5 | 5.7 ± 2.1 | 16.0 ± 1.4 |
| 16 | (n = 24) | 165.5 ± 5.5 | 57.9 ± 9.7 | 21.1 ± 3.2 | 25.4 ± 5.0 | 5.5 ± 1.8 | 15.6 ± 1.8 |
| 17 | (n = 18) | 163.5 ± 5.7 | 61.7 ± 7.8 | 23.1 ± 2.6 | 27.5 ± 3.9 | 6.4 ± 1.4 | 16.7 ± 1.7 |
| Total | (n = 155) | 160.8 ± 7.8 | 55.4 ± 10.6 | 21.3 ± 3.4 | 26.2 ± 6.0 | 5.7 ± 2.2 | 15.6 ± 1.7 |
Note. All values represent the mean ± SD. FMI = fat mass index (kg/m2). FFMI = fat-free mass index (kg/m2). * = significant (p < 0.05) difference between boys and girls of the same age.
Table 2.
Descriptive participant characteristics by BMI category.
| Boys (n = 177) | Girls (n = 155) | Combined (n = 332) | |
|---|---|---|---|
| Body mass index | |||
| Underweight | 15.94 ± 1.94 a | 16.16 ± 1.72 a | 15.98 ± 1.83 |
| Normal weight | 19.32 ± 2.02 b | 20.26 ± 4.60 a | 19.77 ± 2.16 |
| Overweight | 23.82 ± 1.67 c | 26.66 ± 1.56 b | 24.72 ± 1.85 |
| Obese | 29.61 ± 2.21 d | 28.62 ± 3.69 c | 29.19 ± 2.87 |
| Body fat percentage | |||
| Underweight | 12.72 ± 3.14 a | 19.20 ± 1.41 a | 13.80 ± 3.82 |
| Normal weight | 14.18 ± 4.51 a | 24.60 ± 4.60 a | 19.17 ± 6.93 |
| Overweight | 23.57 ± 7.40 b | 32.49 ± 5.36 b | 27.94 ± 7.88 |
| Obese | 31.17 ± 9.51 c | 37.14 ± 6.10 b | 33.68 ± 8.59 |
| Fat Mass Index (kg/m2) | |||
| Underweight | 1.98 ± 0.36 a | 3.11 ± 0.56 a | 2.17 ± 0.57 |
| Normal weight | 2.74 ± 1.02 a | 5.03 ± 1.28 a | 3.84 ± 1.62 |
| Overweight | 5.58 ± 1.69 b | 8.37 ± 1.70 b | 6.94 ± 2.19 |
| Obese | 9.17 ± 2.73 c | 10.72 ± 2.54 c | 9.82 ± 2.70 |
| Fat-free mass index (kg/m2) | |||
| Underweight | 13.96 ± 2.18 a | 13.04 ± 1.17 a | 13.81 ± 2.04 |
| Normal weight | 16.57 ± 1.81 b | 15.23 ± 1.52 a | 15.92 ± 1.80 |
| Overweight | 18.24 ± 2.44 c | 17.28 ± 1.25 b | 17.77 ± 1.99 |
| Obese | 20.43 ± 3.67 d | 17.89 ± 2.05 b | 19.36 ± 3.28 |
a, b, c, d = values with the same letters in each group and sex were not significantly different. Values with different letters in each group and sex were significantly different (p < 0.05). Underweight (<5th percentile rank); normal weight (5th to <85th percentile rank); overweight (85th to <95th percentile rank); obese (≥95th percentile rank).
Publisher’s Note: MDPI stays neutral with regard to jurisdictional claims in published maps and institutional affiliations. |
© 2022 by the authors. Licensee MDPI, Basel, Switzerland. This article is an open access article distributed under the terms and conditions of the Creative Commons Attribution (CC BY) license (https://creativecommons.org/licenses/by/4.0/).
Share and Cite
MDPI and ACS Style
Vehrs, P.R.; Fellingham, G.W.; McAferty, A.; Kelsey, L. Trends in BMI Percentile and Body Fat Percentage in Children 12 to 17 Years of Age. Children 2022, 9, 744. https://0-doi-org.brum.beds.ac.uk/10.3390/children9050744
AMA Style
Vehrs PR, Fellingham GW, McAferty A, Kelsey L. Trends in BMI Percentile and Body Fat Percentage in Children 12 to 17 Years of Age. Children. 2022; 9(5):744. https://0-doi-org.brum.beds.ac.uk/10.3390/children9050744
Chicago/Turabian StyleVehrs, Pat R., Gilbert W. Fellingham, Angela McAferty, and Laurel Kelsey. 2022. "Trends in BMI Percentile and Body Fat Percentage in Children 12 to 17 Years of Age" Children 9, no. 5: 744. https://0-doi-org.brum.beds.ac.uk/10.3390/children9050744
Note that from the first issue of 2016, this journal uses article numbers instead of page numbers. See further details here.