
Food Insecurity among Low-Income Households with Children Participating in a School-Based Fruit and Vegetable Co-Op

 , , , , and
Abstract
:1. Introduction
2. Materials and Methods
2.1. Brighter Bites
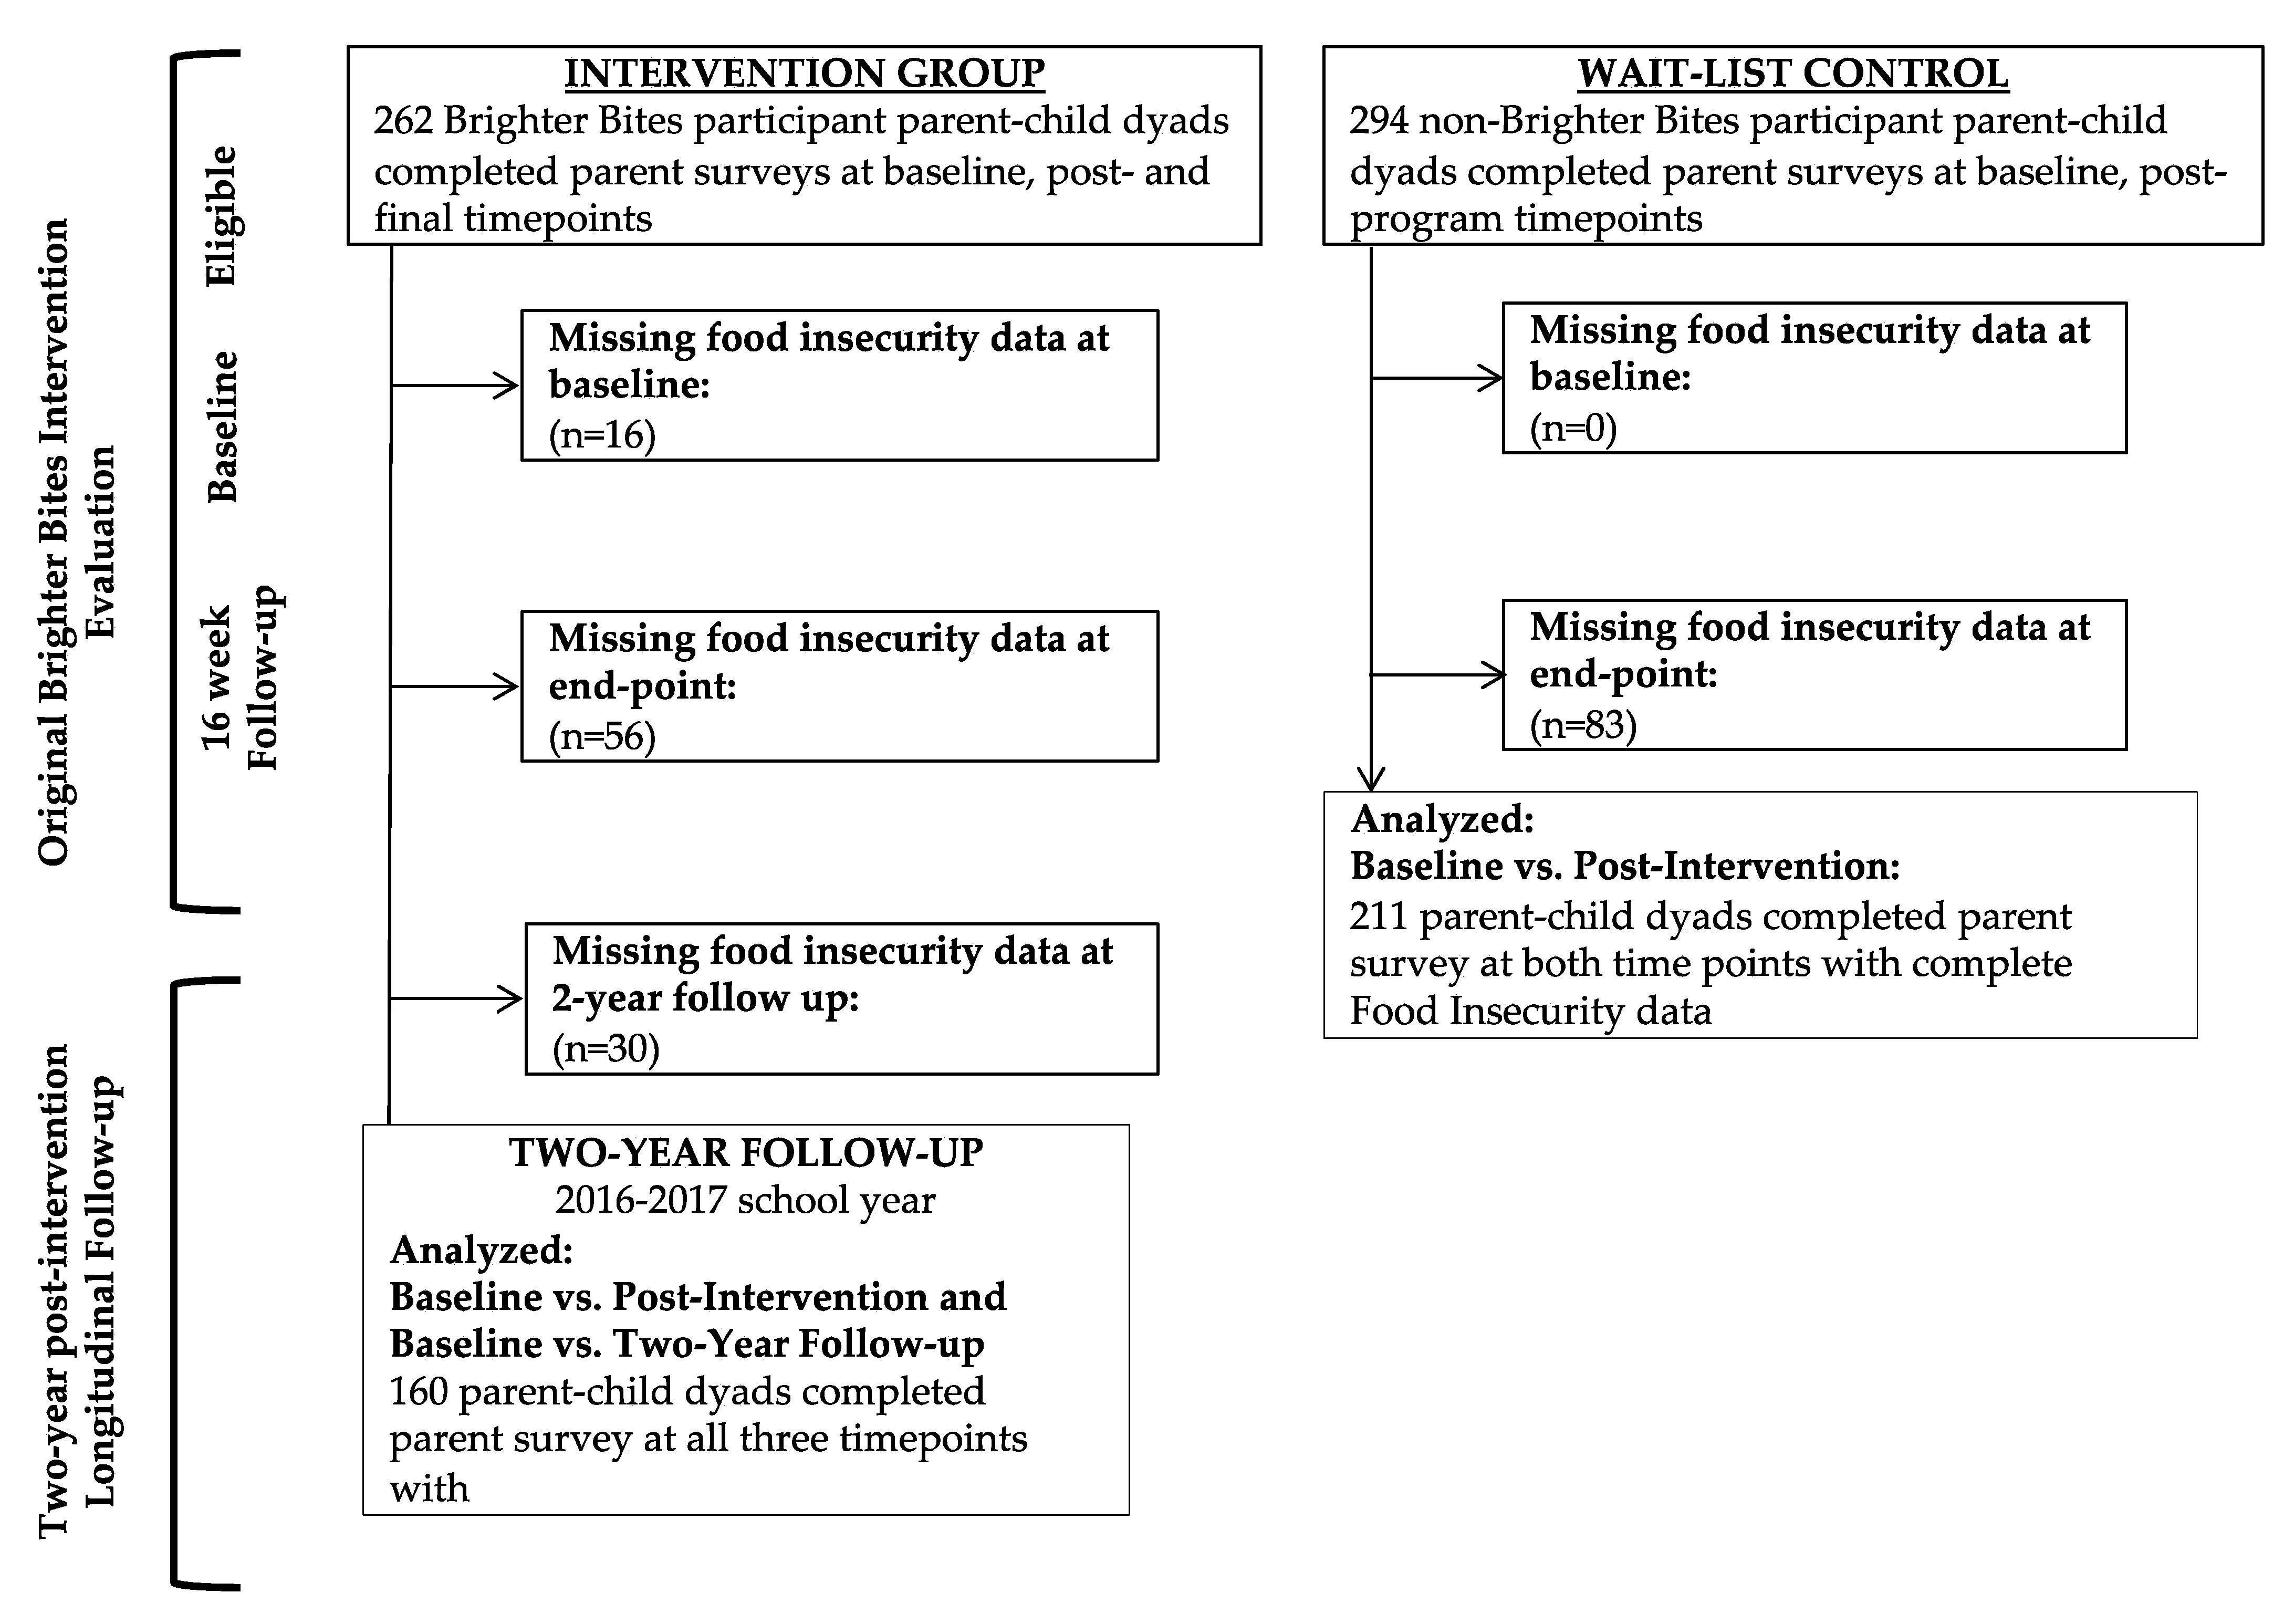
2.2. Design
2.3. Measures
2.4. Analysis
3. Results
3.1. Baseline Demographics
3.2. Estimated Changes in Percent Food Insecure over Time
4. Discussion
Strengths/Limitations
5. Conclusions
Author Contributions
Funding
Institutional Review Board Statement
Informed Consent Statement
Data Availability Statement
Conflicts of Interest
References
- U.S. Deptartment of Agriculture ERS. Food & Nutrition Assistance: Food Security in the U.S. Definitions of Food Security. Available online: https://www.ers.usda.gov/topics/food-nutrition-assistance/food-security-in-the-us/definitions-of-food-security.aspx (accessed on 1 February 2022).
- U.S. Deptartment of Agriculture ERS. Food & Nutrition Assistance: Food Security in the U.S. Key Statistics & Graphics 2020. Available online: https://www.ers.usda.gov/topics/food-nutrition-assistance/food-security-in-the-us/key-statistics-graphics.aspx#trends (accessed on 10 February 2021).
- The Impact of the Coronavirus on Food Insecurity in 2020 & 2021; Feeding America: Chicago, IL, USA, 2021.
- de Araújo, M.L.; de Deus Mendonça, R.; Lopes Filho, J.D.; Lopes, A.C.S. Association between food insecurity and food intake. Nutrition 2018, 54, 54–59. [Google Scholar] [CrossRef] [PubMed]
- Cook, J.T.; Frank, D.A. Food security, poverty, and human development in the United States. Ann. N. Y. Acad. Sci. 2008, 1136, 193–209. [Google Scholar] [CrossRef]
- Nagata, J.M.; Gomberg, S.; Hagan, M.J.; Heyman, M.B.; Wojcicki, J.M. Food insecurity is associated with maternal depression and child pervasive developmental symptoms in low-income Latino households. J. Hunger. Environ. Nutr. 2019, 14, 526–539. [Google Scholar] [CrossRef] [PubMed]
- Perez-Escamilla, F.; de Toledo Vianna, R.P. Food Insecurity and the Behavioral and Intellectual Development of Children: A Review of the Evidence. J. Appl. Res. Child. 2012, 3, 9. [Google Scholar]
- de Oliveira, K.H.D.; de Almeida, G.M.; Gubert, M.B.; Moura, A.S.; Spaniol, A.M.; Hernandez, D.C.; Pérez-Escamilla, R.; Buccini, G. Household food insecurity and early childhood development: Systematic review and meta-analysis. Matern. Child Nutr. 2020, 16, e12967. [Google Scholar] [CrossRef]
- Alaimo, K.; Olson, C.M.; Frongillo, E.A., Jr. Food insufficiency and American school-aged children’s cognitive, academic, and psychosocial development. Pediatrics 2001, 108, 44–53. [Google Scholar] [CrossRef]
- Aiyer, J.N.; Raber, M.; Bello, R.S.; Brewster, A.; Caballero, E.; Chennisi, C.; Durand, C.; Galindez, M.; Oestman, K.; Saifuddin, M.; et al. A pilot food prescription program promotes produce intake and decreases food insecurity. Transl. Behav. Med. 2019, 9, 922–930. [Google Scholar] [CrossRef]
- Gregory, C.A.; Coleman-Jensen, A. Food Insecurity, Chronic Disease, and Health among Working-Age Adults; U.S. Department of Agriculture Economic Research Service: Washington, DC, USA, 2017. [Google Scholar]
- Cook, J.T.; Frank, D.A.; Levenson, S.M.; Neault, N.B.; Heeren, T.C.; Black, M.M.; Berkowitz, C.; Casey, P.H.; Meyers, A.F.; Cutts, D.B. Child food insecurity increases risks posed by household food insecurity to young children’s health. J. Nutr. 2006, 136, 1073–1076. [Google Scholar] [CrossRef]
- Jun, S.; Cowan, A.E.; Dodd, K.W.; Tooze, J.A.; Gahche, J.J.; Eicher-Miller, H.A.; Guenther, P.M.; Dwyer, J.T.; Potischman, N.; Bhadra, A. Association of food insecurity with dietary intakes and nutritional biomarkers among US children, National Health and Nutrition Examination Survey (NHANES) 2011–2016. Am. J. Clin. Nutr. 2021, 114, 1059–1069. [Google Scholar] [CrossRef]
- Schmeer, K.K.; Piperata, B.A. Household food insecurity and child health. Matern. Child Nutr. 2017, 13, e12301. [Google Scholar] [CrossRef]
- Kirkpatrick, S.I.; McIntyre, L.; Potestio, M.L. Child hunger and long-term adverse consequences for health. Arch. Pediatrics Adolesc. Med. 2010, 164, 754–762. [Google Scholar] [CrossRef] [PubMed]
- Sellgman, H.K.; Bindman, A.B.; Vittinghoff, E.; Kanaya, A.M.; Kushel, M.B. Food Insecurity is Associated with Diabetes Mellitus: Results from the National Health Examination and Nutrition Examination Survey (NHANES) 1999–2002. JGIM J. Gen. Intern. Med. 2007, 22, 1018–1023. [Google Scholar] [CrossRef] [PubMed]
- Mokiao, R.; Hingorani, S. Food Insecurity and Kidney Disease: Symptoms of Structural Racism. Clin. J. Am. Soc. Nephrol. 2021, 16, 1903–1905. [Google Scholar] [CrossRef] [PubMed]
- Pérez-Escamilla, R.; Villalpando, S.; Shamah-Levy, T.; Méndez-Gómez Humarán, I. Household food insecurity, diabetes and hypertension among Mexican adults: Results from Ensanut 2012. Salud Publica de Mex. 2014, 56, s62–s70. [Google Scholar] [CrossRef] [PubMed]
- Pourmotabbed, A.; Moradi, S.; Babaei, A.; Ghavami, A.; Mohammadi, H.; Jalili, C.; Symonds, M.E.; Miraghajani, M. Food insecurity and mental health: A systematic review and meta-analysis. Public Health Nutr. 2020, 23, 1778–1790. [Google Scholar] [CrossRef]
- Spear, B.A. Adolescent growth and development. J. Acad. Nutr. Diet. 2002, 10, S23. [Google Scholar] [CrossRef]
- U.S. Department of Health and Human Services; U.S. Department of Agriculture. 2015–2020 Dietary Guidelines for Americans; U.S. Government Printing Office: Washington, DC, USA, 2015. [Google Scholar]
- World Health Organization. Global Strategy on Diet, Physical Activity, and Health: Promoting Fruit and Vegetable Consumption around the World. Available online: http://www.who.int/dietphysicalactivity/fruit/en/ (accessed on 22 August 2013).
- Marshall, A.N.; Markham, C.; Ranjit, N.; Bounds, G.; Chow, J.; Sharma, S.V. Long-term impact of a school-based nutrition intervention on home nutrition environment and family fruit and vegetable intake: A two-year follow-up study. Prev. Med. Rep. 2020, 20, 101247. [Google Scholar] [CrossRef]
- Sharma, S.V.; Markham, C.; Chow, J.; Ranjit, N.; Pomeroy, M.; Raber, M. Evaluating a school-based fruit and vegetable co-op in low-income children: A quasi-experimental study. Prev. Med. 2016, 91, 8–17. [Google Scholar] [CrossRef]
- Bandura, A. Social Foundations of Thought and Action: A Social Cognitive Theory; US Prentice-Hall Inc: Englewood Cliffs, NJ, USA, 1986. [Google Scholar]
- Ajzen, I. The theory of planned behavior. Organ. Behav. Hum. Decis. Processes 1991, 50, 179–211. [Google Scholar] [CrossRef]
- Handley, M.A.; Lyles, C.R.; McCulloch, C.; Cattamanchi, A. Selecting and improving quasi-experimental designs in effectiveness and implementation research. Annu. Rev. Public Health 2018, 39, 5–25. [Google Scholar] [CrossRef]
- Hoelscher, D.M.; Springer, A.E.; Ranjit, N.; Perry, C.L.; Evans, A.E.; Stigler, M.; Kelder, S.H. Reductions in child obesity among disadvantaged school children with community involvement: The Travis County CATCH Trial. Obesity 2010, 18, S36–S44. [Google Scholar] [CrossRef] [PubMed]
- Nader, P.R.; Stone, E.J.; Lytle, L.A.; Perry, C.L.; Osganian, S.K.; Kelder, S.H.; Webber, L.S.; Elder, J.P.; Montgomery, D.; Feldman, H.A. Three-year maintenance of improved diet and physical activity: The CATCH cohort. Arch. Pediatrics Adolesc. Med. 1999, 153, 695–704. [Google Scholar] [CrossRef] [PubMed]
- Nord, M.; Coleman-Jensen, A.; Andrews, M.; Carlson, S. Household Food Security in the United States, 2009; Contract No.: ERR-108; United States Department of Agriculture: Washington, DC, USA, 2010. [Google Scholar]
- Pan, L.; Sherry, B.; Njai, R.; Blanck, H.M. Food insecurity is associated with obesity among US adults in 12 states. J. Acad. Nutr. Diet. 2012, 112, 1403–1409. [Google Scholar] [CrossRef] [PubMed]
- U.S. Deptartment of Agriculture ERS. Food Security and Nutrition Assistance 2021. Available online: https://www.ers.usda.gov/data-products/ag-and-food-statistics-charting-the-essentials/food-security-and-nutrition-assistance (accessed on 20 June 2022).
- Bhat, S.; Coyle, D.H.; Trieu, K.; Neal, B.; Mozaffarian, D.; Marklund, M.; Wu, J.H. Healthy Food Prescription Programs and their Impact on Dietary Behavior and Cardiometabolic Risk Factors: A Systematic Review and Meta-Analysis. Adv. Nutr. 2021, 12, 1944–1956. [Google Scholar] [CrossRef]
- Savoie-Roskos, M.; Durward, C.; Jeweks, M.; LeBlanc, H. Reducing food insecurity and improving fruit and vegetable intake among farmers’ market incentive program participants. J. Nutr. Educ. Behav. 2016, 48, 70–76.e71. [Google Scholar] [CrossRef] [PubMed]
- Kaiser, L.; Chaidez, V.; Algert, S.; Horowitz, M.; Martin, A.; Mendoza, C.; Neelon, M.; Ginsburg, D.C. Food resource management education with SNAP participation improves food security. J. Nutr. Educ. Behav. 2015, 47, 374–378.e1. [Google Scholar] [CrossRef]
- Rivera, R.L.; Maulding, M.K.; Eicher-Miller, H.A. Effect of Supplemental Nutrition Assistance Program–Education (SNAP-Ed) on food security and dietary outcomes. Nutr. Rev. 2019, 77, 903–921. [Google Scholar] [CrossRef]
- Nord, M.; Prell, M. Food Security Improved Following the 2009 Arra Increase in Snap Benefits; Contract No.: ERR-116; US Department of Agriculture: Washington, DC, USA, 2011. [Google Scholar]
- Gundersen, C.; Ziliak, J.P. Food insecurity and health outcomes. Health Aff. 2015, 34, 1830–1839. [Google Scholar] [CrossRef]
- U.S. Deptartment of Agriculture ERS. Food & Nutrition Assistance: Food Security in the U.S. Measurement. Available online: https://www.ers.usda.gov/topics/food-nutrition-assistance/food-security-in-the-us/measurement.aspx (accessed on 8 December 2021).
- Hager, E.R.; Quigg, A.M.; Black, M.M.; Coleman, S.M.; Heeren, T.; Rose-Jacobs, R.; Cook, J.T.; de Cuba, S.A.E.; Casey, P.H.; Chilton, M. Development and validity of a 2-item screen to identify families at risk for food insecurity. Pediatrics 2010, 126, e26–e32. [Google Scholar] [CrossRef]
- Sharma, S.V.; Chuang, R.-J.; Rushing, M.; Naylor, B.; Ranjit, N.; Pomeroy, M.; Markham, C. Peer reviewed: Social determinants of health–related needs during COVID-19 among low-income households with children. Prev. Chronic Dis. 2020, 17, E119. [Google Scholar] [CrossRef]


| Characteristics | Total | Intervention Group | Control Group | |
|---|---|---|---|---|
| n = 371 | n = 160 | n = 211 | ||
| mean (±SD 4) | mean (±SD 4) | mean (±SD 4) | t-tests p-Values | |
| Child’s age | 6.14 (±0.36) | 6.13 (±0.35) | 6.14 (±0.36) | 0.676 |
| Parent’s age | 35.10 (±7.27) | 35.72 (±7.69) | 34.66 (±6.94) | 0.182 |
| Number of people in household | 4.93 (±1.74) | 5.02 (±1.98) | 4.87 (±1.54) | 0.417 |
| Number of children younger than 18 years old in household | 2.63 (±1.18) | 2.62 (±1.06) | 2.63 (±1.26) | 0.909 |
| n (%) | n (%) | n (%) | chi-sq tests p-values | |
| Child’s gender | ||||
| Boy | 170 (47.8) | 76 (50.3) | 94 (45.9) | 0.403 |
| Girl | 186 (52.2) | 75 (49.7) | 111 (54.1) | |
| Parent’s gender | ||||
| Male | 27 (7.5) | 13 (8.5) | 14 (6.7) | 0.517 |
| Female | 333 (92.5) | 139 (91.5) | 194 (93.3) | |
| Respondent’s relationship to child | ||||
| Mother | 331 (92.2) | 142 (92.8) | 189 (91.8) | 0.710 |
| Father or grandparents | 28 (7.8) | 11 (7.2) | 17 (8.3) | |
| Parent’s ethnicity | ||||
| Hispanic | 281 (77.0) | 125 (80.2) | 156 (74.6) | 0.035 * |
| African American | 65 (17.8) | 29 (18.6) | 36 (17.2) | |
| White | 13 (3.6) | 1 (0.6) | 12 (5.8) | |
| Other | 6 (1.6) | 1 (0.6) | 5 (2.4) | |
| Language spoken at home | ||||
| English or some English | 271 (78.8) | 105 (75.0) | 166 (81.4) | 0.156 |
| Spanish only or another language | 73 (21.2) | 35 (25.0) | 38 (18.6) | |
| Parent’s country of birth | ||||
| U.S. | 155 (45.7) | 58 (42.0) | 97 (48.3) | 0.258 |
| Other countries | 184 (54.3) | 80 (58.0) | 104 (51.7) | |
| Parent’s employment status | ||||
| Employed 1 | 180 (53.4) | 67 (48.6) | 113 (56.8) | 0.136 |
| Unemployed 2 | 157 (46.6) | 71 (51.4) | 86 (43.2) | |
| Parent’s highest education level | ||||
| Less than high school graduate 3 | 106 (31.4) | 46 (32.9) | 60 (30.3) | 0.773 |
| High school graduate | 91 (26.9) | 40 (28.6) | 51 (25.8) | |
| Some college or technical school | 86 (25.4) | 34 (24.3) | 52 (26.3) | |
| College graduate | 55 (16.3) | 20 (14.3) | 35 (17.7) |
| Intervention (n = 160) | Control (n = 211) | Net Difference | ||
|---|---|---|---|---|
| (95% CI 3), p-Value | ||||
| Pre vs. Post (16-weeks), comparison of intervention and control 1 | ||||
| Percent food insecure | ||||
| Pre-intervention | 81.3% | 55.3% | ||
| Post-intervention | 61.7% | 46.2% | ||
| Change in percent food insecure over time | −19.9% | −9.0% | −0.11 (−0.28, 0.07) | |
| p for change over time | 0.002 * | 0.152 | p = 0.12 | |
| Pre vs. Post (2-year follow-up), intervention only 2 | ||||
| Percent food insecure | ||||
| Pre-intervention | 76.4% | |||
| Post-intervention | 41.1% | |||
| Change in percent food insecure over time | −35.4% | |||
| p for change over time | <0.001 *** | |||
Publisher’s Note: MDPI stays neutral with regard to jurisdictional claims in published maps and institutional affiliations. |
© 2022 by the authors. Licensee MDPI, Basel, Switzerland. This article is an open access article distributed under the terms and conditions of the Creative Commons Attribution (CC BY) license (https://creativecommons.org/licenses/by/4.0/).
Share and Cite
Marshall, A.N.; Chuang, R.-J.; Chow, J.; Ranjit, N.; Dave, J.M.; Mathur, M.; Markham, C.; Sharma, S.V. Food Insecurity among Low-Income Households with Children Participating in a School-Based Fruit and Vegetable Co-Op. Children 2022, 9, 1250. https://0-doi-org.brum.beds.ac.uk/10.3390/children9081250
Marshall AN, Chuang R-J, Chow J, Ranjit N, Dave JM, Mathur M, Markham C, Sharma SV. Food Insecurity among Low-Income Households with Children Participating in a School-Based Fruit and Vegetable Co-Op. Children. 2022; 9(8):1250. https://0-doi-org.brum.beds.ac.uk/10.3390/children9081250
Chicago/Turabian StyleMarshall, Allison N., Ru-Jye Chuang, Joanne Chow, Nalini Ranjit, Jayna M. Dave, Mallika Mathur, Christine Markham, and Shreela V. Sharma. 2022. "Food Insecurity among Low-Income Households with Children Participating in a School-Based Fruit and Vegetable Co-Op" Children 9, no. 8: 1250. https://0-doi-org.brum.beds.ac.uk/10.3390/children9081250