
Temporal Clustering of the Causes of Death for Mortality Modelling


1
African Center of Excellence in Data Science (ACEDS), College of Business and Economics, University of Rwanda, Kigali P.O. Box 4285, Rwanda
2
Department of Mathematics, Physics, and Computing, School of Science and Aerospace Studies, Moi University, Eldoret P.O. Box 3900, Kenya
3
Department of Mathematics, College of Natural Sciences, Makerere University, Kampala P.O. Box 7062, Uganda
4
Department of Applied Statistics, College of Business and Economics, University of Rwanda, Kigali P.O. Box 4285, Rwanda
*
Author to whom correspondence should be addressed.
Risks 2022, 10(5), 99; https://0-doi-org.brum.beds.ac.uk/10.3390/risks10050099
Submission received: 5 January 2022
/
Revised: 17 March 2022
/
Accepted: 1 April 2022
/
Published: 6 May 2022
(This article belongs to the Special Issue Longevity/Mortality Risk Measurement and Management in Actuarial Sciences)
Abstract
:Actuaries utilize demographic features such as mortality and longevity rates for pricing, valuation, and reserving life insurance and pension contracts. Capturing accurate mortality estimates requires factual mortality assumptions in mortality models. However, the dynamic and uncertain nature of mortality improvements and deteriorations necessitates better approaches in tracking mortality changes, for instance, using the causes of deaths features. This paper aims to determine temporal homogeneous clusters using unsupervised learning, a clustering approach to group causes of death based on (dis)similarity measures to set representative clusters in detection and monitoring death trends. The causes of death dataset were derived from the World Health Organization, Global Health Estimates for males and females, from 2000 to 2019, for Kenya. A hierarchical agglomerative clustering technique was implemented with modified Dynamic Time Warping distance criteria. Between 6 and 14 clusters were optimally achieved for both males and females. Using visualisations, principal clusters were detected. Over time, the causes of death trends of these clusters have demonstrated a correlated association with mortality and longevity rates, rationalizing why insurance and pension offices may include this approach as a preliminary step to undertake mortality and longevity modelling.
1. Introduction
Mortality data associated with information such as cause of death is helpful, not only in the medical field (Foreman et al. 2012), but also in insurance and pension funds (Cox 1976). Actuaries in life insurance companies and pension funds analyze mortality and longevity risks using death and survival data to evaluate pricing, valuation, and reserving life insurance products. According to Ashley et al. (2019), the patterns and frequency of causes of death can be a leading indicator of insurance claims. Studies by Kwon and Nguyen (2019) using data from the United States and South Korea have demonstrated that improvements in mortality should be tracked and monitored. Furthermore, the United States population observation report (Holman and MacDonald 2021) concluded by clarifying the importance of considering the prevalence of the causes of death in mortality improvement assumptions for insurance to track mortality trends. Therefore, incorporating causes of death features can be beneficial in monitoring mortality changes over time to explain the specific drivers of increased insurance claims.
Mortality and longevity models form the core of actuarial work in tracking the mortality and survival of policyholders. Life insurance companies face increased death claims due to higher-than-expected mortality experiences, while pension funds are negatively affected by increased longevity rates. Correct estimation of these models is of vital interest to insurance and pension firms because it directly impacts profit or loss. Various models that incorporate data on the causes of death have been employed to model mortality (Caselli et al. 2019; Tabeau et al. 1999; McNown and Rogers 1992). Arnold and Sherris (2013) have shown that models that incorporate the cause of death model improve the assessment of mortality and longevity risks. These models are in contrast to those reviewed by Booth and Tickle (2008), which utilize extrapolation approaches from historical trends to predict mortality. Cause of death approaches have been the alternative of extrapolation models (Janssen 2018) and are being considered due to their perspectives on the underlying process of aggregate mortality (Robertson et al. 2013; Olshansky et al. 2002).
However, modeling mortality by causes faces critical challenges. Firstly, the causes of death data are non-stationary. That is, their mean and variances change continuously, rendering them more difficult to model in comparison to a stationary series. Secondly, causes of death suffer from the assumption of independence (Chiang 1968), where one cause of death influences another. These issues have led to the development of newer approaches in dealing with the cause of death models referred to as co-integration analyses (Séverine Arnold and Glushko 2021; Gaille and Sherris 2011), where econometrics approaches, such as Vector Error Correction Models (VECM), are applied to overcome the independence assumption among the causes of death by identifying co-integrated variables within the variables over the short and long term. Other approaches include the Copula type models, which incorporate the dependence relationship among cause-specific rates described by Li and Lu (2018). Such methods may seek a preliminary understanding of death trends and relationships of the causes of death before usage; thus, we aim to fill this gap.
Causes of death data are dynamic and unique to the country of origin. The adoption of the International Classification of Diseases (ICD) by the World Health Organization (WHO) created standardization in classifying causes of death globally. Newer causes of death, such as COVID-19, as described by Shaylika (2020), emerged while others, such as smallpox, have been declared eradicated by the World Health Organization (Meyer et al. 2020). Furthermore, Acquired Immunodeficiency Syndrome (HIV/AIDS) had been a significant contributor to deaths in Kenya, although this is on a declining trend. In 2022, countries are required to implement the ICD 11 framework according to Medicare Centers for Medicaid Services and National Center for Health Statistics (2019). Most developing countries, however, do not participate in the ICD framework, thereby continuing their disadvantage. Therefore, there is the need for such countries to have a reliable framework in accounting for causes of deaths in mortality models.
Besides exclusion from key reporting frameworks such as ICD, most developing countries lack coherent approaches in mortality models mainly because of unreliable data (Arnold and Sherris 2015). These countries have insufficient historical data, a key input in mortality models, especially for extrapolation techniques. With this realization, cause of death models would seem relevant and suitable, incognizant of the newer modeling approaches in the short run. As a preliminary strategy to undertaking cause-o-death modeling, this research is motivated to be a complementary approach based on the application of an exploratory clustering technique, in order to understand the dynamics of trending causes of death in terms of homogeneous clusters.
Therefore, the aim of this paper is to look at how data on deaths, specifically, the causes of death, influence the trend of aggregate mortality rates over time to aid methodical detection, quantification, and monitoring of the causes of death where a standardized classification, insufficient data, and modeling frameworks are nonexistent. For these reasons, an exploratory approach will be employed to identify and gauge the temporal causes of deaths in Kenya to analyze the fluctuations in the various causes of death. Eventually, the causes of death will be clustered into representative groups using a temporal clustering technique, which is an unsupervised learning algorithm. These groups may then be used as informational benchmarks for mortality modeling by analyzing their trending structures.
The contributions of this paper are:
- The addition of a clustering approach of the causes of death that allows for temporality. This gap is essential because it would enable actuaries to incorporate causes of death features in their judgment for future mortality experience.
- Applying the causes of death features in a developing country setting to expand mortality modeling literature in such jurisdictions.
1.1. Clustering
Clustering is a machine learning algorithm, as pointed out by (Richman 2018). It is categorized as unsupervised learning because it uses traits within the data to detect and classify key observations into similar groupings using set criteria (Han et al. 2011).
There are five main types of clustering: partitioning, hierarchical, density-based, grid-based, and model-based techniques (Charrad et al. 2019). Partition (pam) clustering algorithms are further subdivided into hard (Crisp) and soft (Fuzzy) clustering. In the case of hard clustering, observations belong to just one cluster. Examples of hard clustering include: K-means, K-medoids, and Clustering Large Applications (CLARA) algorithms. In the case of soft clustering methods, data points can belong to any cluster with a level of likelihood, for instance, the fanny clustering approach described by Gan and Valdez (2020).
Clustering techniques have been incorporated into many fields such as biology, finance, agriculture, and Geographic Information Systems (GIS) (Lamb et al. 2020). In actuarial applications, Yao (2016) applied clustering in non-life insurance in the ratemaking of car insurance by explaining the general approach in territory clustering. Valuing life insurance products such as variable annuity contracts, Gan and Huang (2017), as well as Gan and Valdez (2016), selected representative policies using clusters to predict models. O’Hagan and Ferrari (2017) applied clustering in actuarial science as a data compression procedure where complex assets and liabilities were divided into several clusters to act as a single representative policy. These policies were subsequently used to model the performance of policy portfolios.
1.2. DTW Barycenter Averaging—DBA
According to Charrad et al. (2019), there are over 30 clustering algorithms; however, the best option depends on the type of the dataset, the clustering goal, and the compression level. Conventional clustering approaches do not perform well in the presence of moving objects relative to time. In the case of time series data, static clustering methods ignore the similarity of subsequent series, which may be utilized to compare objects more effectively (Guijo-Rubio et al. 2020). This shortcoming calls for a suitable model when dealing with time-series data.
According to Aghabozorgi et al. (2015), clustering applications in the field of time-stamped data are based on sequential data measurements taken across a period from the same source and are used to track change over time, i.e., Dynamic Time Warping, DTW (Lee et al. 2020; Sakoe 1971). This approach tracks the evolution of data over time, creates clusters that follow observations through time, and forms clusters based on the (dis)similarity distance measurement relevant to the given time series. It computes a dynamic distance approach by analyzing two sequences and obtaining an optimal warping path between them, while adhering to specific criteria such as monotonicity (Sard 2019). DTW has been used to overcome some of the drawbacks of the standard Euclidean and Manhattan distance shown in Table 1. That is, it enables the dynamic evolution of data points with time. Time-series clustering developments have evolved over the years, aiming to minimize the computational cost and improve accuracy. However, the classic DTW has continued to be as effective (Wang et al. 2013). DTW has been implemented on many fronts, such as water quality monitoring in hydrology (Lee et al. 2020), gene expression in bioinformatics (Aach and Church 2001), and finance (Tsinaslanidis et al. 2014).
This paper extends the DTW methodology by incorporating a prototype function known as Barycenter Averaging (DBA), which aims to minimize its squared distance from an original sequence repeatedly (Petitjean et al. 2011). Furthermore, evaluation has been shown to compare favorably with other prototyping functions in literature (Soheily-Khah et al. 2015; Zhao and Itti 2018). It is a suitable prototyping function that complements the centroid linkage criteria to capture the overall mean of the centroids over time.
The paper is outlined as follows. Section 2 will describe the source and elements of the dataset and the methods implemented. The results and discussion will be presented in Section 3 together with their interpretations, which will outline the implications of the results based on the research question. The conclusion and future extensions will be presented in Section 4.
2. Materials and Methods
2.1. Data Source
The data is derived from the World Health Organization, WHO database for Kenya, from https://www.who.int/data/gho/data/themes/mortality-and-global-health-estimates/ghe-leading-causes-of-death (accessed on 1 December 2021). It contains 131 causes of death with GHE codes (see Table A1 in Appendix A); the features are: year {2000–2019}, gender {Male, Female} and, age {0–1, 1–4, …, 75–79, 80–85, 85+ years}, which will be sub-set into two that are between 20 years and up to 60 years and over 60 years (WHO 2020).
The universal set of 131 causes of deaths will be denoted by C.S. and it will be used to represent the gender: male and female. The years of interest will be 2000 to 2019, denoted by T. Two sets of age brackets will be used, 20 ≤ x < 60 and x ≥ 60. The age of 20 to 60 will be key in monitoring mortality risk and entails the minimum legal age to be eligible for life insurance in many countries. Additionally, individuals over the age of 60 have repercussions on pension and often consist of retirees affected by longevity risk.
The fundamental quantity of interest will be the death rate , which is the ratio of deaths to the mid-year population for each age (x), sex (s), cause (c), and year (t) given by . The approach of using death rates, and not the number of deaths would enable the time differential to be factored into the clusters.
Before clustering, the deaths data will be transformed by scaling to reduce the variability of the magnitude of death rates generated by leading causes of deaths and low-tiered causes. Using hierarchical clustering and visualizations, the research questions will be answered from the data by exploring the trends and patterns of the leading causes of death based on gender {male, female}, age {20 ≤ x < 60 and x ≥ 60}, and year (period) {2000–2019}, grouped annually.
2.2. Notations
A clustering set is denoted as a set of collections, also called a power set, such that where , . Let represent the th cluster while stands for the center of cluster and represents the th cluster while stands for the center of cluster . Further, and are the cardinality belonging to cluster Ci denoted |Ci| and Cj denoted |Cj|, respectively. The distance d (xi,yi) is the distance between the objects xi and yi in cluster and d (xj,yj) is the distance between the objects xj and yj in cluster .
2.3. Clustering Tendency
Before performing the cluster analysis, the cluster ability was assessed using Hopkins statistics (Lawson and Jurs 1990) for each age group. The existence of clusters in the dataset was determined by measuring the probability of whether the data comes from a uniform distribution. Any value equal to 0.5 illustrates that the data is uniform. Additionally, values less than 0.5 and closer to zero present non-cluster able data. According to Hopkins Statistic, the aim is to achieve an H value closer to one. It is expressed as below:
2.4. Hierarchical Agglomerative Clustering
A hierarchical agglomerative clustering mechanism was applied to obtain homogenous groups of the causes of death that are distinct to ages, sex, and time. Using the agglomerative (combining) technique, a bottom-up approach, individual causes of deaths are continually merged into successive clusters of the hierarchical clustering. The number of the causes of death data is classified over the period 2000 to 2019. The results will enable us to select the ideal groups applicable to insurance companies in the long run. These techniques will allow scaling to incorporate newer causes of death and cluster groups. It will involve the following step-wise procedure on the data, as shown by Algorithm 1.
| Algorithm 1 Hierarchical Agglomerative Clustering Algorithm |
|
The key parameters of interest include the distance measure criteria, and the linkage criteria is presented as follows:
2.5. Distance Measures
Table 1 shows some of the distance criteria used in the literature. We will implement the DTW distance with a DBA prototype function.
Table 2 gives some of the linkage criteria described by Gan et al. (2007) and Lance and Williams (1967). The centroid linkage criterion will be implemented because our results will require averaged centroid extractions.
2.6. Stepwise Procedure for DTW Barycenter Averaging (DBA)
In conjunction with the DTW distance, individual causes of death sequences may be modeled with underlying means. Stepwise, it is an iterative selective process that commences randomly with one of the series in the data as a reference (centroid). Subsequently, it computes the DTW alignment between the cluster and the centroid series. For each centroid point, the average is calculated using the values in each group and then performed repeatedly until a specific number of iterations have converged.
2.7. Cluster Validity
Cluster validity is the process of evaluating and determining optimal clusters that exist in a dataset and subsequently assessing the resultant clusters to ensure the quality of the clusters, such as internal, external, and relative cluster validity, which are the three categories of cluster validity indices (Gan et al. 2007). The difference between the first two validity measures is that the external compares the resulting partition to the right one. In contrast, internal validity measures analyze the partitioned data and measure cluster purity. External CVIs are valid if the ground truth is understood. A heuristic approach will be preferred when selecting the optimal number of clusters. The best set of internal cluster validity indexes and visualization techniques are used to perform this task. The majority of internal indices calculate a quality measure by combining cluster cohesiveness (inside or intra-variance) and cluster separation (between or inter-variance (Arbelaitz et al. 2013), they are implemented by the dtwclust and tsclust package in R (Sard 2019) and Montero and Vilar (2015), respectively. Cluster validity index of the seven indices with their objective criterion are as described by Wang and Zhang (2007) as shown by Table 3. Both the maximizing and minimizing cluster validation functions are implemented with the aim of enhancing the optimality of the achieved clusters.
2.8. Cluster Elimination Approach
To present the applicability of the proposed clustering methodology in life insurance and pensions, a cause elimination approach will be adopted. This approach is based on the multiple decrement model under competing risks (Chiang 1968). It has previously been applied in studies by Kwon and Nguyen (2019), Li et al. (2019), Kaishev et al. (2007), and Alai et al. (2015). This approach will be extended to clusters assuming independence of the clusters holds.
Let the probability of dying due to cluster be . The mortality adjusted as a result of cluster elimination due to cluster for the age group in the year is represented by . Where represents the mortality change factor such that , bounded by . This factor represents the improvement or deterioration of mortality from the expected mortality. If is negative or positive, the modified mortality will increase or decrease, respectively. As the assumption of independence of the causes of death holds, the extra mortality resulting from the cluster elimination will be re-distributed to the remaining clusters using proportional weights as explained by Alai et al. (2015). Furthermore, the central death rates derived from the population data will be transformed to the annualized probability type consistent with life tables by applying the following transformation formula: , where can be used interchangeably. The following quantities will be derived and computed from the dataset:
A hypothetical temporary life assurance and life annuity products payable in arrears will be developed for males and females aged 20 and 60 years based on the Dickson et al. (2019) approach. The respective Actuarial Present Values (APV) will be achieved based on Equations (4) and (5) for n = 0, 1, …, 9
According to the prevailing government bond yields, a basis of 13% per annum effective rate will be applied. This rate reflects the interest rate risk for Kenya. A 10-year window period assumes that historical trends will continue like the current mortality rates. The achieved clusters’ behavior regarding the overall mortality will be monitored and observed based on the different values of the mortality shocks, for 0, ±5%, ±10%, and ±15%. The motivation of this scenario-based approach is also to incorporate the usage of ±10% rate of mortality shock recommended by legislation in Kenya (Insurance Regulatory Authority 2017). The influence of eliminating a cluster in the age group and gender will be quantified and assessed in conjunction with the derived Actuarial Present Values (APV) and assumption rates using visualization techniques.
3. Results and Discussions
3.1. Cluster Tendency
Based on Table 4, the clustering tendency of the dataset is set out by the Hopkins Statistic. For both male and female age groups, the values are closer to one, indicating the existence of clusters in the data for all age groups. This finding explains that the data is cluster-able and appropriate to perform clustering.
3.2. Optimal Clusters
Table 5 shows the optimal cluster results based on age for males and females. It was found that more clusters emerged from younger males and females than their older counterparts. This finding validates the reason for lower life expectancies in developing countries due to more causes of death in younger ages (Roser et al. 2013).
3.3. Cluster Validity Indices
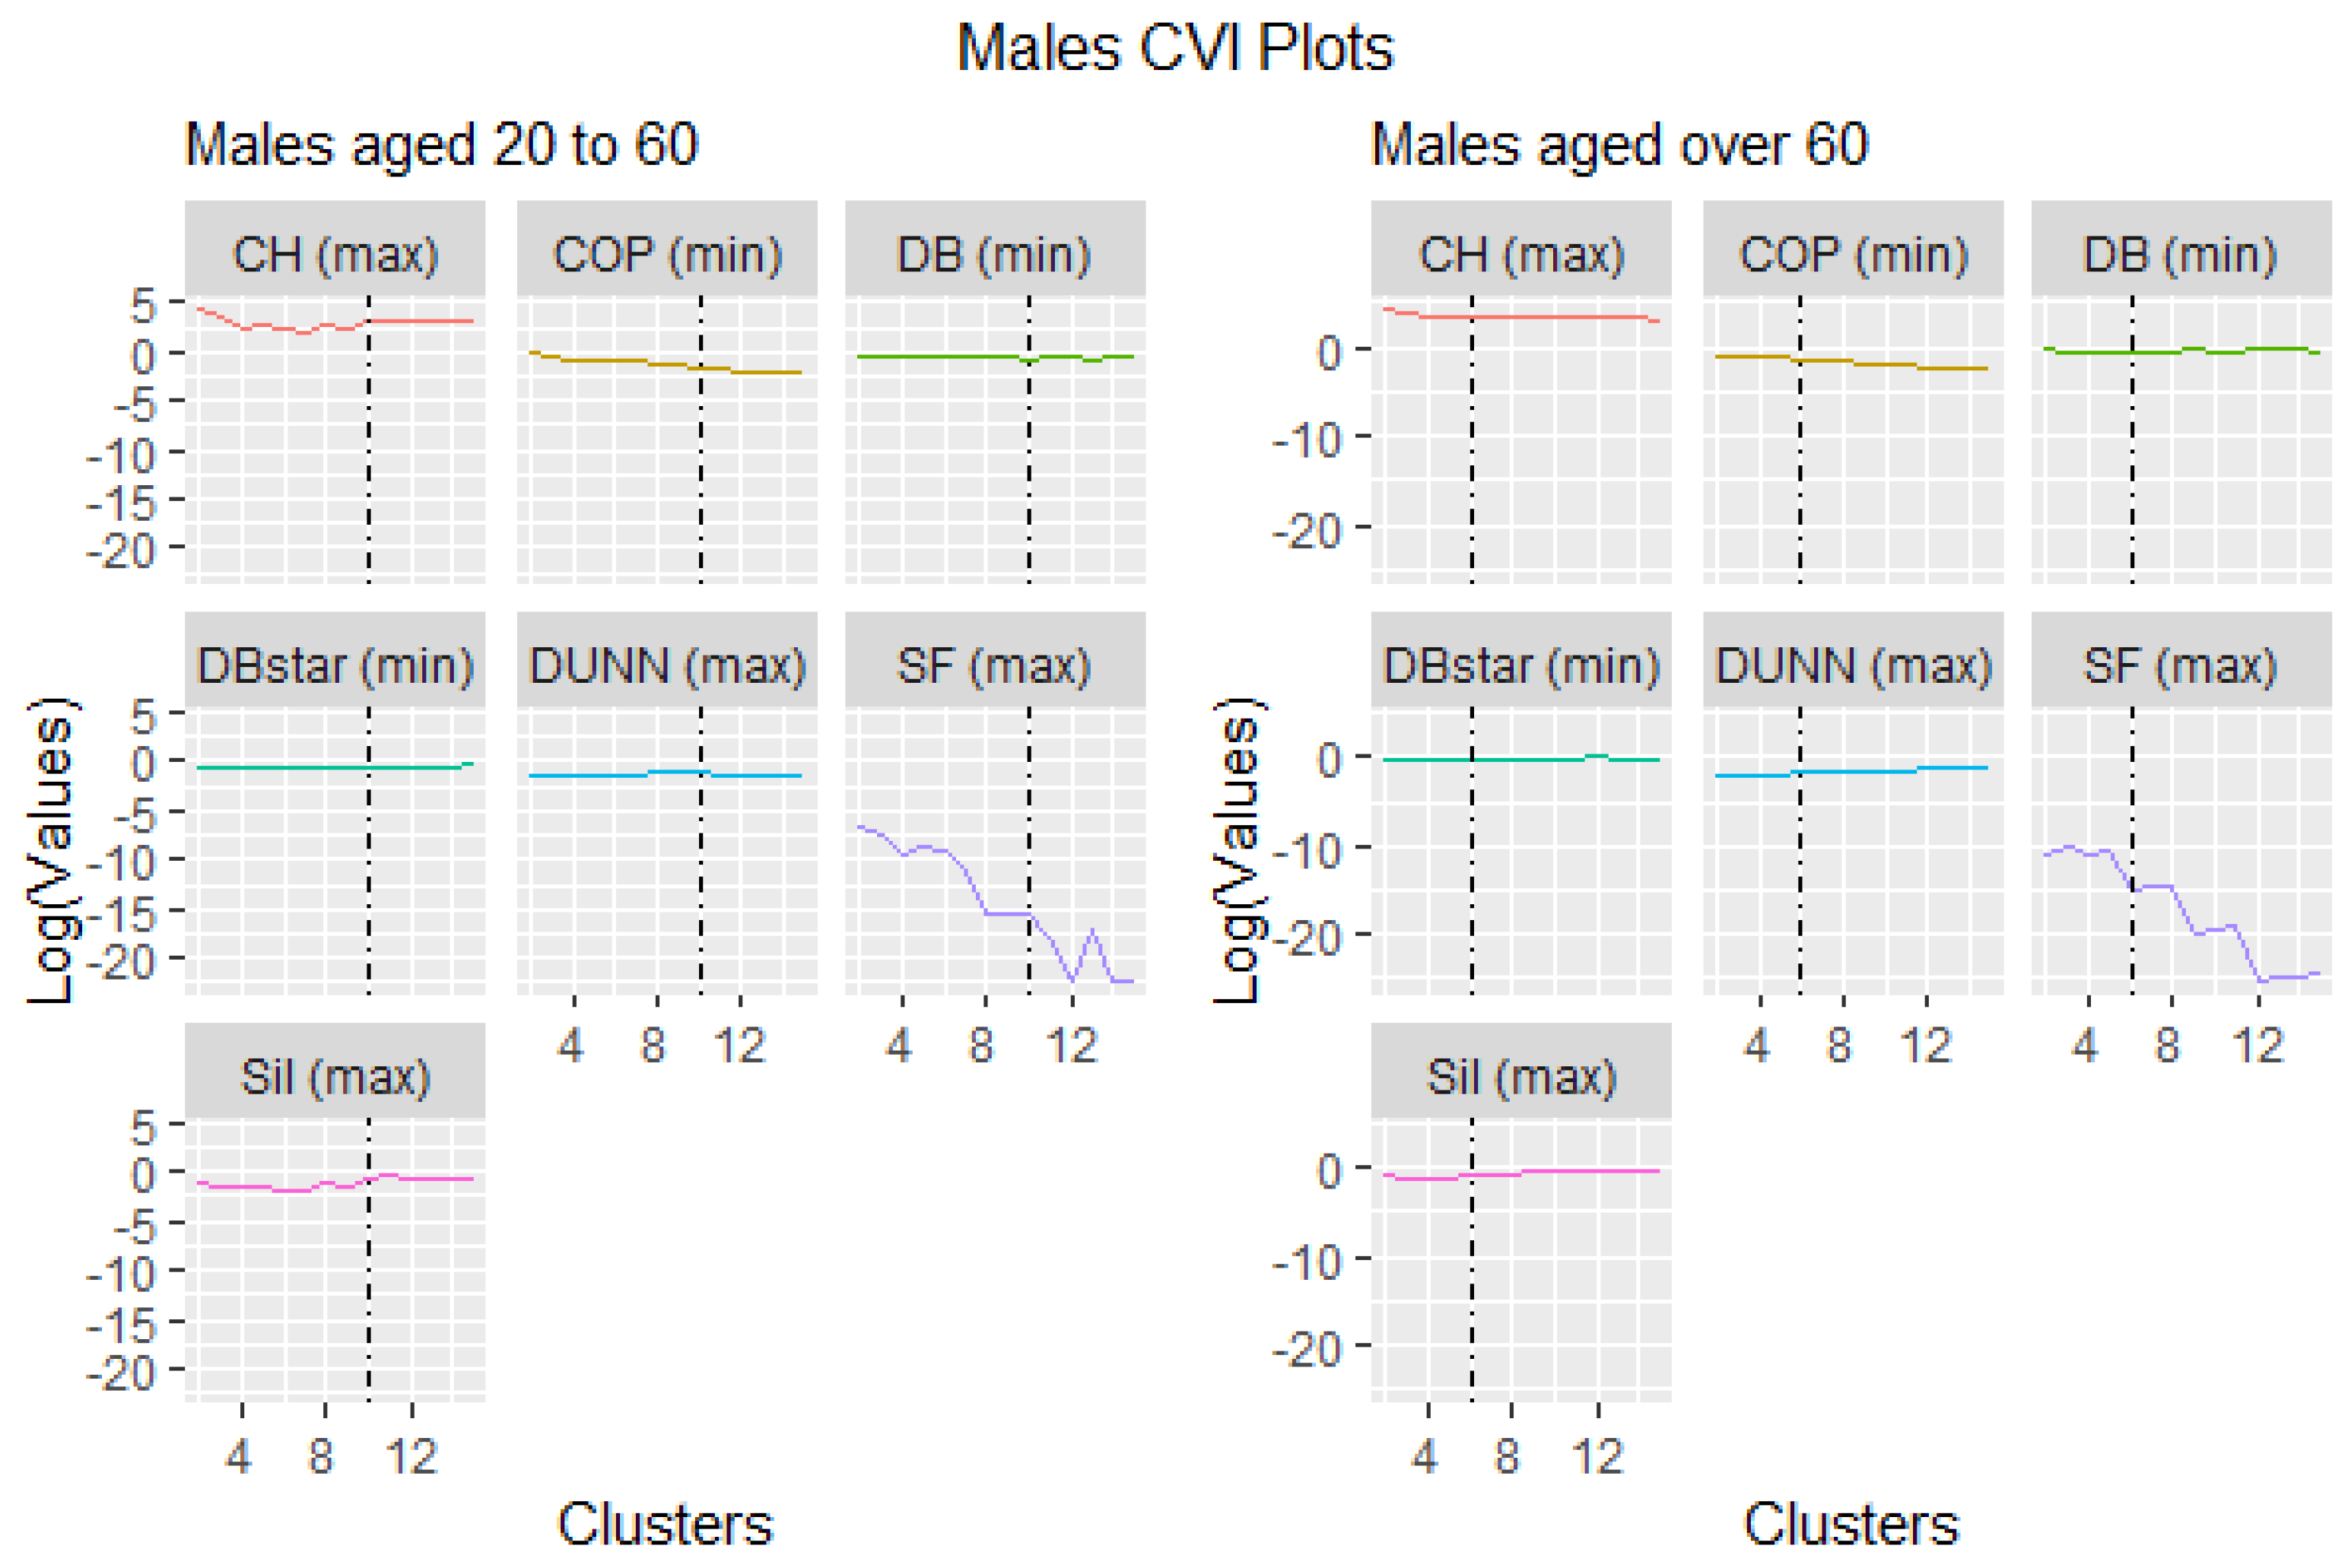
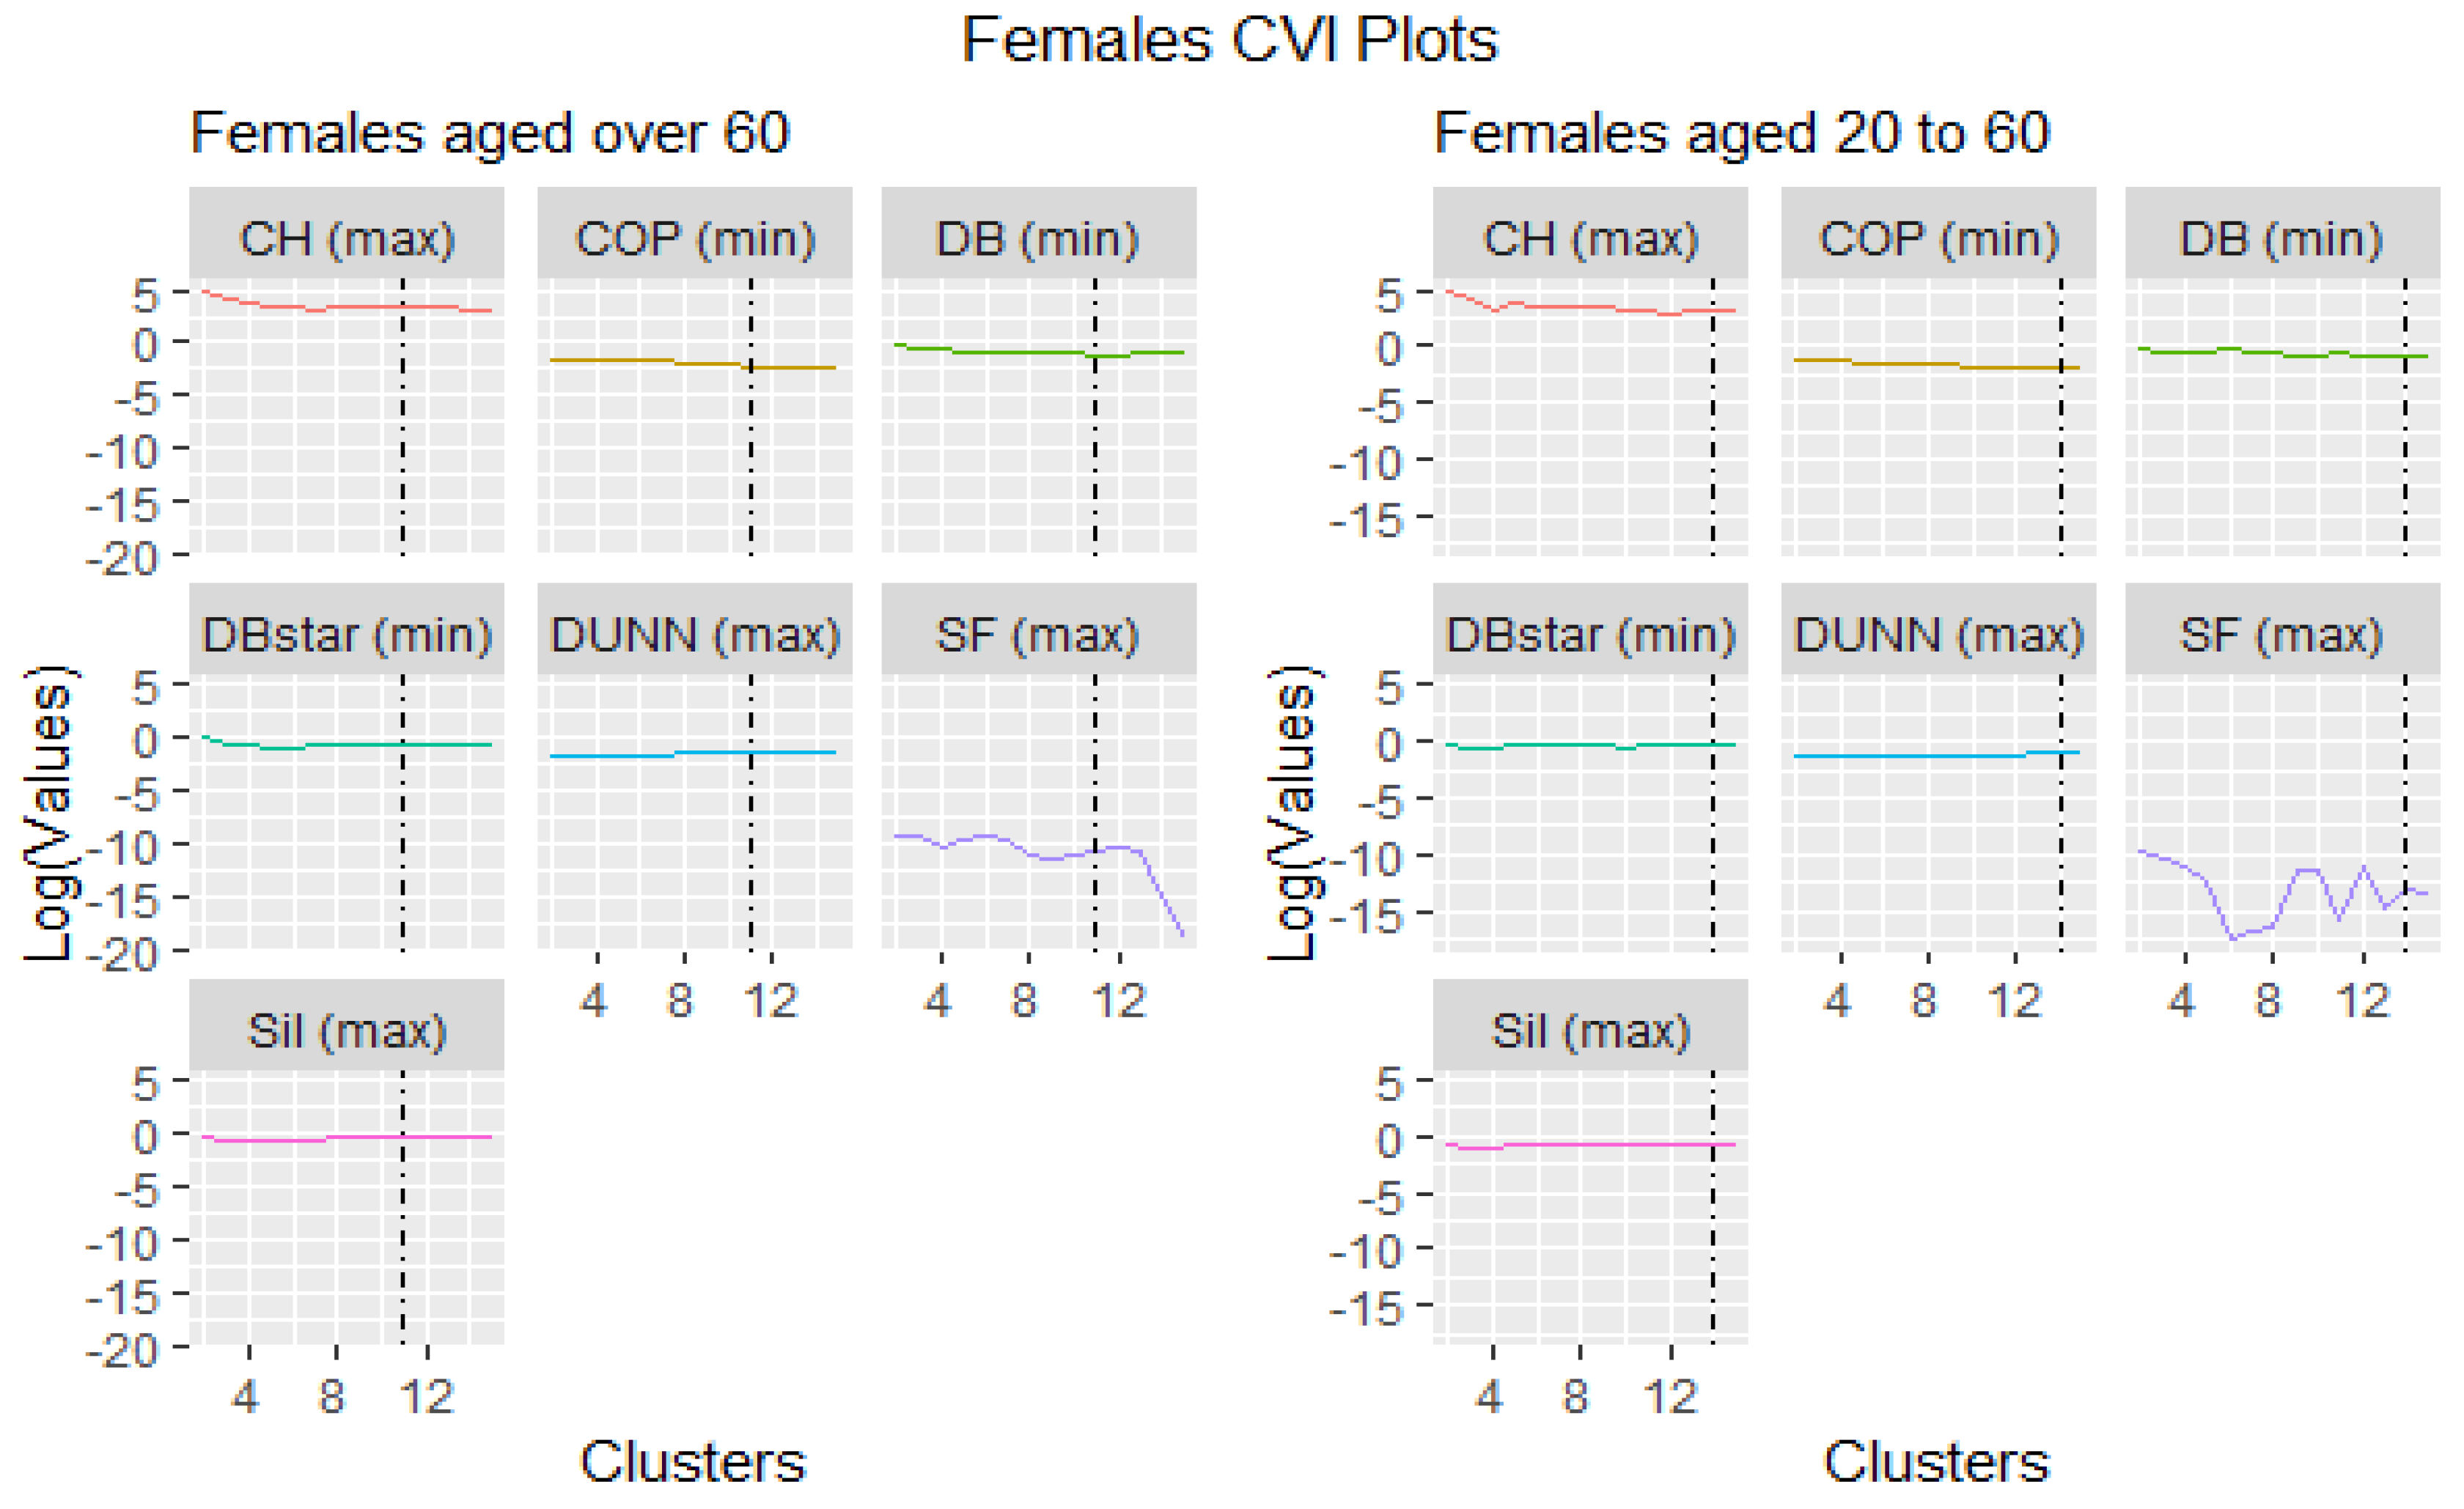
This section presents the results of seven cluster validity indices ranked either by maximizing or minimizing their objective functions (refer to Table 3). The best cluster is selected from the highest and lowest ranking indices depending on the criteria of the objective function, which is either maximization or minimization. Table 6, Table 7, Table 8 and Table 9 show the aggregate ranking based on all the objective functions for a given cluster. Because this is an iterative and parameterized approach, the range of the cluster limits was set between 2 and 15, which was also the default in the tsclust package algorithm.
Visually, Figure 1 and Figure 2 were the representation of the outcomes distinguished by the black vertical broken line signifying the optimal cluster points. They show that some validation indices performed abnormally. For instance, the Score Function (SF) chose cluster 2 as the best cluster representation for all ages and gender, but it was not an optimum choice compared to the rest of the indices. The probable reason might be that the Score Function index works well with hyper spheroid data structures and not time series, as Saitta et al. (2007) investigated.
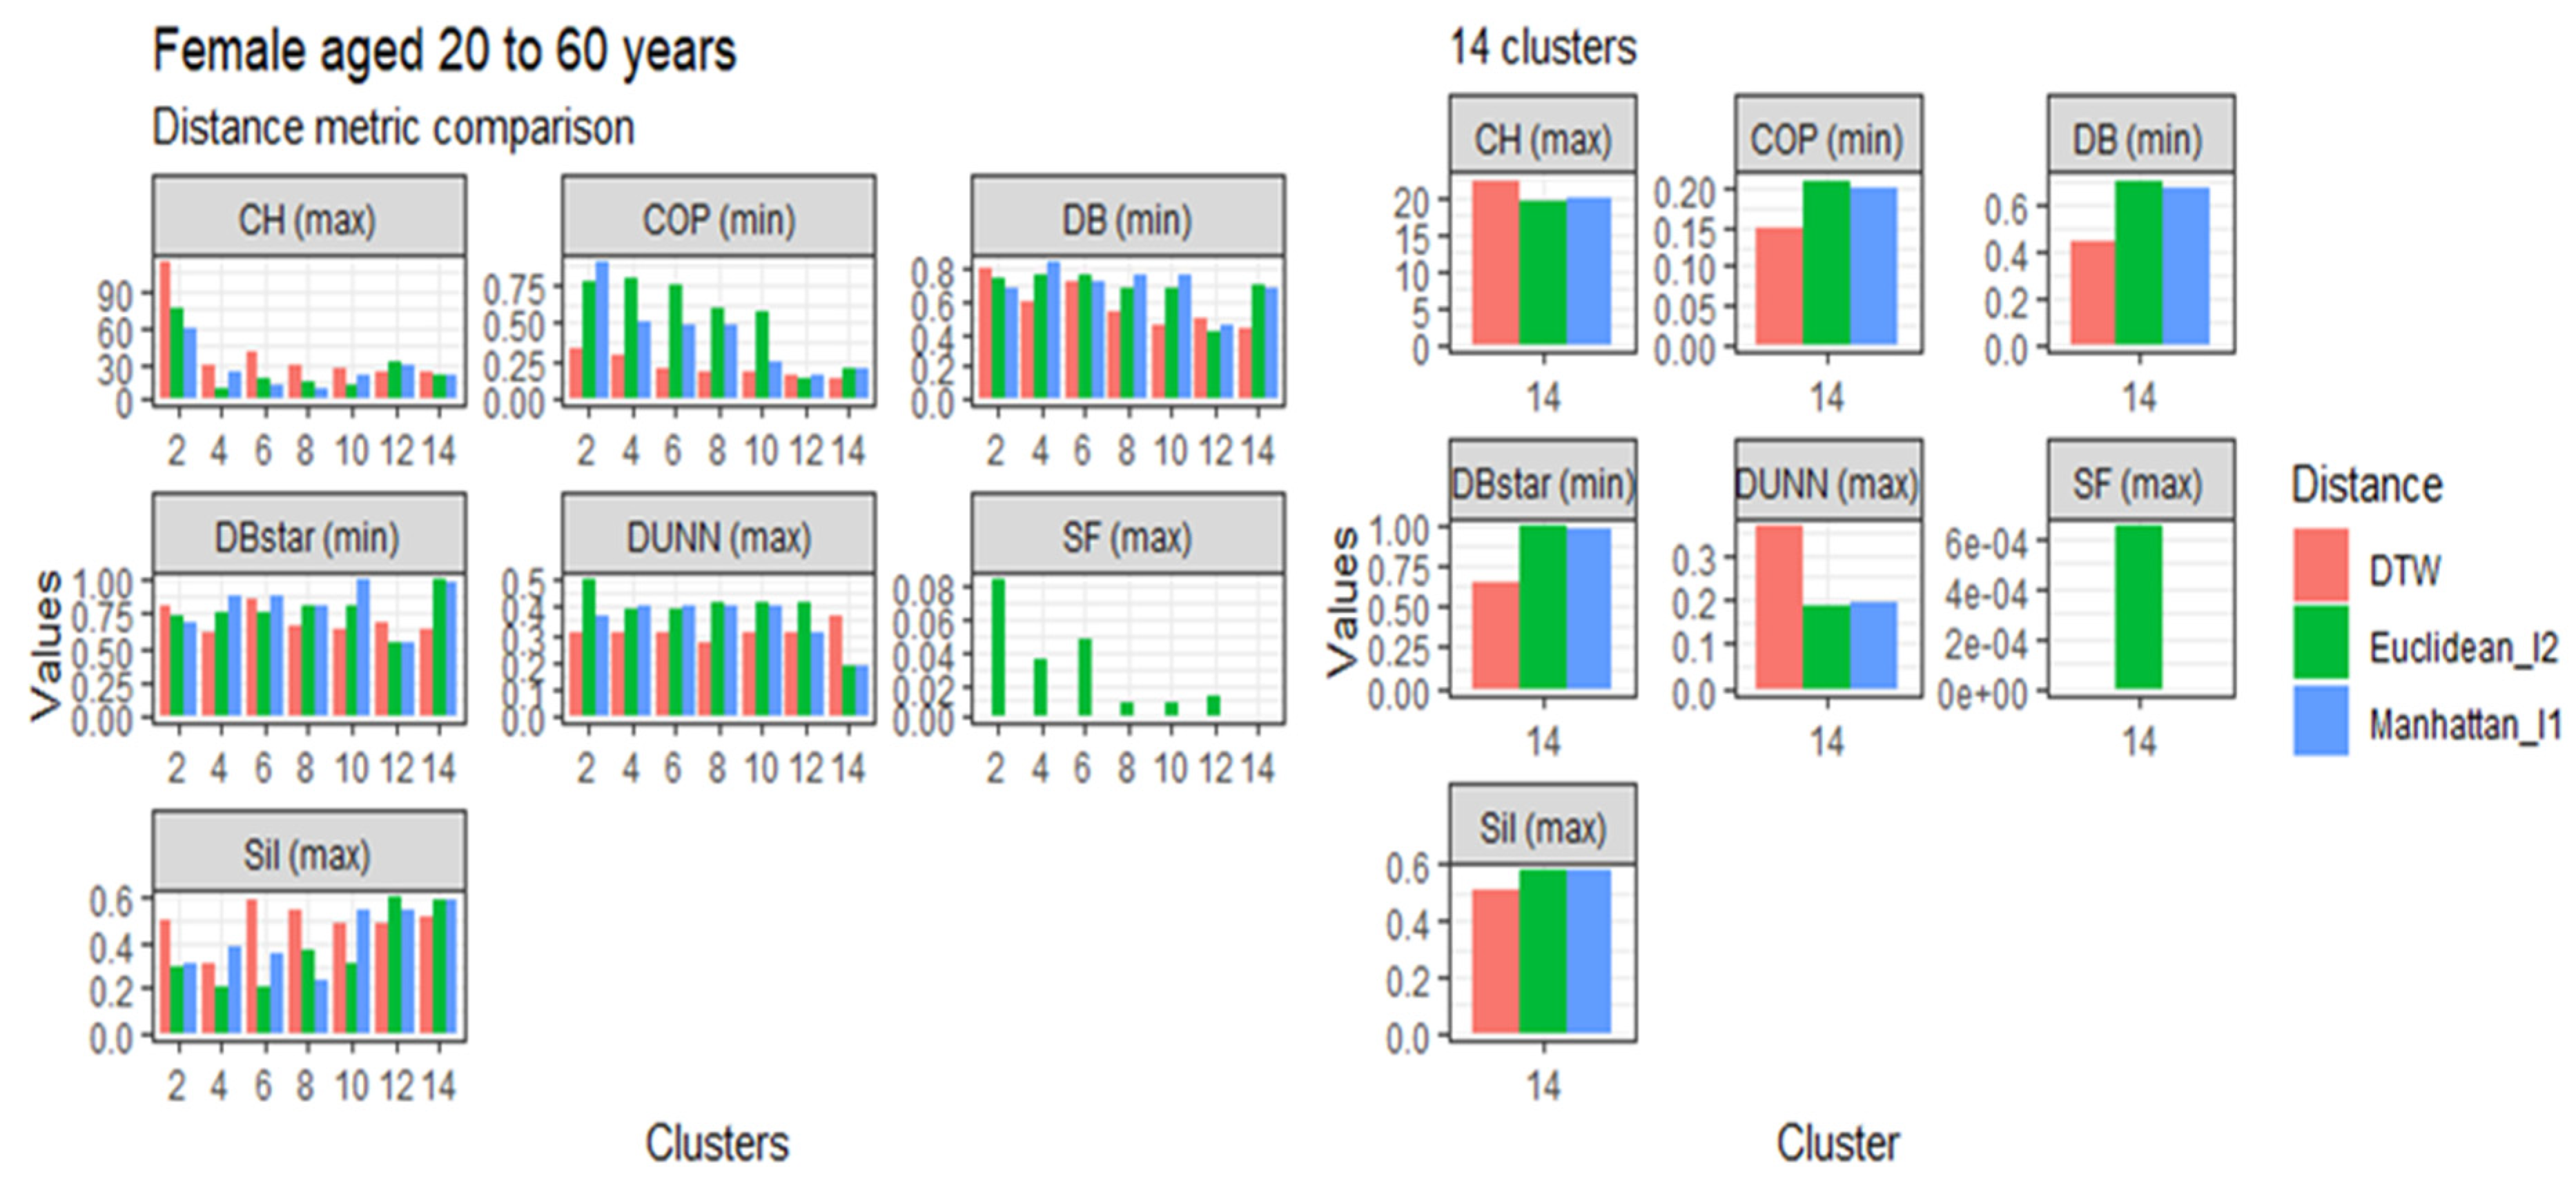
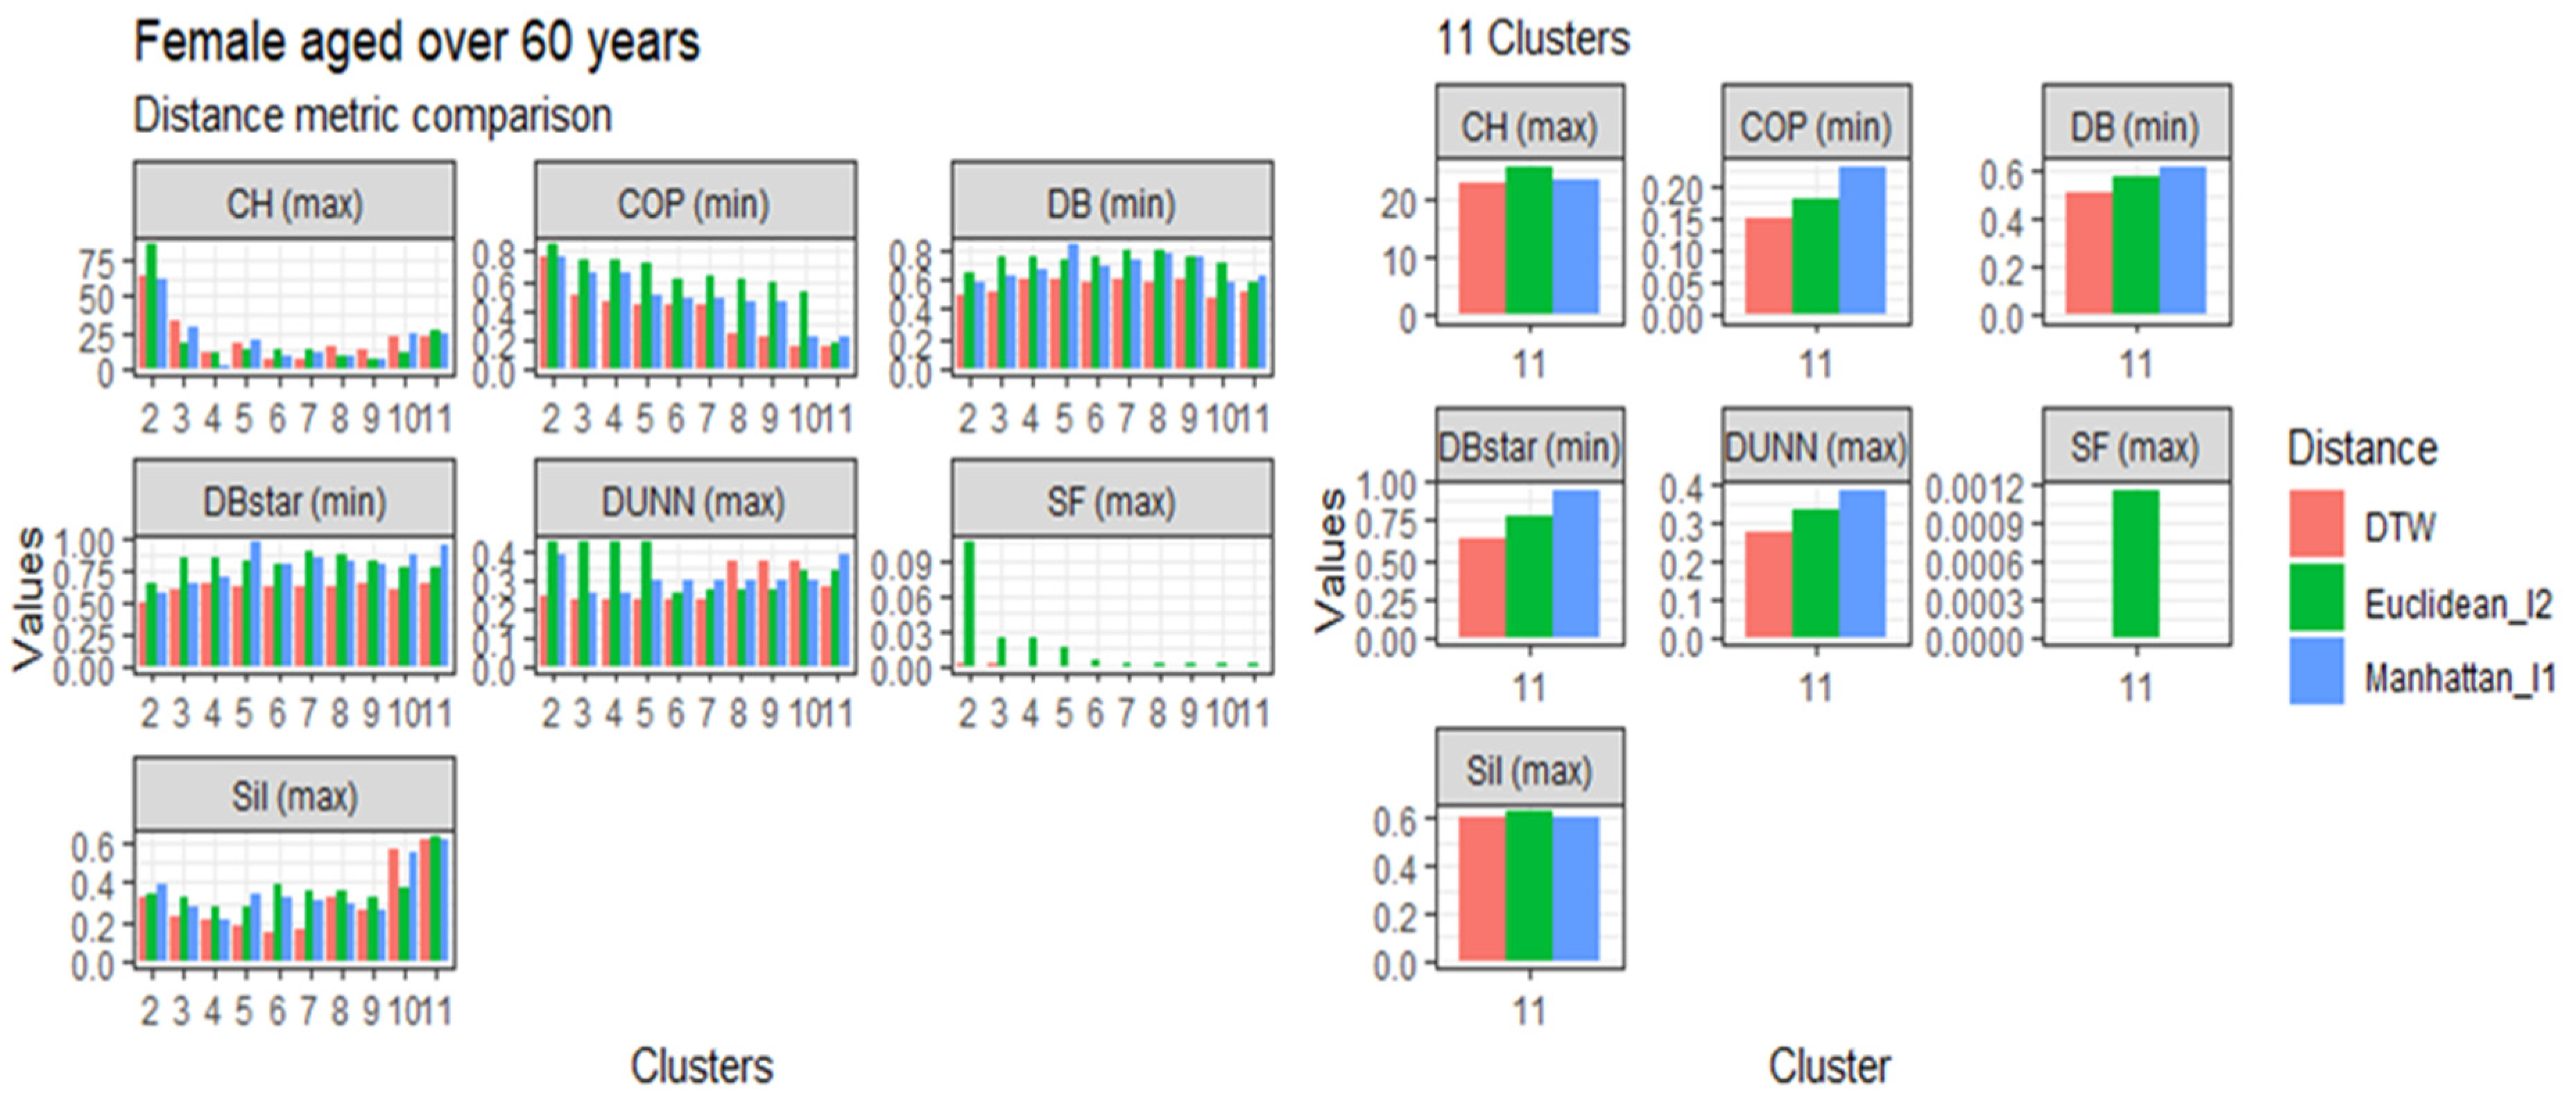
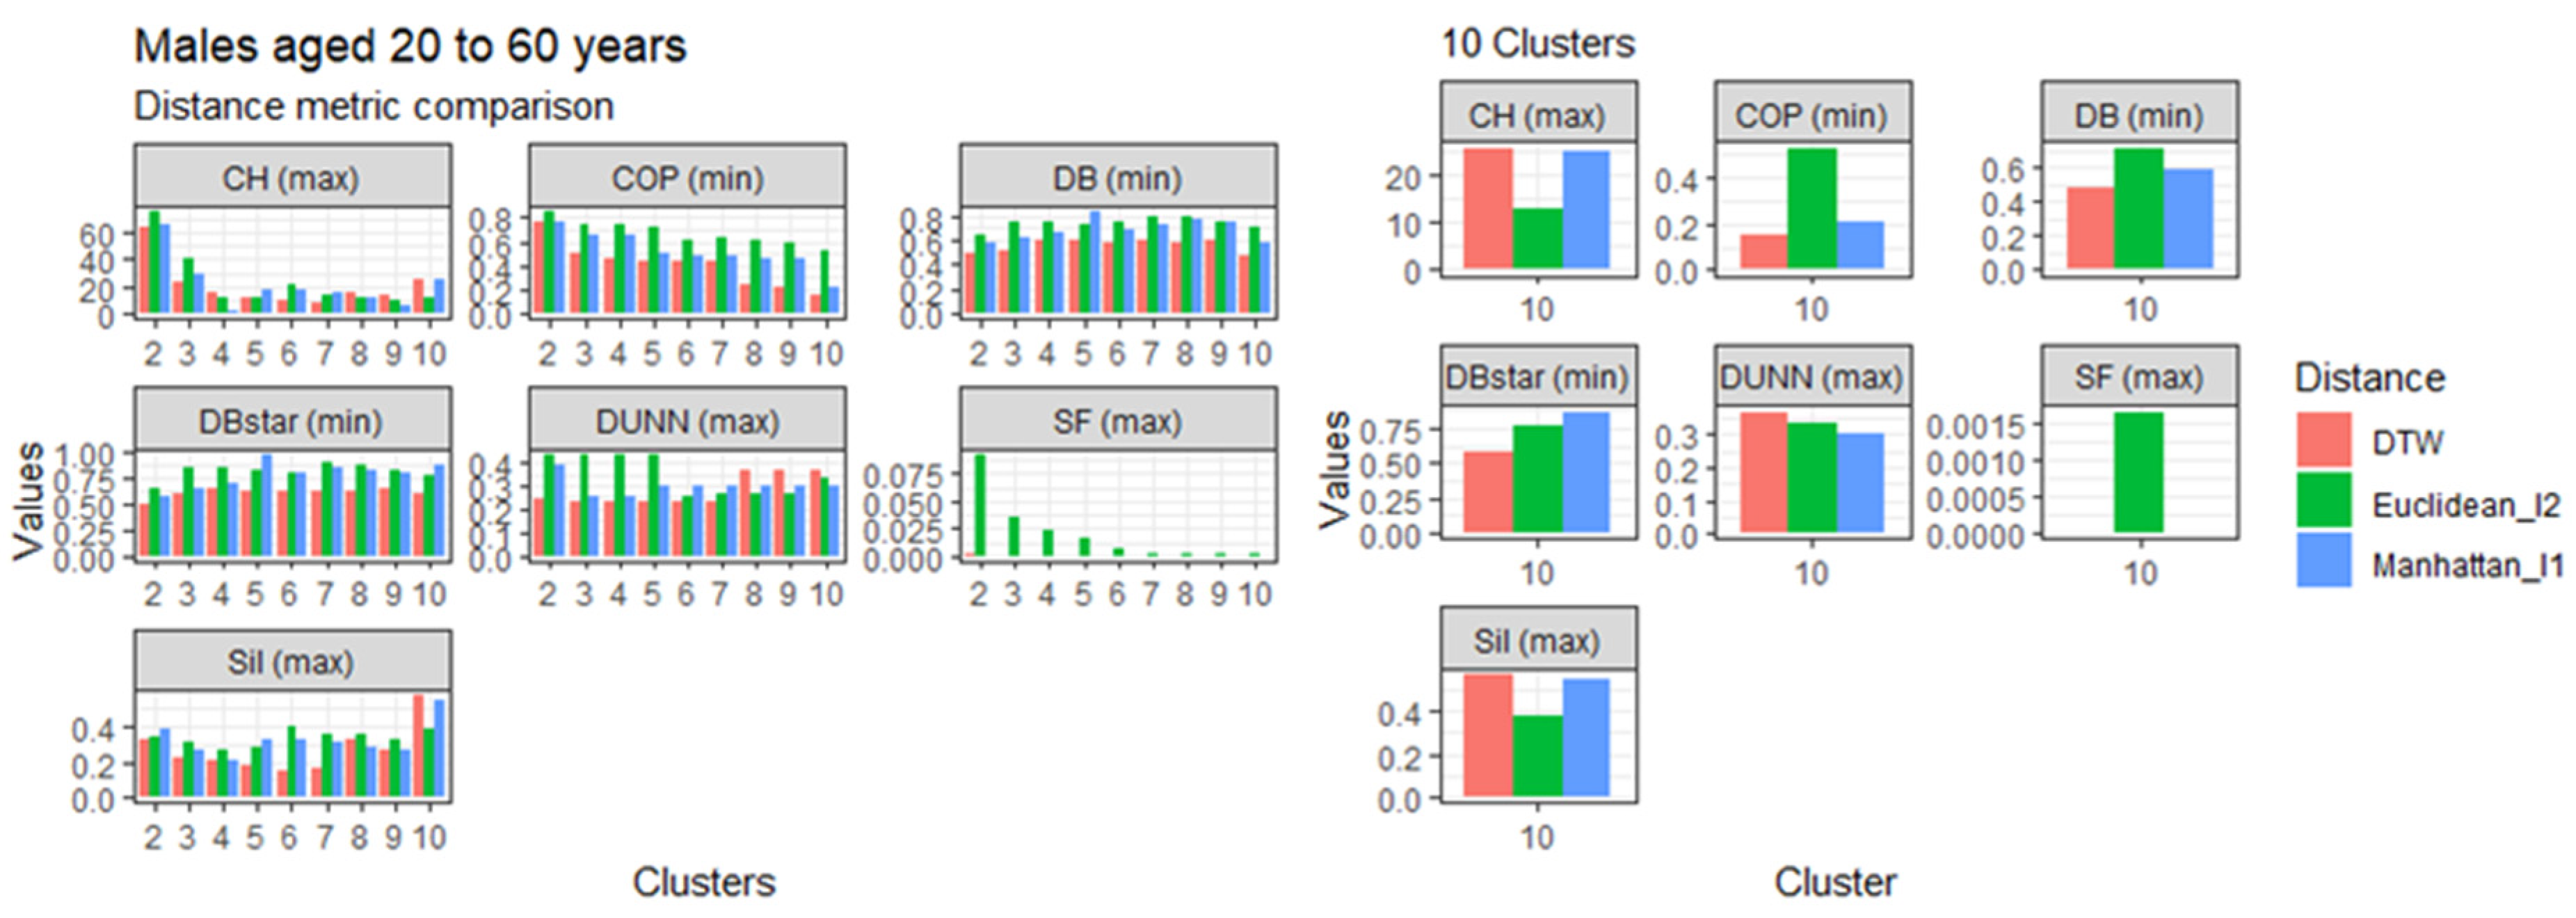
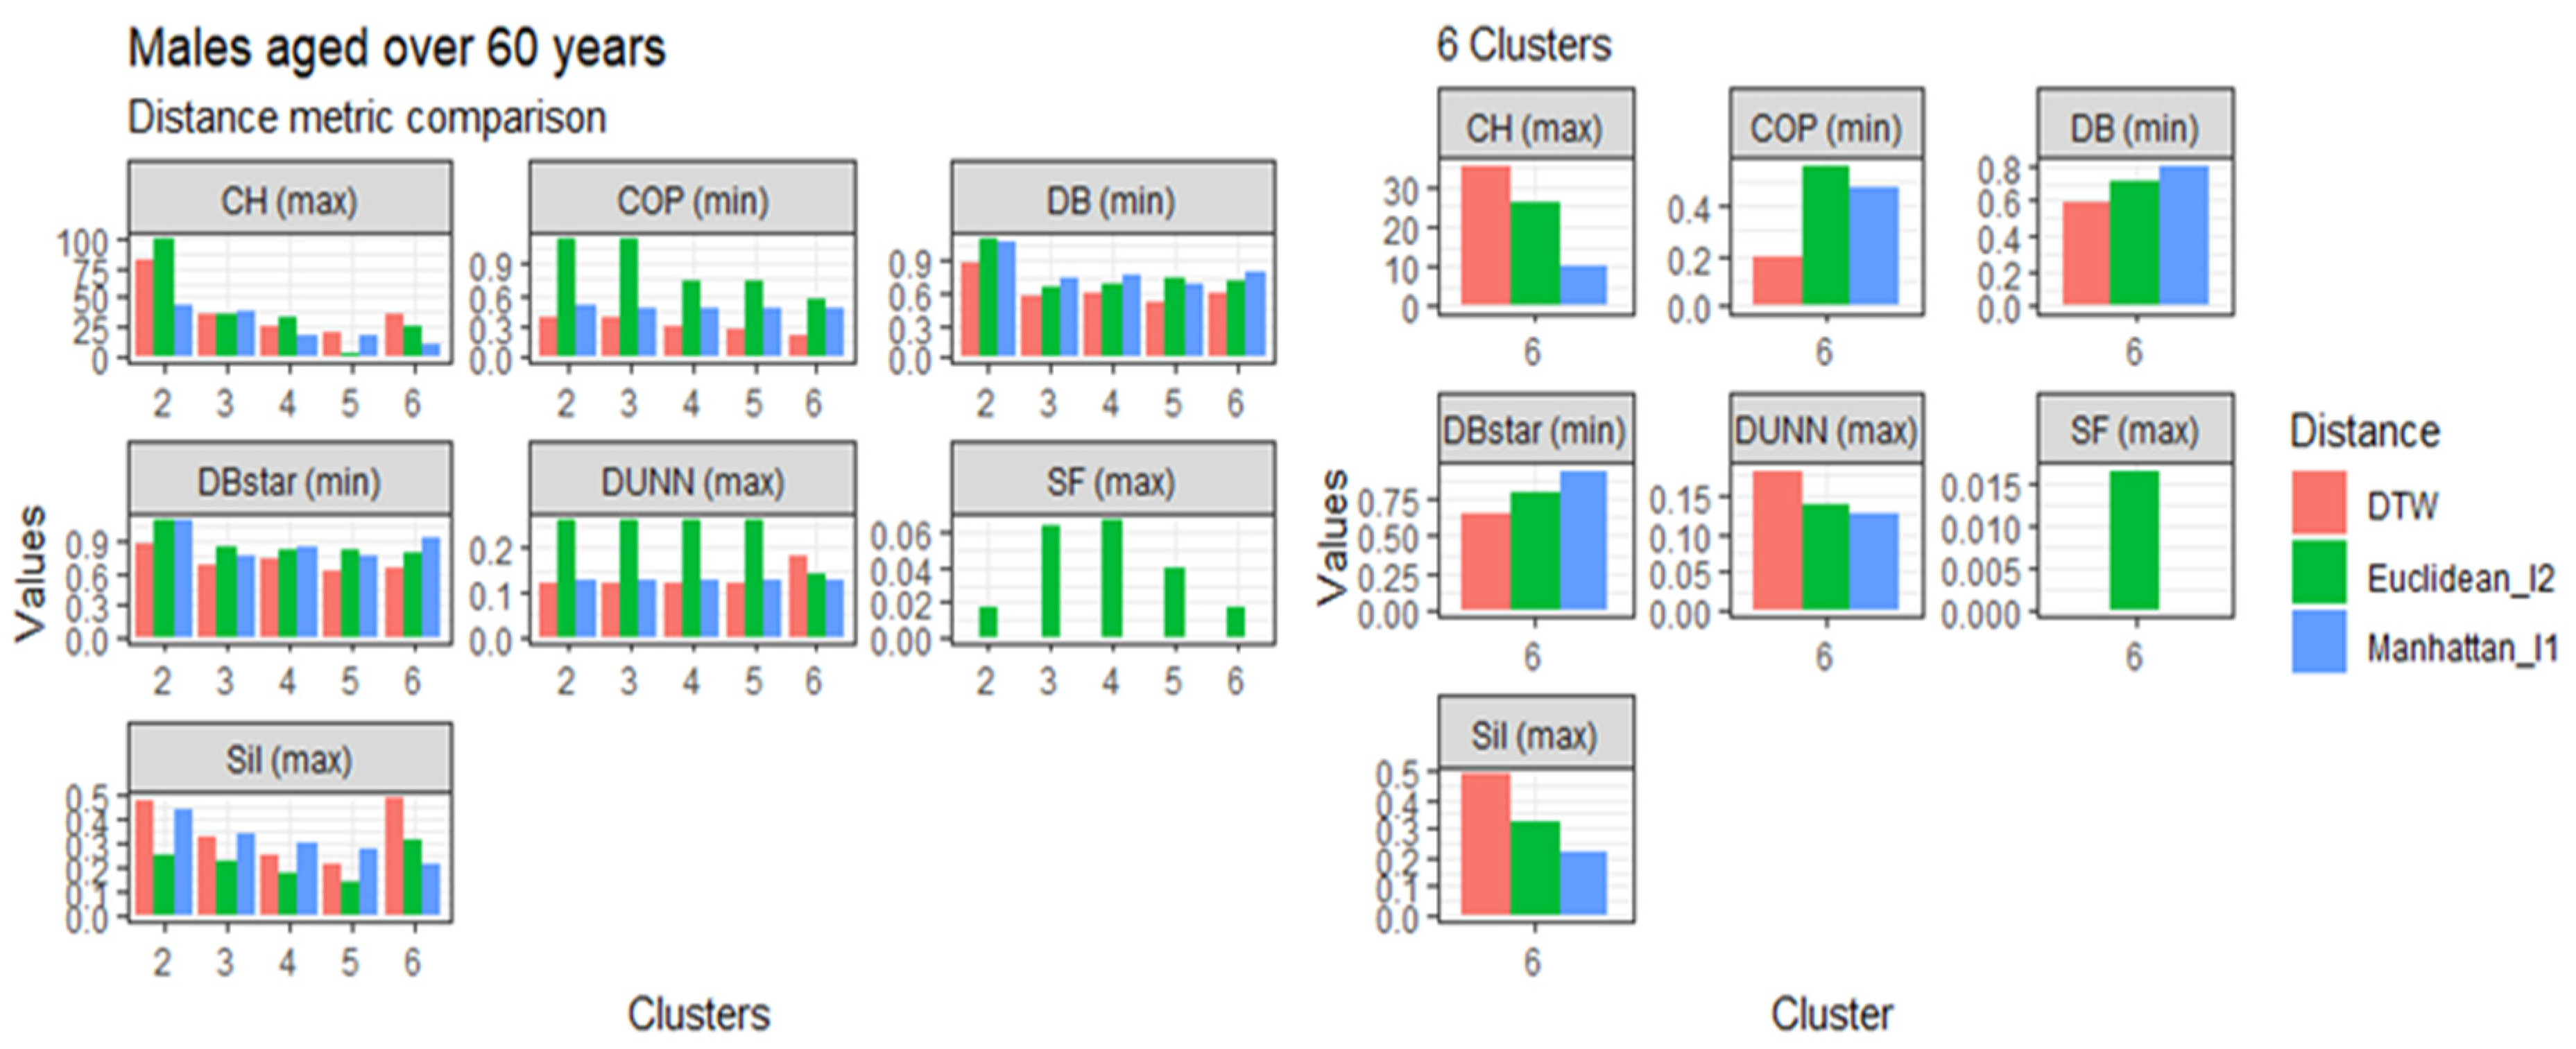
3.4. Comparison of the Dynamic Time Warping—DBA with the Euclidean (l1 Norm) and the Manhattan (l2 Norm) Distance Metrics
This section presents the results of the proposed modified DTW approach in comparison to the Euclidean (l1 norm) and the Manhattan (l2 norm) distance metrics, referred to in Table 1, based on age, gender, and clusters. The comparisons are represented in Figure 3, Figure 4, Figure 5 and Figure 6. Generally, the DTW has shown superior performance based on the seven validity indices outlined in Table 3. For males aged 20 to 60 and over 60 years, six out of the seven indices identified DTW as the best distance metric. Similarly, females aged 20 to 60 had five out of the seven supporting the DTW. However, DTW and the Euclidean distance jointly lead with three out of seven indices among females aged over 60, with Manhattan only scoring the best under the Dunn index. Despite the results among older females, these results suggest that the DTW distance metric is the best performing model and is suitable for detecting optimal clusters in temporal datasets. Studies of Bartkowiak et al. (2018) have confirmed that the performance accuracy of DTW measures on smaller datasets are better than the lock-step measures, which include both the Euclidean and Manhattan distance criteria because of the dilating alignments of the warping window with time. Furthermore, Cassisi et al. (2012) demonstrated that the Euclidean distance was limited because it could only compare observations with similar lengths, unlike DTW, which could incorporate varying series lengths. DTW overcomes the one to one comparison by achieving the many to one comparisons. It shows that the DTW accepts various alignments of the series datasets because it is less sensitive to non-uniform amplitude scaling and captures structural distortions among non-linear datasets.
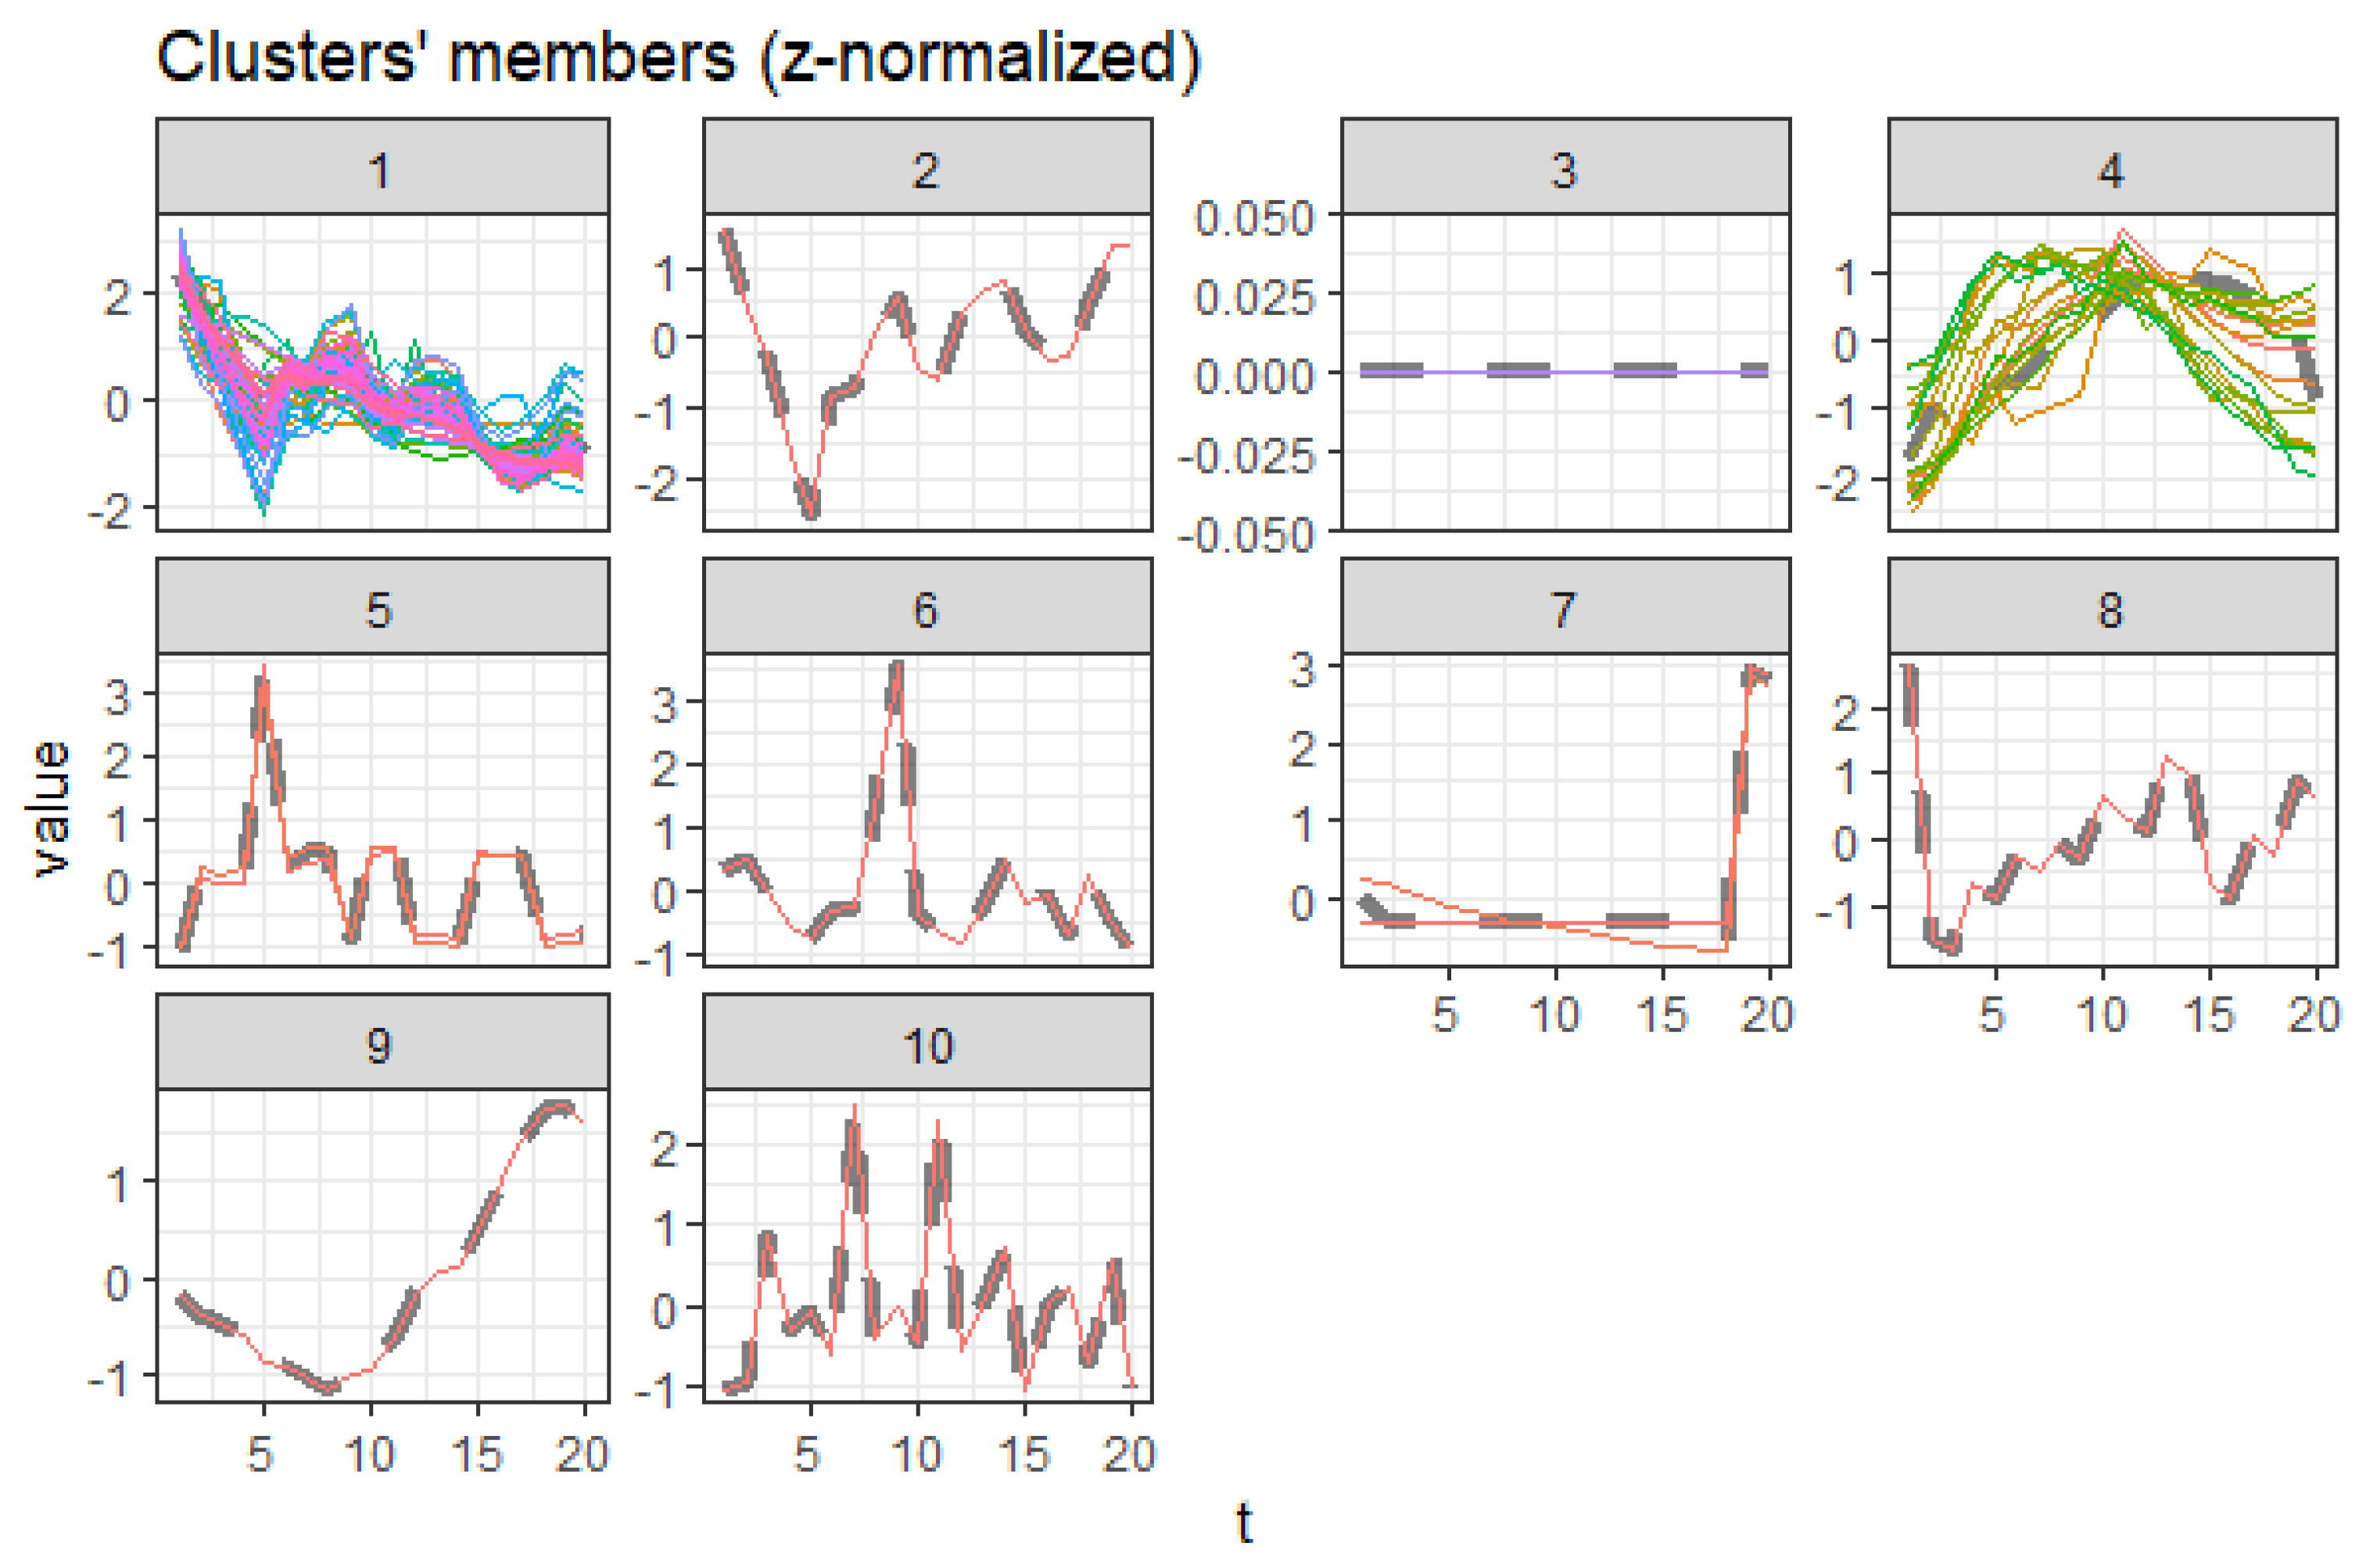
3.5. Centroid Cluster Extraction Results
The centroid extractions and the comparative column charts were also obtained for each age, gender, time, and cause and visually inspected. In general, the causes detected in these clusters have shown trending structures based on co-movement that exist among causes: trending upwards (increasing), trending downwards (declining), outliers, and insignificant ones. For the complete cluster member list see Table A2, Table A3, Table A4 and Table A5.
3.5.1. Females Aged 20 to 60
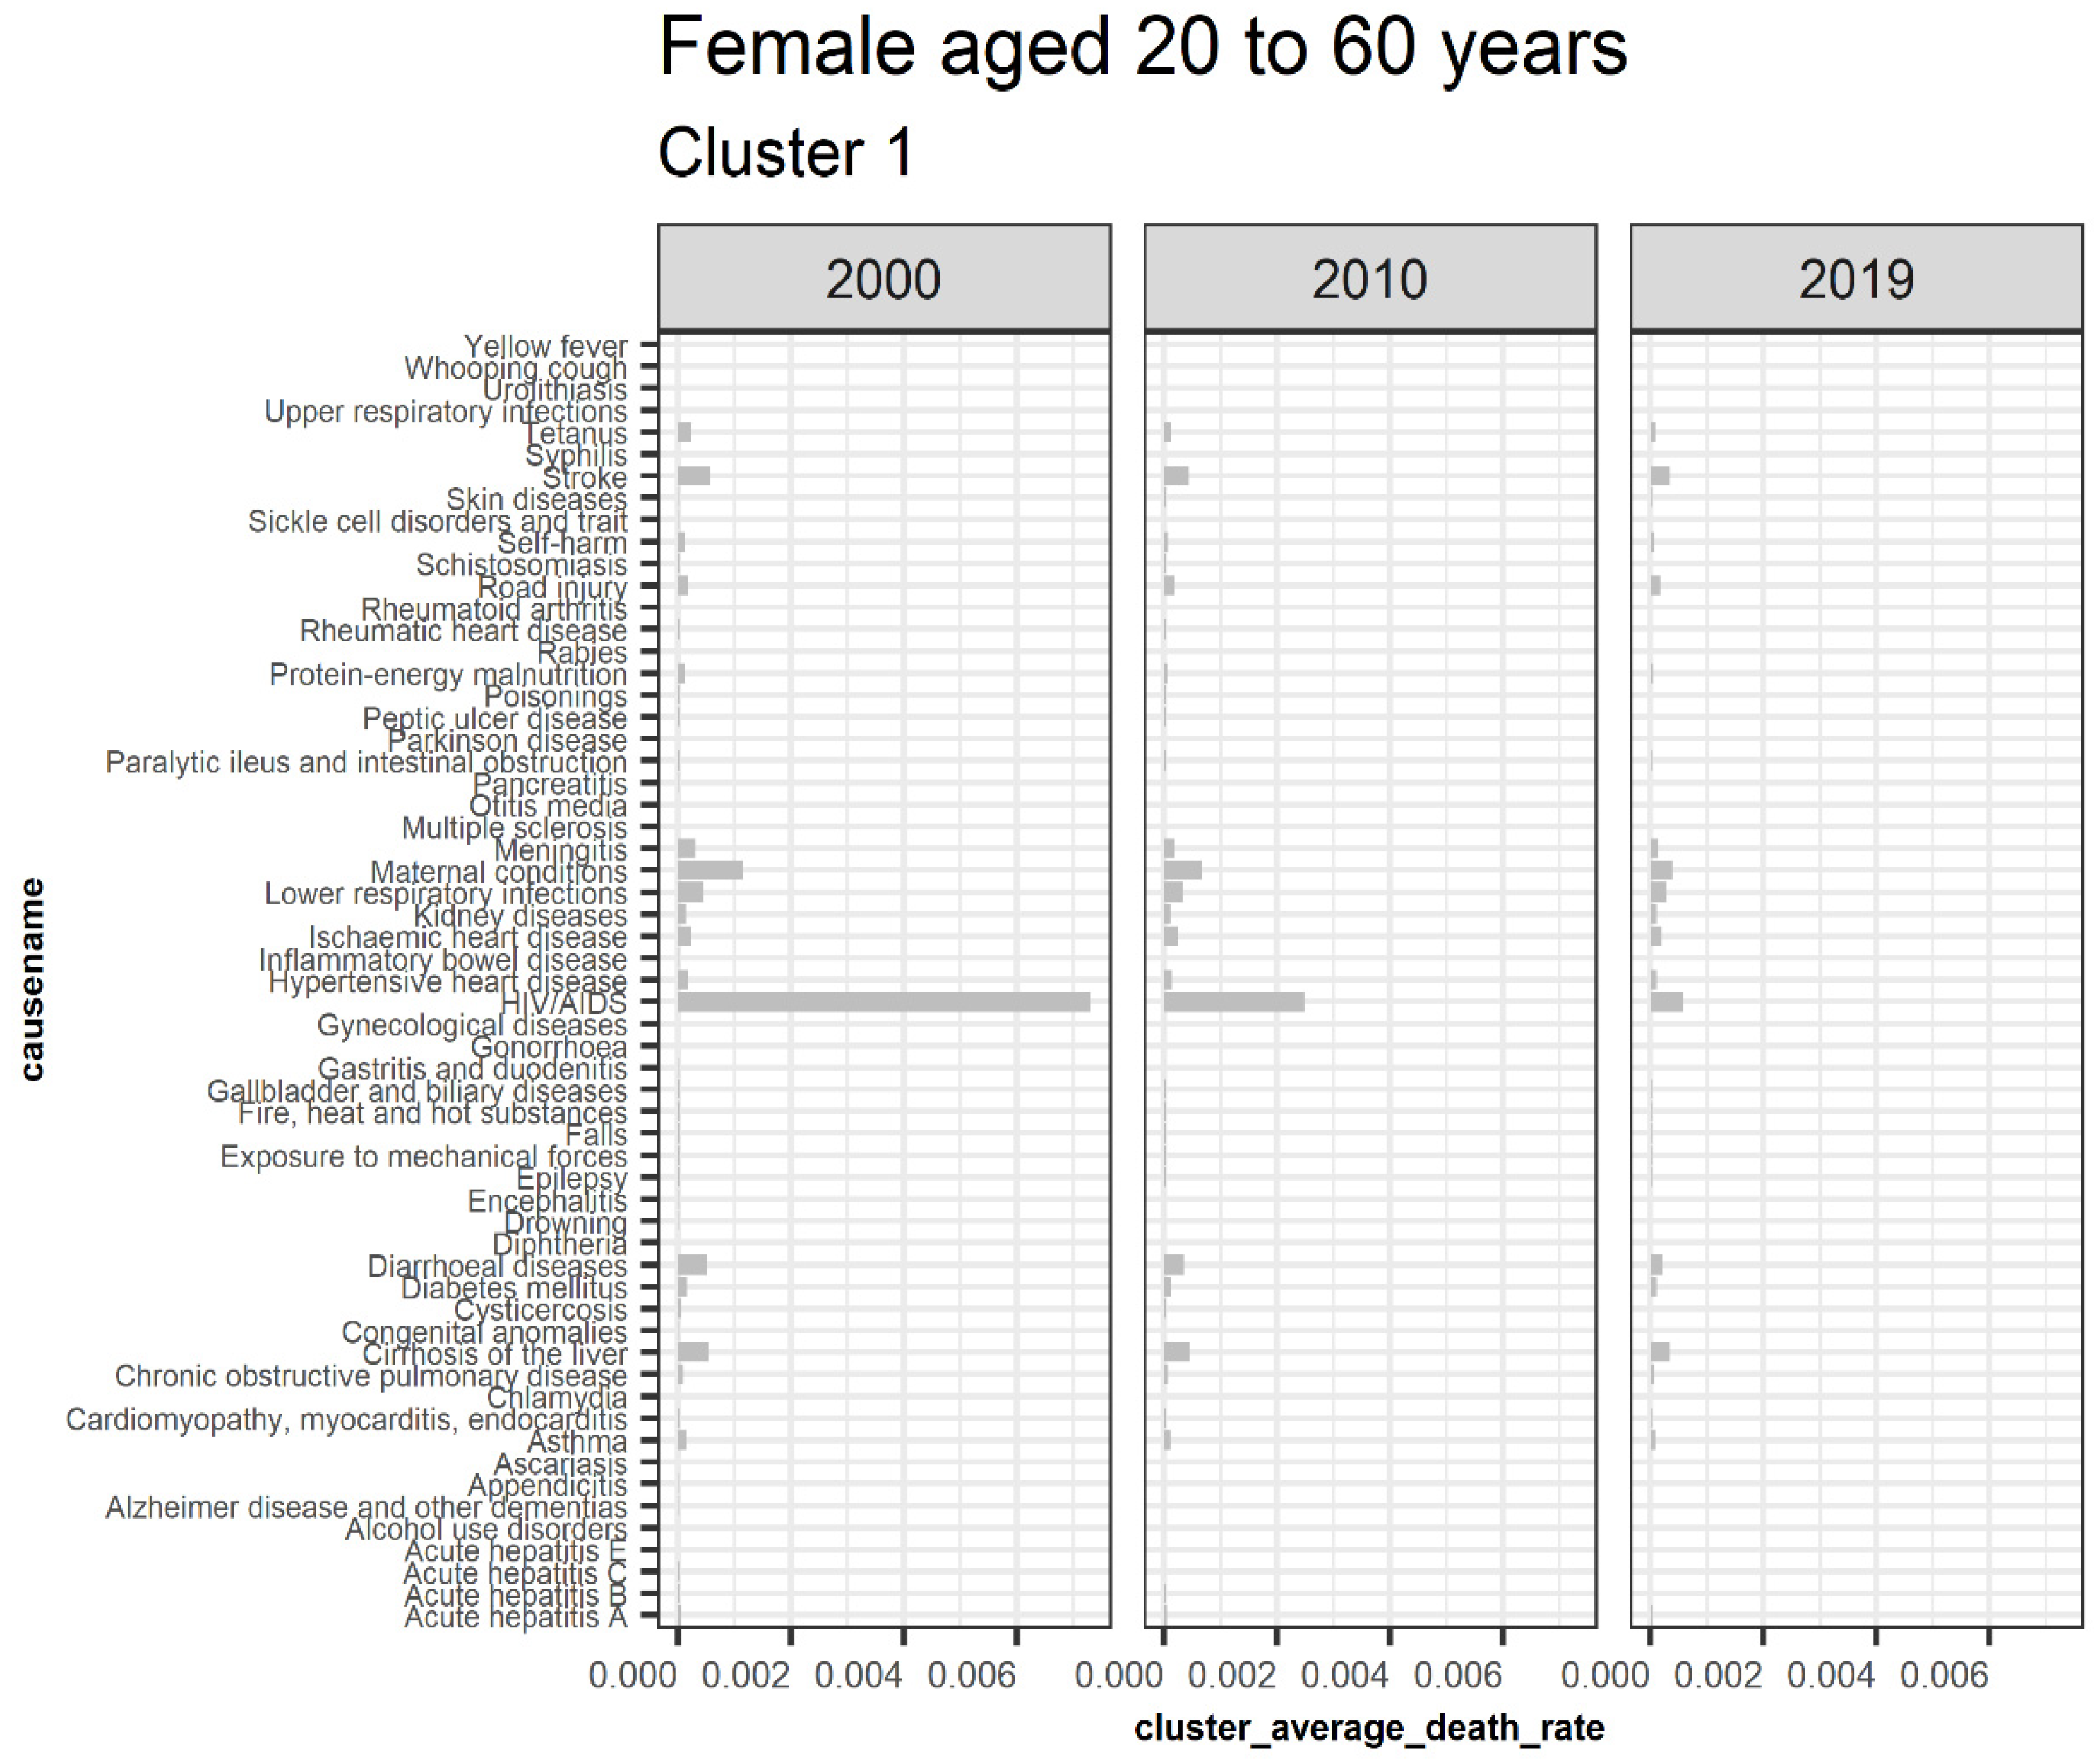
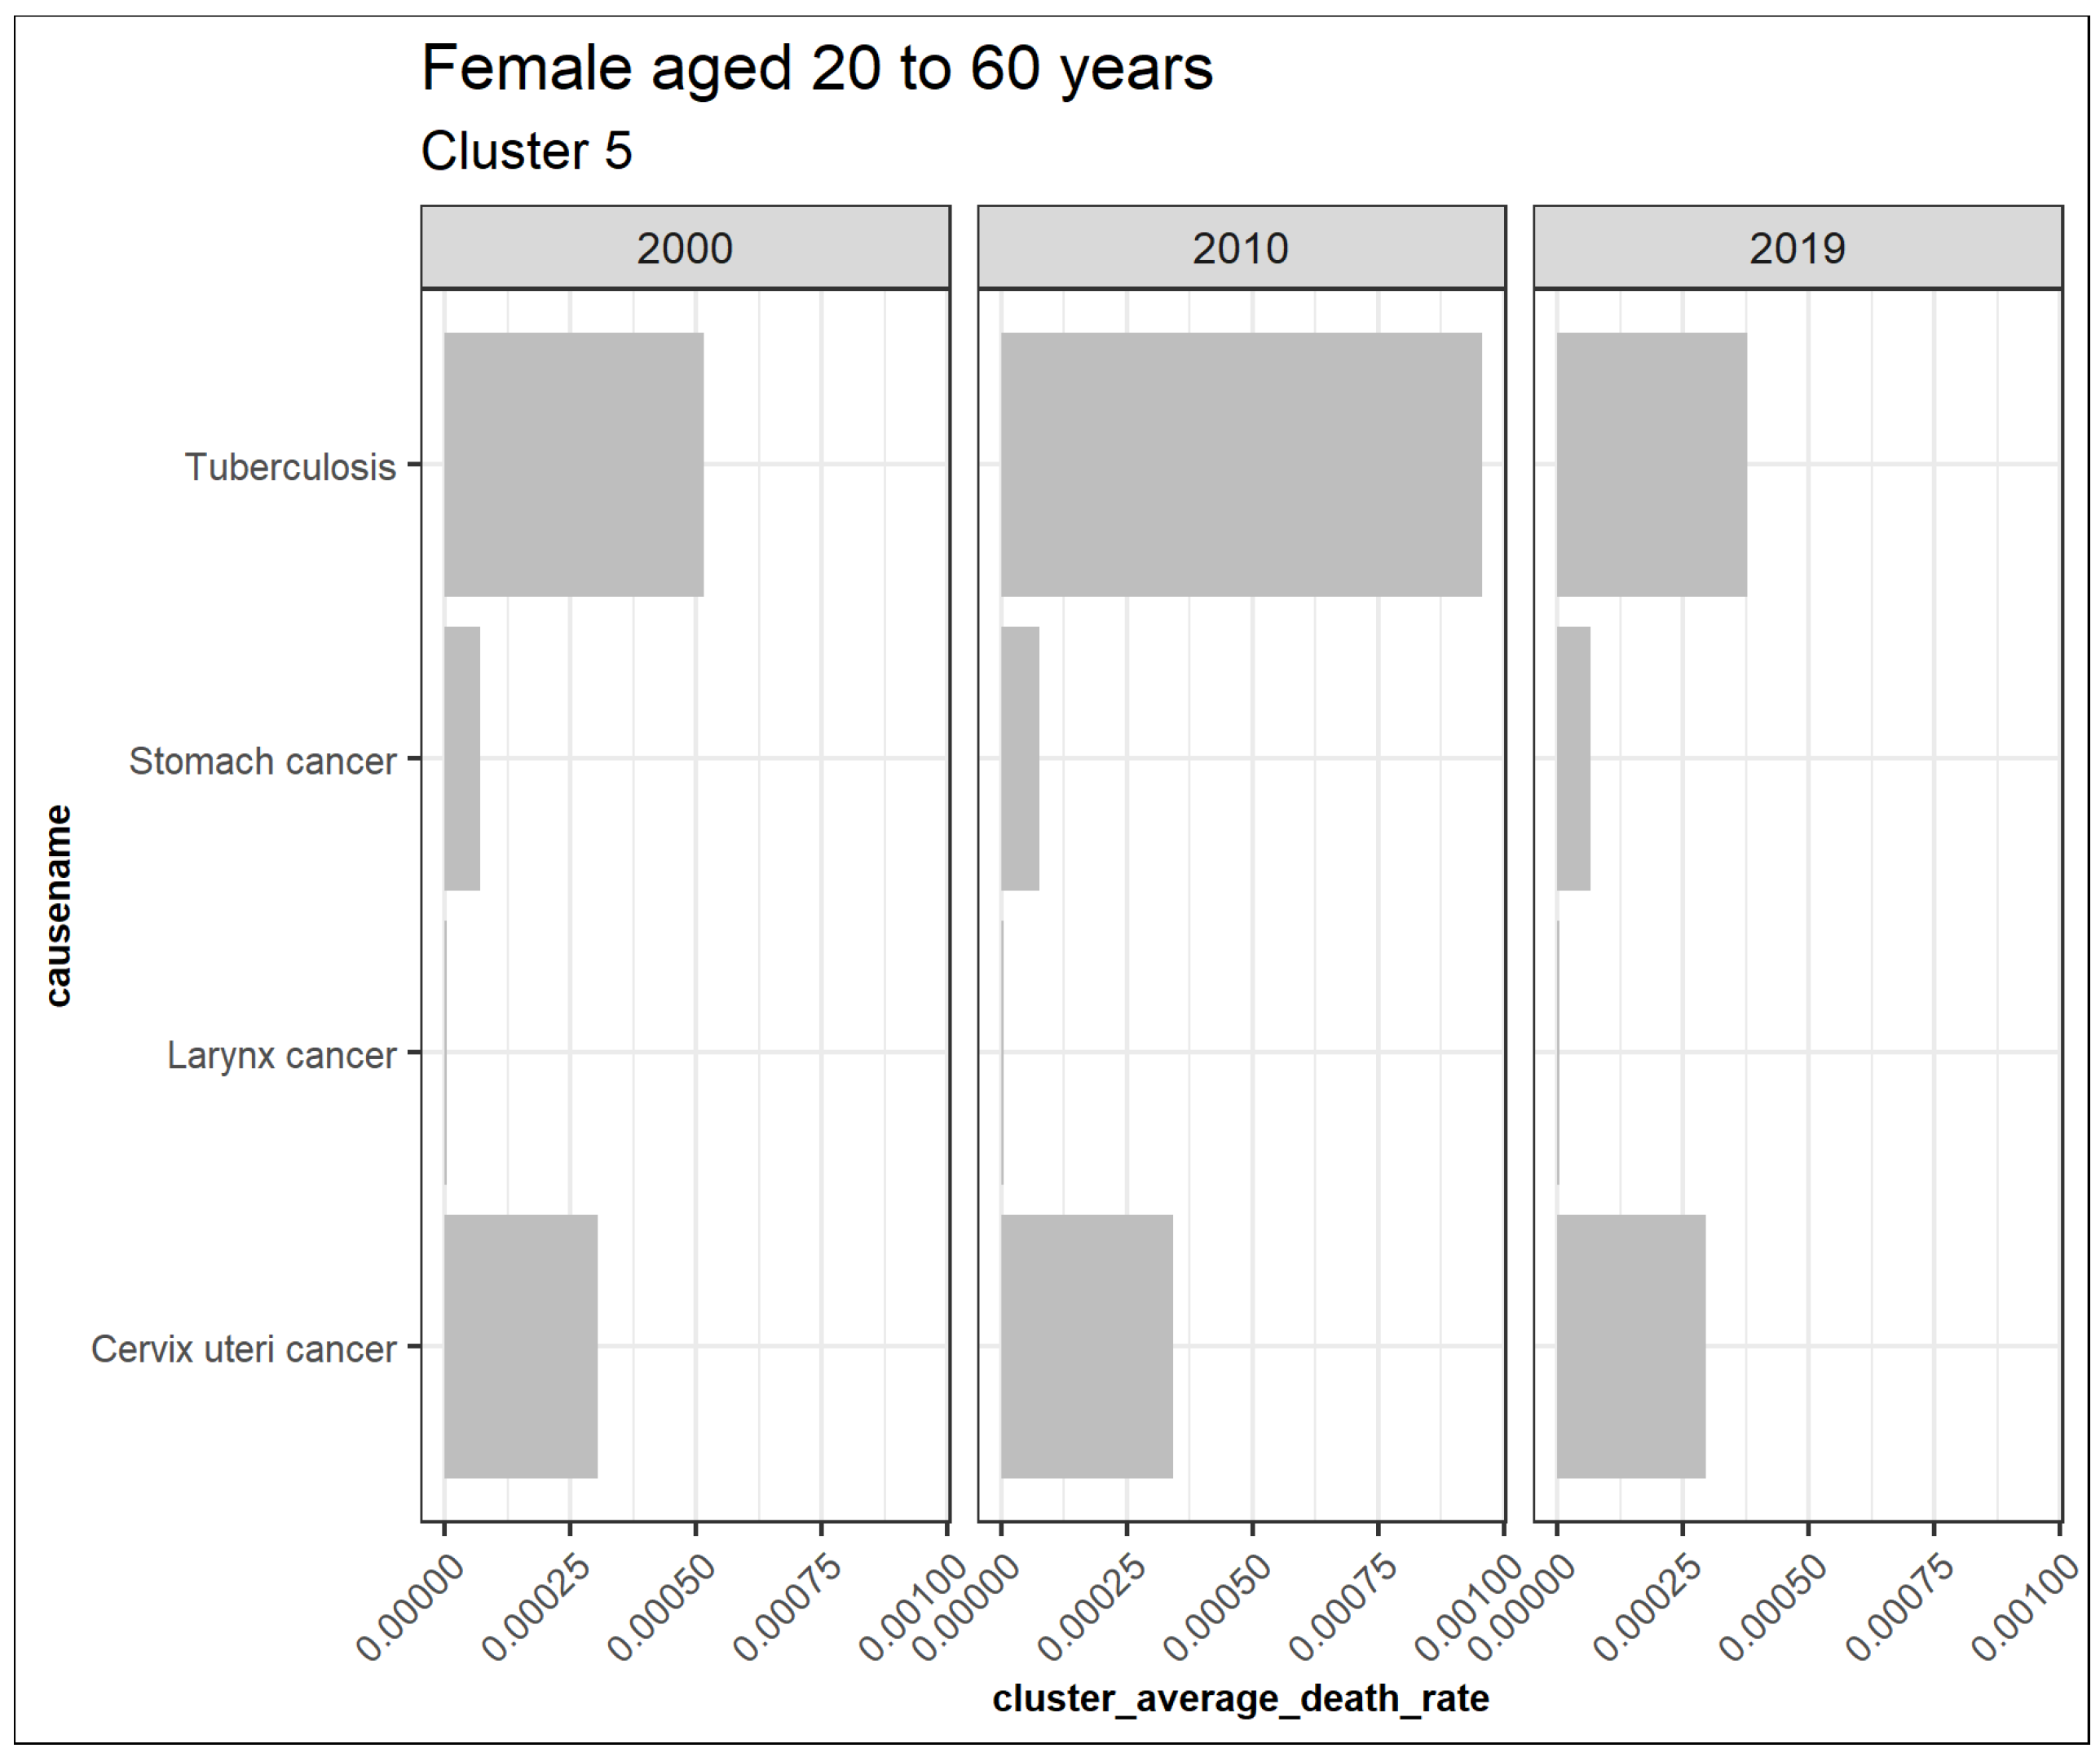
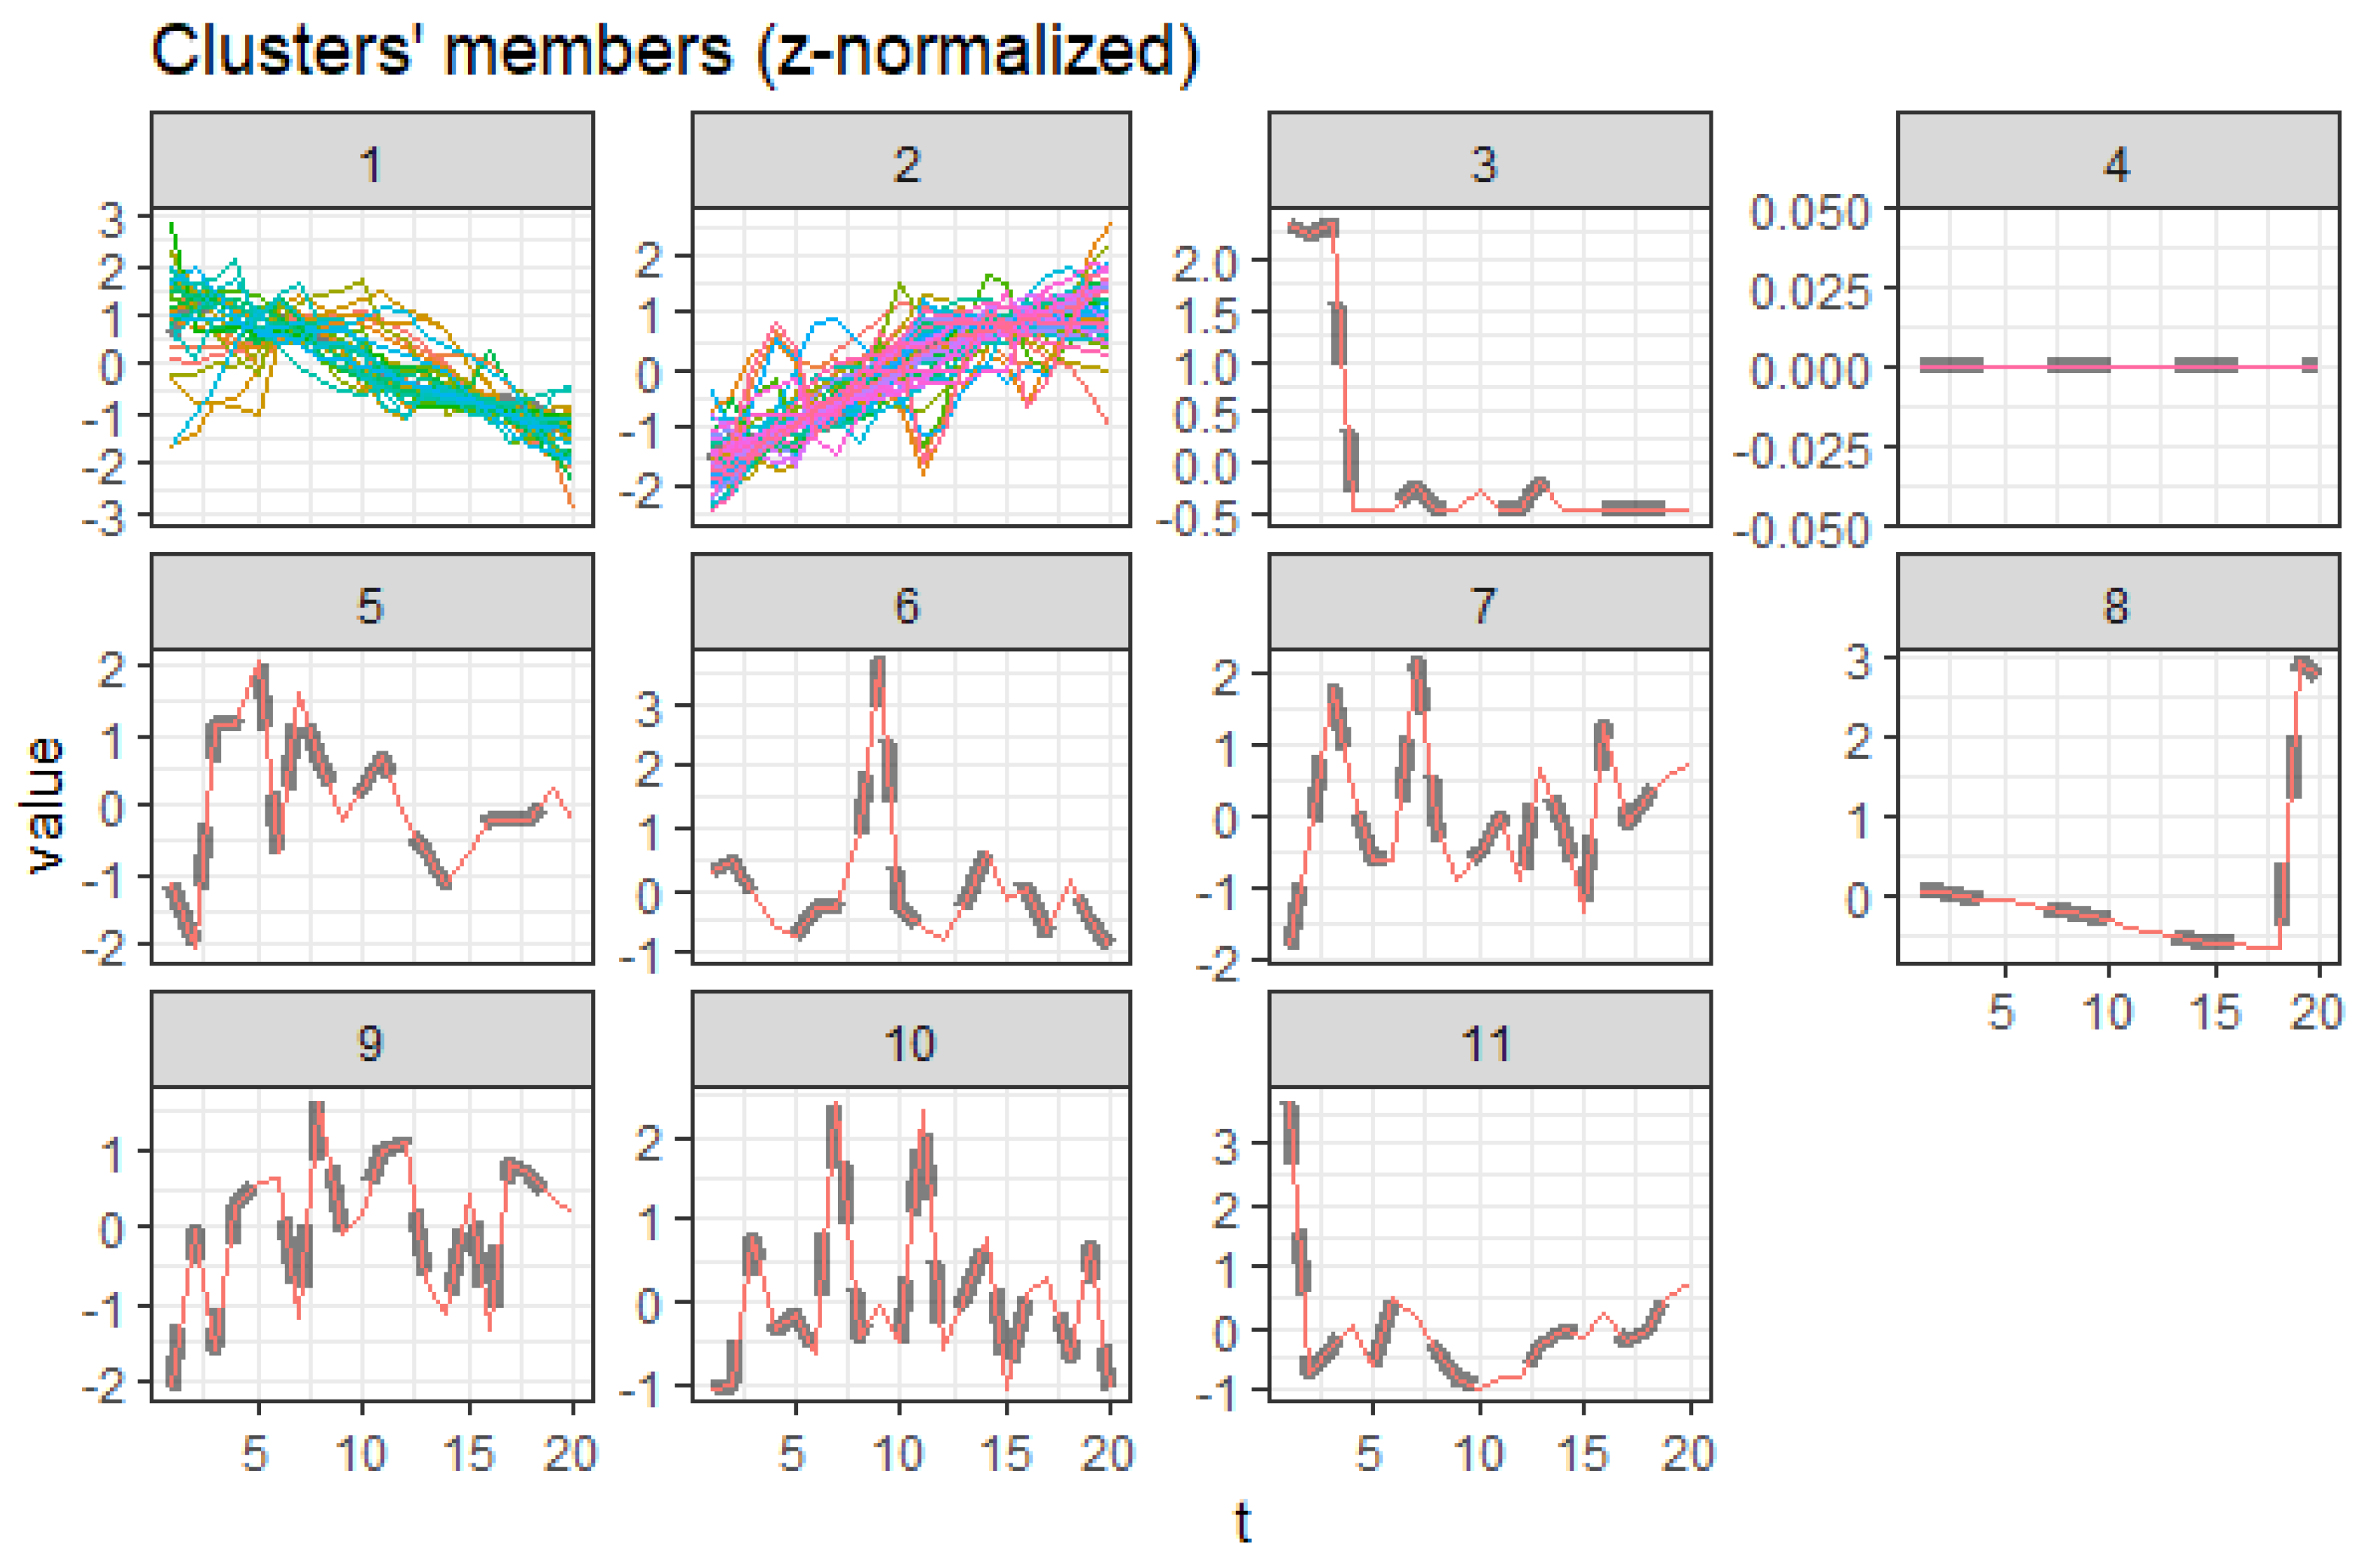
Figure 7 illustrates extracted clusters in younger females. Cluster 4 represents upward trending causes, while clusters 1 and 5 are declining. Cluster 2, 5, 6, 7, 8, 9, 10, 11, 12, 13, and 14 are outliers. Cluster 3 represents the insignificant causes. Figure 8 displays the average death rates of the causes of death in cluster 1 among females aged 20 to 60 years partitioned in 2000, 2010, and 2019. The average death rates are generally declining over time. HIV/AIDS is shown to experience the most significant reduction in causing deaths compared to other causes. Maternal conditions, tetanus, stroke, meningitis, lower respiratory infections, diarrheal diseases, and cirrhosis of the liver are also shown to be fairly significant.
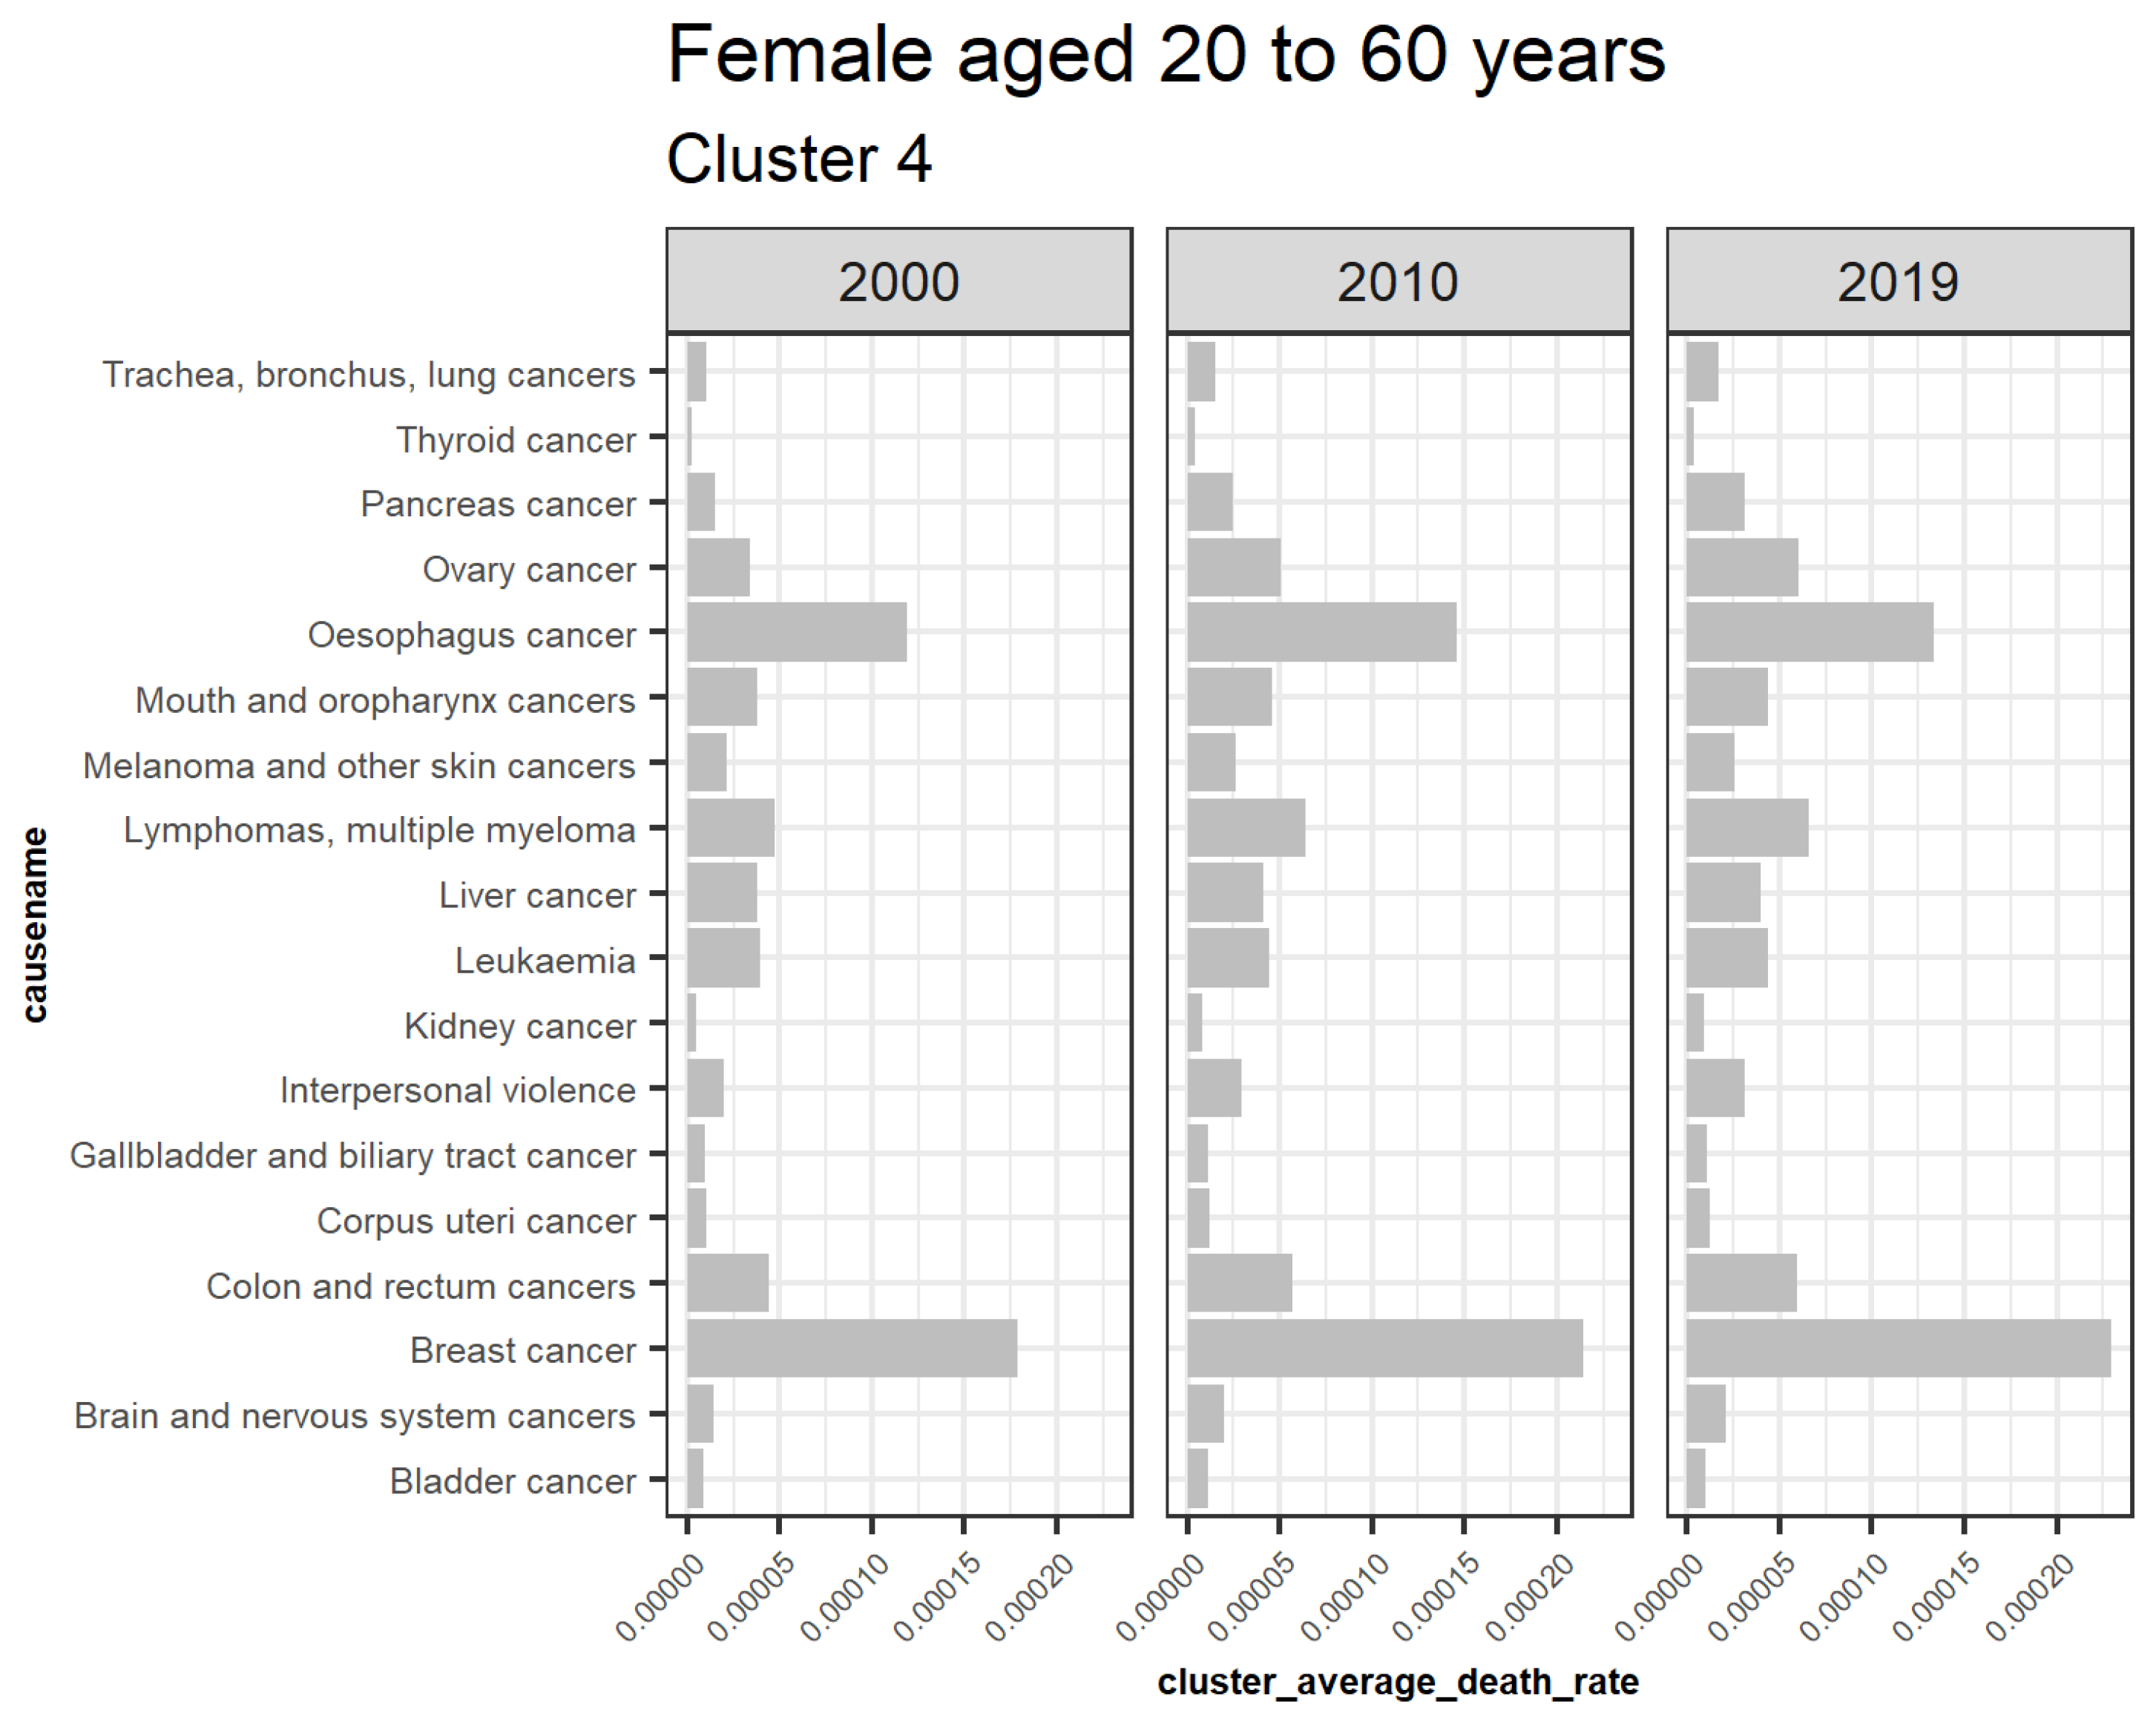
This result demonstrates that HIV/AIDS is a declining trend among females aged 20 to 60 years, as shown in cluster 1. Detection of the other declining causes of death that form cluster 1 in females 20 to 60 are also achieved and can be quantified based on their decreasing rates in the short run. Figure 9 also represents the declining trend of the average death rates of the causes in cluster 5 among females aged 20 to 60 years. Tuberculosis, cervix uteri cancer, stomach cancer, and larynx cancer have experienced a general decline despite a trend break scenario, meaning that their trends did not consistently reduce from the year 2000 to 2019, as shown. This result explains one of the shortcomings of using this approach in monitoring one-directional trends. Figure 10 represents the average death rates of the causes of death in cluster 4 among females aged 20 to 60 years partitioned in 2000, 2010, and 2019. Notably, all the increasing causes in this cluster are cancer. Breast and esophagus cancers have significantly increased, while thyroid cancer has the least. This result implies that cancers are increasingly the leading cause of death among females aged 20 to 60. Similar studies such as (Mahase 2019) suggest that cancer will be the most prevalent cause of death not only in high-income countries but also globally. Furthermore, Hamdi et al. (2021) have specifically identified esophagus cancer as the leading cancer cause of death in Kenya and its region, as confirmed by these results.
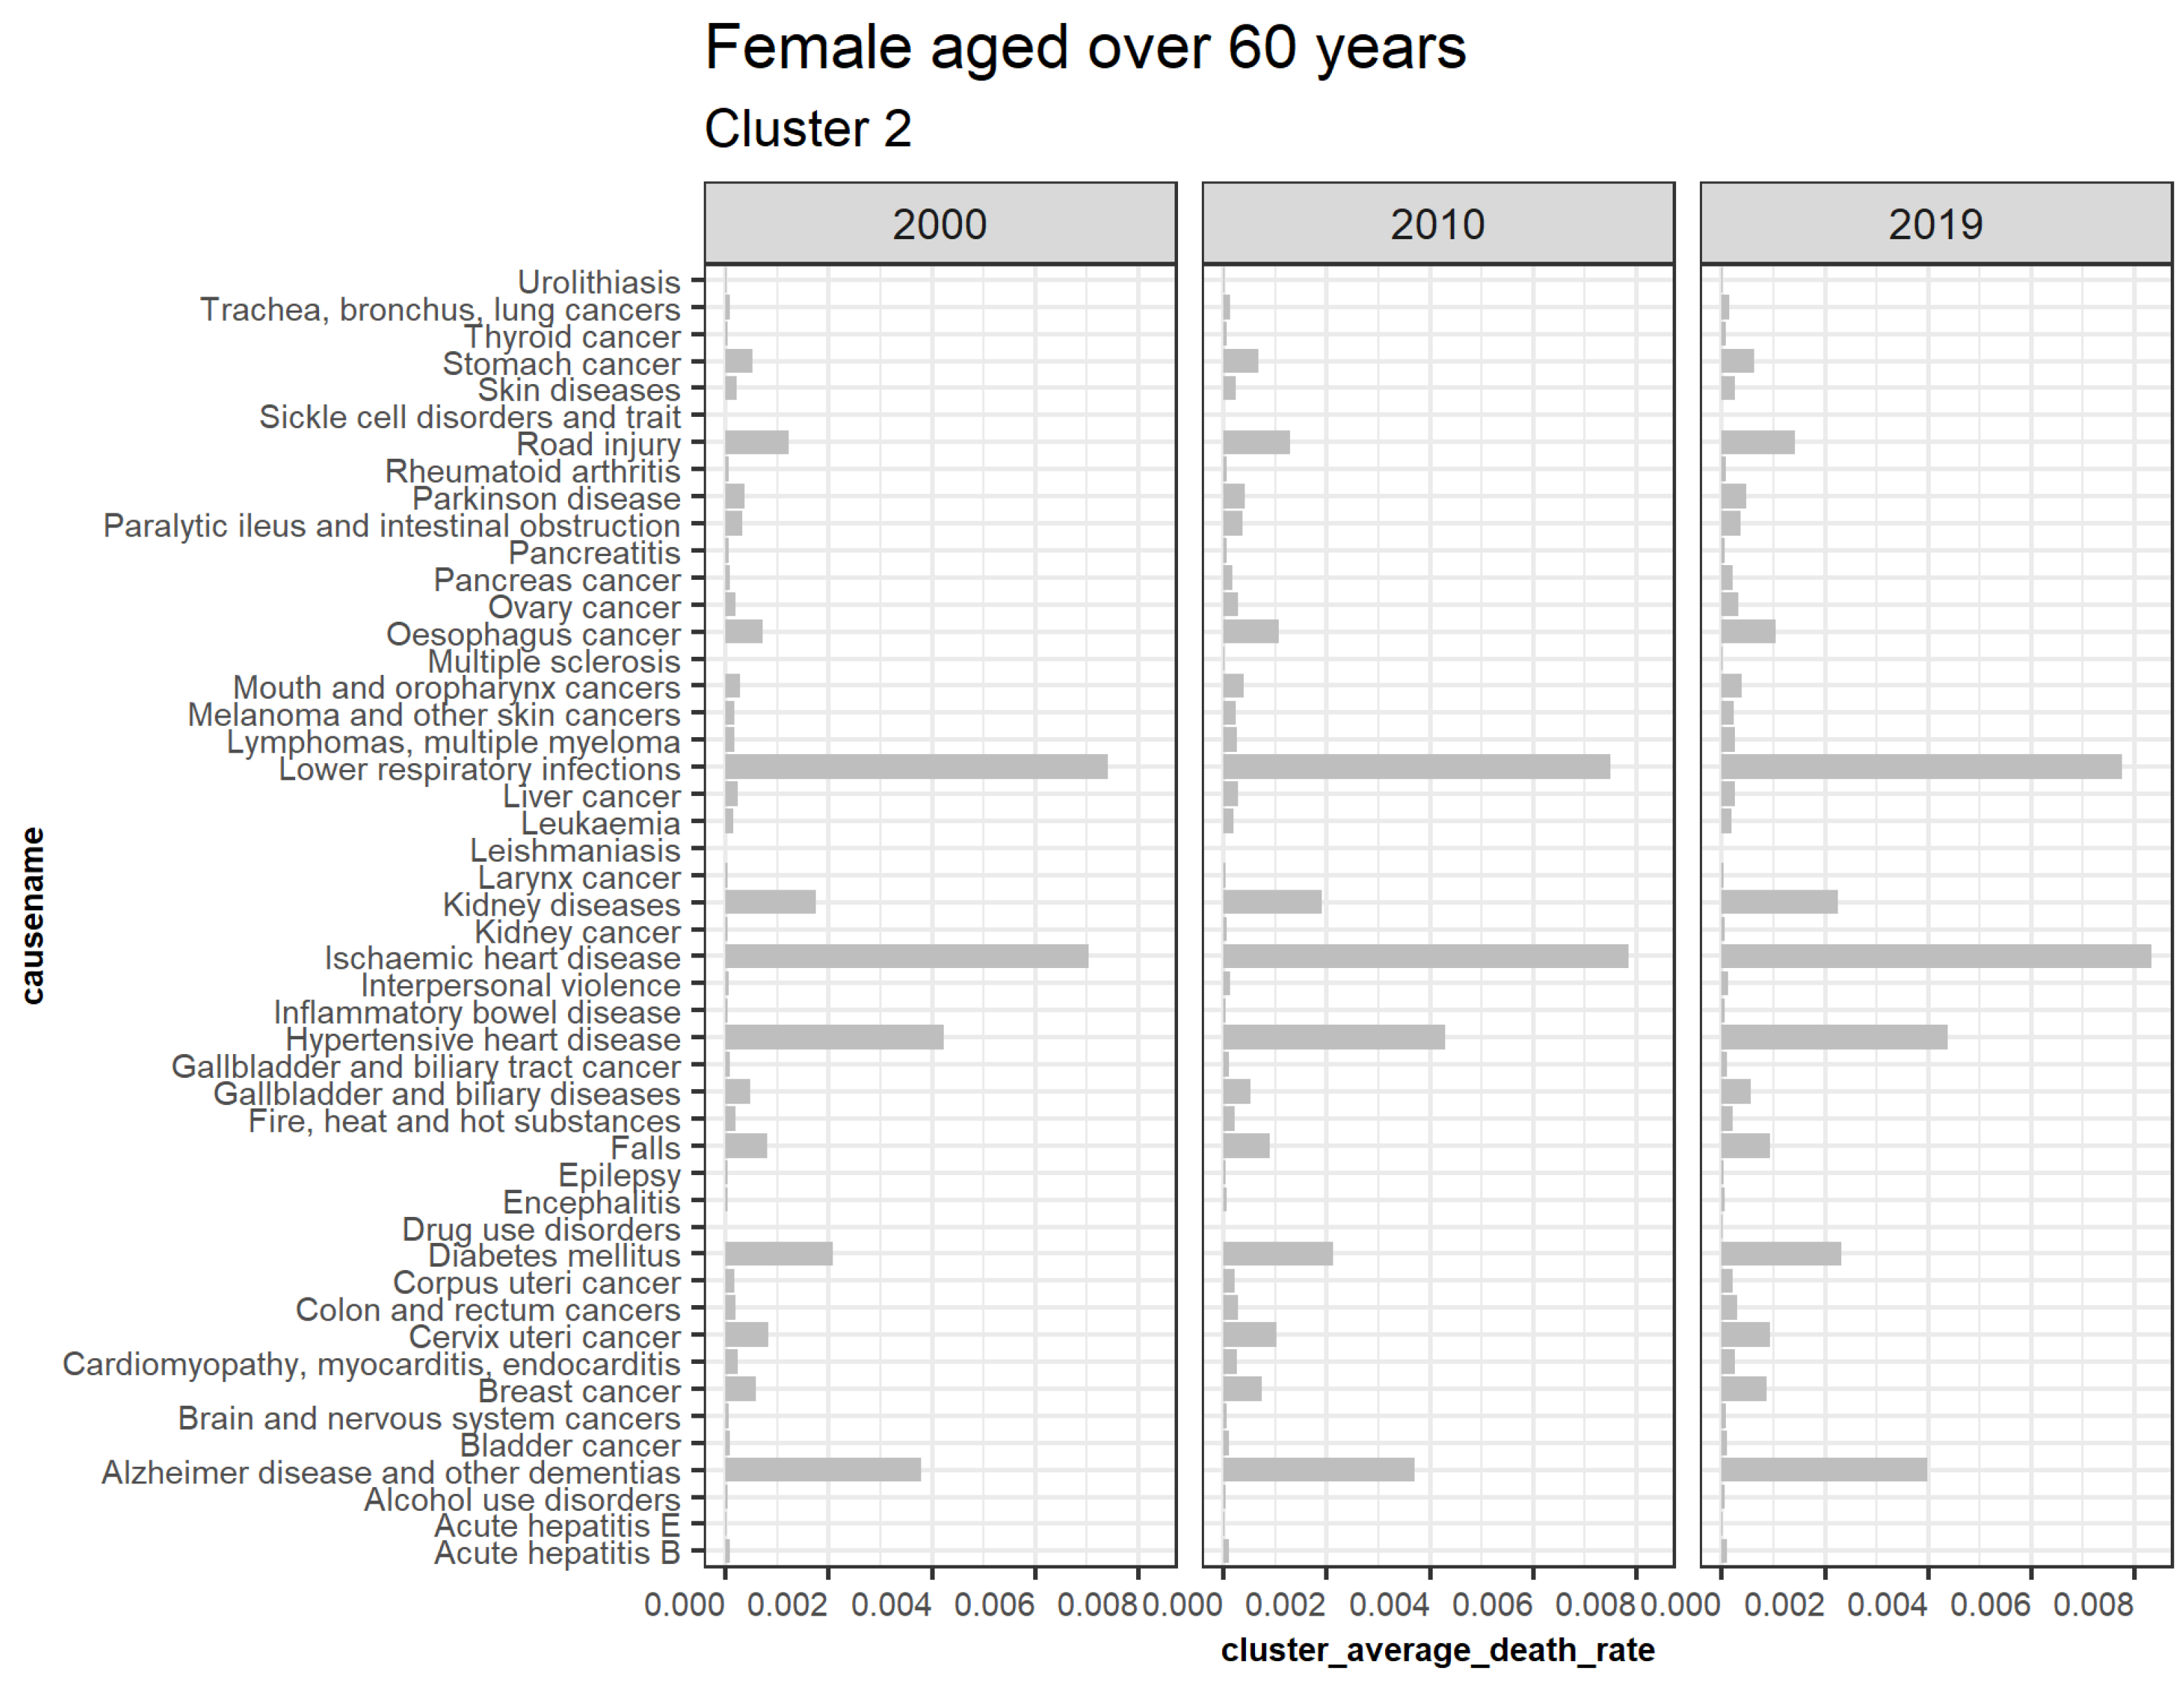
3.5.2. Females Aged over 60
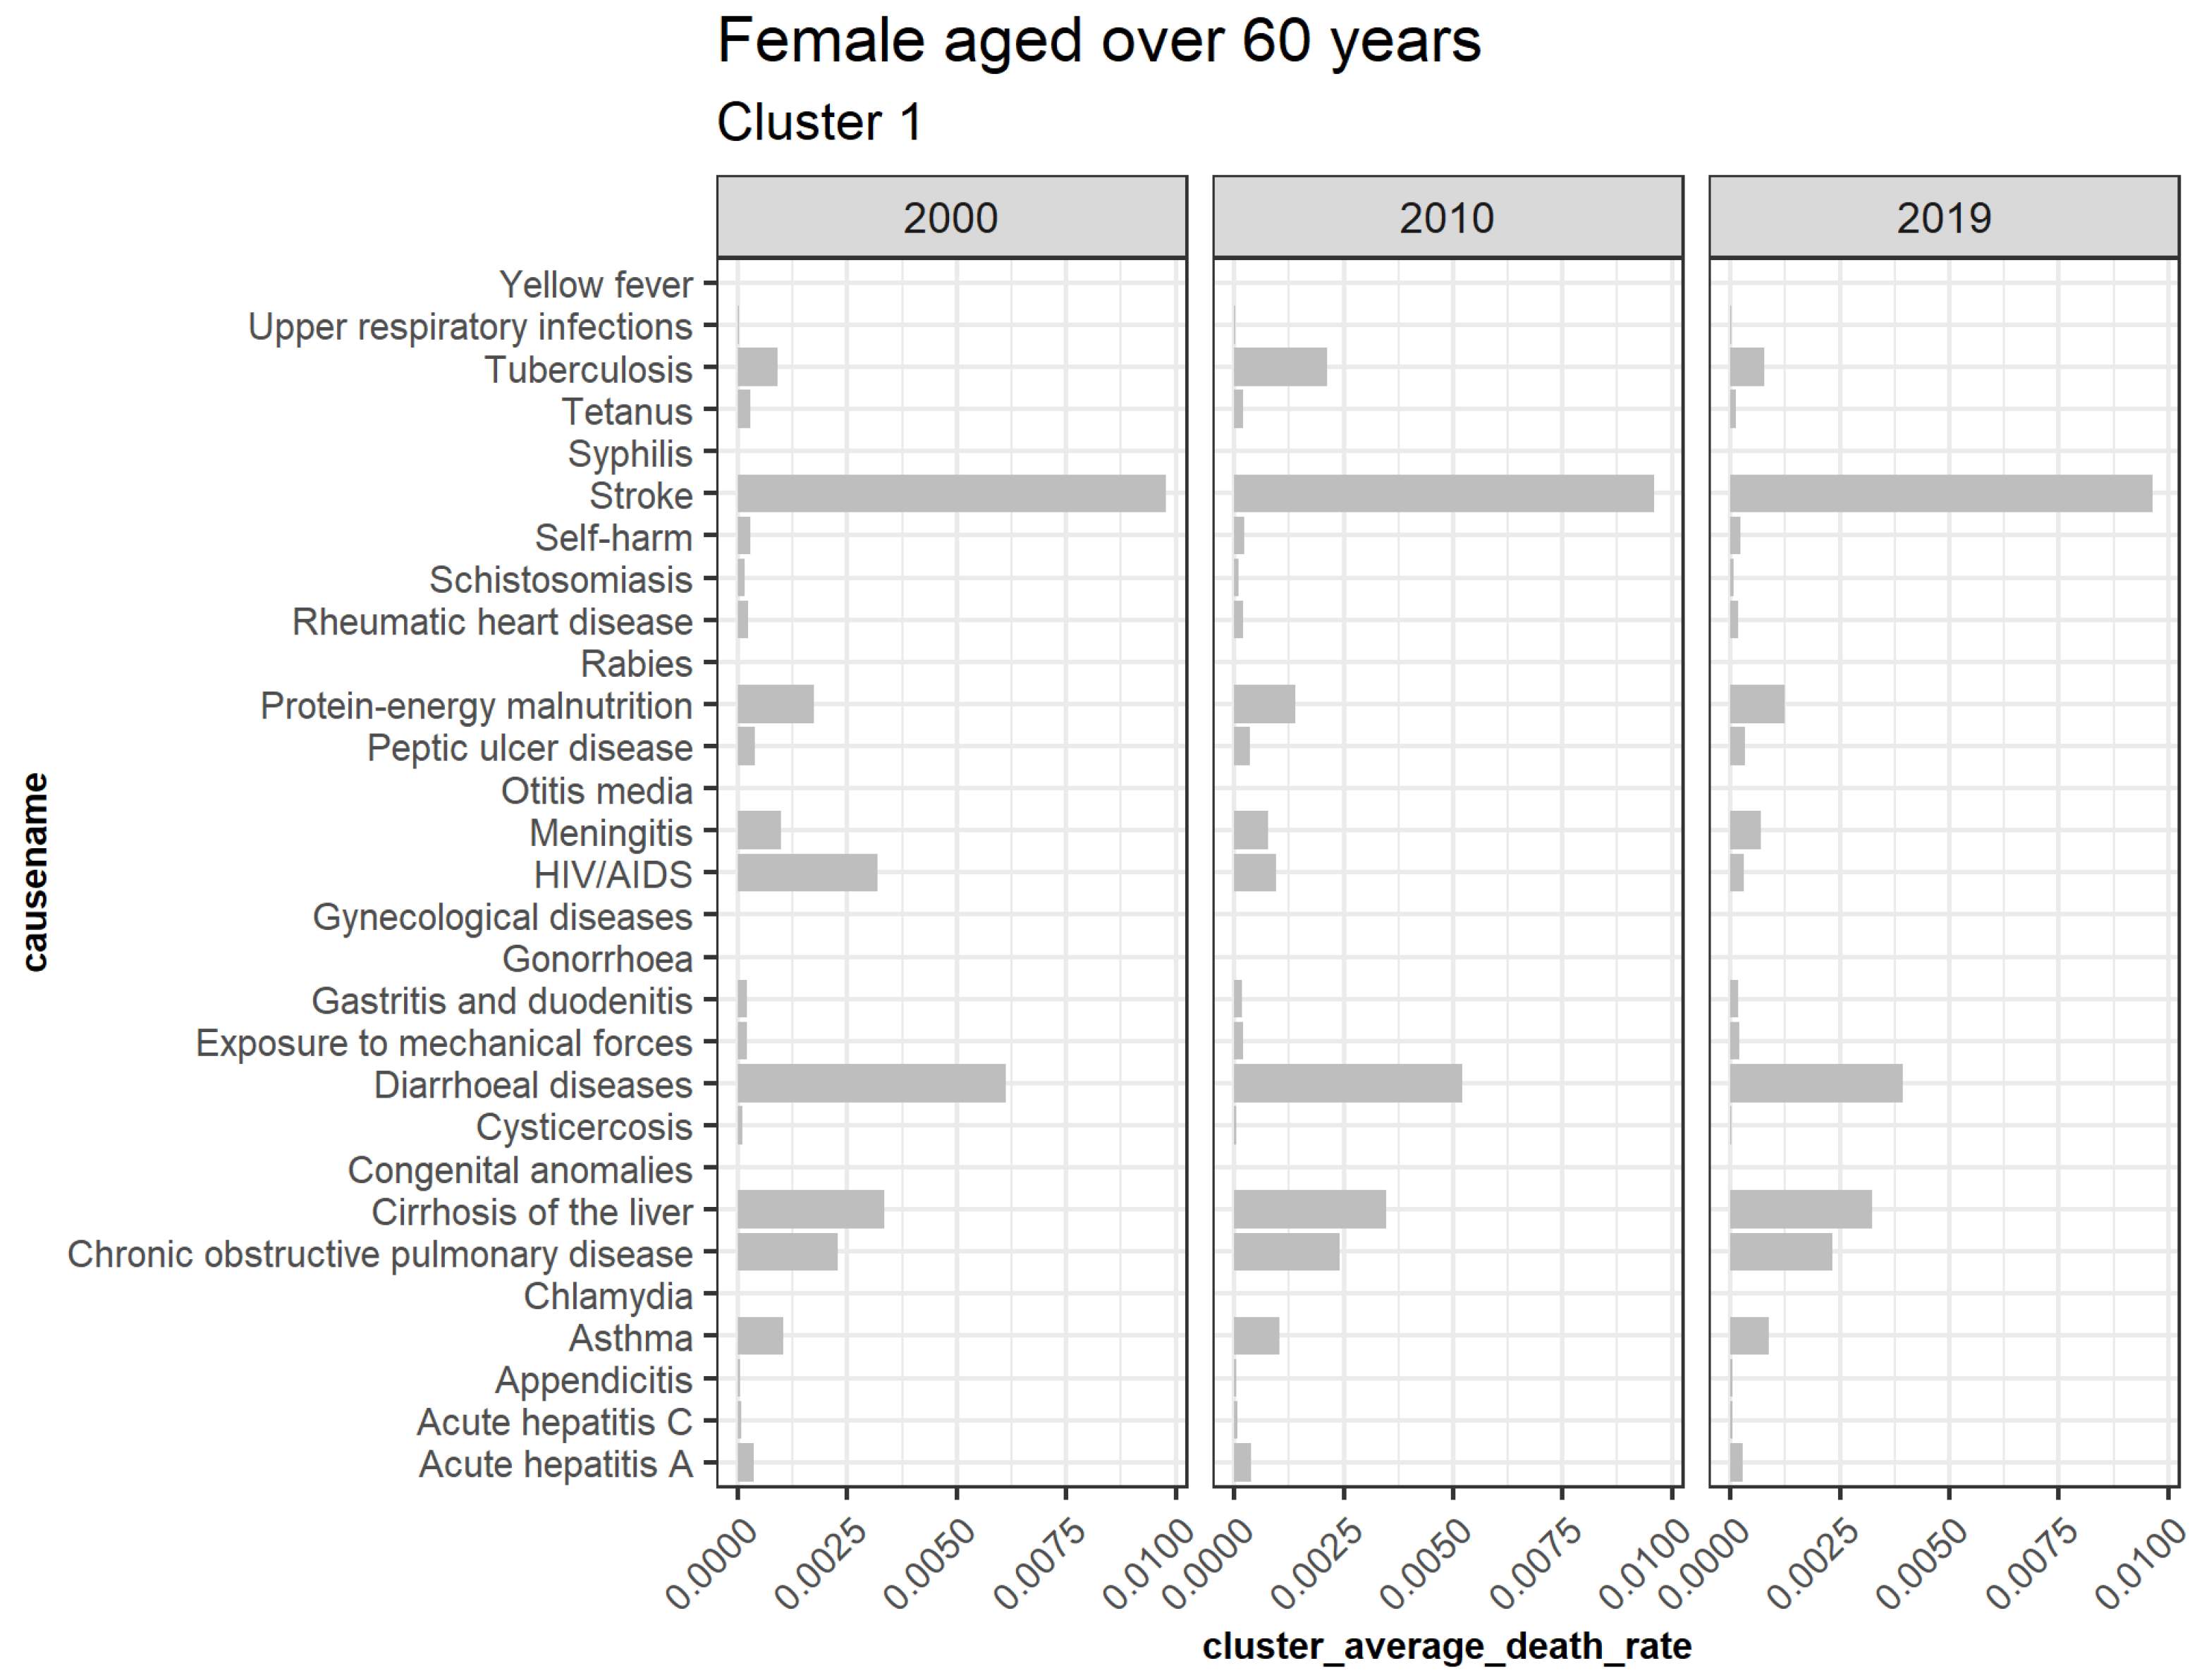
Figure 11 represents clusters for older females. Cluster 2 is trending upwards while cluster 1 is downwards. Cluster 3, 5, 6, 7, 8, 9, 10, and 11 are outliers, while cluster 4 is insignificant. Figure 12 shows the average death rates of the causes of death in cluster 1 among females aged over 60 years partitioned in 2000, 2010, and 2019. Similar to females aged 20 to 60, the most significant impact of the decline is seen by HIV/AIDS. Diarrheal diseases, stroke, protein-energy malnutrition, meningitis, cirrhosis of the liver, chronic pulmonary obstructive disease, and asthma have shown slower declines. This result suggests that most of the causes of slower death rate are the leading reason for increased life expectancy. These findings imply a greater longevity risk because the rate of deaths associated with this age set is slowing. Expressly, studies have confirmed that stroke deaths decline more among older individuals than younger ones (Aparicio et al. 2019). A notable finding of tuberculosis and stroke deaths among females aged 60 has indicated an inconsistent decline or misclassification that needs further investigation. On the other hand, Figure 13 shows the increasing average death rate due to cluster 2 among those aged over 60. Compared to females aged 20 to 60, most increases are not linked to cancer, implying that cancer is either a new cause of death among this age group or that most surviving females recovered from or were not diagnosed with cancer in their earlier ages. However, lower respiratory infections, ischemic heart disease, and hypertensive heart disease associated with cardiovascular diseases (CVD) are increasing, as confirmed by studies by Roth et al. (2015) in lower and middle-income regions. Road injury, falls, diabetes mellitus, Alzheimer’s disease and other dementias, gall bladder and biliary diseases, breast, cervix uteri cancer, esophagus and stomach cancer have shown steady increases. Kidney diseases similar to CVDs have also witnessed increased prevalence.
The implication of this finding on longevity risk will depend on the rates of the increases and decreases of deaths due to these causes. As shown by both declining and increasing trends, slower decline and steady expansion of the deaths will require different approaches to be undertaken at these higher ages, for instance, to determine the inconsistent findings of stroke and tuberculosis among older females.
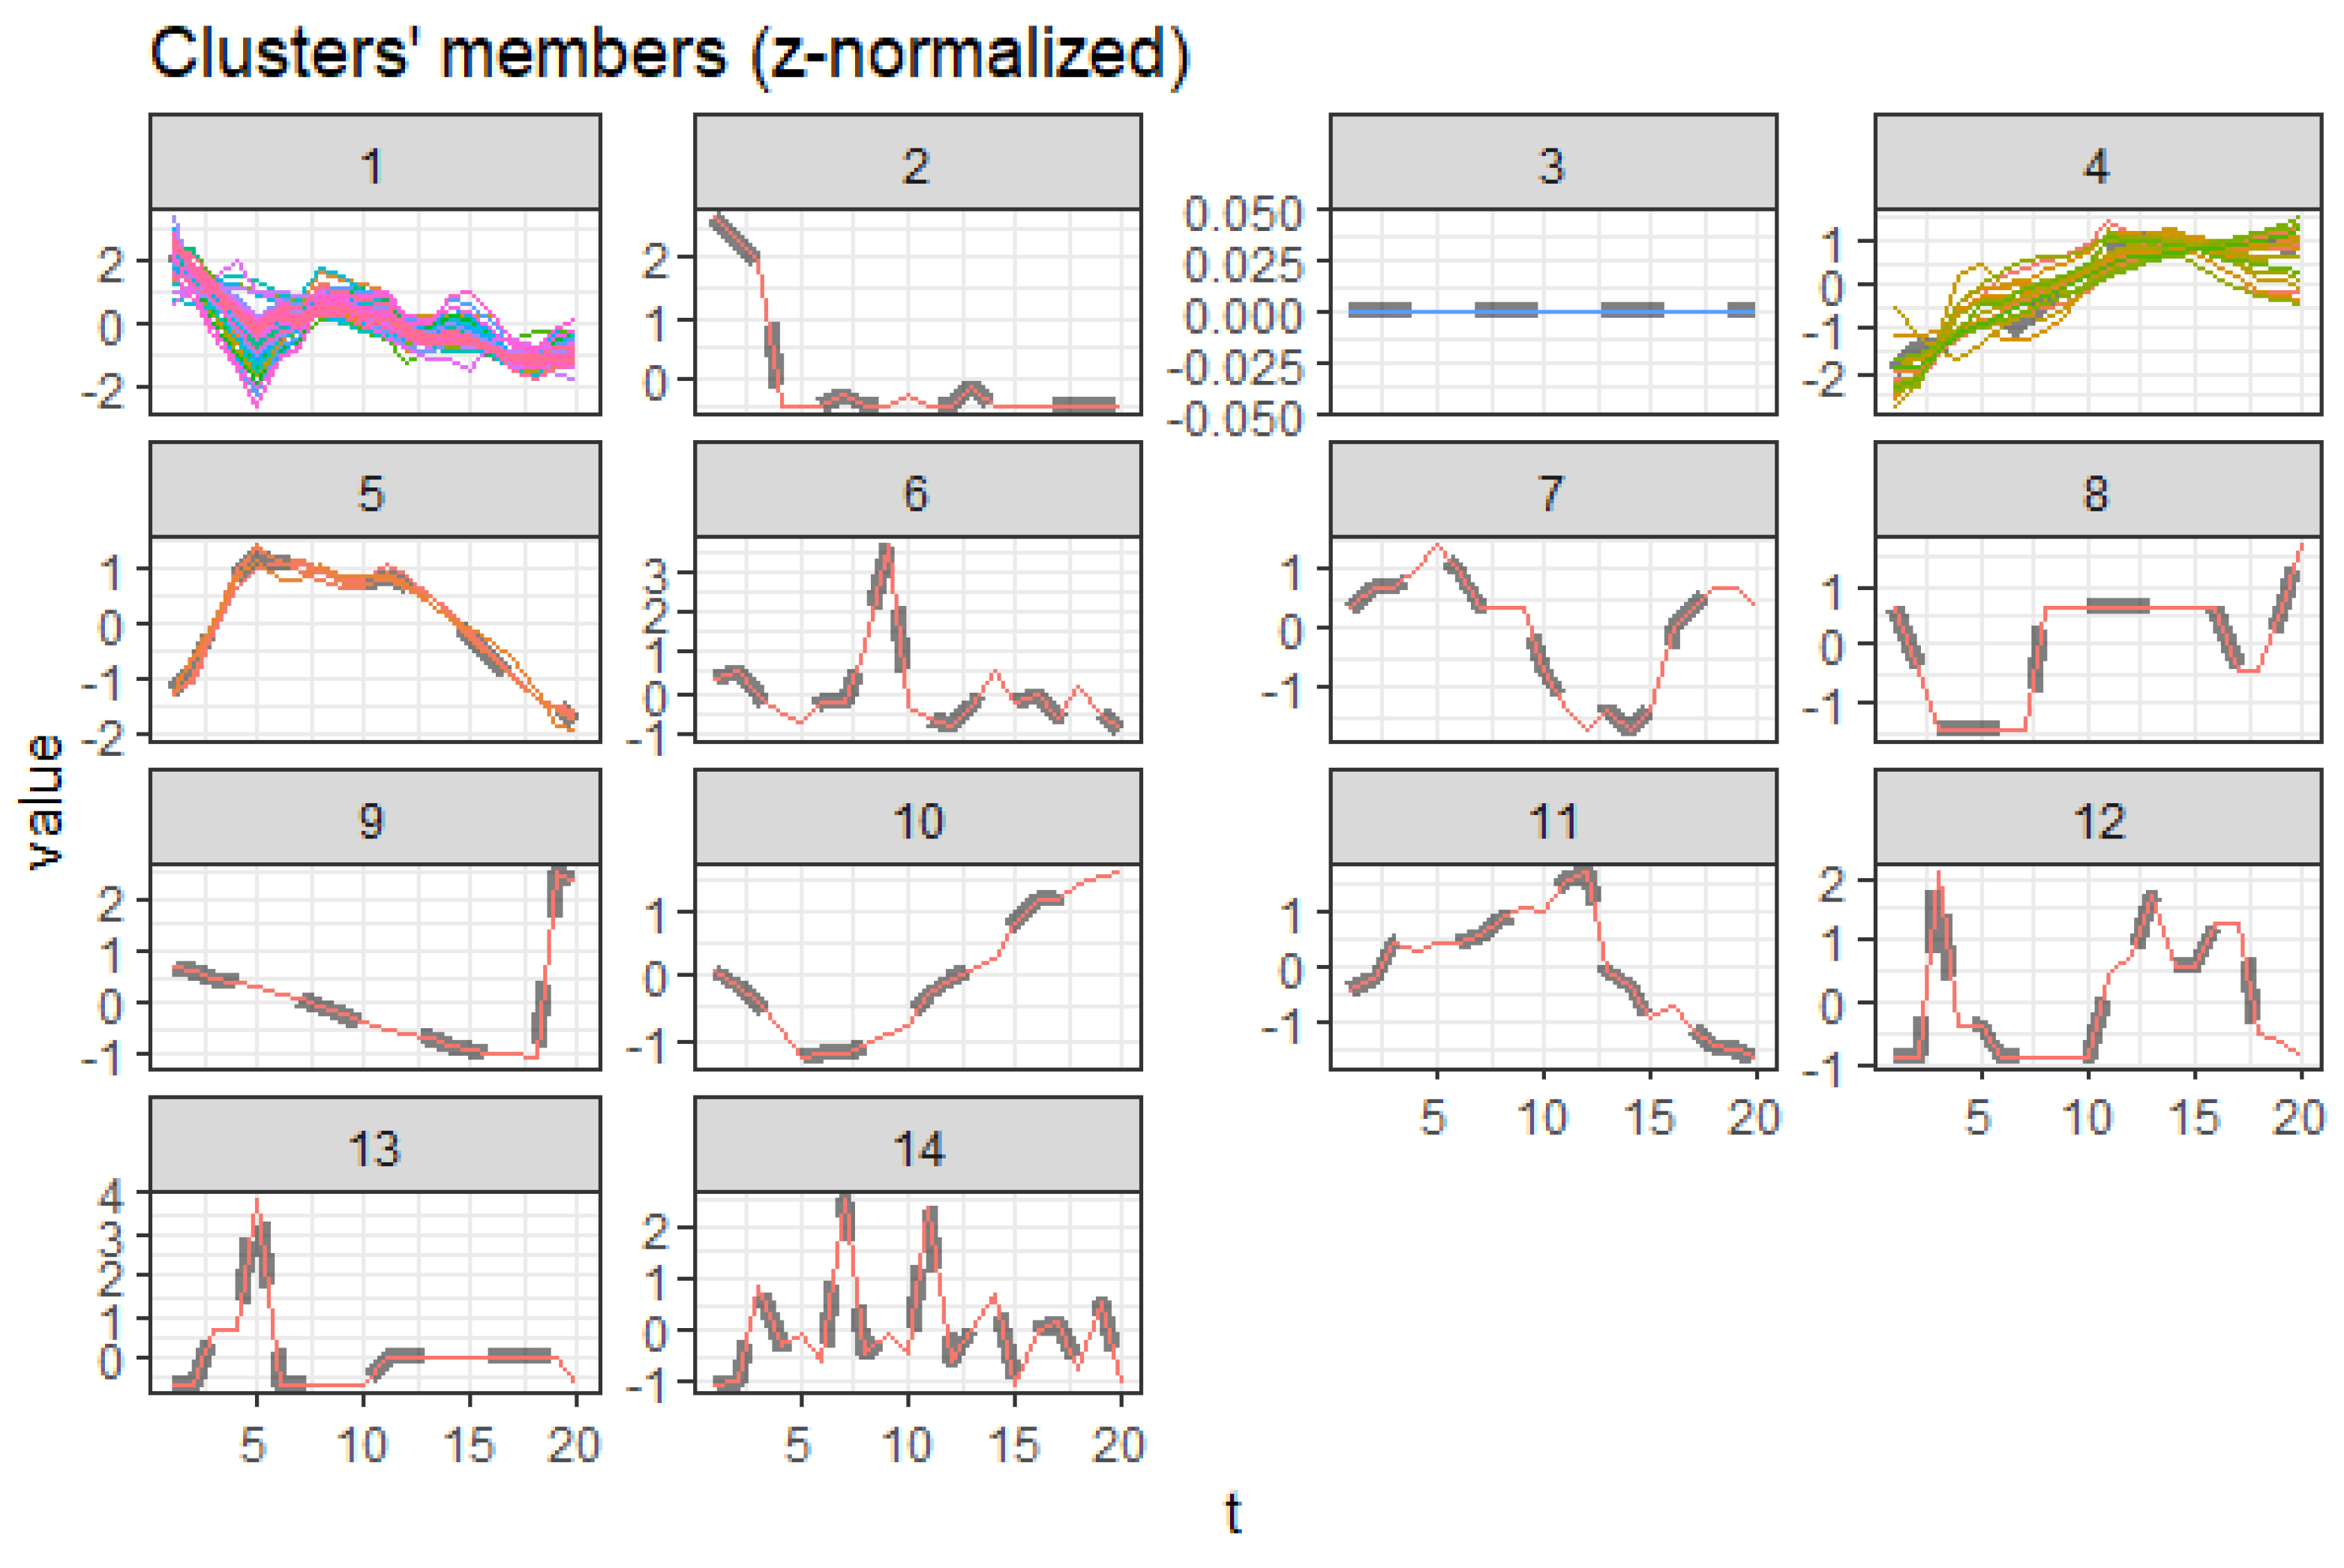
3.5.3. Males Aged 20 to 60
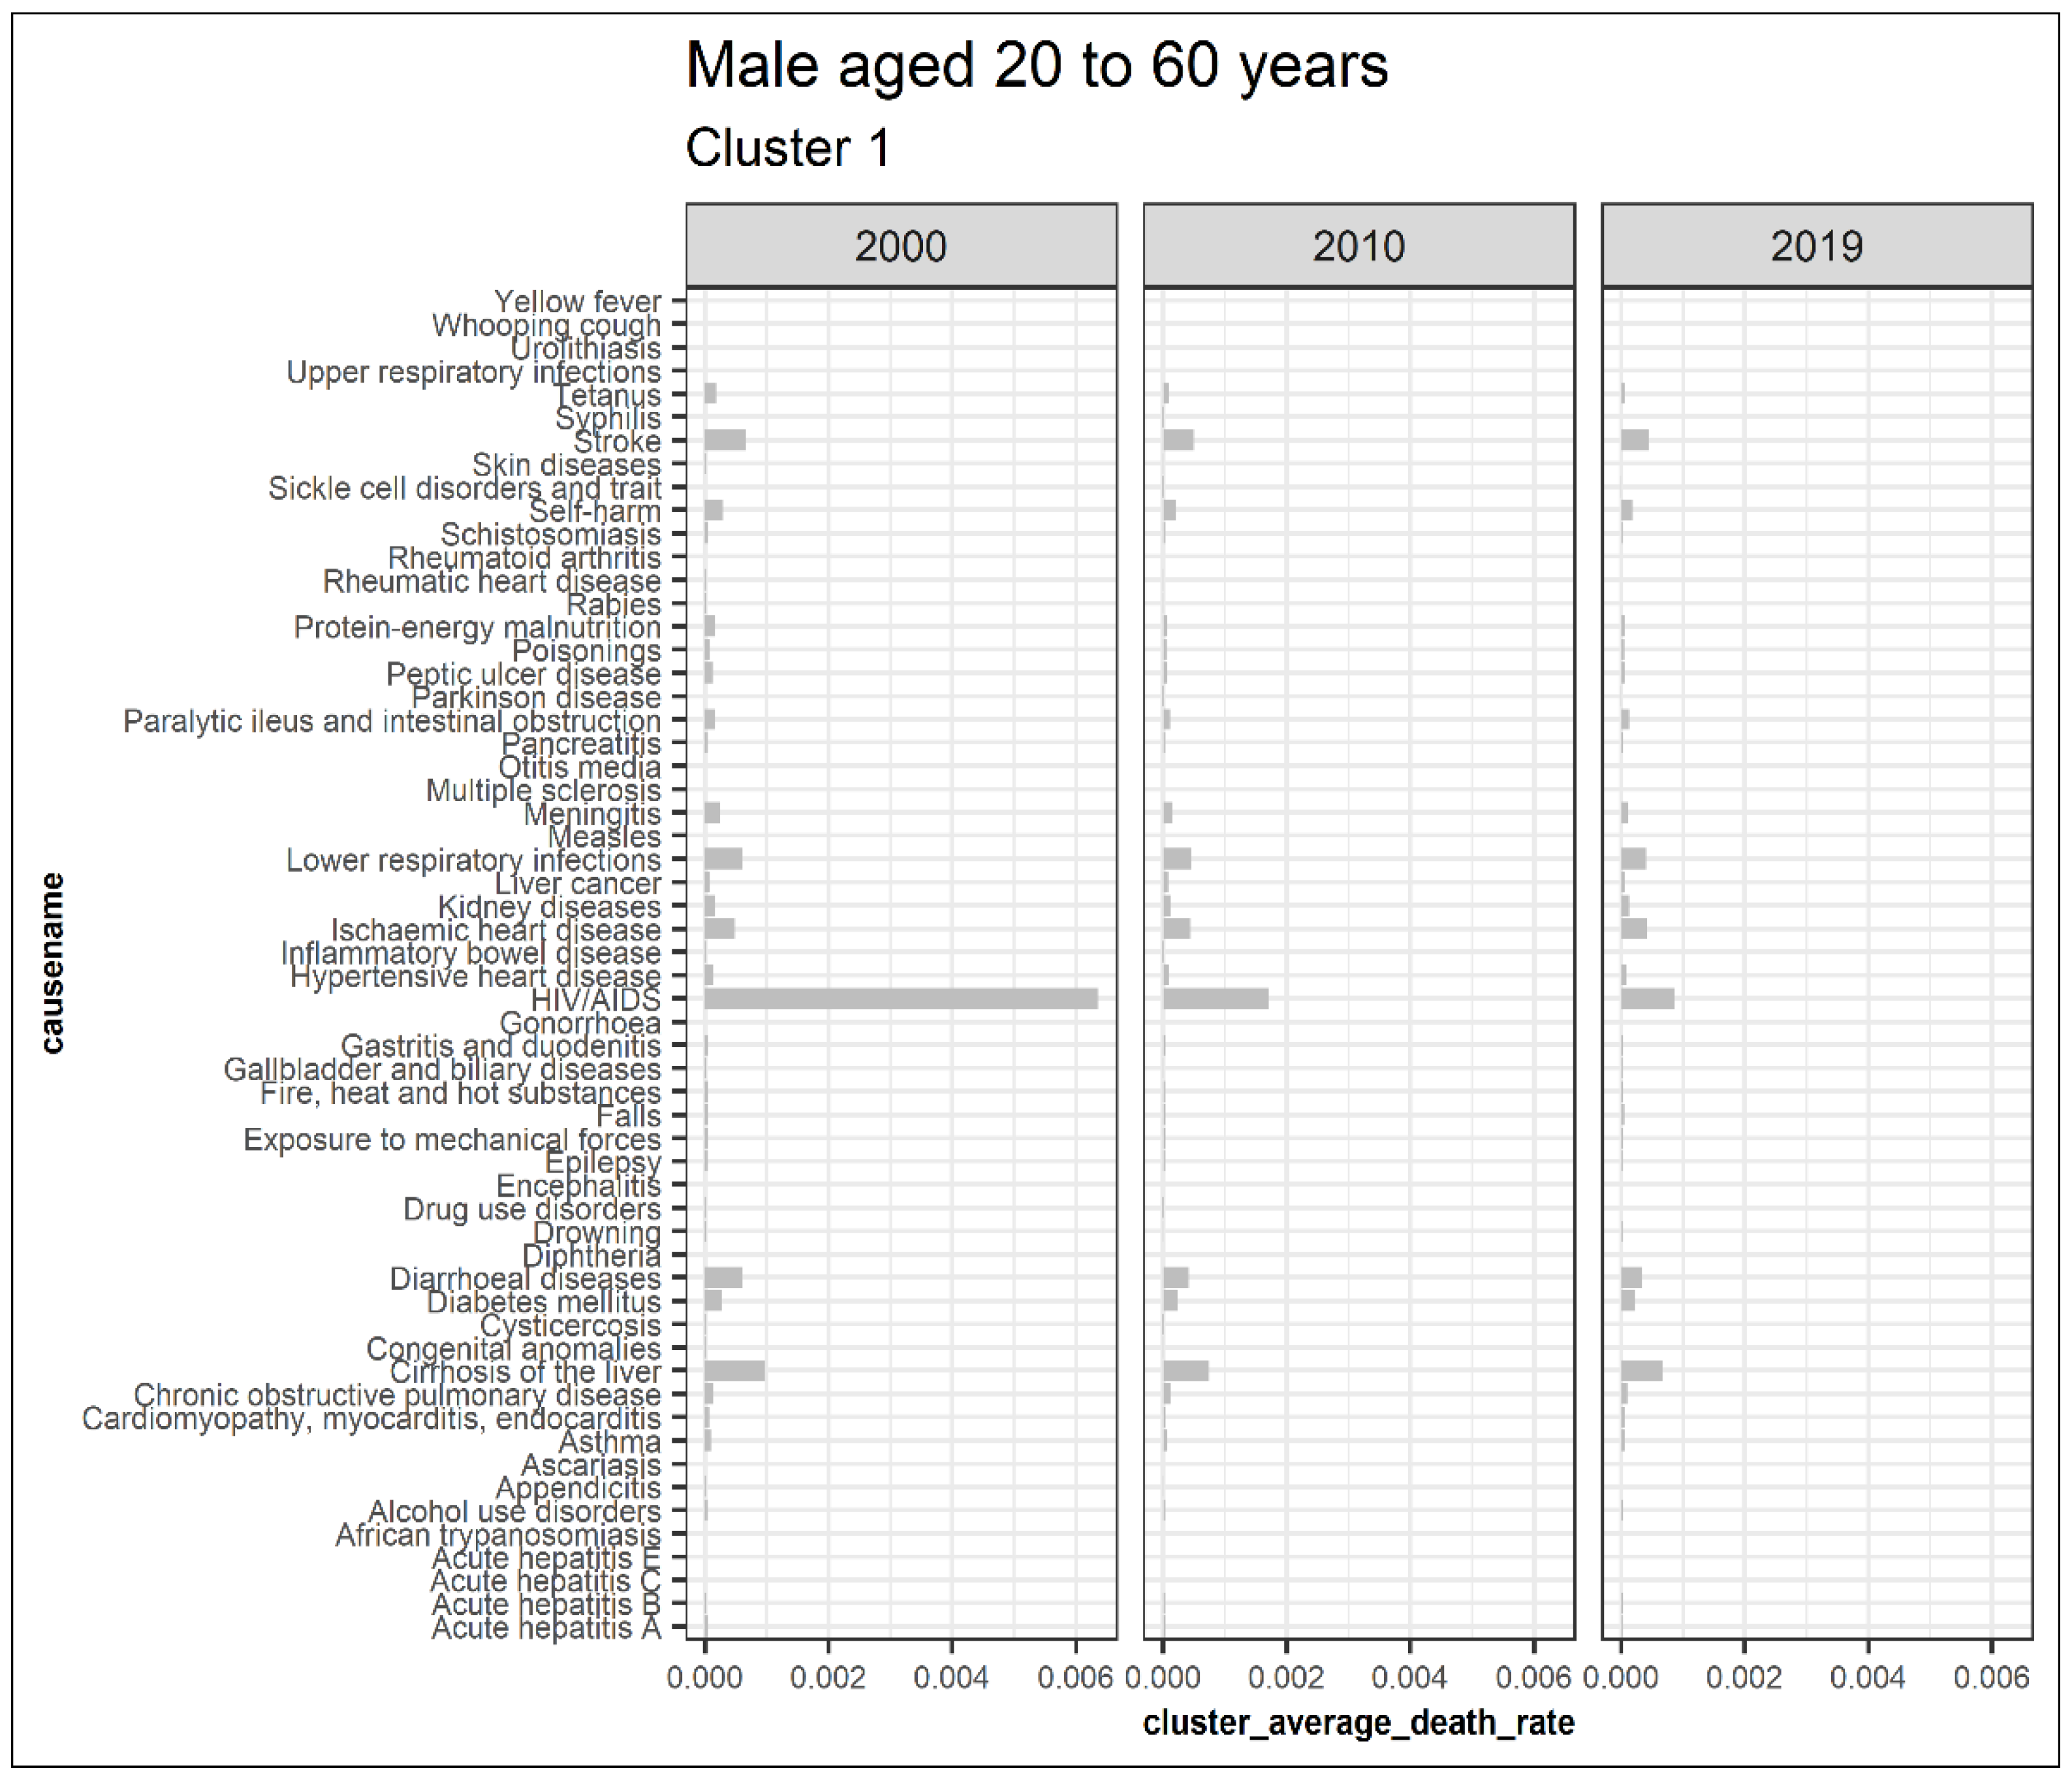
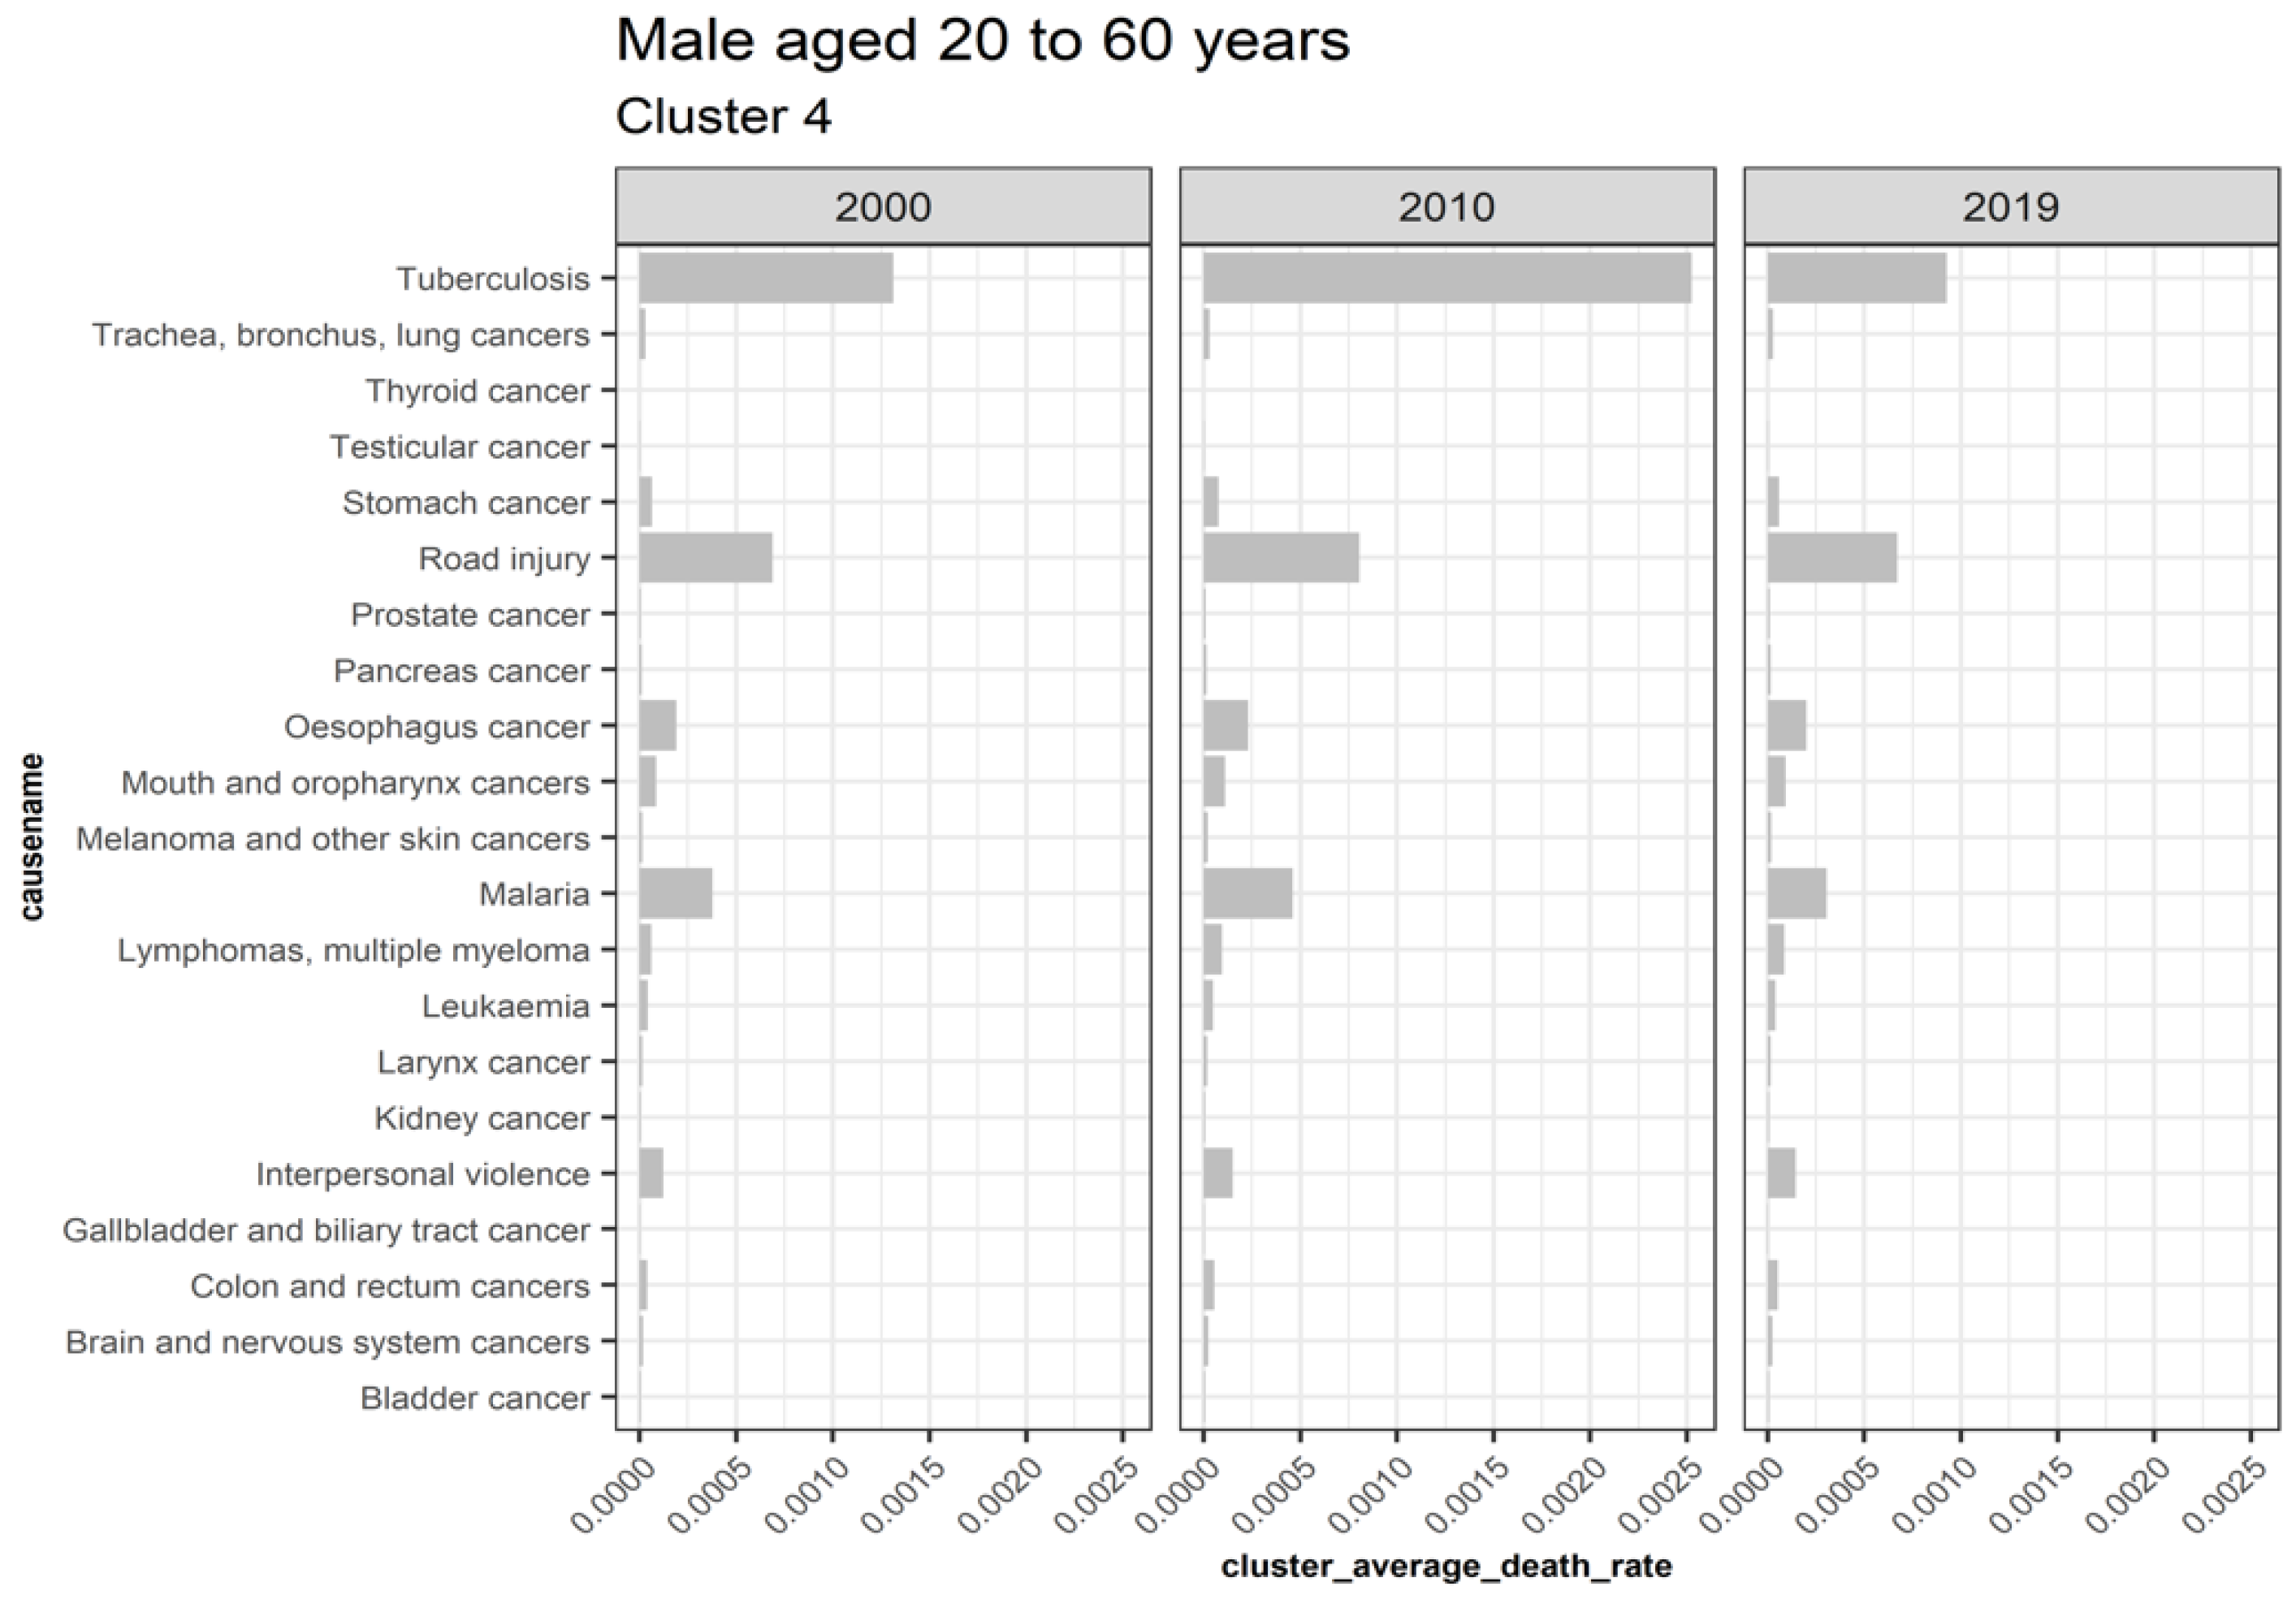
Regarding the males aged 20 to 60, cluster 1 represents clusters trending downwards while cluster 4 combines upward trending and recently declining trends with a trend change observed in 2010, as shown in Figure 14. Cluster 2, 5, 6, 7, 8, 9, and 10 are outliers, while cluster 3 causes are insignificant. Figure 15 displays the average death rates of the causes of death in cluster 1 among males aged 20 to 60 years partitioned in 2000, 2010, and 2019. Similarly, HIV/AIDS is shown to experience the most significant reduction in causing deaths, as observed in their female counterparts. Causes of death such as stroke, tetanus, self-harm, ischemic heart disease, lower respiratory infections, diarrheal diseases, diabetes mellitus, and cirrhosis of the liver have shown a significant decline. Still, they are not comparable to HIV/AIDS. Figure 16 also shows causes of death with both increasing and decreasing causes of death with a break around 2010. Consequently, from 2010 onwards, the causes of death have been declining. Tuberculosis, road injury, malaria, interpersonal violence, esophagus cancer, and mouth and oropharynx cancer belong to this group. This age group has experienced an increased number of causes with a trend change. This result implies additional investigation into these cases.
This result demonstrates that HIV/AIDS is declining among males aged 20 to 60, as shown by cluster 1. Detection of the other declining causes of death that form cluster 1 in males 20 to 60 are shown. Self-harm is an external cause of death linked to intentional injuries and unique to males aged 20 to 60. It shows that the clustering approach can detect such complexities unique to gender. However, this approach has also not observed in similar trends as compared to cluster 5 in females aged 20 to 60, probably due to the dynamic nature of causes. This explains one of the shortcomings of this approach in monitoring trends. One remedy is to periodically undertake clustering to reduce the risk of misclassification.
3.5.4. Males Aged over 60
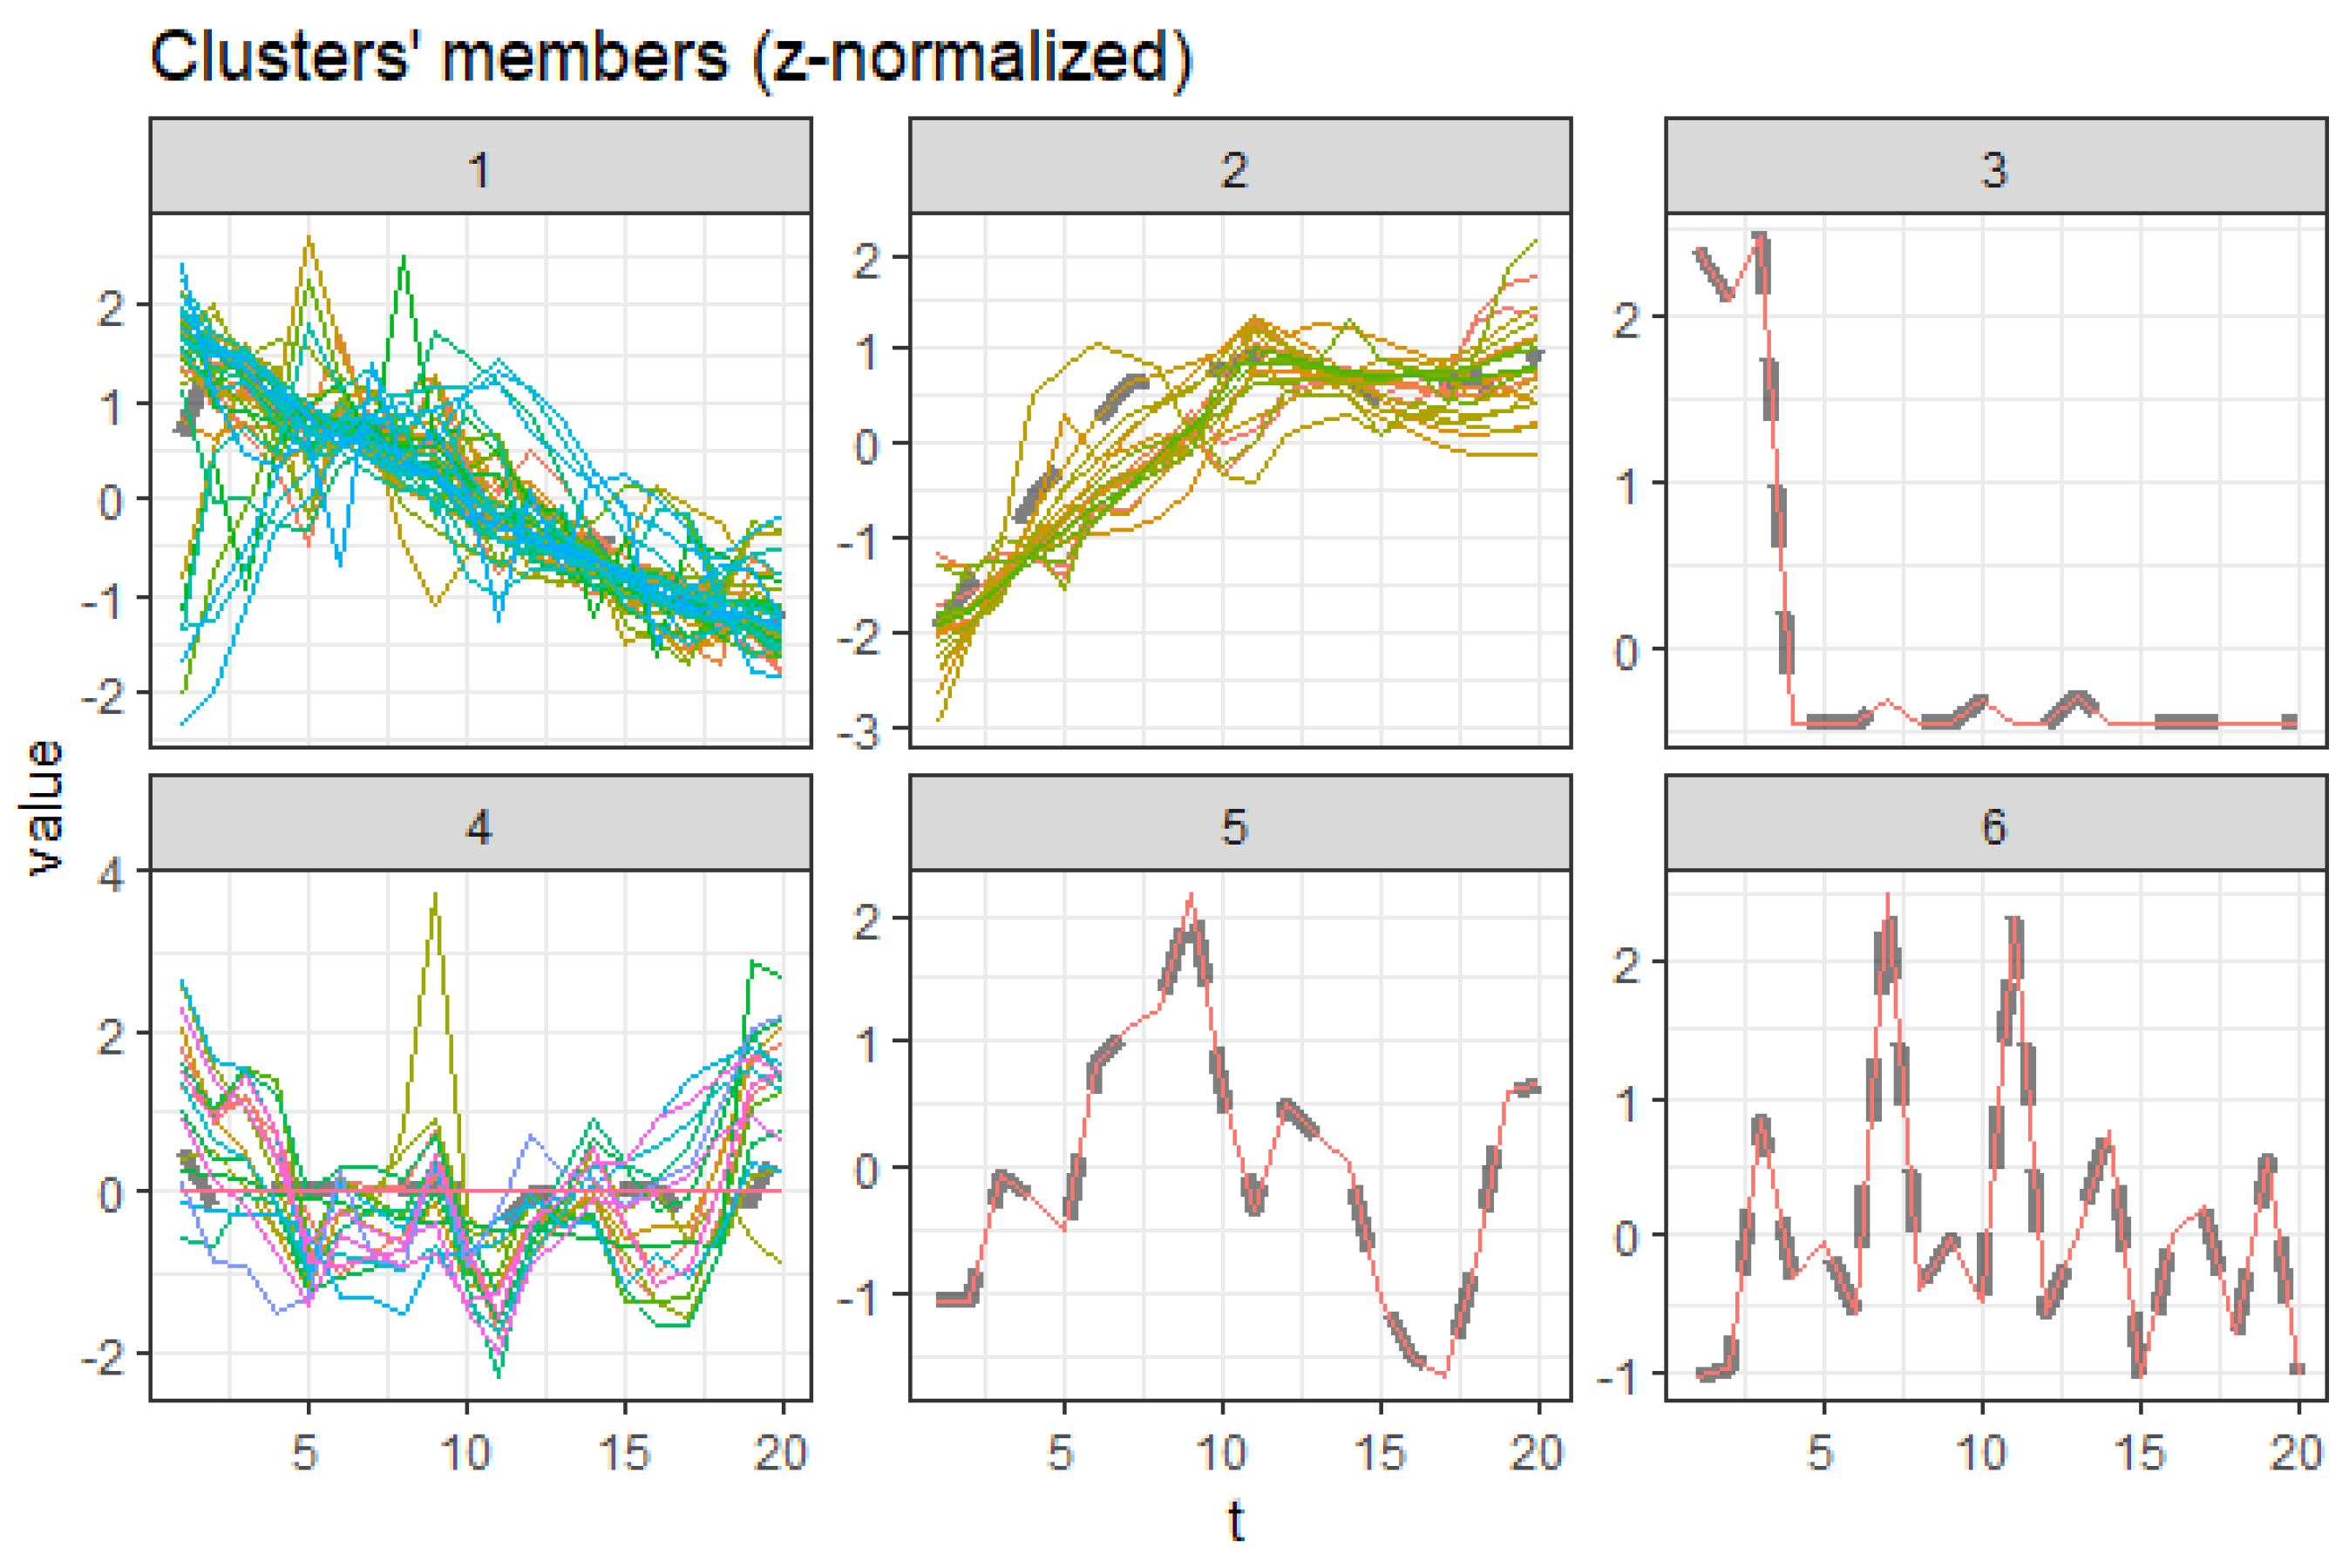
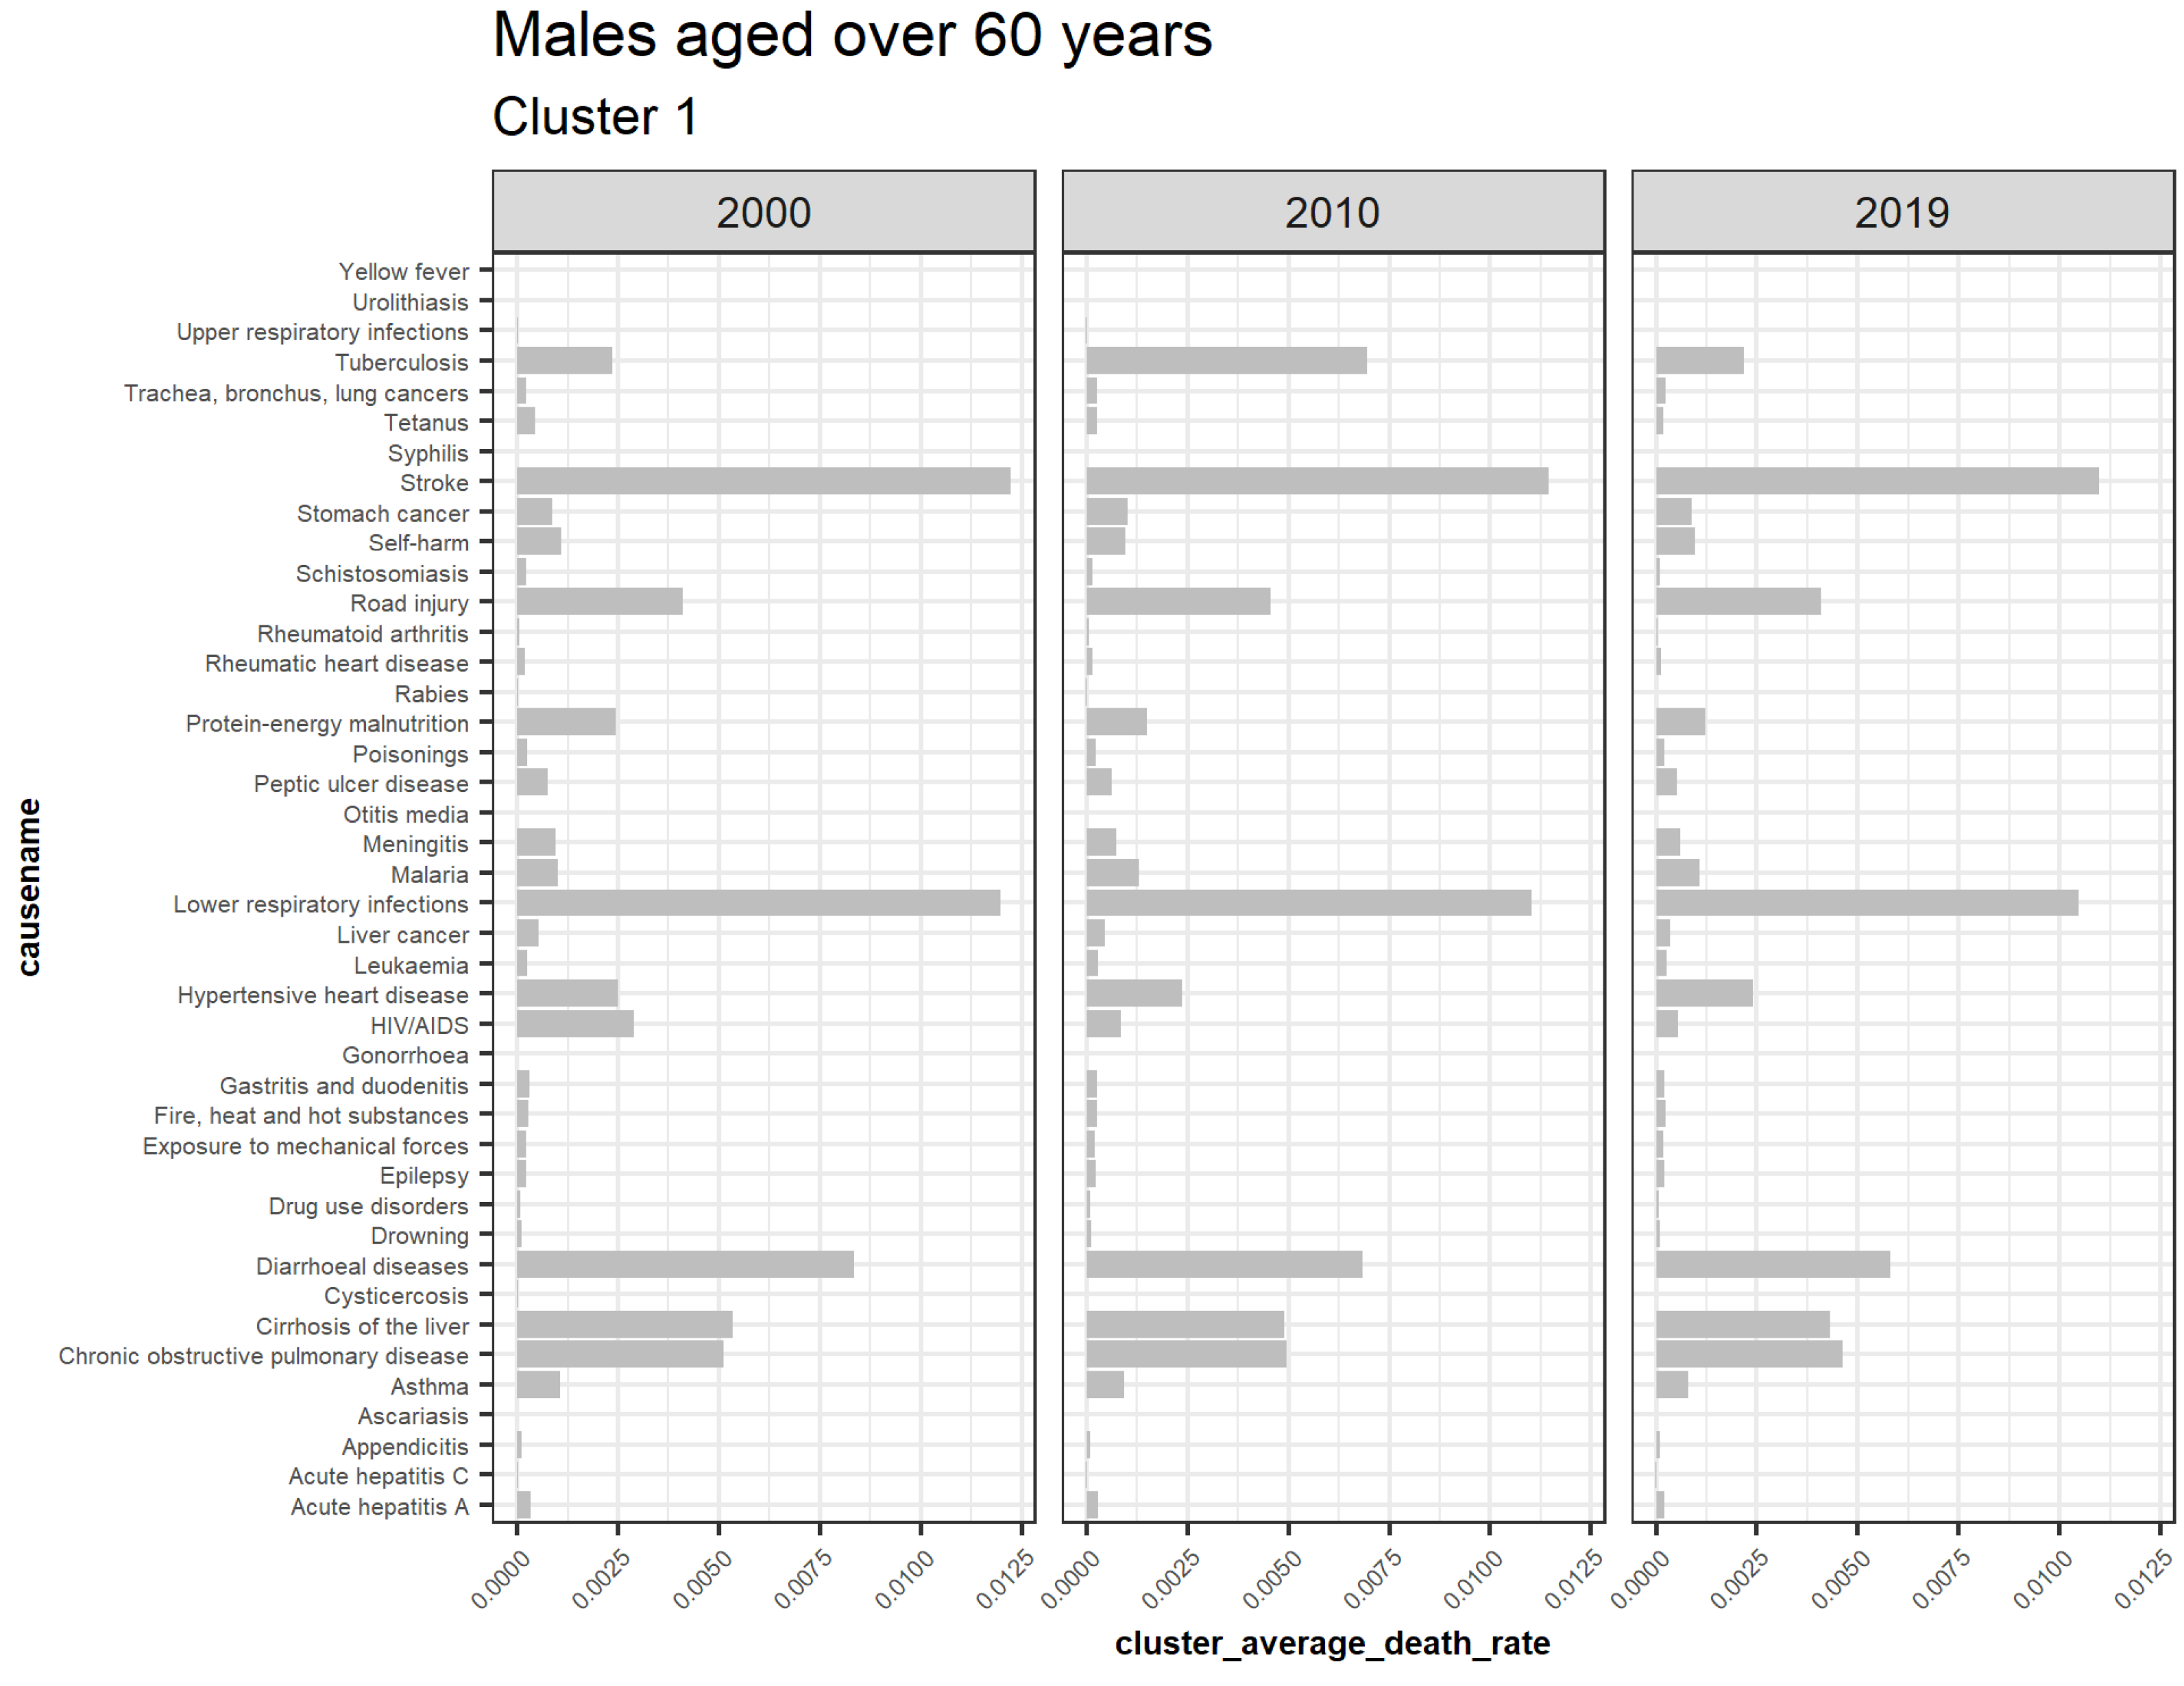
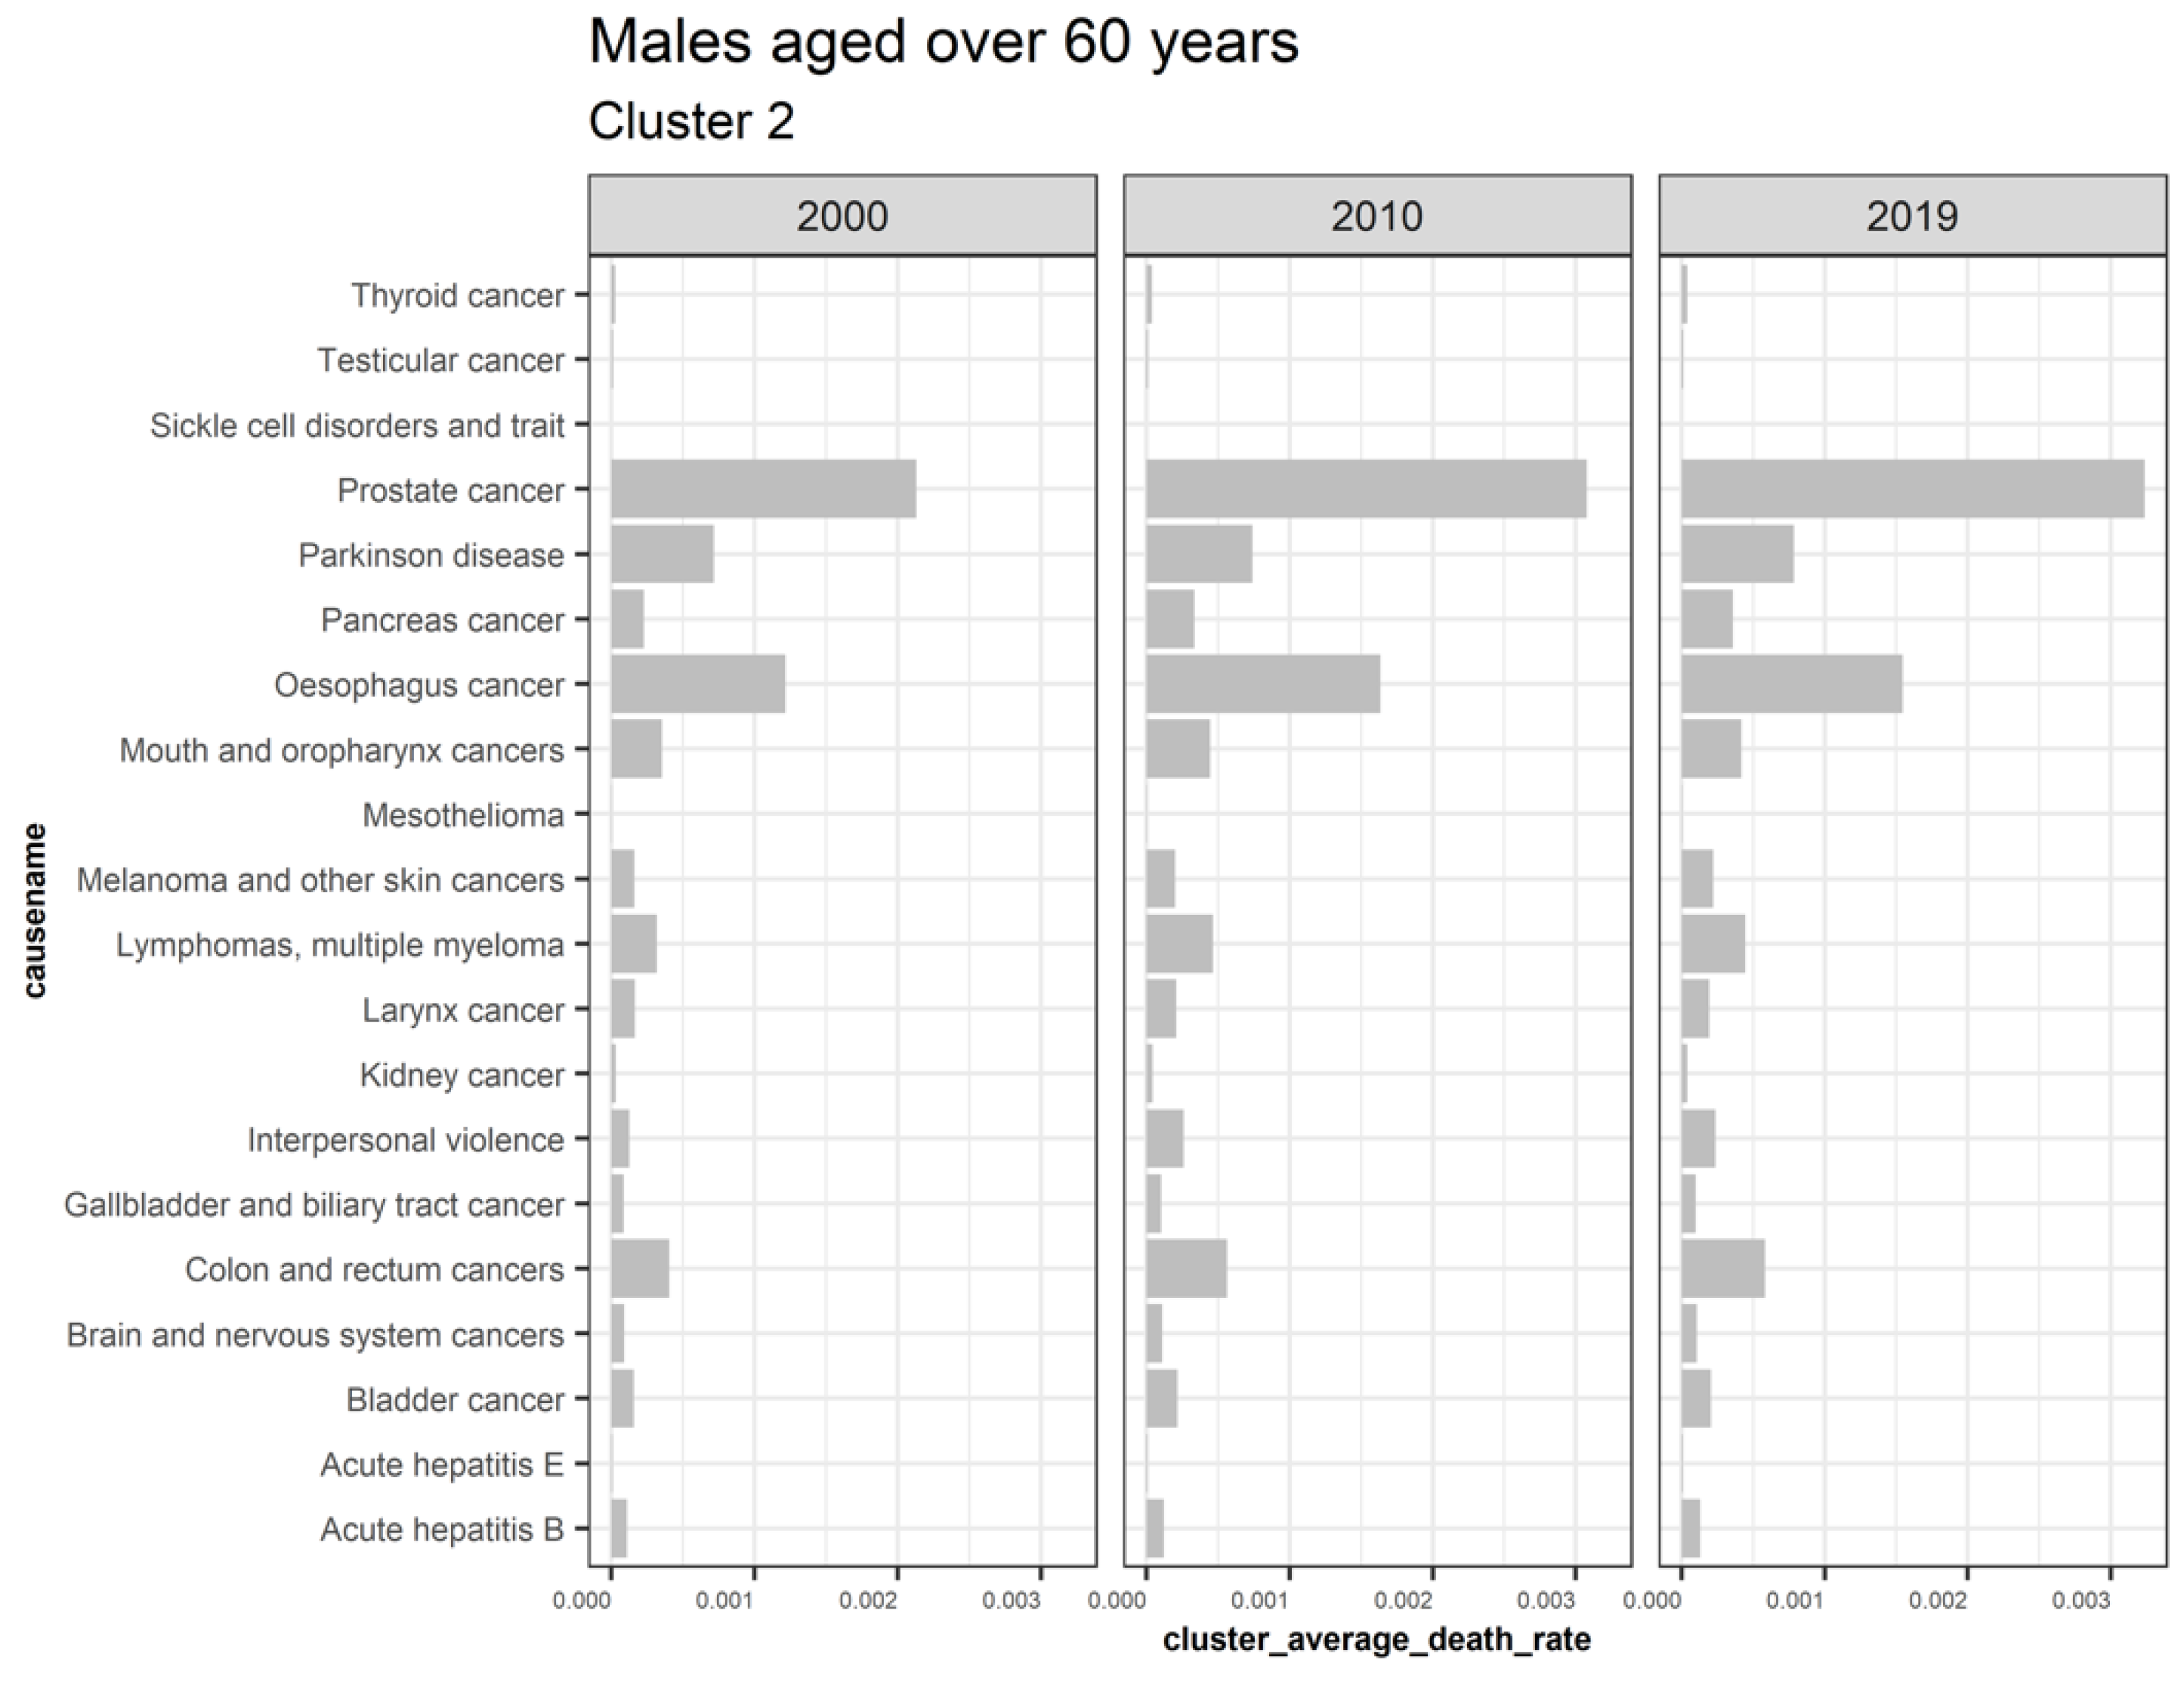
Males aged 60 and above have cluster 2 trending upwards while cluster 1 is declining, as shown by Figure 17. Cluster 3, 5, and 6 are outliers, while four is insignificant. Figure 18 shows the average death rates of the causes of death in cluster 1 among males aged over 60 years partitioned in 2000, 2010, and 2019. However, the leading cause of death is stroke at a slower rate of decline, as observed. Compared to HIV/AIDS reduction for both the younger and older males, we note that the men over 60 experience slower reductions. This scenario is also replicated among the other causes of death in the age groups. This finding suggests that deaths of older men are steady and implies increased survival of men over age 60. Contrastingly, fewer causes are increasing compared to the declining causes of death, as shown by Figure 19. The majority of deaths in this cluster are cancer, with the primary cause being prostate cancer. Like females, tuberculosis does not depict a one-directional trend in males aged over 60. This shortcoming has shown a pattern for both males and females.
3.6. Cause of Death Classification Based on the Proposed Clustering Approach
3.6.1. Trending Upwards
Upward trending clusters imply a lower risk to longevity for older individuals. Conversely, among the young, upward-trending clusters signify increased mortality risk. These clusters show the need for insurers to pay more attention to such clusters because it would likely impact mortality profit and loss in the future.
3.6.2. Trending Downwards
On the other hand, declining trends imply a higher risk of longevity among the old and a lower risk of mortality among the young. For example, HIV/AIDS has a declining trend for males and females for all age groups under clusters 1. For this reason, mortality improvements are expected and portray a higher risk in terms of longevity. This mortality improvement led to revisions of life expectancy projections for Kenya (United Nations and Social Affairs 2017). The United Nations uses the probabilistic approach with the HIV/AIDS factor in forecasting life expectancy in Kenya (Raftery et al. 2013). Such models may therefore consider this approach in advance.
3.6.3. Outliers
These clusters comprise individual causes that are highly dissimilar to the trending causes, as shown by Table 10. Examples of outliers captured include: collective violence and legal intervention cause for both males and females peaked in the electioneering period of Kenya 2007/2008 when Kenya witnessed post-election violence. Additionally, breast cancer among males has been higher in Kenya than in the East African region (Sawe et al. 2016). According to Delgermaa et al. (2011), the mesothelioma cause of death linked to asbestos usage should be anticipated in the immediate decades ahead, including in developing countries. This is one of the outliers. All these instances imply that this temporal clustering approach may also capture unnoticeable cases that result in changes in mortality and longevity trends, including mortality shocks.
3.6.4. Insignificant
These clusters capture causes with insignificant deaths or those unrelated to gender or age. For instance, maternal conditions and ovarian cancer observed in cluster 3 for young males is insignificant, as this only affects females; they have zero death rates. However, one drawback of this methodology is observed in cluster 4 under males aged over 60, where several causes are misclassified together with the insignificant cases. This implies that further studies should be conducted to understand the reason for this scenario.
3.7. Quantifying the Detected Clusters Based on Cause–Elimination Approach
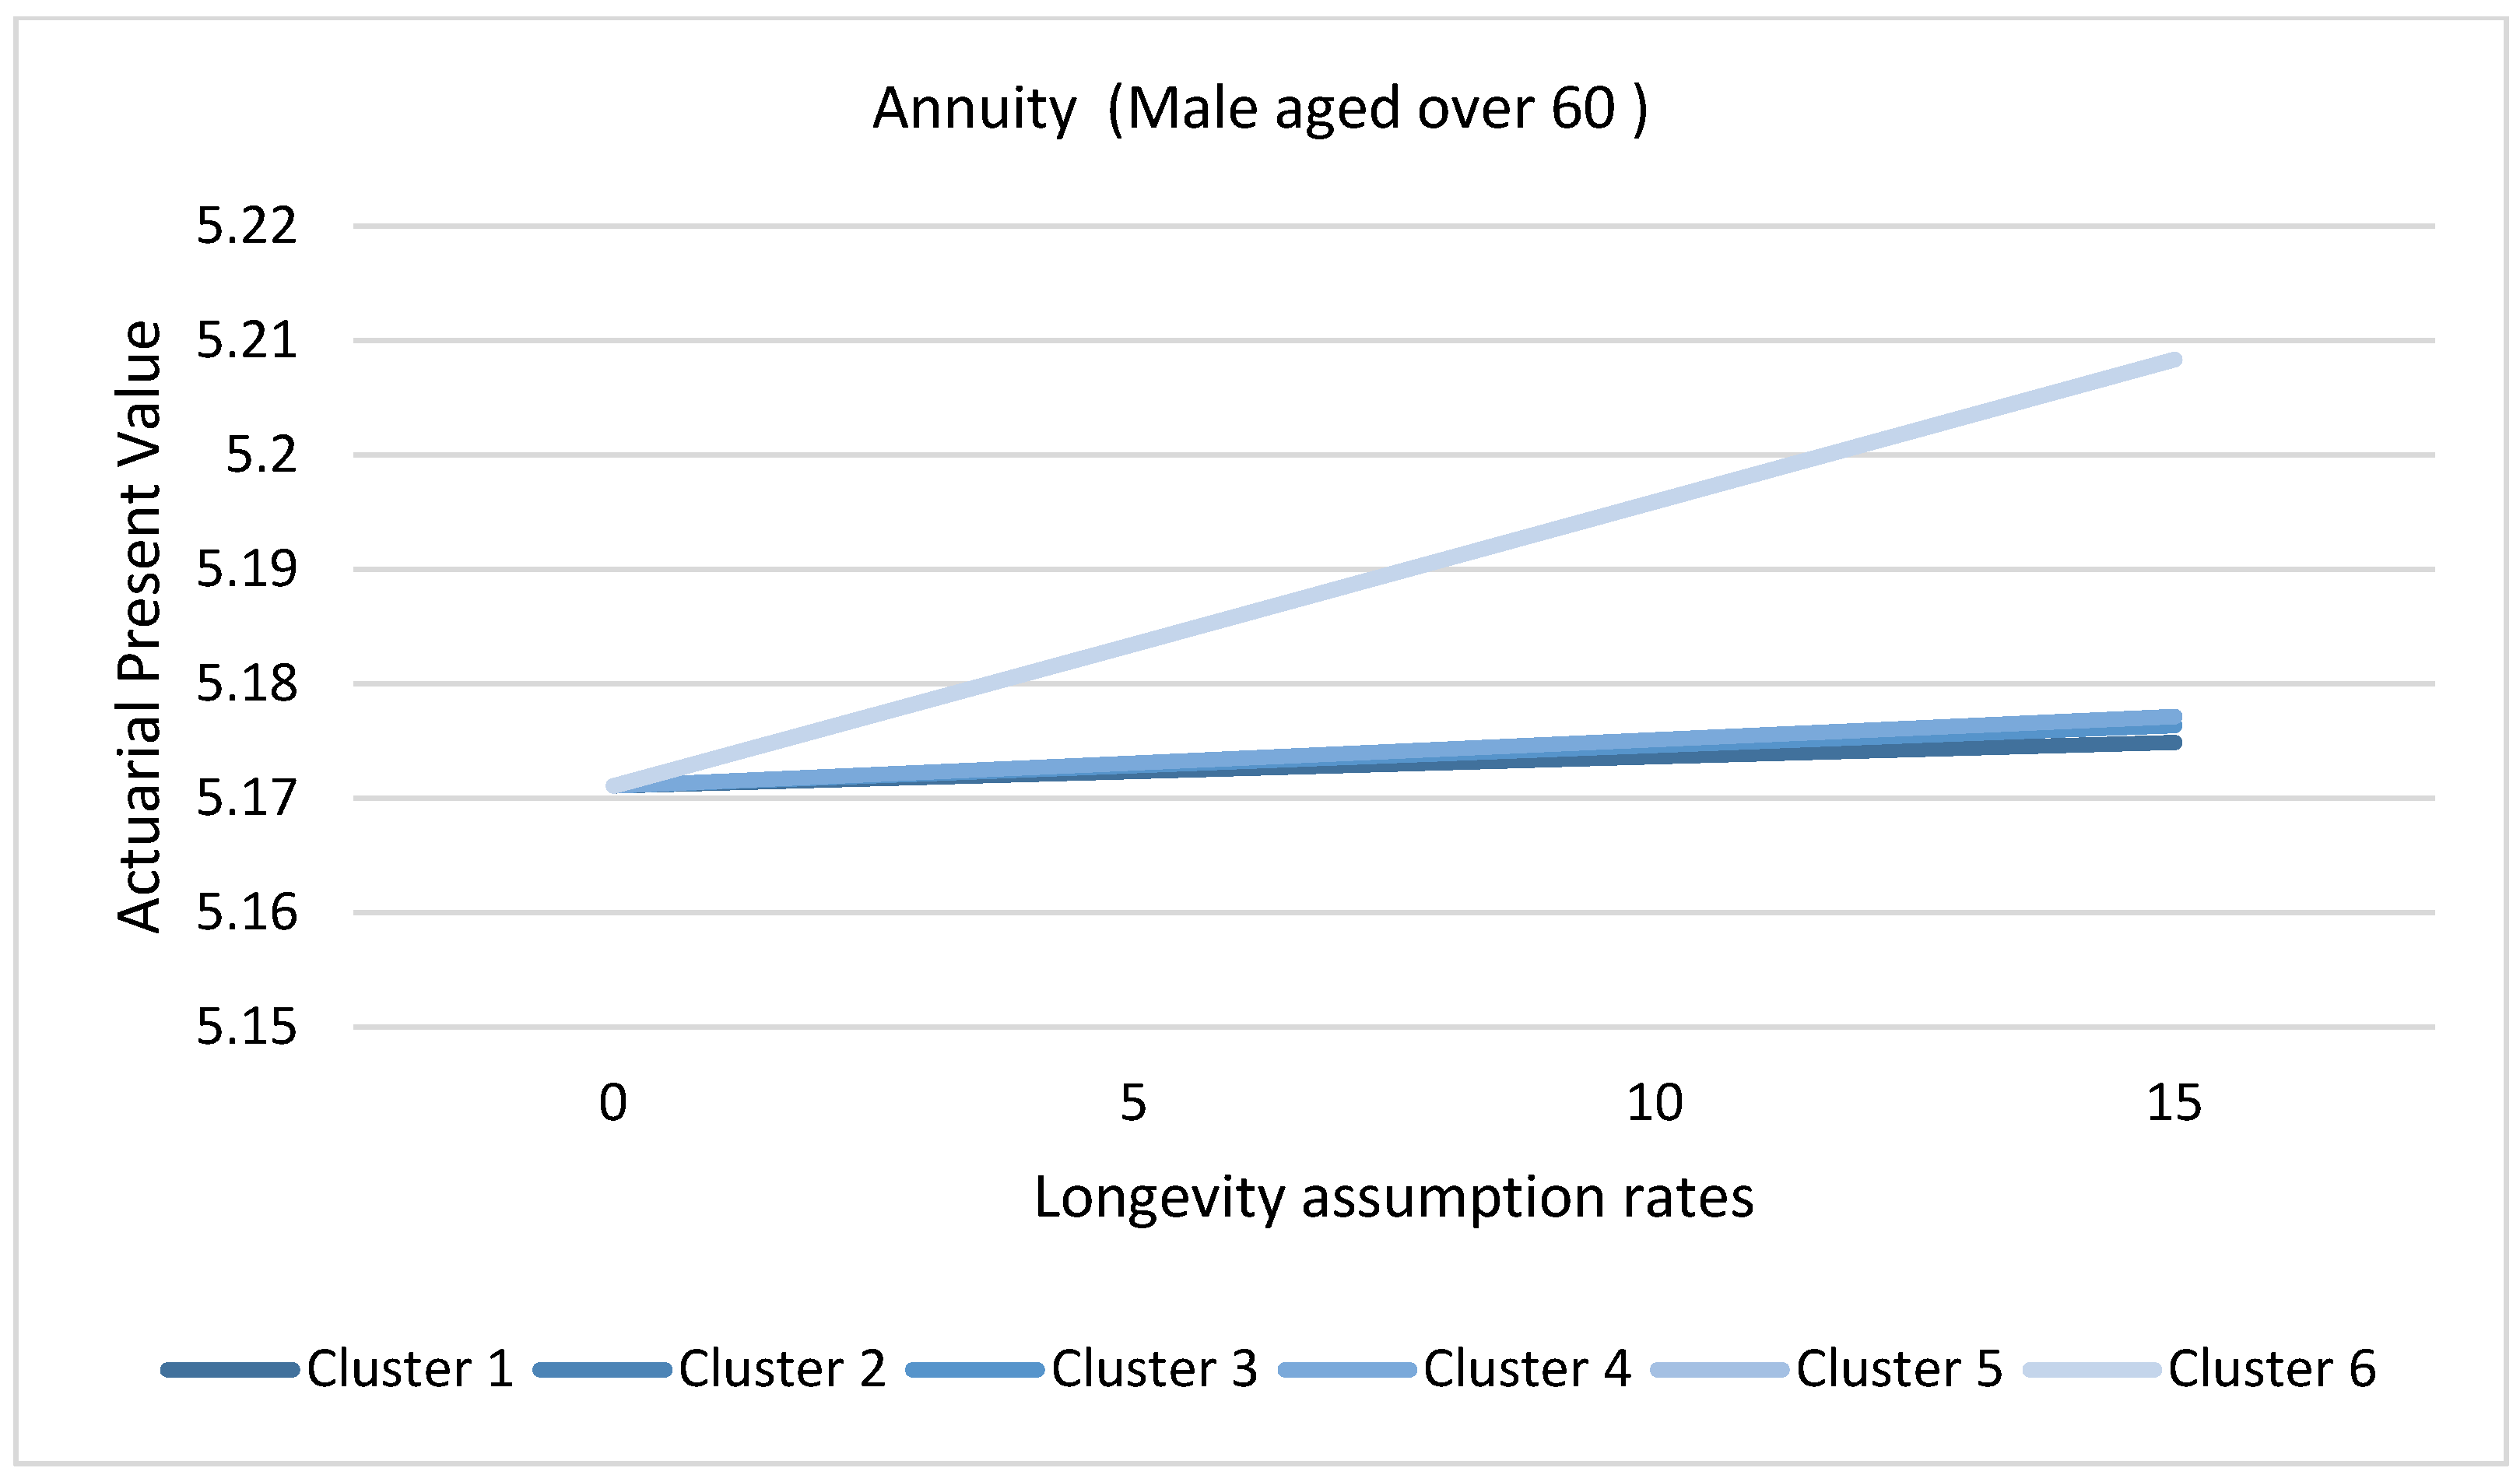
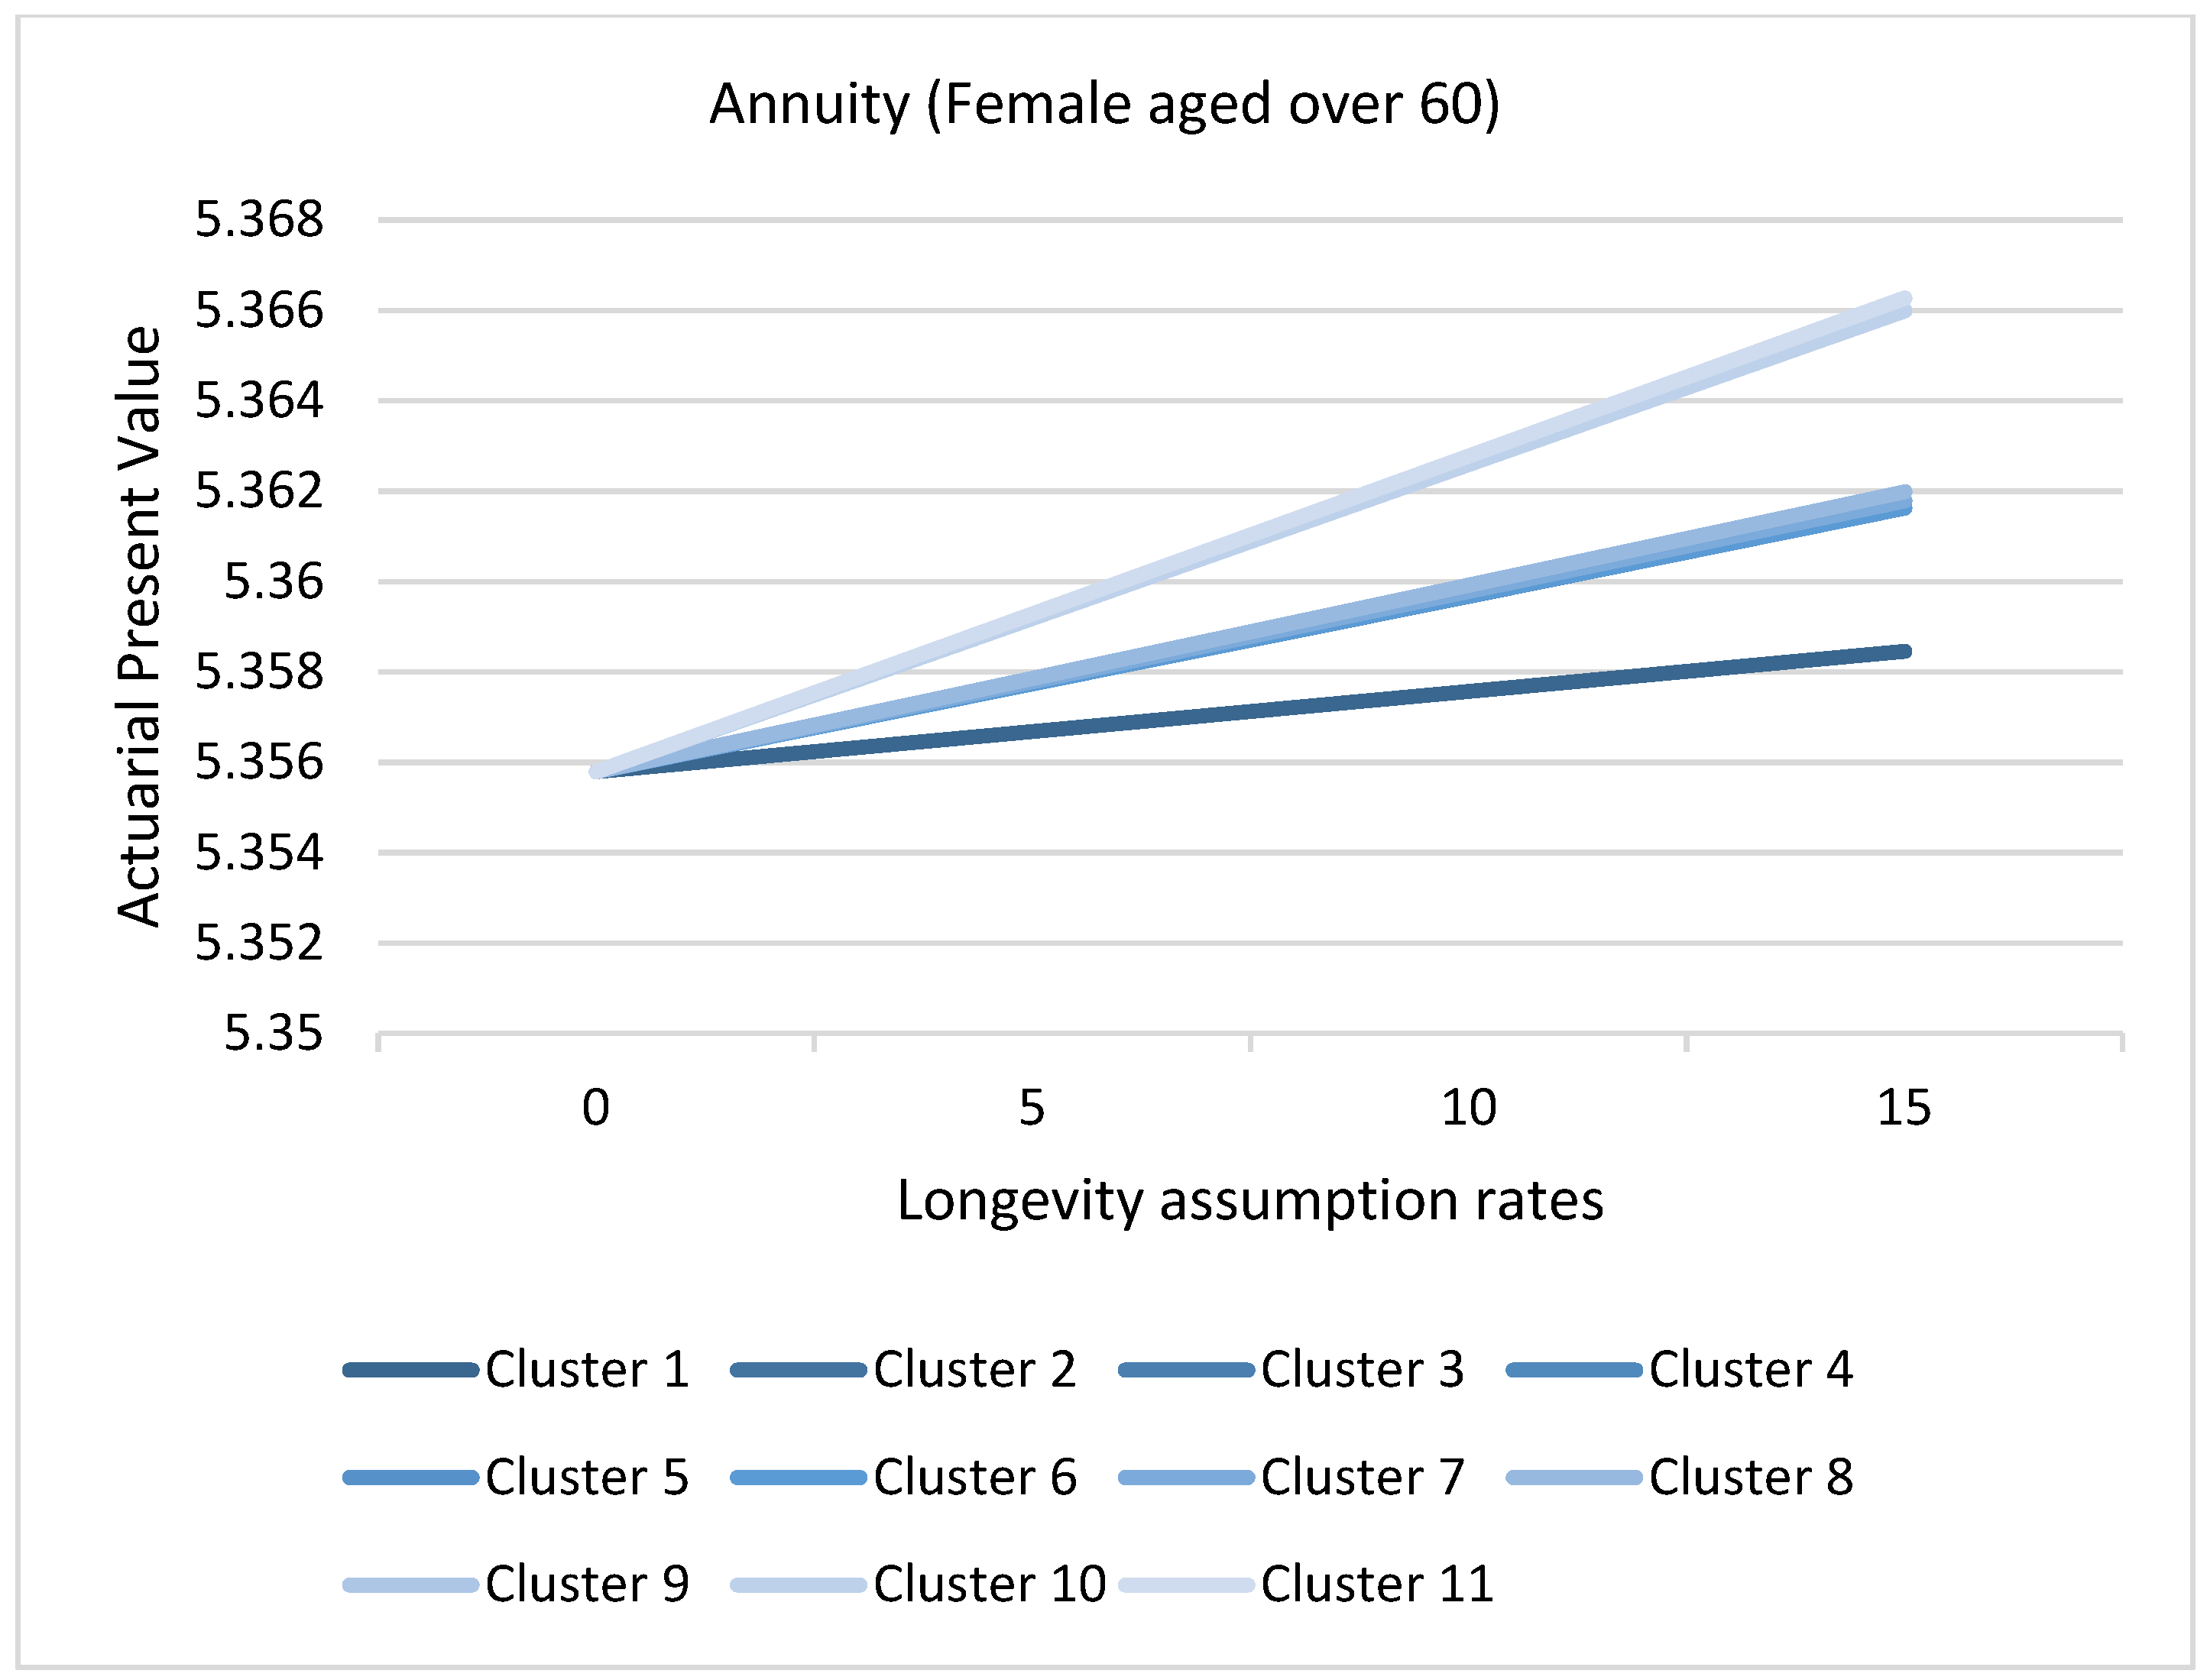
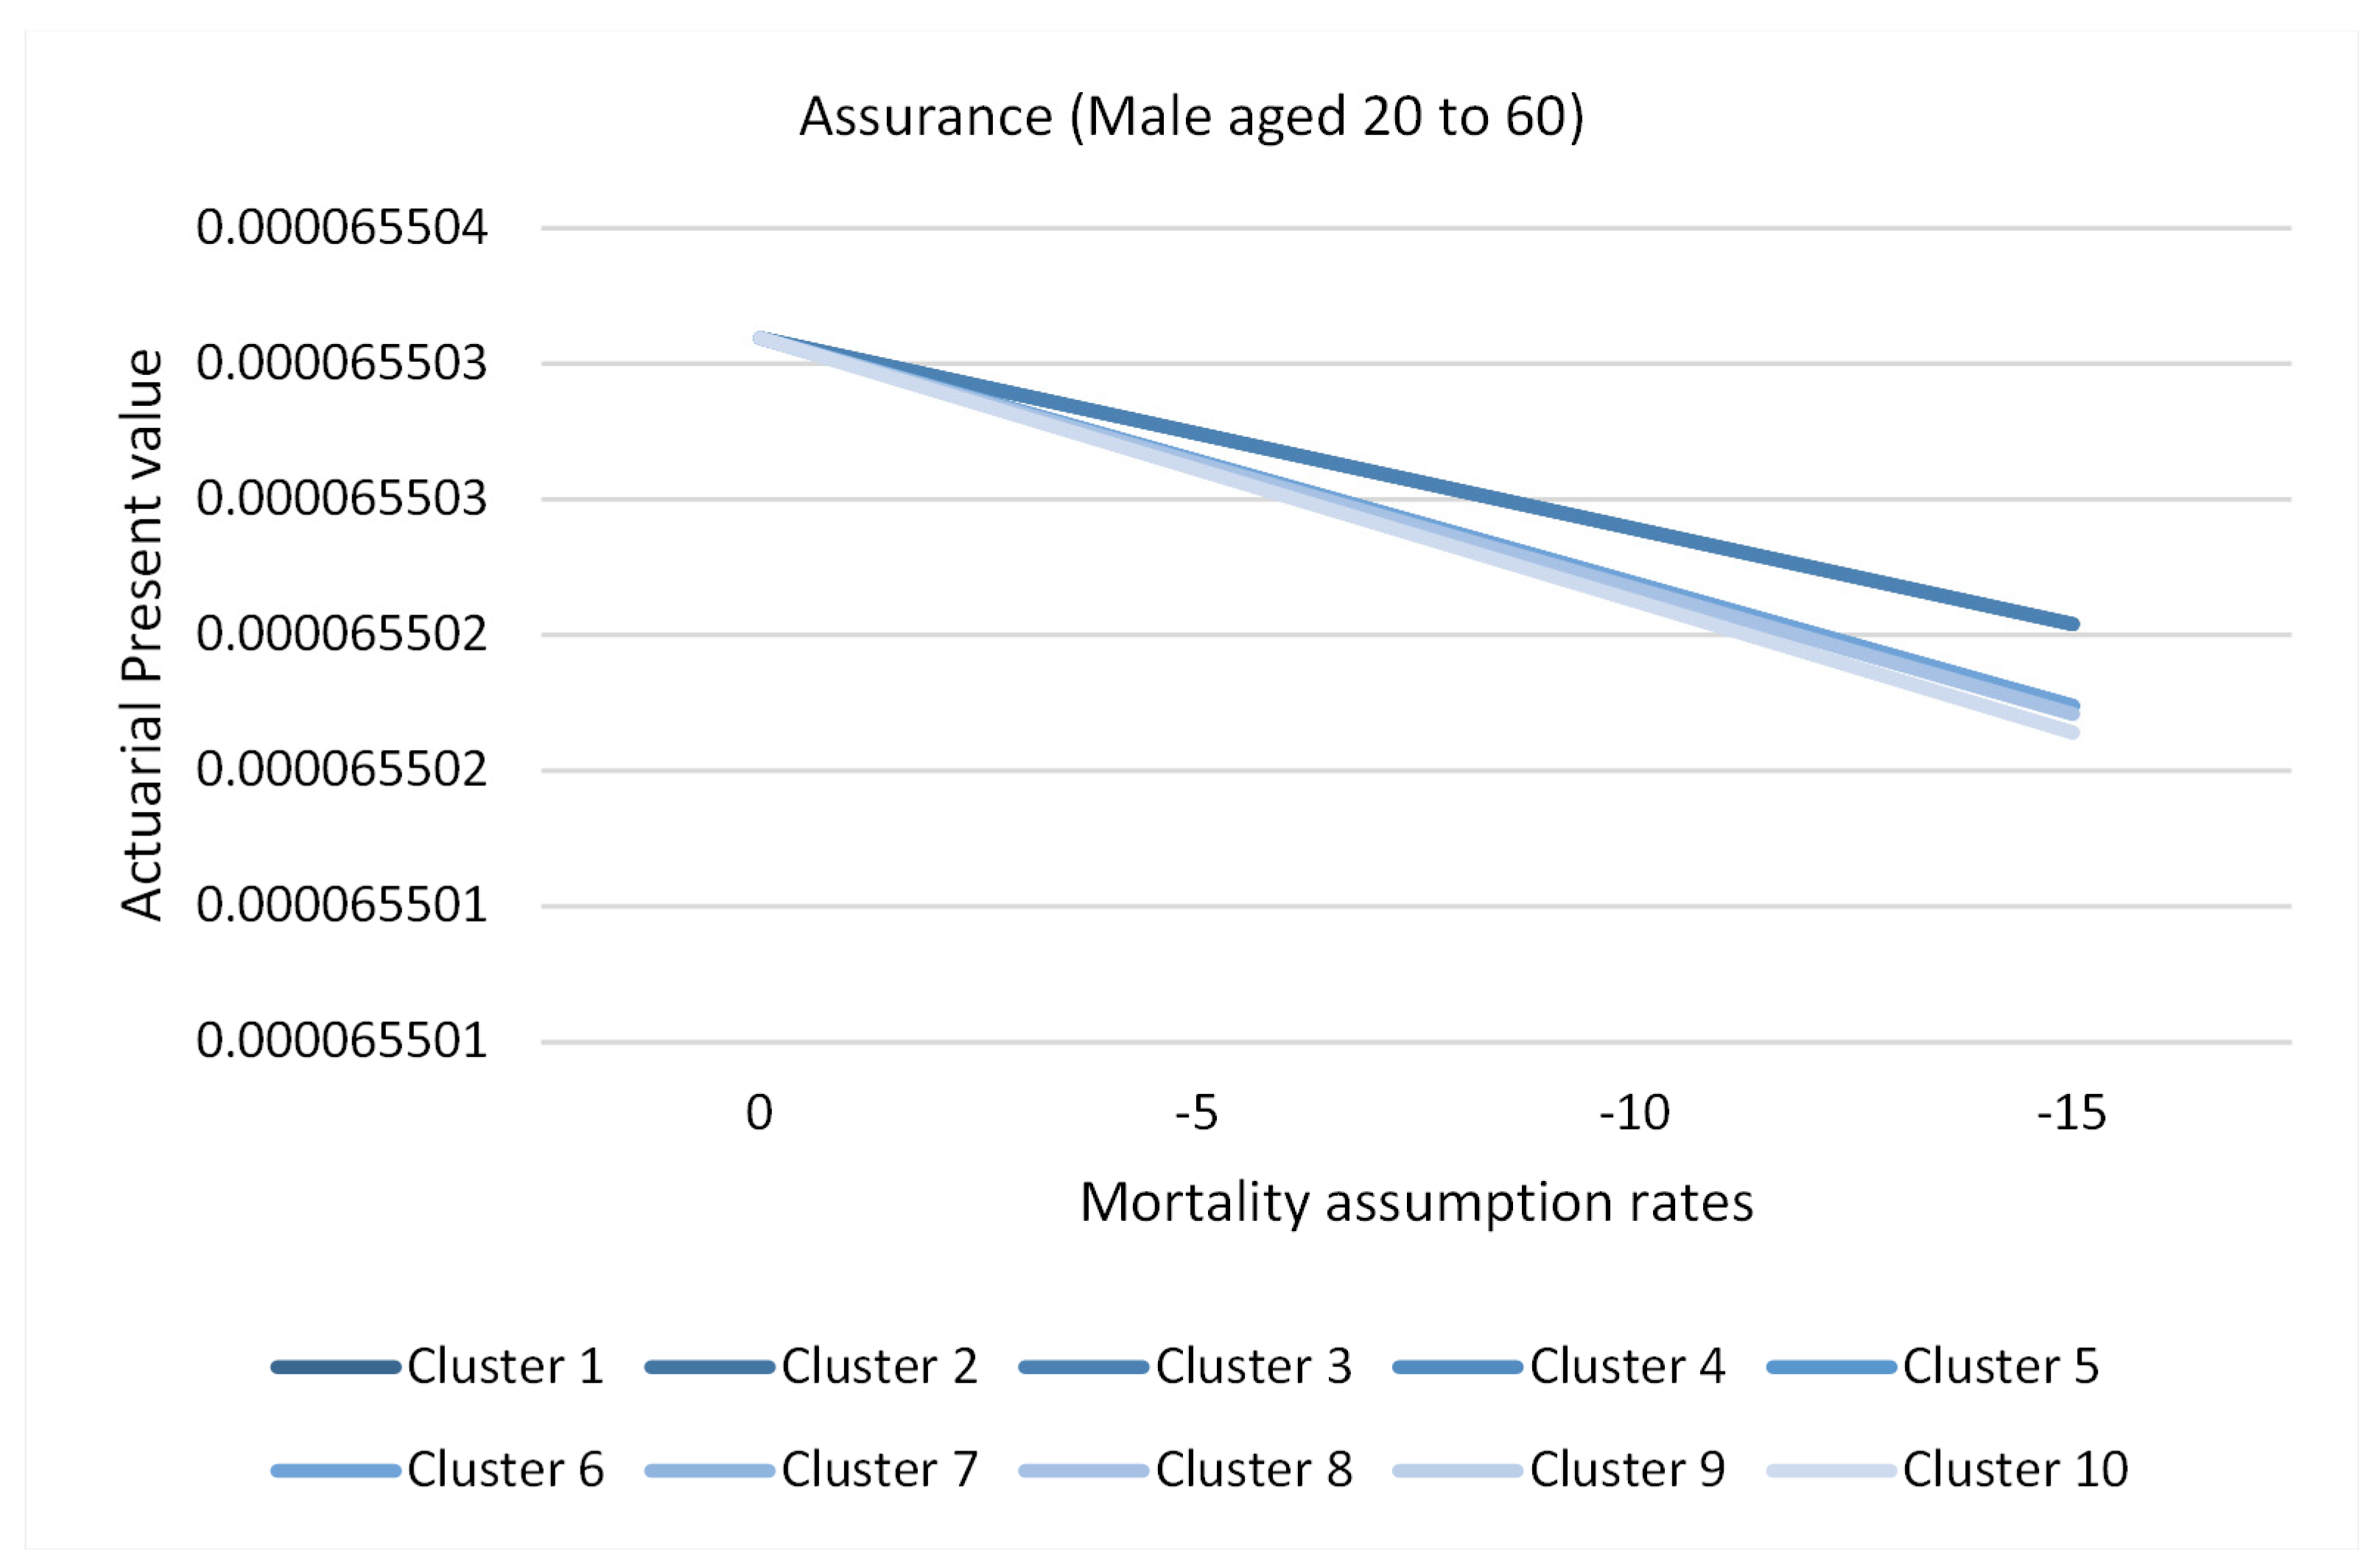
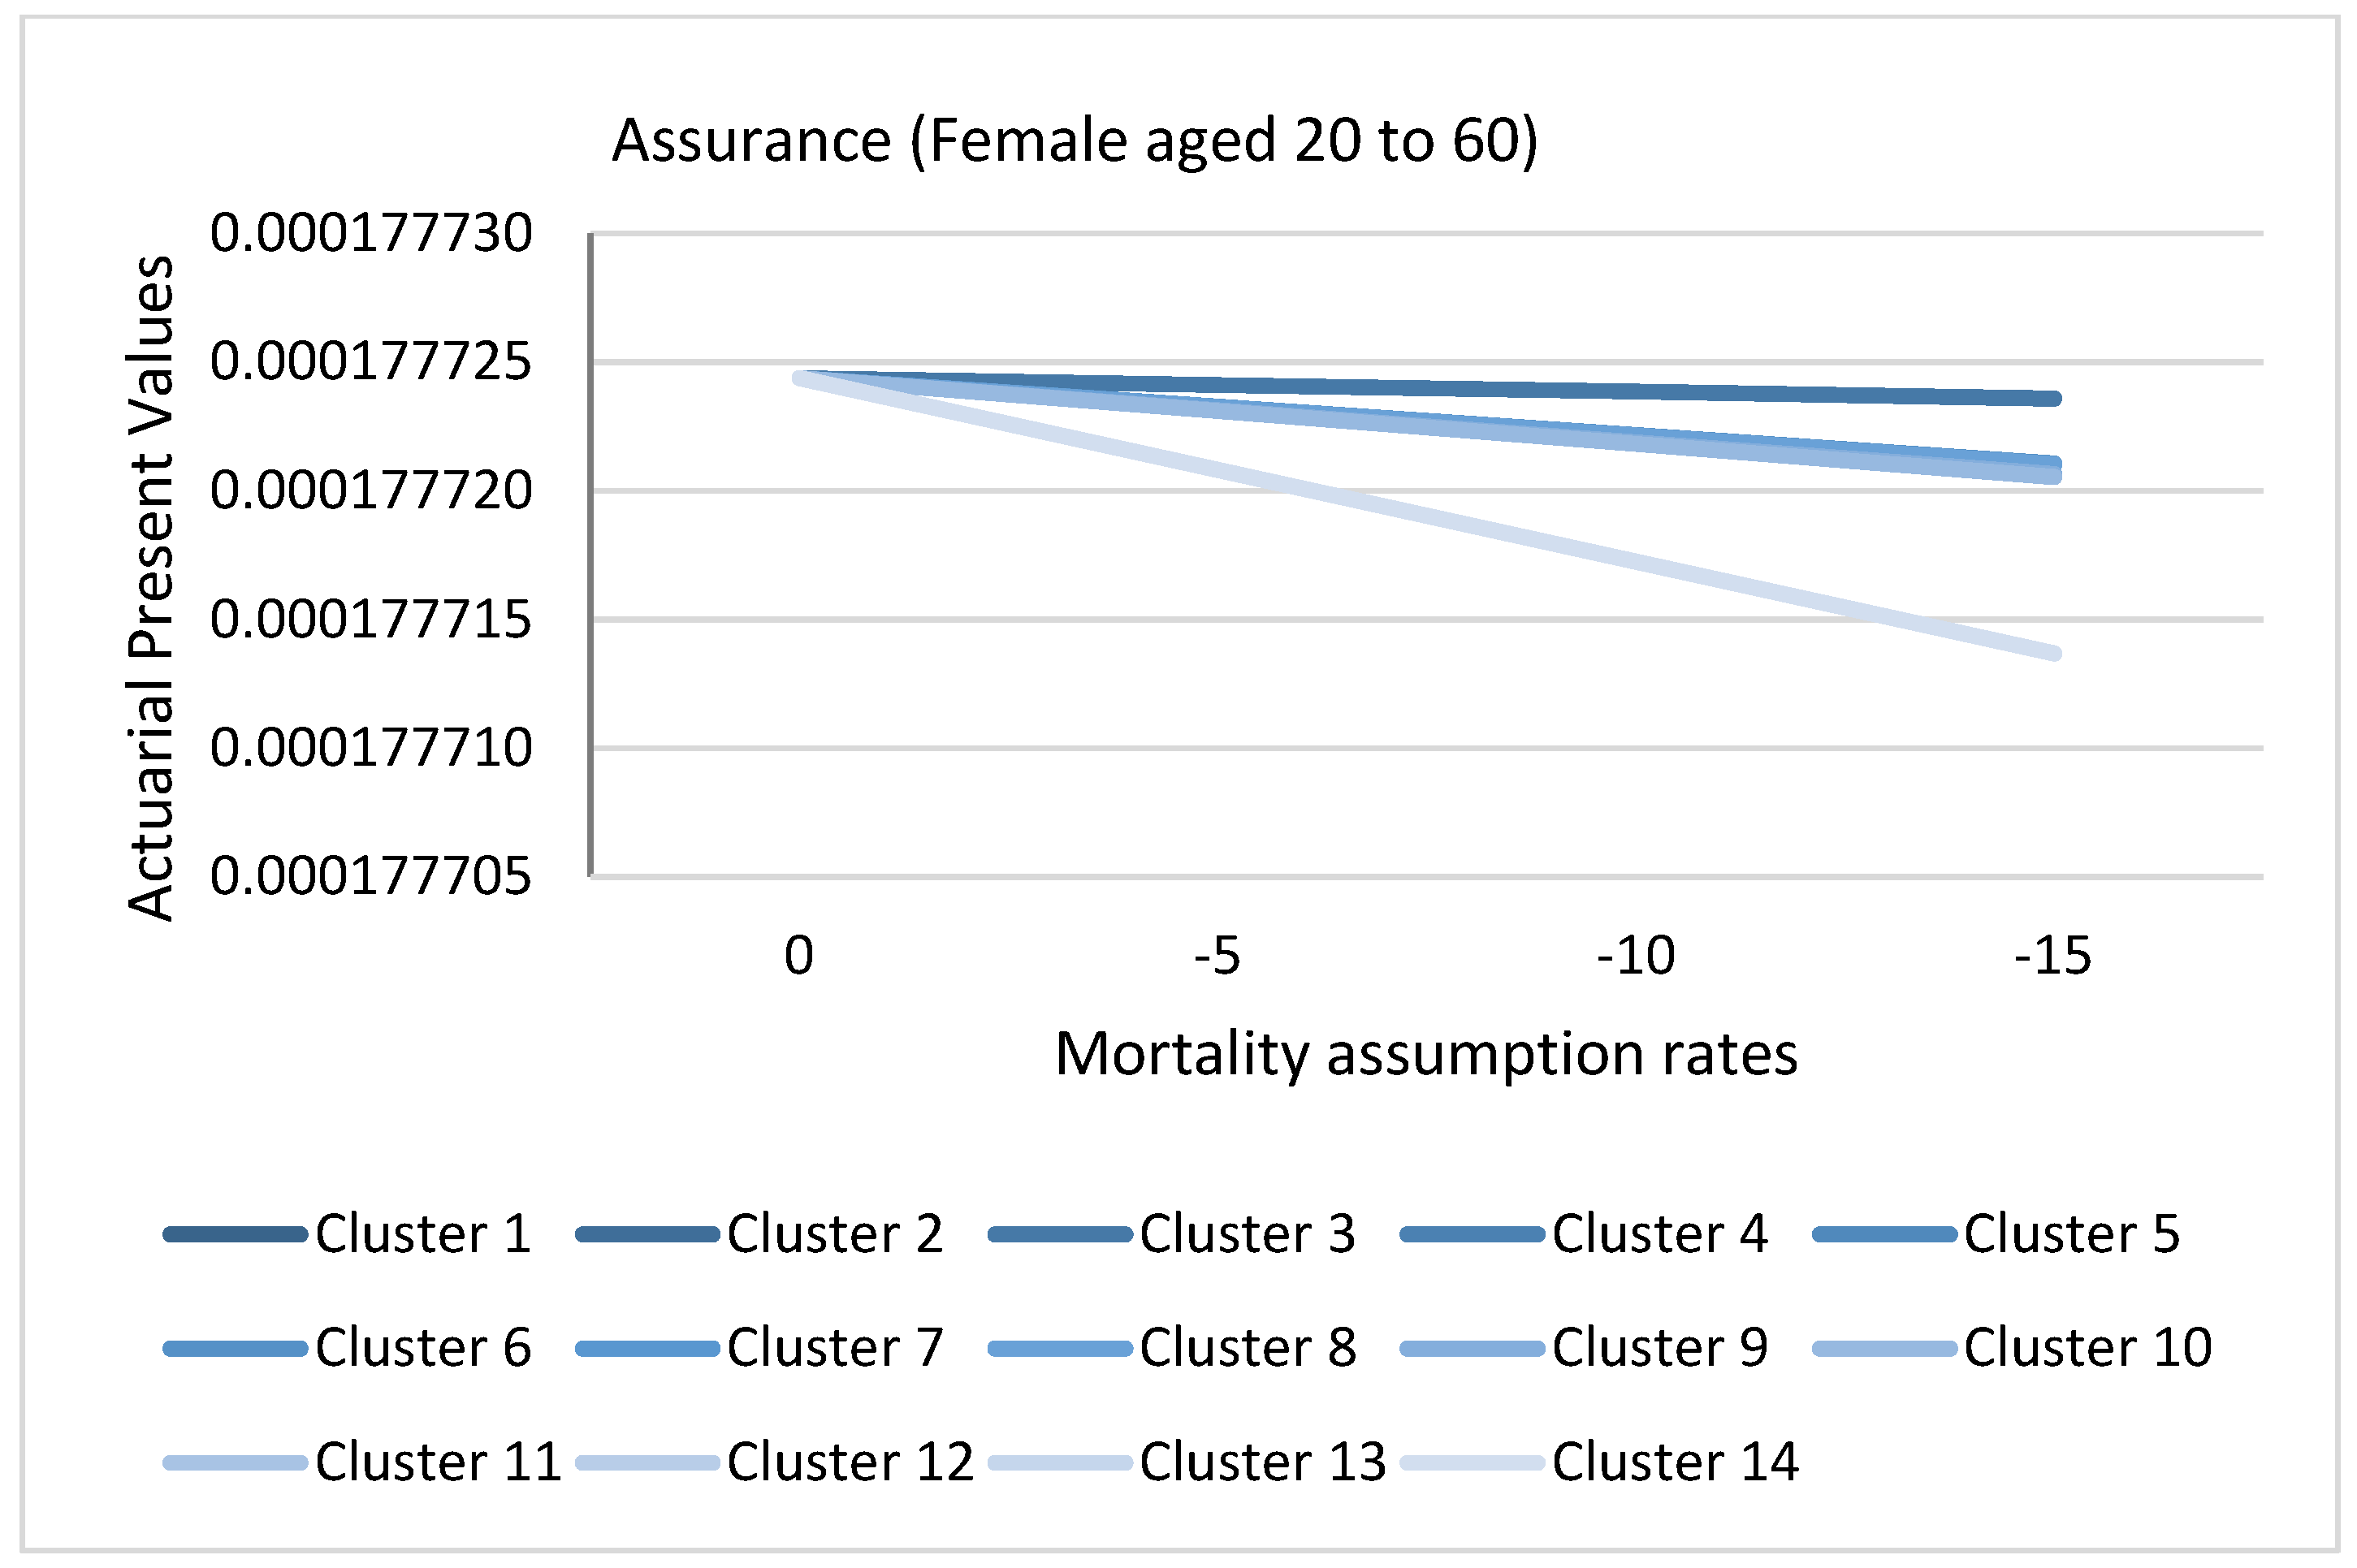
Figure 20 and Figure 21 represents the actuarial present values of a hypothetical annuity for males and females aged over 60, grouped by clusters as formulated in the methods section. The lowest APV is given by cluster 1. This result represents causes of death that have a more significant impact on longevity risk for males and females aged above 60, that is, causes that depict declining trends as shown for each given longevity assumption rate. Eliminating cluster 1 contracts the APV significantly because it quantifies future expectations based on the longevity assumption. However, eliminating cluster 6 for males and eleven for females has the least significance. Consequently, the reduction of reserves would be underestimated. Notice that the APV is more affected by the clusters than the longevity assumption rates shown by the slopes, implying the importance of monitoring the causes of death. Figure 22 and Figure 23 represent the actuarial present values of a hypothetical assurance for males and females aged 20 to 60 grouped by clusters. The highest APV is represented by cluster 1. This is because cluster 1 contains downward trending cluster causes that reduce the risk of mortality in the future; hence, the removal of these cluster for both males and females results in a higher APV. Conversely, elimination of cluster 4 for females aged 20 to 60 would result in a lower APV. This is attributable to removing the causes with the highest risk of mortality in the future, thereby reducing APV and consequently the reserves. From the finding, the APV is more affected by the clusters than the mortality assumption rates.
3.8. Application of Causes of Death Cluster Results in Actuarial Literature
The partition of the two age brackets of 20 to 60 years and over 60 years defines the two demographic structures of a population (young and old) and the two age sets that are eligible for insurance and pensions (working and retired) in the majority of jurisdictions. Mortality and longevity risks are usually defined in the context of age and gender. Insurance and pension firms are more concerned with the risk of mortality among the young and the risk of longevity among the old, as mentioned by Brouhns et al. (2002). Actuaries in life insurance and pension companies set out mortality change factors, called mortality or longevity assumption rates, based on regulatory frameworks, for our case, the 10% actuarial judgements and derivation from published tables. Assumptions of mortality improvement or deterioration by the actuary are subjective based on expert opinion and objective through extrapolating historical trends. Therefore, a complementary application of this methodology is sensible in narrowing these two types of analyses by using optimal representative clusters in defining mortality trends based on these classifications.
3.9. Limitations of the Study
One of the study’s main limitations is using the assumption of independence of the causes of death (Arnold and Glushko 2021; Chiang 1968). In practice, causes of death are correlated and exhibit co-integration tendencies. This study may be extended by incorporating approaches that consider the relaxation of this assumption before clustering.
4. Conclusions
A temporal clustering approach explored causes of death for 20 years based on age, sex, and period. The study aimed to obtain key clusters in the context of these three features. The hierarchical agglomerative clustering approach was applied using a Dynamic Time Warping distance criterion with a barycenter averaging modification. Objectively, 11 and 14 clusters were obtained amongst older and younger females, respectively, while ten and six were detected in males, the younger and the older, respectively. The clustering quality was assessed by applying the internal validity index measurement of the seven CVI indices.
Regarding age, period, and sex, the causes of death were classified based on the trending clusters; upward, downward, outlier, and insignificant were achieved. In combination with other mortality models, this approach may be incorporated in identifying trends in causes of death features and monitoring future evolution of mortality and longevity assumption rates for pricing and valuations in insurance and pension offices.
Due to the dynamism and nature of the causes of death over time, it is essential that clustering be undertaken periodically to update the changes of classifications. As a further study, risk factors that result in these causes of death may be incorporated into the causes of deaths, such as alcohol use, smoking status, obesity, etc., to understand the patterns of these causes of death. Furthermore, the trend increase or decline rate has not been established and could be an area of further study.
Author Contributions
Conceptualization, N.B., J.K. and D.R.; methodology, N.B., J.K. and D.R.; software, N.B.; validation, N.B., J.K. and D.R.; formal analysis, N.B.; investigation, N.B.; resources, J.K. and D.R.; data curation, N.B.; writing—original draft, N.B.; writing—review, J.K. and D.R.; visualization, N.B.; supervision, J.K. and D.R.; project administration, N.B.; funding acquisition, N.B. All authors have read and agreed to the published version of the manuscript.
Funding
This research was funded by the African Center of Excellence in Data Science (ACE-DS) and the University of Rwanda.
Data Availability Statement
The data that support the findings of this study are available from https://www.who.int/data/gho/data/themes/mortality-and-global-health-estimates/ghe-leading-causes-of-death (accessed on 1 December 2021).
Acknowledgments
Nicholas Bett wishes to thank the African Center of Excellence in Data Science (ACE-DS) for funding this research.
Conflicts of Interest
The authors declare no conflict of interest.
Appendix A

Table A1.
GHE Cause Categories and ICD-10 Codes.
| GHE Code | Cause Name | ICD-10 Codes |
|---|---|---|
| 10 | I. Communicable, maternal, perinatal, and nutritional conditions | A00—B99, D50—D53, D64.9, E00—E02, E40—E46, E50—E64, G00—G04, G14, H65—H66, J00—J22, N70—N73, O00—O99, P00—P96, U04 |
| 20 | A. Infectious and parasitic diseases | A00—B99, G00—G04, G14, N70—N73, P37.3, P37.4 |
| 30 | 1. Tuberculosis | A15—A19, B90 |
| 40 | 2. STDs excluding HIV | A50—A64, N70—N73 |
| 50 | a. Syphilis | A50—A53 |
| 60 | b. Chlamydia | A55—A56 |
| 70 | c. Gonorrhoea | A54 |
| 80 | d. Trichomoniasis | A59 |
| 85 | e. Genital herpes | A60 |
| 90 | f. Other STDs | A57—A58, A63—A64, N70—N73 |
| 100 | 3. HIV/AIDS | B20—B24 |
| 101 | a. HIV resulting in TB | B20.0 |
| 102 | b. HIV resulting in other diseases | B20—B24 (minus B20.0) |
| 110 | 4. Diarrheal diseases | A00, A01, A03, A04, A06—A09 |
| 120 | 5. Childhood-cluster diseases | A33—A37, B05 |
| 130 | a. Whooping cough | A37 |
| 140 | b. Diphtheria | A36 |
| 150 | c. Measles | B05 |
| 160 | d. Tetanus | A33—A35 |
| 170 | 6. Meningitis | A39, G00, G03 |
| 180 | 7. Encephalitis | A83—A86, B94.1, G04 |
| 185 | 8. Hepatitis | B15—B19 (minus B17.8) |
| 186 | a. Acute hepatitis A | B15 |
| 190 | b. Acute hepatitis B | B16—B19 (minus B17.1, B17.2, B18.2, B18.8) |
| 200 | c. Acute hepatitis C | B17.1, B18.2 |
| 205 | d. Acute hepatitis E | B17.2, B18.8 |
| 210 | 9. Parasitic and vector diseases | A71, A82, A90—A91, A95, B50—B57, B65, B67, B69, B73, B74.0—B74.2, P37.3—P37.4 |
| 220 | a. Malaria | B50—B54, P37.3, P37.4 |
| 230 | b. Trypanosomiasis | B56 |
| 240 | c. Chagas disease | B57 |
| 250 | d. Schistosomiasis | B65 |
| 260 | e. Leishmaniasis | B55 |
| 270 | f. Lymphatic filariasis | B74.0—B74.2 |
| 280 | g. Onchocerciasis | B73 |
| 285 | h. Cysticercosis | B69 |
| 295 | i. Echinococcosis | B67 |
| 300 | j. Dengue | A90—A91 |
| 310 | k. Trachoma | A71 |
| 315 | l. Yellow fever | A95 |
| 320 | m. Rabies | A82 |
| 330 | 10. Intestinal nematode infections | B76—B81 |
| 340 | a. Ascariasis | B77 |
| 350 | b. Trichuriasis | B79 |
| 360 | c. Hookworm disease | B76 |
| 362 | d. Food-bourne trematodes | B78, B80, B81 |
| 365 | 11. Leprosy | A30 |
| 370 | 12. Other infectious diseases | A02, A05, A20—A28, A31, A32, A38, A40—A49, A65—A70, A74—A79, A80—A81, A87—A89, A92—A99, B00—B04, B06—B09, B17.8, B25—B49, B58—B60, B64, B66, B68, B70—B72, B74.3—B74.9, B75, B82—B89, B91—B99 (minus B94.1), G14 |
| 380 | B. Respiratory infectious | H65—H66, J00—J22, P23, U04 |
| 390 | 1. Lower respiratory infections | J09—J22, P23, U04 |
| 400 | 2. Upper respiratory infections | J00—J06 |
| 410 | 3. Otitis media | H65—H66 |
| 420 | C. Maternal conditions | O00—O99 |
| 490 | D. Neonatal conditions | P00—P96 (minus P23, P37.3, P37.4) |
| 500 | 1. Preterm birth complications | P05, P07, P22, P27—P28 |
| 510 | 2. Birth asphyxia and birth trauma | P03, P10—P15, P20—P21, P24—P26, P29 |
| 520 | 3. Neonatal sepsis and infections | P35—P39 (minus P37.3, P37.4) |
| 530 | 4. Other neonatal conditions | P00—P02, P04, P08, P50—P96 |
| 540 | E. Nutritional deficiencies | D50—D53, D64.9, E00—E02, E40—E46, E50—E64 |
| 550 | 1. Protein-energy malnutrition | E40—E46 |
| 560 | 2. Iodine deficiency | E00—E02 |
| 570 | 3. Vitamin A deficiency | E50 |
| 580 | 4. Iron-deficiency anemia | D50, D64.9 |
| 590 | 5. Other nutritional deficiencies | D51—D53, E51—E64 |
| 600 | II. Non-communicable diseases | C00—C97, D00—D48, D55—D64 (minus D 64.9), D65—D89, E03—E07, E10—E34, E65—E88, F01—F99, G06—G98 (minus G14), H00—H61, H68—H93, I00—I99, J30—J98, K00—K92, L00—L98, M00—M99, N00—N64, N75—N98, Q00—Q99, X41—X42, X44, X45, R95 |
| 610 | A. Malignant neoplasms c | C00—C97 |
| 620 | 1. Mouth and oropharynx cancers | C00—C14 |
| 621 | a. Lip and oral cavity | C00—C08 |
| 622 | b. Nasopharynx | C11 |
| 623 | c. Other pharynx | C09—C10, C12—C14 |
| 630 | 2. Esophagus cancer | C15 |
| 640 | 3. Stomach cancer | C16 |
| 650 | 4. Colon and rectum cancers | C18—C21 |
| 660 | 5. Liver cancer | C22 |
| 670 | 6. Pancreas cancer | C25 |
| 680 | 7. Trachea, bronchus, lung cancers | C33—C34 |
| 690 | 8. Melanoma and other skin cancers | C43—C44 |
| 691 | a. Malignant skin melanoma | C43 |
| 692 | b. Non-melanoma skin cancer | C44 |
| 700 | 9. Breast cancer | C50 |
| 710 | 10. Cervix uteri cancer | C53 |
| 720 | 11. Corpus uteri cancer | C54 |
| 730 | 12. Ovary cancer | C56 |
| 740 | 13. Prostate cancer | C61 |
| 742 | 14. Testicular cancer | C62 |
| 745 | 15. Kidney, renal pelvis, and ureter cancer | C64—C66 |
| 750 | 16. Bladder cancer | C67 |
| 751 | 17. Brain and nervous system cancers | C70—C72 |
| 752 | 18. Gallbladder and biliary tract cancer | C23—C24 |
| 753 | 19. Larynx cancer | C32 |
| 754 | 20. Thyroid cancer | C73 |
| 755 | 21. Mesothelioma | C45 |
| 760 | 22. Lymphomas, multiple myeloma | C81—C90, C96 |
| 761 | a. Hodgkin lymphoma | C81 |
| 762 | b. Non-Hodgkin lymphoma | C82—C86, C96 |
| 763 | c. Multiple myeloma | C88, C90 |
| 770 | 23. Leukemia | C91—C95 |
| 780 | 24. Other malignant neoplasms | C17, C26—C31, C37—C41, C46—C49, C51, C52, C57—C60, C63, C68, C69, C74—C75, C77—C79 |
| 790 | B. Other neoplasms | D00—D48 |
| 800 | C. Diabetes mellitus | E10—E14 (minus E10.2, E11.2, E12.2, E13.2, E14.2) |
| 810 | D. Endocrine, blood, immune disorders | D55—D64 (minus D64.9), D65—D89, E03—E07, E15—E34, E65—E88 |
| 811 | 1. Thalassemias | D56 |
| 812 | 2. Sickle cell disorders and trait | D57 |
| 813 | 3. Other hemoglobinopathies and hemolytic anemias | D55, D58—D59 |
| 814 | 4. Other endocrine, blood, and immune disorders | D60—D64 (minus D64.9), D65—D89, E03—E07, E15—E34, E65—E88 |
| 820 | E. Mental and substance use disorders | F04—F99, G72.1, Q86.0, X41—X42, X44, X45 |
| 830 | 1. Depressive disorders | F32—F33, F34.1 |
| 831 | a. Major depressive disorder | F32—F33 |
| 832 | b. Dysthymia | F34.1 |
| 840 | 2. Bipolar disorder | F30—F31 |
| 850 | 3. Schizophrenia | F20—F29 |
| 860 | 4. Alcohol-use disorders | F10, G72.1, Q86.0, X45 |
| 870 | 5. Drug-use disorders | F11—F16, F18—F19d, X41—X42, X44d |
| 871 | a. Opioid use disorders | F11, X42 |
| 872 | b. Cocaine use disorders | F14 |
| 873 | c. Amphetamine use disorders | F15 |
| 874 | d. Cannabis use disorders | F12 |
| 875 | e. Other drug use disorders | F13, F16, F18, X41 |
| 880 | 6. Anxiety disorders | F40—F44 |
| 890 | 7. Eating disorders | F50 |
| 900 | 8. Autism and Asperger syndrome | F84 |
| 910 | 9. Childhood behavioral disorders | F90—F92 |
| 911 | a. Attention deficit/hyperactivity syndrome | F90 |
| 912 | b. Conduct disorder | F91—F92 |
| 920 | 10. Idiopathic intellectual disability | F70—F79 |
| 930 | 11. Other mental and behavioral disorders | F04—F09, F17, F34—F39 (minus F34.1), F45—F48, F51—F69, F80—F83, F88—F89, F93—F99 |
| 940 | F. Neurological conditions | F01—F03, G06—G98 (minus G14, G72.1) |
| 950 | 1. Alzheimer disease and other dementias | F01—F03, G30—G31 |
| 960 | 2. Parkinson disease | G20—G21 |
| 970 | 3. Epilepsy | G40—G41 |
| 980 | 4. Multiple sclerosis | G35 |
| 990 | 5. Migraine | G43 |
| 1000 | 6. Non-migraine headache | G44 |
| 1010 | 7. Other neurological conditions | G06—G12, G23—G25, G36—G37, G45—G98 (minus G72.1) |
| 1020 | G. Sense organ diseases | H00—H61, H68—H93 |
| 1030 | 1. Glaucoma | H40 |
| 1040 | 2. Cataracts | H25—H26 |
| 1050 | 3. Uncorrected refractive errors | H49—H52 |
| 1060 | 4. Macular degeneration | H35.3 |
| 1070 | 5. Other vision loss | H30—H35 (minus H35.3), H53—H54 |
| 1080 | 6. Other hearing loss | H90—H91 |
| 1090 | 7. Other sense organ disorders | H00—H21, H27, H43—H47, H55—H61, H68—H83, H92—H93 |
| 1100 | H. Cardiovascular diseases | I00—I99 |
| 1110 | 1. Rheumatic heart disease | I01—I09 |
| 1120 | 2. Hypertensive heart disease | I11—I15 |
| 1130 | 3. Ischemic heart disease | I20—I25 |
| 1140 | 4. Stroke | I60—I69 |
| 1150 | 5. Cardiomyopathy, myocarditis, endocarditis | I30—I33, I38, I40, I42 |
| 1160 | 6. Other circulatory diseases | I00, I26—I28, I34—I37, I44—I51, I70—I99 |
| 1170 | I. Respiratory diseases | J30—J98 |
| 1180 | 1. Chronic obstructive pulmonary disease | J40—J44 |
| 1190 | 2. Asthma | J45—J46 |
| 1200 | 3. Other respiratory diseases | J30—J39, J47—J98 |
| 1210 | J. Digestive diseases | K20—K92 |
| 1220 | 1. Peptic ulcer disease | K25—K27 |
| 1230 | 2. Cirrhosis of the liver | K70, K74 |
| 1240 | 3. Appendicitis | K35—K37 |
| 1241 | 4. Gastritis and duodenitis | K29 |
| 1242 | 5. Paralytic ileus and intestinal obstruction | K56 |
| 1244 | 6. Inflammatory bowel disease | K50—K52, K58.0 |
| 1246 | 7. Gallbladder and biliary diseases | K80—K83 |
| 1248 | 8. Pancreatitis | K85—K86 |
| 1250 | 9. Other digestive diseases | K20—K22, K28, K30—K31, K38, K40—K46, K55, K57, K58.9, K59—K66, K71—K73, K75—K76, K90—K92 |
| 1260 | K. Genitourinary diseases | E10.2—E10.29, E11.2—E11.29, E12.2, E13.2—E13.29, E14.2, N00—N64, N75—N76, N80—N98 |
| 1270 | 1. Kidney diseases | N00—N19, E10.2, E11.2, E12.2, E13.2, E14.2 |
| 1271 | a. Acute glomerulonephritis | N00—N01 |
| 1272 | b. Chronic kidney disease due to diabetes | E10.2, E11.2, E12.2, E13.2, E14.2 |
| 1273 | c. Other chronic kidney disease | N02—N19 |
| 1280 | 2. Benign prostatic hyperplasia | N40 |
| 1290 | 3. Urolithiasis | N20—N23 |
| 1300 | 4. Other urinary diseases | N25—N39, N41—N45, N47—N51 |
| 1310 | 5. Infertility | N46, N97 |
| 1320 | 6. Gynecological diseases | N60—N64, N75—N76, N80—N96, N98 |
| 1330 | L. Skin diseases | L00—L98 |
| 1340 | M. Musculoskeletal diseases | M00—M99 |
| 1350 | 1. Rheumatoid arthritis | M05—M06 |
| 1360 | 2. Osteoarthritis | M15—M19 |
| 1370 | 3. Gout | M10 |
| 1380 | 4. Back and neck pain | M45—M48, M50—M54 |
| 1390 | 5. Other musculoskeletal disorders | M00, M02, M08, M11—M13, M20—M43, M60—M99 |
| 1400 | N. Congenital anomalies | Q00—Q99 (minus Q86.0) |
| 1410 | 1. Neural tube defects | Q00, Q05 |
| 1420 | 2. Cleft lip and cleft palate | Q35—Q37 |
| 1430 | 3. Down syndrome | Q90 |
| 1440 | 4. Congenital heart anomalies | Q20—Q28 |
| 1450 | 5. Other chromosomal anomalies | Q91—Q99 |
| 1460 | 6. Other congenital anomalies | Q01—Q04, Q06—Q18, Q30—Q34, Q38—Q89 (excluding Q86.0) |
| 1470 | O. Oral conditions | K00—K14 |
| 1480 | 1. Dental caries | K02 |
| 1490 | 2. Periodontal disease | K05 |
| 1500 | 3. Edentulism | — |
| 1502 | 4. Other oral disorders | K00, K01, K03, K04, K06—K14 |
| 1505 | P. Sudden infant death syndrome | R95 |
| 1510 | III. Injuries | V01—Y89 (minus X41—X42, X44, X45) |
| 1520 | A. Unintentional injuries | V01—X40, X43, X46—59, Y40—Y86, Y88, Y89 |
| 1530 | 1. Road injury | V01—V04, V06, V09—V80, V87, V89, V99 |
| 1540 | 2. Poisonings | X40, X43, X46—X48, X49 |
| 1550 | 3. Falls | W00—W19 |
| 1560 | 4. Fire, heat, and hot substances | X00—X19 |
| 1570 | 5. Drowning | W65—W74 |
| 1575 | 6. Exposure to mechanical forces | W20—W38, W40—W43, W45, W46, W49—W52, W75, W76 |
| 1580 | 7. Natural disasters | X33—X39 |
| 1590 | 8. Other unintentional injuries | Rest of V, W39, W44, W53—W64, W77—W99, X20—X32, X50—X59, Y40—Y86, Y88, Y89 |
| 1600 | B. Intentional injuries | X60—Y09, Y35—Y36, Y870, Y871 |
| 1610 | 1. Self—harm | X60—X84, Y870 |
| 1620 | 2. Interpersonal violence | X85—Y09, Y871 |
| 1630 | 3. Collective violence and legal intervention | Y35—Y36 |
Table A2.
Cluster members for males aged over 60.
| Cluster | Cause (Males Aged over 60) |
|---|---|
| 1 | Acute hepatitis A, Acute hepatitis C, Appendicitis, Ascariasis, Asthma, Chronic obstructive pulmonary disease, Cirrhosis of the liver, Cysticercosis, Diarrheal diseases, and Drowning Drug use disorders, Epilepsy, Exposure to mechanical forces, Fire heat and hot substances, astritis and duodenitis, Gonorrhea, HIV AIDS, Hypertensive heart disease, Leukemia, Liver cancer, Lower respiratory infections, Malaria, Meningitis, Otitis media, Peptic ulcer disease, Poisonings, Protein energy malnutrition, Rabies, Rheumatic heart disease, Rheumatoid arthritis, Road injury, Schistosomiasis, Self-harm, Stomach cancer, Stroke, Syphilis, Tetanus, Trachea bronchus lung cancers, Tuberculosis, Upper respiratory infections, Urolithiasis, and Yellow fever |
| 2 | Acute hepatitis B, Acute hepatitis E, Bladder cancer, Brain and nervous system cancers, Colon and rectum cancers, Gallbladder and biliary tract cancer, Interpersonal violence, Kidney cancer, Larynx cancer, Lymphomas multiple myeloma, Melanoma, and other skin cancers, Mesothelioma, Mouth and oropharynx cancers, Esophagus cancer, Pancreas cancer, Parkinson disease, Prostate cancer, Sickle cell disorders and trait, Testicular cancer, and Thyroid cancer |
| 3 | African trypanosomiasis |
| 4 | Alcohol-use disorders, Alzheimer disease, and other dementias, Anxiety disorders, Autism and Asperger syndrome, Back and neck pain, Benign prostatic hyperplasia, Bipolar disorder, Breast cancer, Cardiomyopathy myocarditis endocarditis, Cataracts, Cervix uteri cancer, Chagas disease, Childhood behavioral disorders, Chlamydia, Collective violence, and legal intervention Congenital anomalies, Corpus uteri cancer, Dengue, Depressive disorders, Diabetes mellitus, Diphtheria, Eating disorders, Echinococcosis, Encephalitis, Falls, Food bourne trematodes, Gallbladder and biliary diseases, Genital herpes, Glaucoma, Gout, Gynecological diseases, and Hookworm disease Idiopathic intellectual disability, Infertility, Inflammatory bowel disease, Iodine deficiency, Iron deficiency anaemia, Kidney diseases, Leishmaniasis, Leprosy, Lymphatic filariasis, Macular degeneration, Maternal conditions, Measles, Migraine, Multiple sclerosis, Neonatal conditions, Non migraine headache, Onchocerciasis, Oral conditions, Osteoarthritis, Other hearing loss, Other vision loss, Ovary cancer, Pancreatitis, Paralytic ileus and intestinal obstruction, Schizophrenia, Skin diseases, Sudden infant death syndrome, Thalassemias, Trachoma, Trichomoniasis, Trichuriasis, Uncorrected refractive errors, Vitamin A deficiency, and Whooping cough |
| 5 | Ischemic heart disease |
| 6 | Natural disasters |
Table A3.
Cluster members for males aged 20 to 60.
| Cluster | Cause (Males Aged 20 to 60) |
|---|---|
| 1 | Acute hepatitis A, Acute hepatitis B, Acute hepatitis C, Acute hepatitis E, African trypanosomiasis, Alcohol-use disorders, Appendicitis, Ascariasis, Asthma, Cardiomyopathy myocarditis endocarditis, Chronic obstructive pulmonary disease, Cirrhosis of the liver, Congenital anomalies, Cysticercosis, Diabetes mellitus, Diarrheal diseases, Diphtheria, Drowning, Drug use disorders, Encephalitis, Epilepsy, Exposure to mechanical forces, Falls, Fire heat and hot substances, Gallbladder and biliary diseases, Gastritis and duodenitis, Gonorrhea, HIV AIDS, Hypertensive heart disease, Inflammatory bowel disease, Ischemic heart disease, Kidney diseases, Liver cancer, Lower respiratory infections, Measles, Meningitis, Multiple sclerosis, Otitis media, Pancreatitis, Paralytic ileus and intestinal obstruction, Parkinson disease, Peptic ulcer disease, Poisonings, Protein energy malnutrition, Rabies, Rheumatic heart disease, Rheumatoid arthritis, Schistosomiasis, Self-harm, Sickle cell disorders and trait, Skin diseases, Stroke, Syphilis, Tetanus, Upper respiratory infections, Urolithiasis, Whooping cough, and Yellow fever |
| 2 | Alzheimer disease and other dementias |
| 3 | Anxiety disorders, Autism and Asperger syndrome, Back and neck pain, Benign prostatic hyperplasia, Bipolar disorder, Cataracts, Cervix uteri cancer, Chagas disease, Childhood behavioral disorders, Chlamydia, Corpus uteri cancer, Depressive disorders, Food-bourne trematodes, Genital herpes, Glaucoma, Gout, Gynecological diseases, Hookworm disease, Idiopathic intellectual disability, Infertility, Iodine deficiency, Iron deficiency anemia, Leprosy, Lymphatic filariasis, Macular degeneration, Maternal conditions, Migraine, Neonatal conditions, Non migraine headache, Onchocerciasis, Oral conditions, Osteoarthritis, Other hearing loss, Other vision loss, Ovary cancer, Schizophrenia, Sudden infant death syndrome, Thalassemias, Trachoma, Trichomoniasis, Trichuriasis, Uncorrected refractive errors, and Vitamin A deficiency |
| 4 | Bladder cancer, Brain and nervous system cancers, Colon and rectum cancers, Gallbladder and biliary tract cancer, Interpersonal violence, Kidney cancer, Larynx cancer, Leukemia, Lymphomas multiple myeloma, Malaria, Melanoma and other skin cancers, Mouth and oropharynx cancers, Esophagus cancer, Pancreas cancer, Prostate cancer, Road injury, Stomach cancer, Testicular cancer, Thyroid cancer, Trachea bronchus lung cancers, and Tuberculosis |
| 5 | Breast cancer, Mesothelioma |
| 6 | Collective violence and legal intervention |
| 7 | Dengue, Echinococcosis |
| 8 | Eating disorders |
| 9 | Leishmaniasis |
| 10 | Natural disasters |
Table A4.
Cluster members for females aged over 60.
| Cluster | Cause (Females Aged over 60) |
|---|---|
| 1 | Acute hepatitis A, Acute hepatitis C, Appendicitis, Asthma, Chlamydia, Chronic obstructive pulmonary disease, Cirrhosis of the liver, Congenital anomalies, Cysticercosis, Diarrheal diseases, Exposure to mechanical forces, Gastritis and duodenitis, Gonorrhea, Gynecological diseases, HIV AIDS, Meningitis, Otitis media, Peptic ulcer disease, Protein energy malnutrition, Rabies, Rheumatic heart disease, Schistosomiasis, Self-harm, Stroke, Syphilis, Tetanus, Tuberculosis, Upper respiratory infections, and Yellow fever |
| 2 | Acute hepatitis B, Acute hepatitis E, Alcohol-use disorders, Alzheimer disease and other dementias, Bladder cancer, Brain and nervous system cancers, Breast cancer, Cardiomyopathy myocarditis endocarditis, Cervix uteri cancer, Colon and rectum cancers, Corpus uteri cancer, Diabetes mellitus, Drug use disorders, Encephalitis, Epilepsy, Falls, Fire heat and hot substances, Gallbladder and biliary diseases, Gallbladder and biliary tract cancer, Hypertensive heart disease, Inflammatory bowel disease, Interpersonal violence, Ischemic heart disease, Kidney cancer, Kidney diseases, Larynx cancer, Leishmaniasis, Leukemia, Liver cancer, Lower respiratory infections, Lymphomas multiple myeloma, Melanoma and other skin cancers, Mouth and oropharynx cancers, Multiple sclerosis, Esophagus cancer, Ovary cancer, Pancreas cancer, Pancreatitis, Paralytic ileus and intestinal obstruction, Parkinson disease, Rheumatoid arthritis, Road injury, Sickle cell disorders and trait, Skin diseases, Stomach cancer, Thyroid cancer, Trachea bronchus lung cancers, and Urolithiasis |
| 3 | African trypanosomiasis |
| 4 | Anxiety disorders, Autism and Asperger syndrome, Back and neck pain, Benign prostatic hyperplasia, Bipolar disorder, Cataracts, Chagas disease, Childhood behavioral disorders, Dengue, Depressive disorders, Diphtheri, Eating disorders, Food borne trematodes, Genital herpes, Glaucoma, Gout, Hookworm disease, Idiopathic intellectual disability, Infertility, Iodine deficiency, Iron deficiency anemia, Leprosy, Lymphatic filariasis, Macular degeneration, Maternal conditions, Measles, Mesothelioma, Migraine, Neonatal conditions, Non migraine headache, Onchocerciasis, Oral conditions, Osteoarthritis, Other hearing loss, Other vision loss, Prostate cancer, Schizophrenia, Sudden infant death syndrome, Testicular cancer, Thalassemias, Trachoma, Trichomoniasis, Trichuriasis, Uncorrected refractive errors, Vitamin A deficiency, and Whooping cough |
| 5 | Ascariasis |
| 6 | Collective violence and legal intervention |
| 7 | Drowning |
| 8 | Echinococcosis |
| 9 | Malaria |
| 10 | Natural disasters |
| 11 | Poisonings |
Table A5.
Cluster members for females aged 20 to 60.
| Cluster | Cause (Females Age 20 to 60) |
|---|---|
| 1 | Acute hepatitis A, Acute hepatitis B, Acute hepatitis C, Acute hepatitis E, Alcohol-use disorders, Alzheimer disease and other dementias, Appendicitis, Ascariasis, Asthma, Cardiomyopathy myocarditis endocarditis, Chlamydia, and Chronic obstructive pulmonary disease Cirrhosis of the liver, Congenital anomalies, Cysticercosis, Diabetes mellitus, Diarrheal diseases, Diphtheria, Drowning, Encephalitis, Epilepsy, Exposure to mechanical forces, Falls, Fire heat and hot substances, Gallbladder and biliary diseases, Gastritis and duodenitis, Gonorrhea, Gynecological diseases, HIV AIDS, Hypertensive heart disease, Inflammatory bowel disease, Ischemic heart disease, Kidney diseases, Lower respiratory infections, Maternal conditions, Meningitis, Multiple sclerosis, Otitis media, Pancreatitis, Paralytic ileus and intestinal obstruction, Parkinson disease, Peptic ulcer disease, Poisonings, Protein energy malnutrition, Rabies, Rheumatic heart disease, Rheumatoid arthritis, Road injury, Schistosomiasis, Self-harm, Sickle cell disorders and trait, Skin diseases, Stroke, Syphilis, Tetanus, Upper respiratory infections, Urolithiasis, Whooping cough, and Yellow fever |
| 2 | African trypanosomiasis |
| 3 | Anxiety disorders, Autism and Asperger syndrome, Back and neck pain, Benign prostatic hyperplasia, Bipolar disorder, Cataracts, Chagas disease, Childhood behavioral disorders, Dengue, Depressive disorders, Food borne trematodes, Genital herpes, Glaucoma, Gout, Hookworm disease, Idiopathic intellectual disability, Infertility, Iodine deficiency, Iron deficiency anaemia, Leprosy, Lymphatic filariasis, Macular degeneration, Migraine, Neonatal conditions, Non migraine headache, Onchocerciasis, Oral conditions, Osteoarthritis, Other hearing loss, Other vision loss, Prostate cancer, Schizophrenia, Sudden infant death syndrome, Testicular cancer, Thalassemias, Trachoma, Trichomoniasis, Trichuriasis, Uncorrected refractive errors, and Vitamin A deficiency |
| 4 | Bladder cancer, Brain and nervous system cancers, Breast cancer, Colon and rectum cancers, Corpus uteri cancer, Gallbladder and biliary tract cancer, Interpersonal violence, Kidney cancer, Leukemia, Liver cancer, Lymphomas multiple myeloma, Melanoma and other skin cancers, Mouth and oropharynx cancers, Esophagus cancer, Ovary cancer, Pancreas cancer, Thyroid cancer, and Trachea bronchus lung cancers |
| 5 | Cervix uteri cancer, Larynx cancer, Stomach cancer, and Tuberculosis |
| 6 | Collective violence and legal intervention |
| 7 | Drug-use disorders |
| 8 | Eating disorders |
| 9 | Echinococcosis |
| 10 | Leishmaniasis |
| 11 | Malaria |
| 12 | Measles |
| 13 | Mesothelioma |
| 14 | Natural disasters |
References
- Aach, John, and George M. Church. 2001. Aligning Gene Expression Time Series with Time Warping Algorithms. Bioinformatics 17: 495–508. [Google Scholar] [CrossRef] [PubMed] [Green Version]
- Aggarwal, Charu C., Alexander Hinneburg, and Daniel A. Keim. 2001. On the Surprising Behavior of Distance Metrics in High Dimensional Space. In International Conference on Database Theory. Berlin: Springer, pp. 420–34. [Google Scholar]
- Aghabozorgi, Saeed, Ali Seyed Shirkhorshidi, and Teh Ying Wah. 2015. Time-Series Clustering—A Decade Review. Information Systems 53: 16–38. [Google Scholar] [CrossRef]
- Alai, Daniel H., Séverine Arnold (-Gaille), and Michael Sherris. 2015. Modelling Cause-of-Death Mortality and the Impact of Cause-Elimination. Annals of Actuarial Science 9: 167–86. [Google Scholar] [CrossRef]
- Aparicio, Hugo J., Jayandra J. Himali, Claudia L. Satizabal, Matthew P. Pase, Jose R. Romero, Carlos S. Kase, Alexa S. Beiser, and Sudha Seshadri. 2019. Temporal Trends in Ischemic Stroke Incidence in Younger Adults in the Framingham Study. Stroke 50: 1558–60. [Google Scholar] [CrossRef]
- Arbelaitz, Olatz, Ibai Gurrutxaga, Javier Muguerza, Jesus M. Perez, and Inigo Perona. 2013. An Extensive Comparative Study of Cluster Validity Indices. In Pattern Recongnition. Amsterdam: Elsevier. [Google Scholar]
- Arnold, Séverine, and Viktoriya Glushko. 2021. Cause-Specific Mortality Rates: Common Trends and Differences. Insurance: Mathematics and Economics 99: 294–308. [Google Scholar] [CrossRef]
- Arnold, Séverine, and Michael Sherris. 2013. Forecasting Mortality Trends Allowing for Cause-of-Death Mortality Dependence. North American Actuarial Journal 17: 273–82. [Google Scholar] [CrossRef]
- Arnold, Séverine, and Michael Sherris. 2015. Causes-of-Death Mortality: What Do We Know on Their Dependence? North American Actuarial Journal 19: 116–28. [Google Scholar] [CrossRef]
- Ashley, Thomas, Brian Ivanovic, and David N. Wylde. 2019. Recent Trends in Mortality by Cause of Death. Paper presented at 2019 Underwriting Issues & Innovation Seminar, Rosemont, IL, USA, July 28. [Google Scholar]
- Bartkowiak, Marcin, Katarzyna Kaczmarek-Majer, Aleksandra Rutkowska, and Olgierd Hryniewicz. 2018. Model Averaging Approach to Forecasting the General Level of Mortality. Paper presented at International Conference on Information Processing and Management of Uncertainty in Knowledge-Based Systems, Cdiz, Spain, June 11–15; pp. 453–64. [Google Scholar]
- Booth, Heather, and Leonie Tickle. 2008. Mortality Modelling and Forecasting: A Review of Methods. Annals of Actuarial Science 3: 3–43. [Google Scholar] [CrossRef]
- Brouhns, Natacha, Michel Denuit, and Jeroen K. Vermunt. 2002. Measuring the Longevity Risk in Mortality Projections. Bulletin of the Swiss Association of Actuaries 2: 105–30. [Google Scholar]
- Caselli, Graziella, Jacques Vallin, and Marco Marsili. 2019. How Useful Are the Causes of Death When Extrapolating Mortality Trends. An Update. In Old and New Perspectives on Mortality Forecasting. Berlin/Heidelberg: Springer, pp. 237–59. [Google Scholar]
- Cassisi, Carmelo, Placido Montalto, Marco Aliotta, Andrea Cannata, and Alfredo Pulvirenti. 2012. Similarity Measures and Dimensionality Reduction Techniques for Time Series Data Mining. Advances in Data Mining Knowledge Discovery and Applications 2012: 71–96. [Google Scholar]
- Charrad, Malika, Nadia Ghazzali, Véronique Boiteau, and Azam Niknafs. 2019. NbClust Package. An Examination of Indices for Determining the Number of Clusters. Available online: https://hal.archives-ouvertes.fr/hal-01126138 (accessed on 4 January 2022).
- Chiang, Chin Long. 1968. The Life Table and Its Construction. In Introduction to Stochastic Processes in Biostatistics. New York: Wiley, & Sons, Inc., pp. 198–214. [Google Scholar]
- Cox, Peter R. 1976. Demography. London: Cambridge University Press. [Google Scholar]
- Dickson, David C. M., Mary R. Hardy, and Howard R. Waters. 2019. Actuarial Mathematics for Life Contingent Risks. Cambridge: Cambridge University Press. [Google Scholar]
- Foreman, Kyle J., Rafael Lozano, Alan D. Lopez, and Christopher J. L. Murray. 2012. Modeling Causes of Death: An Integrated Approach Using CODEm. Population Health Metrics 10: 1–23. [Google Scholar] [CrossRef] [PubMed] [Green Version]
- Gaille, Séverine, and Michael Sherris. 2011. Modelling Mortality with Common Stochastic Long-Run Trends. The Geneva Papers on Risk and Insurance-Issues and Practice 36: 595–621. [Google Scholar] [CrossRef] [Green Version]
- Gan, Guojun, and Jimmy Xiangji Huang. 2017. A Data Mining Framework for Valuing Large Portfolios of Variable Annuities. Paper presented at 23rd ACM SIGKDD International Conference on Knowledge Discovery and Data Mining, Halifax, NS, Canada, August 13–17. [Google Scholar]
- Gan, Guojun, and Emiliano A. Valdez. 2016. An Empirical Comparison of Some Experimental Designs for the Valuation of Large Variable Annuity Portfolios. Dependence Modeling 4: 382–400. [Google Scholar] [CrossRef]
- Gan, Guojun, and Emiliano A. Valdez. 2020. Data Clustering with Actuarial Applications. North American Actuarial Journal 24: 168–86. [Google Scholar] [CrossRef]
- Gan, Guojun, Chaoqun Ma, and Jianhong Wu. 2007. Data Clustering: Theory, Algorithms, and Applications. Philadelphia: Society for Industrial and Applied Mathematics, p. 20. [Google Scholar]
- Guijo-Rubio, David, Antonio Manuel Durán-Rosal, Pedro Antonio Gutiérrez, Alicia Troncoso, and César Hervás-Martínez. 2020. Time-Series Clustering Based on the Characterization of Segment Typologies. IEEE Transactions on Cybernetics 51: 5409–22. [Google Scholar] [CrossRef]
- Hamdi, Yosr, Ines Abdeljaoued-Tej, Afzal Ali Zatchi, Sonia Abdelhak, Samir Boubaker, Joel S. Brown, and Alia Benkahla. 2021. Cancer in Africa: The Untold Story. Frontiers in Oncology 11: 650117. [Google Scholar] [CrossRef]
- Han, Jiawei, Micheline Kamber, and Jian Pei. 2011. Data Mining: Concepts and Techniques, 3rd ed. The Morgan Kaufmann Series in Data Management Systems; Oxford: Morgan Kaufmann. [Google Scholar]
- Holman, R. Jerome, and Cynthia S. MacDonald. 2021. U.S. Population Mortality Observations Updated with 2019 Experience; Society of Actuaries. Available online: https://www.soa.org/resources/research-reports/2021/us-population-mortality/ (accessed on 24 December 2021).
- Insurance Regulatory Authority. 2017. The Insurance Act. Available online: https://www.ira.go.ke/images/docs/2020/THE-INSURANCE-ACT-REVISED-2020.pdf (accessed on 4 January 2022).
- Janssen, Fanny. 2018. Advances in Mortality Forecasting: Introduction. Genus 74: 21. [Google Scholar] [CrossRef] [Green Version]
- Kaishev, Vladimir K., Dimitrina S. Dimitrova, and Steven Haberman. 2007. Modelling the Joint Distribution of Competing Risks Survival Times Using Copula Functions. Insurance: Mathematics and Economics 41: 339–61. [Google Scholar] [CrossRef]
- Kwon, Hyuk-Sung, and Vu Hai Nguyen. 2019. Analysis of Cause-of-Death Mortality and Actuarial Implications. Communications for Statistical Applications and Methods 26: 557–73. [Google Scholar] [CrossRef]
- Lamb, David, Joni Downs, and Steven Reader. 2020. Space-Time Hierarchical Clustering for Identifying Clusters in Spatiotemporal Point Data. ISPRS International Journal of Geo-Information 9: 85. [Google Scholar] [CrossRef] [Green Version]
- Lance, Godfrey N., and William Thomas Williams. 1967. A General Theory of Classificatory Sorting Strategies: 1. Hierarchical Systems. The Computer Journal 9: 373–80. [Google Scholar] [CrossRef] [Green Version]
- Lawson, Richard G., and Peter C. Jurs. 1990. New Index for Clustering Tendency and Its Application to Chemical Problems. Journal of Chemical Information and Computer Sciences 30: 36–41. [Google Scholar] [CrossRef]
- Lee, Seulbi, Jaehoon Kim, Jongyeon Hwang, Eunji Lee, Kyoung-Jin Lee, Jeongkyu Oh, Jungsu Park, and Tae-Young Heo. 2020. Clustering of Time Series Water Quality Data Using Dynamic Time Warping: A Case Study from the Bukhan River Water Quality Monitoring Network. Water 12: 2411. [Google Scholar] [CrossRef]
- Li, Hong, and Yang Lu. 2018. Modeling Cause-of-Death Mortality Using Hierarchical Archimedean Copula. Scandinavian Actuarial Journal 2019: 1–26. [Google Scholar] [CrossRef]
- Li, Han, Hong Li, Yang Lu, and Anastasios Panagiotelis. 2019. A Forecast Reconciliation Approach to Cause-of-Death Mortality Modeling. Insurance: Mathematics and Economics 86: 122–33. [Google Scholar] [CrossRef]
- Mahase, Elisabeth. 2019. Cancer Overtakes CVD to Become Leading Cause of Death in High Income Countries. BMJ: British Medical Journal 366. [Google Scholar] [CrossRef]
- McNown, Robert, and Andrei Rogers. 1992. Forecasting Cause-Specific Mortality Using Time Series Methods. International Journal of Forecasting 8: 413–32. [Google Scholar] [CrossRef]
- Medicare Centers for Medicaid Services and National Center for Health Statistics. 2019. ICD-10-CM Official Guidelines for Coding and Reporting. FY 2018. Available online: https://www.cms.gov/Medicare/Coding/ICD10/Downloads/2019-ICD10-Coding-Guidelines-.pdf (accessed on 4 January 2022).
- Meyer, Hermann, Rosina Ehmann, and Geoffrey L. Smith. 2020. Smallpox in the Post-Eradication Era. Viruses 12: 138. [Google Scholar] [CrossRef] [PubMed] [Green Version]
- Montero, Pablo, and José A. Vilar. 2015. TSclust: An R Package for Time Series Clustering. Journal of Statistical Software 62: 1–43. [Google Scholar]
- O’Hagan, Adrian, and Colm Ferrari. 2017. Model-Based and Nonparametric Approaches to Clustering for Data Compression in Actuarial Applications. North American Actuarial Journal 21: 107–46. [Google Scholar] [CrossRef]
- Olshansky, S. Jay, Leonard Hayflick, and Bruce A. Carnes. 2002. Position Statement on Human Aging. The Journals of Gerontology Series A: Biological Sciences and Medical Sciences 57: B292–B297. [Google Scholar] [CrossRef] [PubMed] [Green Version]
- Delgermaa, Vanya, Ken Takahashi, Eun-Kee Park, Giang Vinh Le, Toshiyuki Hara, and Tom Sorahan. 2011. Global mesothelioma deaths reported to the World Health Organization between 1994 and 2008. Bulletin of the World Health Organization 89: 716–24. [Google Scholar] [CrossRef]
- Petitjean, François, Alain Ketterlin, and Pierre Gançarski. 2011. A Global Averaging Method for Dynamic Time Warping, with Applications to Clustering. Pattern Recognition 44: 678–93. [Google Scholar] [CrossRef]
- Raftery, Adrian E., Jennifer L. Chunn, Patrick Gerland, and Hana Ševčíková. 2013. Bayesian Probabilistic Projections of Life Expectancy for All Countries. Demography 50: 777–801. [Google Scholar] [CrossRef] [Green Version]
- Richman, Ronald. 2018. AI in Actuarial Science. Available online: https://ssrn.com/abstract=3218082 (accessed on 4 January 2022). [CrossRef]
- Robertson, Tony, G. David Batty, Geoff Der, Candida Fenton, Paul G. Shiels, and Michaela Benzeval. 2013. Is Socioeconomic Status Associated with Biological Aging as Measured by Telomere Length? Epidemiologic Reviews 35: 98–111. [Google Scholar] [CrossRef] [PubMed]
- Roser, Max, Esteban Ortiz-Ospina, and Hannah Ritchie. 2013. Life Expectancy. Our World in Data. Available online: https://ourworldindata.org/life-expectancy (accessed on 4 January 2022).
- Roth, Gregory A., Mark D. Huffman, Andrew E. Moran, Valery Feigin, George A. Mensah, Mohsen Naghavi, and Christopher J. L. Murray. 2015. Global and Regional Patterns in Cardiovascular Mortality from 1990 to 2013. Circulation 132: 1667–78. [Google Scholar] [CrossRef] [PubMed] [Green Version]
- Saitta, Sandro, Benny Raphael, and Ian F. C. Smith. 2007. A Bounded Index for Cluster Validity. In International Workshop on Machine Learning and Data Mining in Pattern Recognition. Berlin: Springer, pp. 174–87. [Google Scholar]
- Sakoe, Hiroaki. 1971. Dynamic-Programming Approach to Continuous Speech Recognition. Paper presented at 7th International Congress on Acoustics, Budapest, Hungary, August 18–26. [Google Scholar]
- Sard, Alexis. 2019. Comparing Time-Series Clustering Algorithms in R Using the Dtwclust Package. pp. 1–45. Available online: https://www.semanticscholar.org/paper/Comparing-Time-Series-Clustering-Algorithms-in-R-Sarda-Espinosa/a46ec863bbf3e179de4e7ccedd205a96ab1ca64f#extracted (accessed on 4 January 2022).
- Sawe, Rispah T., Maggie Kerper, Sunil Badve, Jun Li, Mayra Sandoval-Cooper, Jingmeng Xie, Zonggao Shi, Kirtika Patel, David Chumba, Ayub Ofulla, and et al. 2016. Aggressive breast cancer in western Kenya has early onset, high proliferation, and immune cell infiltration. BMC Cancer 16: 1–15. [Google Scholar] [CrossRef] [PubMed] [Green Version]
- Shaylika, Chauhan. 2020. Comprehensive Review of Coronavirus Disease 2019 (COVID-19). Biomedical Journal 43: 334–40. [Google Scholar]
- Soheily-Khah, Saeid, Ahlame Douzal Chouakria, and Eric Gaussier. 2015. Progressive and Iterative Approaches for Time Series Averaging. Paper presented at 1st International Conference on Advanced Analytics and Learning on Temporal Data, Porto, Portugal, September 11; pp. 111–17. [Google Scholar]
- Tabeau, Ewa, Peter Ekamper, Corina Huisman, and Alinda Bosch. 1999. Improving Overall Mortality Forecasts by Analysing Cause-of-Death, Period and Cohort Effects in Trends. European Journal of Population/Revue Européenne de Démographie 15: 153–83. [Google Scholar] [CrossRef]
- Tsinaslanidis, Prodromos, Antonis Alexandridis, Achilleas Zapranis, and Efstratios Livanis. 2014. Dynamic Time Warping as a Similarity Measure: Applications in Finance. Paper presented at Hellenic Finance and Accounting Association, Volos, Greece, December 12–13. [Google Scholar]
- United Nations and Social Affairs. 2017. World Population Prospects: The 2017 Revision Data Booklet (ST/ESA/SER. A/401). Available online: https://www.un.org/development/desa/publications/world-population-prospects-the-2017-revision.html (accessed on 5 January 2022).
- Wang, Weina, and Yunjie Zhang. 2007. On Fuzzy Cluster Validity Indices. Fuzzy Sets and Systems 158: 2095–117. [Google Scholar] [CrossRef]
- Wang, Xiaoyue, Abdullah Mueen, Hui Ding, Goce Trajcevski, Peter Scheuermann, and Eamonn Keogh. 2013. Experimental Comparison of Representation Methods and Distance Measures for Time Series Data. Data Mining and Knowledge Discovery 26: 275–309. [Google Scholar] [CrossRef] [Green Version]
- WHO. 2020. WHO Methods and Data Sources for Country-Level Causes of Death 2000–19. Global Health Estimates Technical Paper WHO/DDI/DNA/GHE/2020.2. Geneva: World Health Organization, Available online: https://www.who.int/data/gho/data/themes/mortality-and-global-health-estimates/ghe-leading-causes-of-death (accessed on 4 January 2022).
- Yao, Ji. 2016. Clustering in General Insurance Pricing. In Predictive Modeling Applications in Actuarial Science. Edited by Edward W. Frees, Glenn Meyers and Richard A. Derrig. Cambridge: Cambridge University Press, pp. 159–79. [Google Scholar]
- Zhao, Jiaping, and Laurent Itti. 2018. Shapedtw: Shape Dynamic Time Warping. Pattern Recognition 74: 171–84. [Google Scholar] [CrossRef] [Green Version]
Figure 1.
Male CVI plots.

Figure 2.
Female CVI plots.

Figure 3.
Model comparison of the DTW, Euclidean (l1), and Manhattan (l2) distance criteria for females aged 20 to 60.
Figure 3.
Model comparison of the DTW, Euclidean (l1), and Manhattan (l2) distance criteria for females aged 20 to 60.

Figure 4.
Model comparison of the DTW, Euclidean (l1), and Manhattan (l2) distance criteria for females aged over 60.
Figure 4.
Model comparison of the DTW, Euclidean (l1), and Manhattan (l2) distance criteria for females aged over 60.

Figure 5.
Model comparison of the DTW, Euclidean (l1), and Manhattan (l2) distance criteria for males aged 20 to 60.
Figure 5.
Model comparison of the DTW, Euclidean (l1), and Manhattan (l2) distance criteria for males aged 20 to 60.

Figure 6.
Model comparison of the DTW, Euclidean (l1), and Manhattan (l2) distance criteria for males aged over 60.
Figure 6.
Model comparison of the DTW, Euclidean (l1), and Manhattan (l2) distance criteria for males aged over 60.

Figure 7.
Cluster extraction for females aged 20 to 60.

Figure 8.
Declining trend of the causes of death among younger females in cluster 1 for 2000, 2010, and 2019.
Figure 8.
Declining trend of the causes of death among younger females in cluster 1 for 2000, 2010, and 2019.

Figure 9.
Declining trend of the causes of death among females in cluster 5 for 2000, 2010, and 2019.
Figure 9.
Declining trend of the causes of death among females in cluster 5 for 2000, 2010, and 2019.

Figure 10.
Increasing trend of the causes of death among younger females in cluster 4 for 2000, 2010, and 2019.
Figure 10.
Increasing trend of the causes of death among younger females in cluster 4 for 2000, 2010, and 2019.

Figure 11.
Cluster extraction for females aged over 60.

Figure 12.
Declining trend causes among older females in cluster 1 for 2000, 2010, and 2019.

Figure 13.
Increasing trend causes among older females in cluster 2 for 2000, 2010, and 2019.

Figure 14.
Centroid extractions of males aged 20 to 60.

Figure 15.
Declining trend causes among younger males in cluster 1 for 2000, 2010, and 2019.

Figure 16.
Unlabelled trend causes among younger males in cluster 4 for 2000, 2010, and 2019.

Figure 17.
Centroid extraction of males aged over 60.

Figure 18.
Declining trend causes among older males in cluster 1 for 2000, 2010, and 2019.

Figure 19.
Increasing trend causes among older males in cluster 2 for 2000, 2010, and 2019.

Figure 20.
APV for males aged over 60 clusters against longevity assumption rates.

Figure 21.
APV for females aged over 60 clusters against longevity assumption rates.

Figure 22.
APV for males aged 20 to 60 clusters against mortality assumption rates.

Figure 23.
APV for females aged over 20 to 60 clusters against mortality assumption rates.

Table 1.
Distance Criteria.
| Distance Criteria | Description | Reference |
|---|---|---|
| norm) | (Aggarwal et al. 2001) | |
| norm) | (Aggarwal et al. 2001) | |
| DTW | (Aghabozorgi et al. 2015; Sard 2019; Zhao and Itti 2018; Sakoe 1971) |
Table 2.
Linkage criteria.
| Linkage Criteria | Equation | Reference |
|---|---|---|
| Single | Minimum pair distance between points in cluster i and j | |
| Average (UPGMA) | Average pair distance between points in cluster i and j | |
| Complete | Maximum pair distance between points in clusters i and j | |
| Centroid (UPGMC) | Pair distance between cluster centroid i (mean vector of length p features) and cluster centroid j | |
| Median (WPGMC) | Euclidean distance between weighted centroids of the two clusters | |
| Mcquitty (WPGMA) | Weighted mean of the between-cluster dissimilarities between the points in cluster i and j |
Table 3.
Cluster Validity Index (Internal).
| Index | Description | Objective Criteria |
|---|---|---|
| Silhouette (Sil) | , | Maximum |
| Dunn (D) | Maximum | |
| COP | Minimum | |
| Calinski-Harabasz (CH) | Maximum | |
| Davies-Bouldin (DB) | Minimum | |
| Modified Davies-Bouldin (DB*) | Minimum | |
| Score Function (SF) | where & | Maximum |
Table 4.
Hopkins Statistics Results.
| Gender and Age | Hopkins Statistic |
|---|---|
| Male aged 20 years to 60 years | 0.9521319 |
| Male aged over 60 years | 0.9597553 |
| Female aged 20 years to 60 years | 0.9661622 |
| Female aged over 60 years | 0.9727848 |
Table 5.
Optimal clusters.
| Age Partition | Centroid Extraction |
|---|---|
| Males | |
| 20 ≤ x < 60 | 10 |
| x ≥ 60 | 6 |
| Females | |
| 20 ≤ x < 60 | 14 |
| x ≥ 60 | 11 |
Table 6.
CVI results for females aged over 60.
| Clusters | CH | COP | D | DB | DBstar | SF | Sil | Rank |
|---|---|---|---|---|---|---|---|---|
| 10 | 29.44639 | 0.11639 | 0.232254 | 0.341024 | 0.505107 | 1.8 × 10⁻⁵ | 0.617272 | 3 |
| 11 | 29.62869 | 0.111384 | 0.232254 | 0.33342 | 0.490175 | 2.6 × 10⁻⁵ | 0.620358 | 1 |
| 12 | 25.55996 | 0.107246 | 0.232254 | 0.334859 | 0.48636 | 3.0 × 10⁻⁵ | 0.613325 | 2 |
| 13 | 26.17275 | 0.1068 | 0.232254 | 0.35341 | 0.53423 | 2.7 × 10⁻⁵ | 0.578546 | 6 |
| 14 | 23.59811 | 0.091103 | 0.240698 | 0.414231 | 0.50472 | 3.0 × 10⁻⁷ | 0.58151 | 9 |
| 15 | 23.54658 | 0.083028 | 0.26351 | 0.471052 | 0.521689 | 5.3 × 10⁻⁹ | 0.6016 | 10 |
| 2 | 111.2881 | 0.235012 | 0.171448 | 0.950741 | 0.950741 | 9.5 × 10⁻⁵ | 0.579936 | 13 |
| 3 | 67.6292 | 0.225413 | 0.1901 | 0.561149 | 0.574342 | 8.3 × 10⁻⁵ | 0.494053 | 12 |
| 4 | 38.85082 | 0.229005 | 0.1901 | 0.600825 | 0.610435 | 3.2 × 10⁻⁵ | 0.45468 | 14 |
| 5 | 35.32424 | 0.2118 | 0.1901 | 0.361477 | 0.440401 | 7.0 × 10⁻⁵ | 0.432569 | 7 |
| 6 | 29.89726 | 0.2041 | 0.212661 | 0.351287 | 0.440946 | 8.3 × 10⁻⁵ | 0.411587 | 5 |
| 7 | 24.10709 | 0.200178 | 0.212661 | 0.362019 | 0.448074 | 7.0 × 10⁻⁵ | 0.406142 | 11 |
| 8 | 35.31805 | 0.124642 | 0.232254 | 0.390179 | 0.51908 | 1.3 × 10⁻⁵ | 0.624278 | 4 |
| 9 | 30.08999 | 0.122617 | 0.232254 | 0.379862 | 0.535502 | 1.2 × 10⁻⁵ | 0.617032 | 8 |
Table 7.
CVI results for females aged 20 to 60.
| Clusters | CH | COP | D | DB | DBstar | SF | Sil | Rank |
|---|---|---|---|---|---|---|---|---|
| 10 | 23.03112202 | 0.176992601 | 0.301793526 | 0.453123272 | 0.626611534 | 1.0 × 10⁻⁵ | 0.480769677 | 7 |
| 11 | 20.66332201 | 0.176400898 | 0.301793526 | 0.537548358 | 0.72011021 | 1.4 × 10⁻⁷ | 0.489997742 | 14 |
| 12 | 17.79499587 | 0.171086725 | 0.301793526 | 0.487769359 | 0.683949639 | 1.4 × 10⁻⁵ | 0.483808735 | 11 |
| 13 | 26.24365828 | 0.156145699 | 0.363306552 | 0.439806196 | 0.670187773 | 4.0 × 10⁻⁷ | 0.518376075 | 2 |
| 14 | 20.62380578 | 0.147637517 | 0.363306552 | 0.432068468 | 0.645016557 | 1.8 × 10⁻⁶ | 0.504644184 | 1 |
| 15 | 20.75436142 | 0.144098812 | 0.326536521 | 0.448140897 | 0.648934575 | 1.5 × 10⁻⁶ | 0.465248088 | 4 |
| 2 | 114.5256387 | 0.337413364 | 0.312118689 | 0.801389578 | 0.801389578 | 5.2 × 10⁻⁵ | 0.496747633 | 9 |
| 3 | 58.42907753 | 0.348064594 | 0.312118689 | 0.528629753 | 0.611530795 | 2.5 × 10⁻⁵ | 0.351772891 | 3 |
| 4 | 27.97383786 | 0.299237587 | 0.312118689 | 0.592248656 | 0.619617138 | 1.8 × 10⁻⁵ | 0.314562125 | 10 |
| 5 | 40.80354807 | 0.211871067 | 0.312118689 | 0.591605495 | 0.692876715 | 3.8 × 10⁻⁶ | 0.567527201 | 6 |
| 6 | 39.30113349 | 0.194009708 | 0.312118689 | 0.708201159 | 0.855088578 | 2.3 × 10⁻⁸ | 0.576778735 | 13 |
| 7 | 34.14609145 | 0.187249741 | 0.312118689 | 0.568824721 | 0.665277285 | 5.5 × 10⁻⁸ | 0.556010119 | 8 |
| 8 | 29.25958277 | 0.181636074 | 0.270400505 | 0.529890711 | 0.665009974 | 7.5 × 10⁻⁸ | 0.536580308 | 11 |
| 9 | 32.26731808 | 0.183907178 | 0.270400505 | 0.437247903 | 0.663384937 | 1.2 × 10⁻⁵ | 0.526151517 | 4 |
Table 8.
CVI results for males aged over 60.
| Clusters | CH | COP | D | DB | DBstar | SF | Sil | Rank |
|---|---|---|---|---|---|---|---|---|
| 10 | 24.99659434 | 0.123090442 | 0.182248041 | 0.655482395 | 0.798173272 | 4.2 × 10⁻⁹ | 0.591802123 | 9 |
| 11 | 27.34635291 | 0.118726105 | 0.182248041 | 0.61964455 | 0.764738128 | 6.8 × 10⁻⁹ | 0.585583308 | 3 |
| 12 | 27.88938198 | 0.101299096 | 0.25335064 | 0.76589228 | 0.961728169 | 9.9 × 10⁻¹² | 0.626175884 | 6 |
| 13 | 24.3911496 | 0.0980419 | 0.25335064 | 0.694189214 | 0.853283966 | 1.6 × 10⁻¹¹ | 0.596910016 | 9 |
| 14 | 24.48443327 | 0.096394885 | 0.25335064 | 0.66805504 | 0.90634624 | 1.4 × 10⁻¹¹ | 0.593231137 | 12 |
| 15 | 22.28606152 | 0.093863224 | 0.25335064 | 0.627373338 | 0.898826858 | 2.3 × 10⁻¹¹ | 0.590170622 | 11 |
| 2 | 59.74292696 | 0.396250575 | 0.123056136 | 0.883154977 | 0.883154977 | 2.0 × 10⁻⁵ | 0.471770673 | 14 |
| 3 | 45.59389522 | 0.374735197 | 0.123056136 | 0.580674345 | 0.666813972 | 3.6 × 10⁻⁵ | 0.332955657 | 4 |
| 4 | 24.63063128 | 0.285170151 | 0.123056136 | 0.595182936 | 0.715895755 | 1.7 × 10⁻⁵ | 0.255229931 | 13 |
| 5 | 26.77686722 | 0.274703824 | 0.123056136 | 0.508507562 | 0.613479317 | 2.3 × 10⁻⁵ | 0.219229328 | 5 |
| 6 | 32.62536615 | 0.200419606 | 0.182248041 | 0.587586059 | 0.648327692 | 3.1 × 10⁻⁷ | 0.485483154 | 1 |
| 7 | 25.35447125 | 0.182995324 | 0.182248041 | 0.626840469 | 0.727005256 | 4.9 × 10⁻⁷ | 0.473163122 | 6 |
| 8 | 25.56041713 | 0.180540144 | 0.182248041 | 0.536630486 | 0.666798427 | 5.5 × 10⁻⁷ | 0.457705734 | 2 |
| 9 | 28.39544452 | 0.128737317 | 0.182248041 | 0.777960456 | 0.866845765 | 2.6 × 10⁻⁹ | 0.605605777 | 6 |
Table 9.
CVI results for males aged 20 to 60.
| Clusters | CH | COP | D | DB | DBstar | SF | Sil | Rank |
|---|---|---|---|---|---|---|---|---|
| 10 | 23.37155949 | 0.155797 | 0.36972481 | 0.47549 | 0.58735429 | 1.5 × 10⁻⁷ | 0.568804 | 1 |
| 11 | 22.75250061 | 0.149873 | 0.27293163 | 0.50896 | 0.64024307 | 1.5 × 10⁻⁸ | 0.603456 | 6 |
| 12 | 23.13907169 | 0.141859 | 0.27293163 | 0.5322 | 0.6292448 | 2.3 × 10⁻¹⁰ | 0.576129 | 4 |
| 13 | 22.90632651 | 0.132435 | 0.27293163 | 0.46538 | 0.64787178 | 3.8 × 10⁻⁸ | 0.550531 | 5 |
| 14 | 22.96812575 | 0.102317 | 0.27293163 | 0.50069 | 0.63744017 | 1.8 × 10⁻¹⁰ | 0.577709 | 3 |
| 15 | 20.69612814 | 0.104242 | 0.27293163 | 0.53184 | 0.70119603 | 2.2 × 10⁻¹⁰ | 0.566868 | 9 |
| 2 | 64.59981838 | 0.758969 | 0.244642 | 0.49813 | 0.49812756 | 1.2 × 10⁻³ | 0.330671 | 2 |
| 3 | 34.00898982 | 0.51517 | 0.23087144 | 0.52147 | 0.59828352 | 7.1 × 10⁻⁴ | 0.221762 | 7 |
| 4 | 9.490859724 | 0.462423 | 0.23087144 | 0.60857 | 0.64559839 | 8.3 × 10⁻⁵ | 0.206575 | 14 |
| 5 | 17.88334313 | 0.436439 | 0.23087144 | 0.59989 | 0.62708712 | 1.8 × 10⁻⁴ | 0.183655 | 10 |
| 6 | 10.15629379 | 0.443874 | 0.23087144 | 0.58828 | 0.61021394 | 1.1 × 10⁻⁴ | 0.155563 | 12 |
| 7 | 7.483384607 | 0.429315 | 0.23087144 | 0.59759 | 0.63214043 | 1.4 × 10⁻⁵ | 0.163761 | 13 |
| 8 | 15.98544384 | 0.244135 | 0.36972481 | 0.57682 | 0.63000799 | 1.9 × 10⁻⁷ | 0.331158 | 8 |
| 9 | 10.37996996 | 0.227101 | 0.36972481 | 0.6093 | 0.65769103 | 2.0 × 10⁻⁷ | 0.262339 | 11 |
Table 10.
Outlier clusters.
| Males Aged 20 to 60 | Males Aged over 60 | Females Aged 20 to 60 | Females Aged over 60 |
|---|---|---|---|
| Breast cancer, mesothelioma | African trypanosomiasis | Collective violence and legal intervention | Ascariasis |
| Collective violence and legal intervention | Ischemic heart disease | Drug use disorders | Collective violence and legal intervention |
| Dengue, echinococcosis | Natural disasters | Eating disorders | Drowning |
| Eating disorders | Echinococcosis | Echinococcosis | |
| Leishmaniasis | Leishmaniasis | Malaria | |
| Natural disasters | Malaria | Natural disasters | |
| Alzheimer disease and other dementias | Measles | Poisonings | |
| Mesothelioma | African trypanosomiasis | ||
| Natural disasters African trypanosomiasis |
Publisher’s Note: MDPI stays neutral with regard to jurisdictional claims in published maps and institutional affiliations. |
© 2022 by the authors. Licensee MDPI, Basel, Switzerland. This article is an open access article distributed under the terms and conditions of the Creative Commons Attribution (CC BY) license (https://creativecommons.org/licenses/by/4.0/).
Share and Cite
MDPI and ACS Style
Bett, N.; Kasozi, J.; Ruturwa, D. Temporal Clustering of the Causes of Death for Mortality Modelling. Risks 2022, 10, 99. https://0-doi-org.brum.beds.ac.uk/10.3390/risks10050099
AMA Style
Bett N, Kasozi J, Ruturwa D. Temporal Clustering of the Causes of Death for Mortality Modelling. Risks. 2022; 10(5):99. https://0-doi-org.brum.beds.ac.uk/10.3390/risks10050099
Chicago/Turabian StyleBett, Nicholas, Juma Kasozi, and Daniel Ruturwa. 2022. "Temporal Clustering of the Causes of Death for Mortality Modelling" Risks 10, no. 5: 99. https://0-doi-org.brum.beds.ac.uk/10.3390/risks10050099
Note that from the first issue of 2016, this journal uses article numbers instead of page numbers. See further details here.