National Culture and Corporate Rating Migrations

Department of Economics and Finance, University of Canterbury, Christchurch 8140, New Zealand
Risks 2018, 6(4), 130; https://0-doi-org.brum.beds.ac.uk/10.3390/risks6040130
Submission received: 14 October 2018
/
Revised: 6 November 2018
/
Accepted: 7 November 2018
/
Published: 14 November 2018
(This article belongs to the Special Issue Risk, Ruin and Survival: Decision Making in Insurance and Finance)
Abstract
:The informal constraints that arise from the national culture in which a firm resides have a pervasive impact on managerial decision making and corporate credit risk, which in turn impacts on corporate ratings and rating changes. In some cultures, firms are naturally predisposed to rating changes in a particular direction (downgrade or upgrade) while, in other cultures, firms are more likely to migrate from the current rating in either direction. This study employs a survival analysis framework to examine the effect of national culture on the probability of rating transitions of 5360 firms across 50 countries over the period 1985–2010. Firms located in long-term oriented cultures are less likely to be downgraded and, in some cases, more likely to be upgraded. Downgrades occur more often in strong uncertainty-avoiding countries and less often in large power distance (hierarchy) and embeddedness countries. There is some evidence that masculinity predisposes firms to more rating transitions. Studying culture helps enrich our understanding of corporate rating migrations, and helps develop predictive models of corporate rating changes across countries.
1. Introduction
Hofstede, Hofstede and Minkov (Hofstede et al. 2010) define culture as “the collective programming of the mind that distinguishes the members of one category of people from those of another.” In a global survey conducted in May 2008 by PricewaterhouseCoopers, 78% of the participants considered culture and excessive risk taking the contributing factors that led to the credit crisis (PricewaterhouseCoopers 2008). Contributing to this view is the evidence that culture affects corporate risk taking (Li et al. 2013), bank risk taking (Ashraf et al. 2016), and bank performance (Boubakri et al. 2017).
Pan et al. (2017) observe similarity in risk attitudes inside U.S. firms, which are rooted in the founders’ risk attitudes and retained through the appointments of leaders with similar mindsets. Unlike Pan et al., this study does not focus on founders’ risk attitudes and corporate risk culture.1 As Ramirez and Tadesse (2009) suggest, the culture in which an individual resides influences his/her perception of uncertainty and his/her “mechanism” to cope with uncertainty and ambiguity. Corporate managers, regardless of their original cultural backgrounds, have to tailor their business priorities and corporate policies to the cultural contexts in which their firms operate. This study therefore focuses on the national culture in which a firm resides.
In practice, credit rating has been widely used as a measure of credit risk. A strong understanding of credit rating decisions has important implications to market participants. As the President of the European Commission José Manuel Barroso remarked at the European Parliament on 5 May 2010, ratings are “too cyclical, too reliant on the general market mood rather than on fundamentals—regardless of whether market mood is too optimistic or too pessimistic”.
Investors from different cultures react differently to an information shock and are affected by different cognitive biases (Afego 2018). Behavioral pitfalls, such as overreaction and herding, are related to culture values. For example, people in strong uncertainty avoiding countries, such as Greece and Italy, show a high level of anxiety and a natural sense of urgency (Hofstede et al. 2010). People in collectivism (embeddedness) cultures tend to exhibit herding behavior (Chang and Lin 2015). These culture values affect investor sentiment and market mood, and market mood impacts on credit ratings, as stated by the President of the European Commission. Thus, it is expected that culture indirectly influences rating decisions.
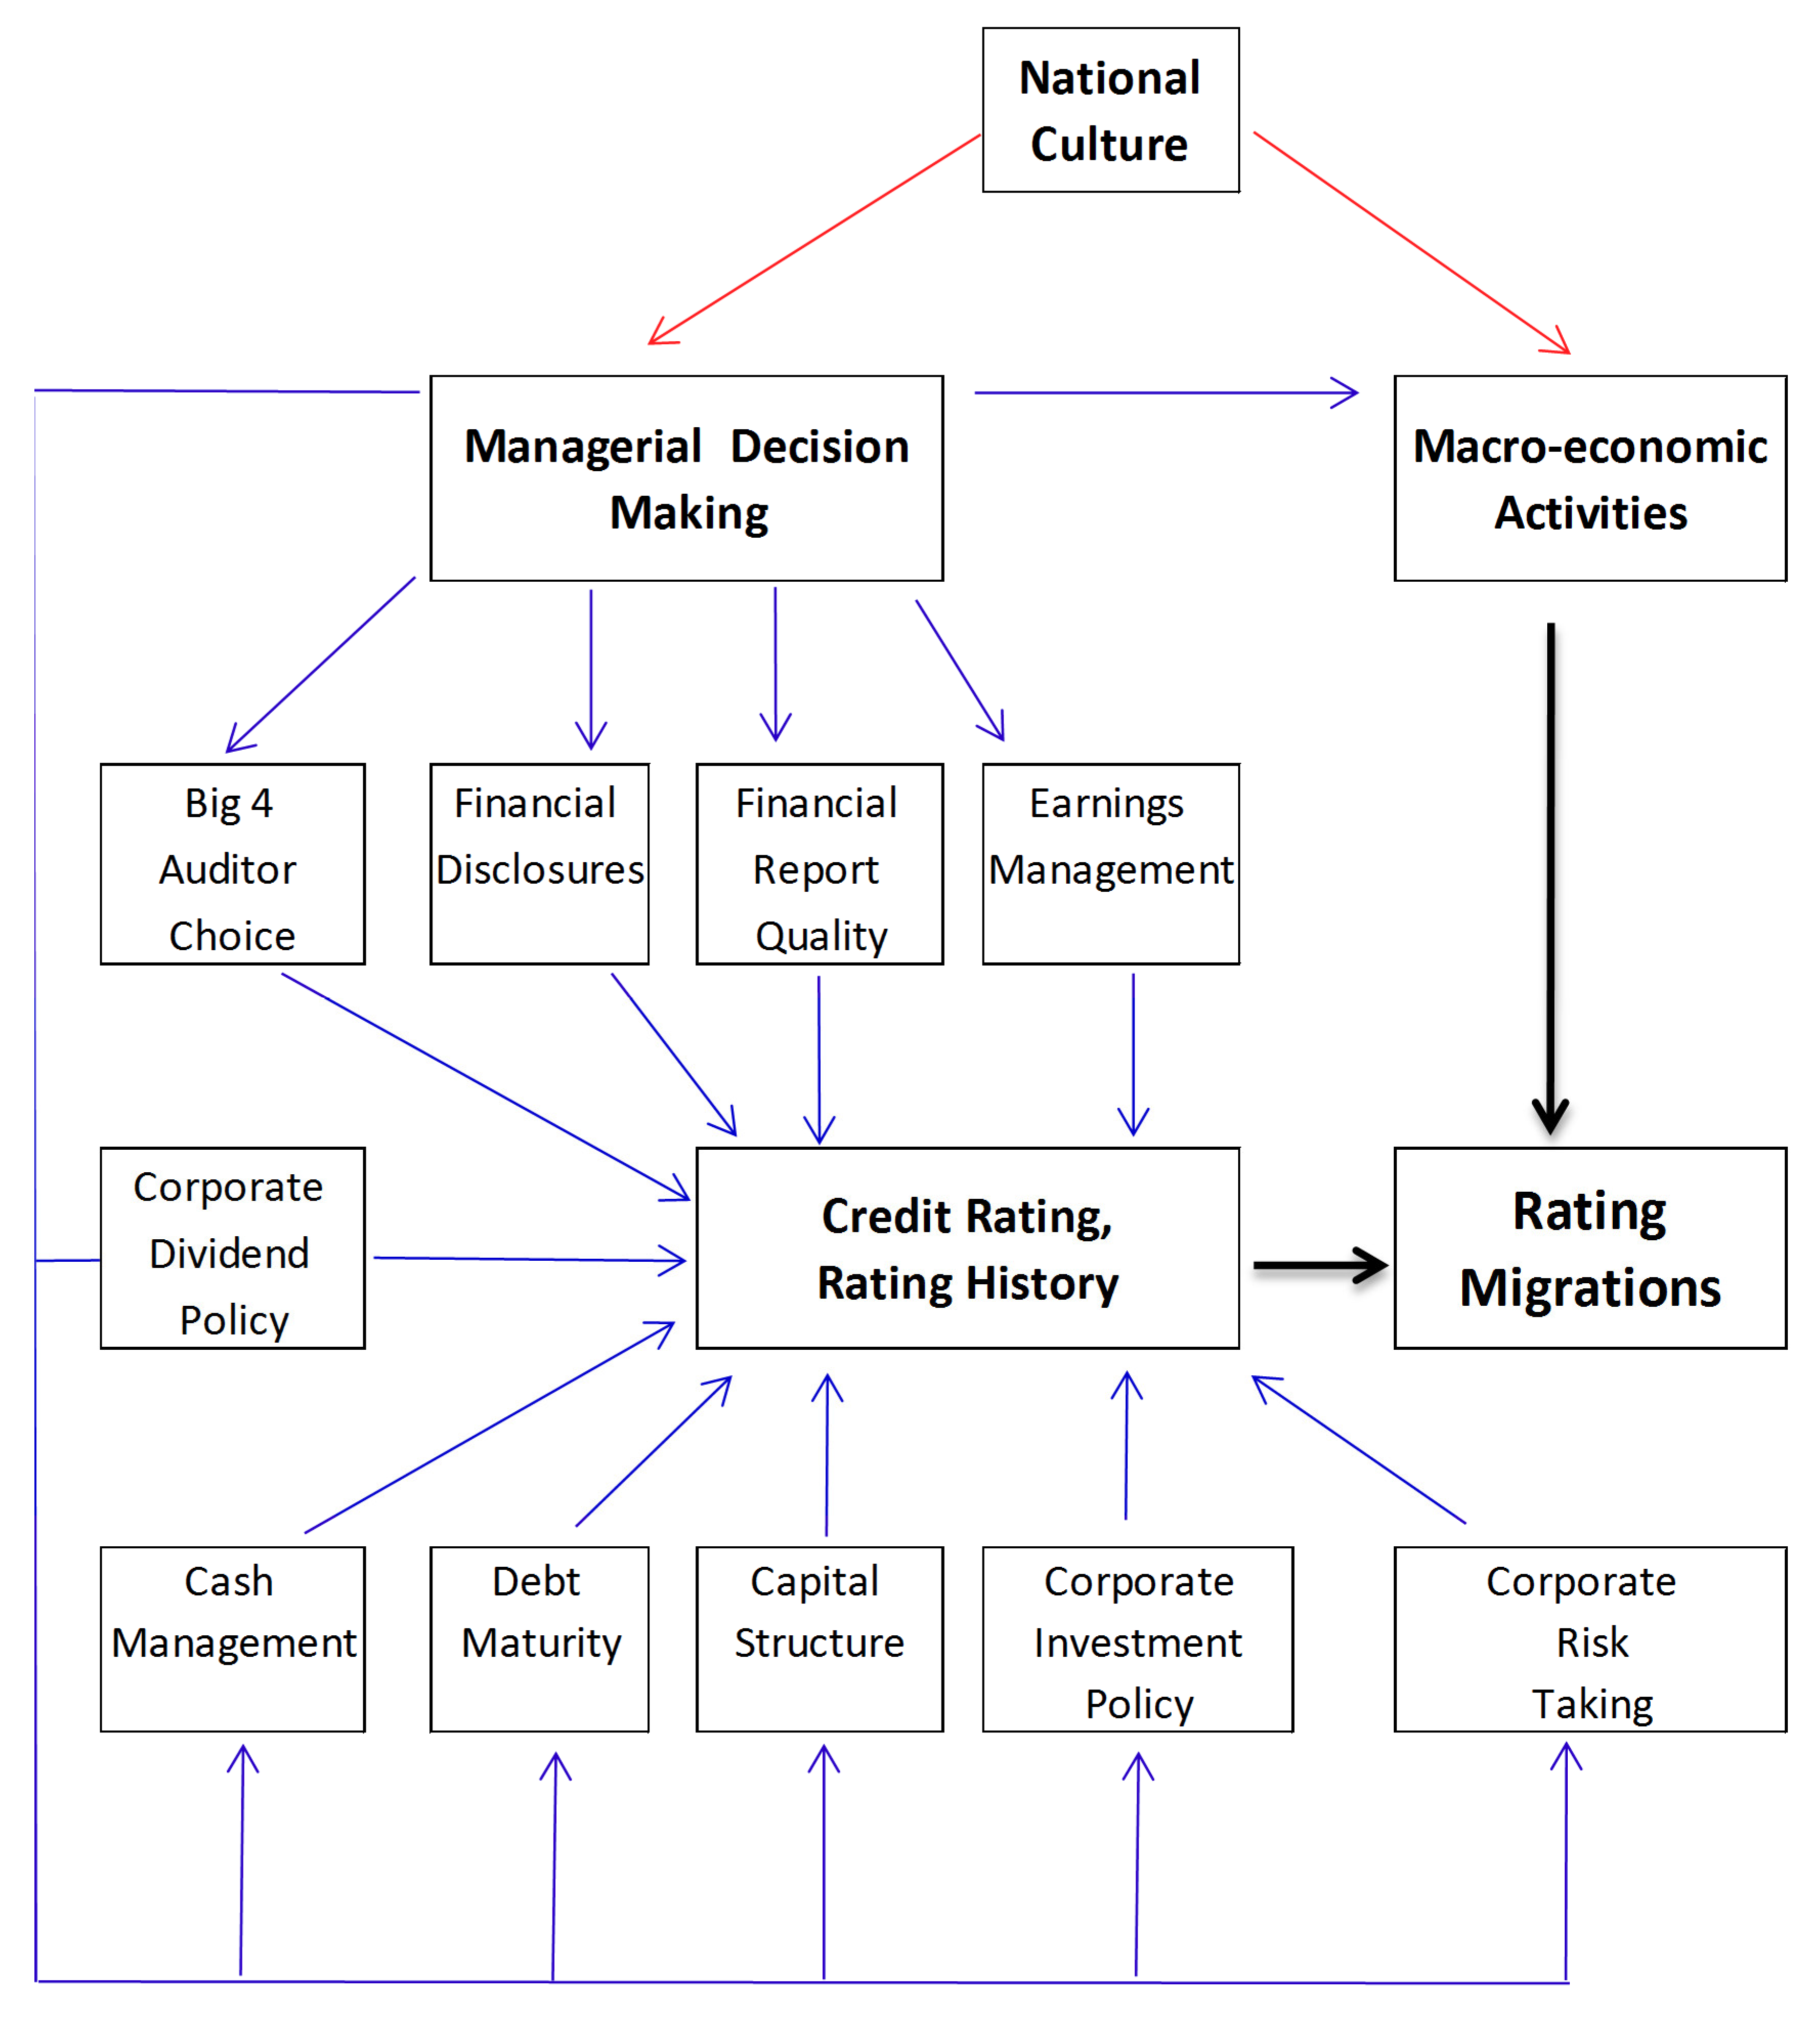
Empirical studies suggest that culture feeds into the rating review process through several channels (Appendix A). Culture directly influences managerial decision making thereby indirectly influencing corporate risk taking (Li et al. 2013), capital structure (Chui et al. 2002), debt maturity (Zheng et al. 2012), cash management (Ramirez and Tadesse 2009; Chang and Noorbakhsh 2009), and corporate investment (Shao et al. 2013). Corporate risk taking, corporate investment, capital structure, debt maturity and cash management are important criteria used in the rating review process (S&P RatingsDirect 2013).
The informal constraints that stem from culture have an extensive influence on daily behaviors, and this influence extends far beyond formal laws (North 1990). Culture directly affects managers’ perceptions of questionable business practices (Vitell et al. 1993; Cohen et al. 1996) and indirectly influences managers’ choices relating to financial disclosures, financial report quality (Gray 1988; Hope 2003) and the degree of earnings management (Han et al. 2010; Desender et al. 2011). Jorion et al. (2009) consider increased earnings management the contributing factor that has led to a deterioration in the quality of corporate investment ratings.
The conflict of interest between shareholders and creditors, and the extent of protection toward shareholders and creditors vary markedly across countries (Li et al. 2013). Paredes and Wheatley (2017) find that measures of investor protection are “subsumed” by culture. Culture affects managers’ decisions to hire a Big Four auditor (Hope et al. 2008). High quality audits reduce information asymmetries and agency conflicts between corporate managers (shareholders) and creditors (Jensen and Meckling 1976). Culture also affects dividend policy (Shao et al. 2010; Fidrmuc and Jacob 2010; Bae et al. 2012), and dividend policy has been widely used as a monitoring mechanism to minimize agency problems. Culture may also complicate the negotiations to avoid a default between corporate managers (shareholders) and creditors.2
There is increasing recognition of the role culture plays in corporate risk taking and corporate credit risk. An interesting question which has not been addressed in the literature is if and how culture affects changes in credit risk, specifically, changes in ratings. Though culture is very stable, I argue that some cultures may predispose to more rating changes while other cultures may lead to directional predisposition for rating changes over time. As discussed in Section 2.3, a strong uncertainty avoidance trait may lead to more downgrades while a long-term orientation trait may result in fewer downgrades as time passes. Analysts may be more prone to change corporate ratings in countries with a high score for masculinity, individualism, and power distance.
Culture is expected to affect rating migrations through two channels (Appendix A). First, culture influences macro-economic activities3 through its roles as an informal constraint and through its effects on managerial decision making (Zheng et al. 2012). Ratings move pro-cyclically (Lobo et al. 2017) and rating regrades are primarily affected by macro-economic conditions (Blume et al. 1991). Accelerated downgrades and defaults occur more often during economic contractions while upgrades tend to outweigh downgrades during economic expansions (Bangia et al. 2002; Lobo et al. 2017). Rating volatility is intensified during business cycle troughs and subdued during business cycle peaks (Nickell et al. 2000).
Second, culture feeds into the rating review process (as discussed above) and thus affects a firm’s rating and its rating history. Empirical studies suggest that the current rating and various aspects of rating history impact on subsequent rating changes. For example, issuers in the boundary between investment and speculative rating grades (BBB−/BB+) exhibit different migration dynamics compared with other issuers (Carty and Fons 1994; Johnson 2004). Issuers downgraded to a given rating are more likely to be downgraded than those upgraded to that rating grade.4
The above discussion motivates this study to examine the impact of national culture on corporate rating migrations. The effects of culture are examined after accounting for variables that have been found to be significant in previous studies on rating migrations. The results of this study provide robust evidence that national culture significantly impacts the probability of rating changes of 17,109 ratings (5360 firms) across 50 countries over the period 1985–2010. The evidence in favor of including culture variables is stronger for rating downgrades and when numeric scores are used to represent culture values.
This study finds that long-term orientation (LTO) value is associated with a lower downgrade hazard, and in some cases, a higher upgrade probability. The effect of LTO on downgrades is robust to alternative samples (with and without U.S. firms), alternative measures of culture (Hofstede’s and Schwartz’s culture scores) and alternative study periods (crisis and non-crisis times). Uncertainty avoidance trait makes a downgrade more likely whereas power distance (hierarchy) and embeddedness trait reduces the risk of a downgrade. There is some evidence that masculinity dimension predisposes firms to more rating transitions.
This study extends the literature in two ways. First, this is the first study to explore the effects of culture values established by Hofstede et al. (2010) and Schwartz (1994) on the rating migration hazards of 5360 firms in 50 countries over a 26-year period. The study suggests a cross-disciplinary explanation and establishes a link between culture literature and rating migration literature. Second, the study applies a survival analysis framework (Allison 1995) and develops Cox’s dynamic hazard model (Cox 1972) which offers three attractive features: It accounts for the sequence of rating migrations of the same firm, includes both time-fixed and time-varying variables in the estimation process, and allows for non-Markovian behaviors, such as within-rating heterogeneity and time-heterogeneity, in corporate rating migration dynamics.
2. National Culture and Corporate Rating Migrations
2.1. Rating Data
This study employs Standard and Poor’s foreign currency issuer ratings retrieved from Ratings Xpress database on 28 September 2010. Firm-specific data other than credit ratings are not available. Standard and Poor’s (S&P) ratings are used as S&P’s decisions are generally timelier than Moody’s (Güttler 2011). Foreign currency ratings are used as the persistence of national culture dimensions is relevant for firms which issue debts in international markets.
Financial institutions and utilities are excluded from this study for two reasons. First, previous studies suggest that financial institutions exhibit different rating migration dynamics compared with industrial firms (Nickell et al. 2000; Lando and Skodeberg 2002). Second, financial institutions and utilities operate in highly regulated environments and are closely monitored by their respective regulatory agencies. This suggests less latitude for corporate managers in these sectors to exhibit flexibility in decision making. Thus, financial institutions and utilities deserve a separate study and this article focuses entirely on other sectors. The study spans the period from 1 January 19855 to 28 September 2010.
2.2. Culture Data
Hofstede’s culture values have been widely employed in various business disciplines including finance. This study employs Hofstede et al. (2010)’s five culture values, namely power distance index, uncertainty avoidance index, individualism versus collectivism, masculinity versus femininity, and long-term versus short-term orientation. A country’s score for a culture value does not represent an absolute position but reflects its ranking relative to other countries. The validity of culture values persists for a long period of time. Hofstede (2001, p. 255) stresses that in the long term “cultures shift, but they shift in formation so that the differences between them remain intact.”
This study employs the numerical scores of Hofstede’s five culture values and five dummy variables, each based on a country’s score relative to the mean score. Scores greater than or equal to the mean take a value of one or zero otherwise. As the differences between cultures remain stable over time, the use of dummy variables helps maintain the relative rankings between cultures over the study period.
Most culture values introduced in recent studies are conceptually related to and empirically correlated with Hofstede’s culture values (Leung et al. 2005).6 Two widely known frameworks that categorize culture along similar values are the GLOBE study conducted by Robert House and his team in 1991 and Schwartz (1994). GLOBE values are not used in this study as, despite using the same terms, their meanings are different compared with Hofstede’s values. The approach the GLOBE team used to formulate survey questions suffers from major disadvantages (Hofstede et al. 2010, pp. 42–43).
There are significant correlations between Schwartz’s scores and Hofstede’s scores (Hofstede et al. 2010, p. 41). Given their comparability, this study employs the numeric scores of two of Schwartz’s culture measures, embeddedness7 and hierarchy, as alternative measures of Hofstede’s collectivism (the opposite pole of individualism) and power distance index, respectively. As in Zheng et al. (2012), this study does not employ Schwartz’s mastery trait because it captures such values as success, independence, ambition, and capability, which overlap with those of Hofstede’s individualism and masculinity traits.
2.3. Culture Dimensions
The following discussion elaborates on the possible links between culture values and corporate rating migrations, as outlined in Appendix A. In some cultures, firms are naturally predisposed to rating changes in a particular direction (downgrade or upgrade) while in other cultures firms tend to migrate from the current rating in either direction.
2.3.1. Power Distance Index (PDI) or Hierarchy
Hofstede’s power distance index (PDI) and Schwartz’s hierarchy reflect the extent to which people accept an unequal, hierarchical distribution of power, authority and wealth (Hope 2003; Licht et al. 2005). Small power distance (PD) cultures strive to equalize the distribution of power, and justification is required for any inequalities. Large PD cultures accept a hierarchical order in which everybody has a place and no further justification is required (Hofstede et al. 2010).
Agency conflicts are less severe in large PD countries as there is greater acceptance of wealth and power inequalities (Fidrmuc and Jacob 2010). As a result, firms adopt a lower dividend payout policy and are less likely to hire a Big Four auditor (Hope et al. 2008). It is difficult for firms to get access to long-term credit markets given the greater risk of violence in domestic politics. Thus, firms employ more short-term debt than long-term debt and exhibit a lower degree of financial risk (Zheng et al. 2012). Contributing to this view is the evidence that banks in large PD countries tend to take fewer risks (Ashraf et al. 2016).
A high PD score is related to a high degree of earnings management (Paredes and Wheatley 2017). Corporate managers exhibit strong influences on financial reporting choices and prefer not to disclose information to preserve power inequalities (Zarzeski 1996). People often view a questionable business practice as ethical (Cohen et al. 1996, p. 58) and are more tolerant of corruption and tax evasion (Husted 1999; Tsakumis et al. 2007). Policy debates and political discussions are not often seen in larger PD societies, which indicates a lower degree of transparency and accountability.
The above discussion suggests that a high PD score may predispose firms to rating changes in either direction (downgrade and upgrade).
2.3.2. Individualism (IDV) versus Collectivism (Embeddedness)
People in individualistic countries (high IDV score) show autonomy and are encouraged to pursue personal goals and stand up for their rights (Licht et al. 2005). Hofstede’s individualism trait may predispose firms to rating changes in either direction (downgrade and upgrade), as discussed below.
Individualistic countries have strong economies (Hofstede 2001, p. 519) and tend to adopt market-based financial systems, which encourage corporate risk taking (Li et al. 2013). Their preferred Anglo-Saxon corporate governance systems focus on shareholders’ interests (Griffin et al. 2015). Firms employ a high degree of leverage (Chui et al. 2002), invest more in long-term assets, R&D projects (instead of physical assets), and employ excess cash to increase R&D (instead of increasing dividends) (Shao et al. 2013). Aggressive risk-taking results in more volatile operating income (Li et al. 2013). Consequently, managers are more likely to manage earnings (Han et al. 2010) and engage in income smoothing (Fonseca and Gonzalez 2008). Agency conflicts are inherently more severe (Chui et al. 2002) as corporate insiders exhibit a strong tendency to pursue their own personal interests rather than adhere to different stakeholders’ preferences.
On the positive side, individualistic countries have effective regulatory systems. Laws and rights are equal for all groups, and formal institutions are established to protect the rights of competing parties, such as shareholders and creditors (Licht et al. 2005). Firms tend to adopt a high dividend payout policy to minimize agency problem concerns (Shao et al. 2010; Fidrmuc and Jacob 2010). The business environment in individualistic cultures is more competitive and less secretive than in collectivistic cultures (Gray 1988). Firms are open to extensive accounting disclosures (Gray and Vint 1995) and are more likely to hire a Big Four auditor (Hope et al. 2008). People are less tolerant of corruption and tax evasion (Tsakumis et al. 2007).
In collectivistic (embeddedness) cultures (low IDV score), people have less need for autonomy and an active determination of their own lives. Schwartz’s embeddedness trait is expected to lower downgrade hazard and raise upgrade probability, as discussed below.
Collectivistic (embeddedness) cultures focus on maintaining a harmonious relationship within a society and preserving public images. People value conformity and adherence to societal norms and regulations (Hofstede 1980). Firms tend to adopt autocratic and paternalistic management systems. Corporate managers are very concerned about the liquidation costs to its stakeholders (Titman 1984). Capital structure is decided by corporate leaders who have strong views that there should be no detrimental effect on employees. As a high degree of financial leverage restricts firms’ flexibility and raises the probability of bankruptcy, firms in embeddedness cultures tend to employ less debt (Chui et al. 2002) and use more short-term debt (Zheng et al. 2012). Avoiding bankruptcy is also consistent with preserving a firm’s public images.
Collectivistic (embeddedness) cultures are more likely to have bank-based financial systems and relation-based corporate governance systems, which place a greater emphasis on the interests of a firm’s different stakeholders (Griffin et al. 2015). Agency conflicts are less severe and excessive risk taking is not encouraged as managers tend to act in line with the interests of all stakeholders (Jensen and Meckling 1976; Fidrmuc and Jacob 2010; Shao et al. 2013). Corporate managers share a strong sense of responsibility and are less likely to differentiate between their own and others’ welfares.
Overall, individualism may predispose firms to more rating regrades whereas embeddedness is expected to raise upgrade hazard and reduce downgrade risk.
2.3.3. Masculinity (MAS) versus Femininity
Masculine cultures (high MAS score) value assertiveness, ambition, competition, challenge, recognition, material accomplishment, and success. Feminine cultures (low MAS score) value cooperation, modesty, tenderness, security, caring for the weak, and quality of life (Hofstede et al. 2010).
Masculine cultures encourage taking risky decisions and achieving performance goals. Men often exhibit overconfidence or self-attribution biases (Barber and Odean 2001). Compared with women, men are less likely to assess the accurate levels of risk associated with an assigned task (Byrnes et al. 1999). Men are also more likely to experience failure or unfavorable outcomes, and can be more aggressive than women about default. Contributing to this view is the evidence that banks in masculine countries are more likely to incur a large loss during a crisis (Kanagaretnam et al. 2011).
Masculine cultures are open to head-on confrontation (Licht et al. 2005) and encourage aggressive behaviors (Kanagaretnam et al. 2011). Conflicts are often resolved by fighting in masculine countries and by negotiation in feminine countries.8 The political environment in masculine countries tends to be adversarial, as opposed to cooperative coalitions in feminine countries (Hofstede et al. 2010, pp. 173–80).
Countries with high MAS scores are less likely to perceive ethical issues in business practices (Vitell et al. 1993, p. 758). However, masculine countries incorporate economic interests in legal form (Licht et al. 2005), and are less permissive in dealing with lawbreakers. Masculine countries focus more on punishment while feminine countries are more lenient and place greater emphasis on correction and rehabilitation (Hofstede 2001, p. 319).
Firms in masculine cultures are open to extensive information sharing (Hope 2003; Doupnik and Tsakumis 2004) as societies are more business oriented and value visible achievement. Corporate managers are concerned that debt covenants may restrict their aggressive business plans and fears of financial distress may interfere with their bold investment strategies. Firms thus prefer less debt financing (Chui et al. 2002) and use more short-term debt (Zheng et al. 2012). By contrast, feminine cultures may accept higher indebtedness to support their welfare systems “even at the expense of accomplishment and performance” (Weaver 2001, p. 9).
The above discussion suggests that a high MAS score may predispose firms to rating migrations in either direction (downgrade and upgrade).
2.3.4. Uncertainty Avoidance Index (UAI)
Uncertainty avoidance (UA) is the extent to which members of a society feel uncomfortable with uncertainty and find ambiguity stressful (Chui et al. 2002). People from strong UA countries are subject to a natural sense of urgency and are more likely to suffer from anxiety (Hofstede et al. 2010). A strong UA trait tends to exacerbate investor panic and create more uncertainty during market turmoil. Deteriorating market mood and heightened concerns about uncertainty often lead to drastic and accelerated downgrades.9
Uncertainty avoidance differs from risk avoidance (Tsakumis et al. 2007). High UA cultures perceive ambiguity as a continuous threat. People tend to “engage in risky behavior in order to reduce ambiguities, such as starting a fight with a potential opponent rather than sitting back and waiting”. They are open to familiar risks such as driving faster and having more fatal accidents but they show fears of ambiguity and unfamiliar risks (Hofstede et al. 2010, pp. 197–98).
Strong UA countries tend to adopt bank-based financial systems (Kwok and Tadesse 2006) and maintain a low degree of economic freedom. Firms in these countries have a negative view of competition. Debt financing is minimized as the use of debt imposes constraints and may lead to financial instability (Chui et al. 2002). Corporate managers are concerned about potential financial distress and the cash shortage that may require capital raising under unfavorable market conditions or fire sales of a firm’s assets (Chang and Noorbakhsh 2009). Access to long-term credit markets is difficult given the greater risk of political instability.10 So, firms prefer to use more short-term debt (Zheng et al. 2012), adopt a lower dividend payout policy (Fidrmuc and Jacob 2010) and hold more cash (Ramirez and Tadesse 2009; Chang and Noorbakhsh 2009). Firms are not open to extensive accounting disclosure (Gray and Vint 1995) and are less likely to hire a Big Four auditor (Hope et al. 2008). Information asymmetries and agency conflicts between managers (shareholders) and creditors tend to be greater.
In strong UA countries, “ineffective rules can satisfy people’s emotional need for formal structure” (Hofstede et al. 2010, p. 209). Corporate managers are less likely to perceive ethical problems and are not opposed to contravening an unjust law. In situations where outcomes cannot be determined with certainty, corruption is viewed as an option to secure a predictable result. Tax evasion is considered a means of reducing ambiguity (Vitell et al. 1993, p. 757; Husted 1999; Tsakumis et al. 2007; Hofstede et al. 2010, p. 223). By contrast, in weak UA countries rules are often more likely to be followed (Hofstede et al. 2010), investors’ legal rights are stronger (Licht et al. 2005), and people are less likely to view tax evasion as a viable option.
In strong UA societies, people are also slower in paying their bills (De Mooij 2004, p. 154). These countries have more precise formal laws, informal rules, rigid safety and security measures in place. However, it takes more time for their citizens to comply with two simple civil procedures: collecting a bounced check which had been refused by a bank and evicting a tenant for non-payment of rent (Hofstede et al. 2010, pp. 216–17). Debt burdened firms in strong UA countries may not waste time negotiating with creditor(s) to reduce their delinquent debts. Driven by a high level of anxiety and a natural sense of urgency, these firms may simply walk away to avoid any uncertainty associated with the debt restructure process.
In the light of this discussion, a high UA score is expected to make downgrades more likely and upgrades less likely.
2.3.5. Long-Term (LT) versus Short-Term (ST) Orientation
Long-term oriented societies (high LTO score) value pragmatic virtues related to the future, such as savings and adapting to changing circumstances (Hofstede et al. 2010, p. 239). Firms invest in building up strong market positions even at the expense of poor short-term performance. Managers are allowed time and resources to make sustained efforts with an aim to serve stakeholders and future generations (Hofstede et al. 2010, p. 244). Young people are taught the importance of savings and learn to put money aside for future uses.
Short-term oriented societies (low LTO score)—for example, Arab countries—value virtues related to the past and present such as national pride, respect for tradition, preservation of public images, and fulfilling social obligations (Hofstede et al. 2010, p. 239). Young people, affected by a culture of consumption, often live beyond their means. Corporate managers focus on the immediate results and are judged by their short-term performance. The cost of short-term decisions in terms of “pecuniary considerations, myopic decisions, work process control, hasty adoption, and quick abandonment of novel ideas” is evident (Hofstede et al. 2010, pp. 244–45).
The economic success of Taiwan, South Korean, Singapore, Hong Kong and Japan in the early 1990s highlights the value of their LTO cultures. These countries encourage thrift, perseverance (Anderson et al. 2011), and support entrepreneurial activities. People are persistent in the pursuit of their goals and are less tolerant of questionable business activities (Cohen et al. 1996). Their thrift translates into higher savings and growth rates (Hofstede et al. 2010, pp. 38, 263–65) and the availability of capital for reinvestment. Firms are less likely to rely heavily on debt financing. The sense of shame prevalent in LTO societies encourages interrelatedness through social contacts and stresses the importance of keeping commitments (Hofstede et al. 2010, pp. 243–44). Firms have strong ethical motivations to pay debts on time, and the severity of agency conflicts is inherently lower given their focus on stakeholders and future generations.
In the light of this discussion, a high LTO score is expected to make upgrades more likely and downgrades less likely.
3. Models and Variables
3.1. Estimation Model
This study applies a survival analysis framework (Allison 1995) and develops Cox’s dynamic hazard model (Cox 1972) to examine the effect of culture on the probability of corporate rating migrations. Previous studies suggest that upgrade and downgrade follow different dynamics (Figlewski et al. 2012; Dang and Partington 2014). Thus, upgrade and downgrade are treated as competing risks, and separate models are estimated for these two migration outcomes.
Rating observations are arranged in event time (gap time) risk sets; each risk set includes all the firms that are at risk of a migration of interest at event time t. The clock is reset when a firm is assigned a rating grade. An upgrade (downgrade) is treated as a migration of interest (a censored observation) when estimating the upgrade model, and vice versa. Ratings which started before the beginning of the study or ended after the end of the study are also treated as censored. The survival time of a rating is the time a firm maintains a rating grade measured from the time it enters the rating grade subsequent to the start of the study until the time it either migrates to another rating grade or becomes censored.
Cox’s hazard model is the premier technique in survival analysis. The main attraction of the estimated model is that it is convenient to handle repeated migrations. A typical firm experienced several migrations during the study period, which may lead to dependence among ratings. Accounting for repeated migrations is important as 42.6% (18%) of the firms in the main sample experienced between 2 and 15 downgrades (upgrades); the most volatile firms experienced 26 downgrades (25 upgrades). This highlights the need to consider unobserved heterogeneity in the underlying hazard of a rating change and to ensure that a firm is not considered at risk of a rating change before all previous rating changes have already occurred (Hosmer et al. 2008).
The problem arising from repeated migrations is minimized in two ways. First, the Wei et al. (1989)’s method for multiple failure time data is applied to account for the dependence among ratings of the same firm. The advantage of this method is that it does not require any assumptions about the nature or the structure of the dependence (Allison 1995, p. 242). Second, the estimation of the stratified hazard model, as in as Dang and Partington (2014), takes into account the sequence of rating changes. Each stratum includes ratings that have the same number of prior changes. The underlying (baseline) hazard of a rating change differs according to the number of prior changes whereas the effect of a variable is assumed to be the same across strata.
Another attractive feature of the estimated hazard model is that it accommodates time-varying outlook and rating age. A firm may be assigned a negative, positive, stable or developing outlook while its rating remains unchanged. A negative (positive) outlook signals the deterioration (improvement) in a firm’s credit quality, and indicates S&P’s opinion regarding the potential direction of a long-term credit rating over the intermediate term (six months to two years) (S&P RatingsDirect 2009). Estimating stratified dynamic hazard models with time-varying variables on a sample of 17,109 ratings (5360 firms) across 50 countries over a 26-year period creates substantial computational challenges in this study.
The hazard of a rating change m in stratum s is given by the product of the underlying (baseline) hazard h(0,s)(t) and the effect of the risk factors (covariates), and can be expressed as follows:
where: hm,s(t, Z, Z(t)) is the migration hazard of rating m in stratum s at time t given its time-fixed covariate vector and its time-varying covariate vector ; h(0,s)(t) is the baseline hazard of a migration in stratum s at time t; is the vector of estimated coefficients for time-varying covariates ; and is the vector of estimated coefficients for time-fixed covariates .
The full rating migration model is estimated by multiplying together the individual likelihood functions for all the strata in the sample.
3.2. Variables
The definitions of variables employed, the data sources, and the references to examples of the relevant literature are given in Table 1.
The first group of variables includes Hofstede’s five culture values and two of Schwartz’s culture values, as discussed in the previous section.
The second group of variables accounts for the current rating (current rating grade), its proximity to investment/speculative rating threshold (dummy investment boundary, dummy junk boundary), rating history (logarithm of age since first rated, dummy lag one downgrade, lag one duration, dummy prior fallen angel, dummy large downgrade, dummy large upgrade, rating volatility) and time-varying rating outlook (dummy negative outlook, dummy positive outlook). Previous studies on corporate rating migrations have widely documented that the direction of lagged rating change, the duration of lagged rating, and rating outlook are the key determinants of rating changes.11 The use of lagged dependent variable (lag one duration) and important control variables (dummy lag one downgrade, dummy negative outlook, dummy positive outlook) minimizes endogeneity concerns, Li (2016).
The third group of variables takes into account country characteristics. Potential variables are identified from previous studies on rating migrations. The choices of variables eliminate multi-collinearity concerns and aim at creating a sample from a large number of cultures. Selected variables are proxies for changes in macro-economic conditions (change in real GDP growth rate, change in inflation, change in current account surplus/GDP, change in term trade), the level of economic development (logarithm of GDP per capita, dummy OECD member), the degree of stock market capitalization (logarithm of ratio stock market capitalization/GDP), the existence of a sovereign debt/banking crisis (dummy debt crisis), and a history of sovereign foreign currency debt defaults (dummy prior default). Selected variables also account for the performance of global stock market (return of world stock market index), and the political risk in each country (dummy high political risk, dummy low political risk). By definition, dummy high political risk and dummy low political risk capture institutional factors such as religion and law (Table 1). The use of these variables further minimizes endogeneity concerns.
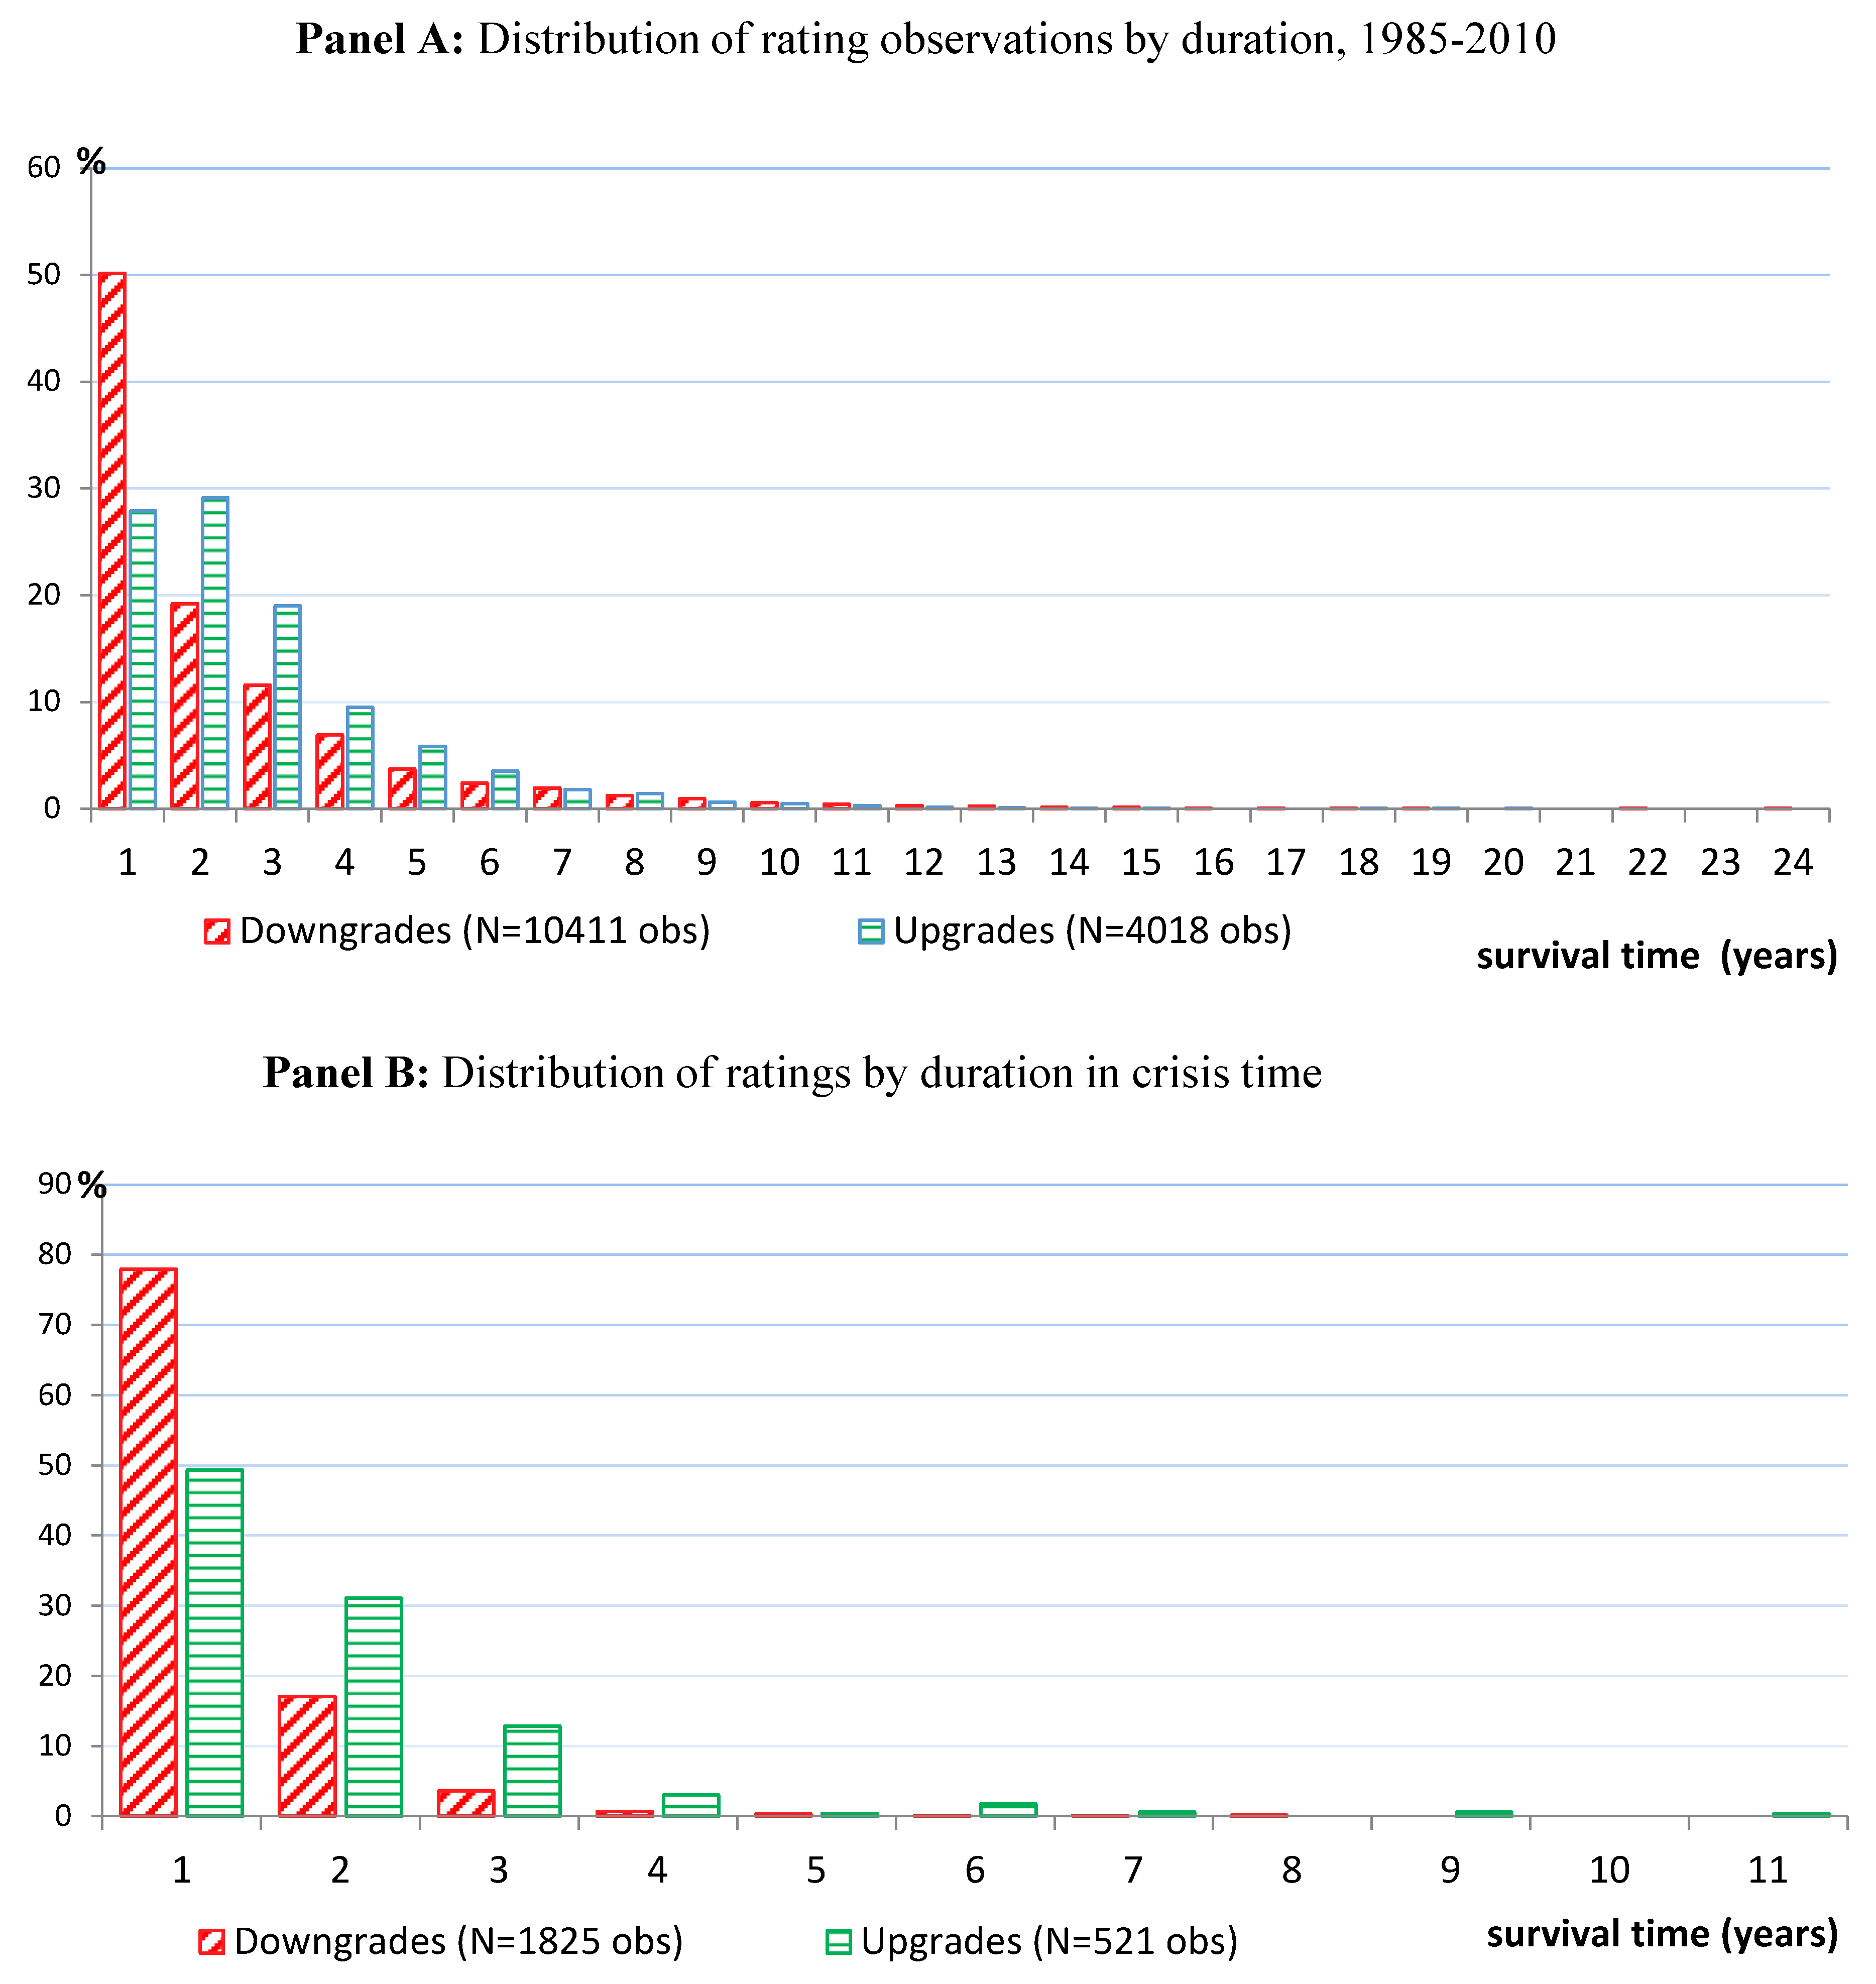
The variables are of two types: static (time-fixed) and dynamic (time-varying). The time-varying variables (dummy negative outlook, dummy positive outlook, logarithm of age since first rated) are updated over the duration of a rating as its outlook changes or as a migration of interest occurs. The time-fixed variables take the values observed at the start or closest to the start of a rating observation and are not changed over the duration of a rating.12 The values of static variables only change when the rating changes. The durations of ratings, particularly for downgrades, were small, as depicted in Figure 1. Thus, substantial changes in the values of static variables during the duration of a rating were unlikely.
3.3. Samples
Since the data on outlook and the last rating change are required, only firms having at least one rating outlook and experiencing at least one prior migration during the study period are included in the final dataset. The main sample, sample A(H), includes 17,109 ratings of 5360 firms from 50 countries. This sample consists of ratings which have no missing data on Hofstede (H)’s five culture values and control variables.
Several robustness tests are conducted using alternative samples, alternative study periods, and alternative culture measures. In the first test, Schwartz’s numeric scores for embeddedness and hierarchy are used as alternative measures of Hofstede’s numeric scores for collectivism (the opposite pole of individualism) and power distance index, respectively. The requirement of data availability for Schwartz (S)’s culture scores causes a small reduction in the size of sample A(H), resulting in sample A(H-S) of 16,966 ratings. Each rating in sample A(H-S) has no missing data for three of Hofstede (H)’s culture values (masculinity, uncertainty avoidance index, and long-term orientation), two of Schwartz (S)’s culture values (embeddedness and hierarchy), and all control variables.
In the second robustness test, U.S. firms are excluded from samples A(H) and A(H-S), which results in samples B(H) and B(H-S), respectively. Sample B(H) (with Hofstede’s culture values) includes 4745 ratings of 1717 firms from 49 countries. Sample B(H-S) (with Hofstede and Schwartz’s culture values) includes 4602 ratings.
In the third test, ratings in sample A(H) are pooled across countries at the time they were (were not) experiencing a debt/a banking crisis, as defined in Manasse et al. (2003), Laeven and Valencia (2008), and De Paoli et al. (2009). Restricting the study period to crisis and non-crisis times results in samples C(H-1) and C(H-2), respectively. Sample C(H-1) (crisis times) includes 3927 ratings of 2088 firms from 32 countries. Sample C(H-2) (non-crisis times) includes 13,182 ratings of 4614 firms from 50 countries. Excluding U.S firms from sample C(H-2) results in sample C(H-3) of 3714 ratings (1535 firms).
3.4. Statistics
A numerical rating scale is employed to represent S&P’s alphabetical ratings, ranging from AAA as 21 to C as 1. The descriptive statistics of the current rating grades (start rating) for observations in the three samples with Hofstede’s culture scores are presented in Panel A of Table 2. On average, firms in all three samples had a speculative grade median rating (BB for the whole sample and BB+ for the sample excluding U.S firms). During crisis times the median rating dropped by two notches from BB to B+, suggesting a substantial decline in credit quality.
The descriptive statistics of the survival times for downgrades and upgrades in the three samples with Hofstede’s culture scores are respectively given in Panel B and Panel C of Table 2. The median survival time was 1 year (1.74 years) for downgrades (upgrades) in the entire sample A(H), and about 0.38 year (1.01 year) for downgrades (upgrades) in the crisis sample C(H-1).
Downgrades (upgrades) account for 60.85% (23.48%), 56.08% (23.1%) and 46.47% (13.3%) of the entire sample A(H), non-U.S. sample B(H), and crisis sample C(H-1), respectively. The surprisingly low frequency of downgrades in the crisis sample is due to the lower than average frequency of downgrades of U.S. firms during crisis times. This is not too surprising as the study does not consider financial sector and thus does not examine accelerated downgrades which occurred to a large number of U.S. financial institutions during the financial crisis 2007–2009. Additional analysis shows that for non-U.S. firms, the frequency of downgrades is comparable (56%) across business cycles. For U.S. firms, the frequency of downgrades is markedly higher in non-crisis times (68.63%) than in crisis times (43.23%). For both U.S. and non-U.S. firms, upgrades occur much less often in crisis times.
The histograms of survival times for downgrades and upgrades in sample A(H) (the entire sample) and sample C(H-1) (crisis times) are depicted in Figure 1. Overall, downgrades had a shorter survival time than upgrades and were heavily massed in durations shorter than a year. About 50% of downgrades during the study period and about 80% of downgrades during crisis times retained their current rating for less than a year.
Panels A and B of Table 3 give the descriptive statistics of the numeric scores on Hofstede’s five culture values and Schwartz’s two culture values for firms in samples A(H) and B(H), respectively. There is a wide range of variation in the scores for each of Hofstede’s culture values. Compared with firms in sample A(H), non-U.S. firms in sample B(H) show characteristics of larger power distance (PDI), more feminine (MAS), more collectivistic (IDV), stronger risk-avoiding (UAI), and more long-term oriented (LTO) cultures.
4. Results
Separate models are estimated for downgrades and upgrades. Overall, culture values have significant effects on downgrades and upgrades after accounting for time-varying rating outlook, various aspects of rating history, macro-economic conditions and political risks.
4.1. Models for the Whole Sample (Samples A(H) and A(H-S))
The results of the models for the whole sample are given in Table 4. For each migration outcome, three models are estimated and three sets of results are given: first, using dummy variables where each dummy is set according to a country’s score on Hofstede’s culture value relative to the mean (model 1); second, using numeric scores for Hofstede’s culture values (model 2); and, third using numeric scores for Hofstede’s and Schwarz’s culture values (model 3).
As presented in Table 4, most of the retained variables are significant at the 10% level or better based on a Wald chi-square test. Culture values have stronger effects on downgrades than upgrades. The downgrade model with Hofstede and Schwartz’s scores (model 3) features the significance of all five culture measures. The sign of a significant culture variable in model (3) is consistent with its sign (if significant) in model (1) and model (2).
The three models for downgrades feature one common culture value, which is long-term orientation (LTO)/dummy LTO, and its sign is as expected. Being in a LTO country reduces the downgrade probability by 25.2% (model 1) whereas a one-unit increase in LTO score makes a downgrade 0.9% (model 2) or 1.1% (model 3) less likely.13
Power distance index (PDI) is significant in model (2) for downgrades while hierarchy is present in model (3) for both downgrades and upgrades. Schwartz’s score of hierarchy has a stronger effect than Hofstede’s score of PDI. For example, a one-unit increase in hierarchy makes a downgrade 29.8% less likely and an upgrade 73.7% more likely (model 3). A one-unit increase in PDI reduces the downgrade hazard by only 1% (model 2). This is not surprising as the score of Hofstede’s PDI value for a country is much higher than the respective score of Schwartz’s hierarchy value (Table 3). The risk being changed is very small for a one-unit increase in PDI.
Apart from LTO and PDI/hierarchy, models (2) and (3) for downgrades share another common culture value which is uncertainty avoidance index (UAI). As expected, firms residing in strong UA countries have unfavorable experiences toward downgrades.
Individualism (IDV)/ Dummy IDV is not significant in models (1) and (2). However, embeddedness is significant in model (3) for downgrades. Embeddedness is comparable to collectivism which is the opposite pole of individualism. As expected, firms in embeddedness cultures are less likely to experience a downgrade (model 3).
For upgrades, hierarchy is the only significant variable in model (3) (as discussed above) while masculinity (MAS)/ dummy MAS is the only significant variable in models (1) and (2). MAS’s positive sign in models (1) and (2) (for upgrades) and model 3 (for downgrades) suggests that firms in MAS cultures are more likely to experience rating changes in either direction.
With regard to control variables, the following discussion focuses on those significant in all three models for downgrades (upgrades). Firms rated around the speculative rating boundary (BB+/BB/BB) are more likely to become rising stars. Firms rated close to the investment rating threshold (BBB+/BBB/BBB−) or those with a positive outlook have lower downgrade risk and higher upgrade probability. Consistent with prior literature, issuers with a lagged downgrade or a negative outlook exhibit a strong tendency to travel downward on the rating spectrum. Older firms, firms with a high current rating, a volatile rating history or those which have experienced a fallen angel event tend to retain the current rating grade. Firms with a longer lagged rating or those with a prior substantial downgrade are more likely to experience a subsequent migration.
With regard to macro-economic environment, a strong global equity market is associated with a lower rating volatility, raising the probability that a firm will retain its current rating grade. Firms in OECD countries or countries with strong current account balances tend to go up the rating scales. Firms in countries high on inflation or countries with equity market-based economies experience fewer upgrades. A high GDP growth rate, a strong current account balance, and an emergence from a sovereign default lower the probability of corporate downgrades.
In terms of political risk, the effect of dummy low political risk is in contrast to initial expectations. Firms in countries with low political risk are more likely to be downgraded and less likely to be upgraded. Perhaps this surprising effect is due to the sample being dominated by U.S. firms.
A natural question is whether the impact of culture remains robust when the sample is restricted to non-U.S. firms and the study period is restricted to crisis/ non-crisis times.
4.2. Robustness Tests
4.2.1. Models for Non-U.S. Firms (Samples B(H) and B(H-S))
The results of the models for non-U.S. firms are given in Table 5. The evidence in favor of including culture variables is weaker in the upgrade models and stronger in the downgrade models (compared with the respective models in Table 4).
For downgrades, dummy LTO/LTO remains significant in three models. Consistent with the results presented in Table 4, firms in LTO cultures are less likely to be downgraded. Model (3) for downgrades features only four significant culture values compared with five significant culture values in the respective model for the whole sample (Table 4). UAI is no longer present in model (3) whereas dummy UAI and dummy large PDI become significant in model (1). The negative sign of dummy large PDI (model 1) is consistent with the negative sign of PDI (model 2), hierarchy (model 3) and the results presented in Table 4. Similarly, the positive sign of dummy UAI (model 1) is consistent with the positive sign of UAI (model 2).
For upgrades, model (1) does not feature any significant culture dummies. In model (3), hierarchy is no longer significant and is replaced by MAS. The positive effect of MAS on upgrades (models 2 and 3) and on downgrades (model 3) is as expected. Firms in MAS cultures are more volatile and exhibit a tendency to migrate from the current rating in either direction.
4.2.2. Models for Crisis and Non-Crisis Periods (Samples C(H-1), C(H-2), C(H-3))
Table 6 presents the results of the models for crisis sample C(H-1), non-crisis sample C(H-2), and non-crisis non-U.S. sample C(H-3). For reasons of brevity, only the results of the models with Hofstede’s numeric scores are reported in Table 6.
Overall, the statistical significance of culture variables for crisis and non-crisis samples is weaker. Consistent with the results presented in Table 4 and Table 5, LTO is the only culture value which is significant in the downgrade models for three samples. Firms in LTO cultures are less likely to be downgraded and during crisis times, are more likely to be upgraded.
UAI is only present in the downgrade model for the crisis sample. A strong UA culture (UAI) predisposes to more downgrades during crisis times. The effect is consistent with its effect on the whole sample (Table 4) and non-U.S. sample (Table 5). PDI is significant in the downgrade model for the crisis sample and the upgrade model for the non-crisis non-U.S. sample. A high PDI score reduces the downgrade hazard during crisis times and raises the upgrade probability of non-U.S. firms during non-crisis periods. The impact of PDI on downgrades during crisis times is consistent with its impact on the whole sample (Table 4) and non-U.S. sample (Table 5). MAS is not present in any downgrade models while IDV is not significant in any models.
The upgrade models for three samples do not share any significant common culture variable. However, MAS is significant in the upgrade models for the two non-crisis samples. Its positive sign suggests that firms in MAS cultures are more likely to be upgraded during non-crisis periods.
4.2.3. Other Robustness Tests
For each migration outcome, model (1) is re-estimated for three samples using dummy variables where each dummy is set according to a country’s score on Hofstede’s culture value relative to the median score. Three samples are used in this test: the whole sample (sample A(H)), non-U.S. sample (sample B(H)) and crisis sample (sample C(H-1)). Untabulated results across the three samples consistently show that firms in LTO countries (dummy LTO) are less likely to go down the rating scales. Dummy LTO is significant in both downgrade and upgrade models for the whole sample, and its opposite effects are as expected.
Dummy masculinity (MAS) is also significant in the models for the two large samples A(H) and B(H). The positive effect of dummy MAS on upgrades in sample A(H) is consistent with the result of the respective model when dummy MAS is set based on a country score relative to the mean score (Table 4, model 1 for upgrades).
While dummy individualism/ IDV is not significant in any models presented in Table 4, Table 5 and Table 6, it is significant when each dummy is set based on a country score relative to the median score. Firms in individualistic countries are more likely to be downgraded (for the whole sample and non-U.S. sample) and less likely to be upgraded (for the crisis sample).
5. Conclusions
The informal constraints (social influences) that arise from the national culture in which a firm resides have a pervasive impact on managerial decision making and corporate credit risk, which in turn impacts on corporate ratings and rating changes. Some cultures may lead to more rating changes whereas other cultures may result in a directional predisposition for rating changes (downgrade or upgrade). This study is the first attempt to explore the effects of national culture values established by Hofstede et al. (2010) and Schwartz (1994) on the rating migration dynamics of 5360 firms across 50 countries over the period 1985–2010. The study enriches the literature by presenting empirical evidence that national culture provides a better explanation of corporate rating migrations. The effects of culture are significant after accounting for variables which have been found significant in previous studies on rating migrations. The study overcomes computational challenges in estimating stratified dynamic hazard models (with time-varying variables) for a large sample of 17,109 ratings.
Overall, the evidence in favor of including culture variables is generally stronger in the downgrade models or when numeric scores are employed to represent culture. The evidence of statistical significance is strongest for the effect of long-term orientation. Firms located in long-term oriented cultures (LTO) are less likely to be downgraded and in some cases, more likely to climb up the rating scales. The effect of LTO on downgrades is robust to alternative samples, alternative measures of culture and alternative study periods. There is some evidence that downgrades occur more often in strong uncertainty-avoiding countries and less often in large power distance (hierarchy) and embeddedness countries. Masculinity predisposes to a higher rating volatility, raising the probability of downgrades and upgrades.
This study is somewhat limited as apart from credit rating, other firm-specific data is not available. In the absence of variables such as firm size, it is not possible to examine the effects of culture on rating levels. This study therefore focuses on the effects of national culture on the probability of rating migrations. The estimated models of rating changes include the current rating, which captures firm-specific characteristics such as firm size and leverage, and time-varying rating outlooks, which signal the potential direction of a long-term credit rating over the intermediate term. Thus, the lack of firm-specific data such as firm size is not a substantial concern for this study.
This study emphasizes the need to understand the role of culture in managerial decision making and corporate policies, which feed into the rating review process. Studying culture helps enrich our understanding of corporate rating migration dynamics. This knowledge in turn can be helpful in developing predictive models of corporate rating changes across countries. The results of this study have practical implications to investors who use credit ratings to make investment decisions.
Acknowledgments
I would like to thank two anonymous reviewers, the editors, and Jean Helwege, Gady Jacoby, Andreas Knetsch, Bing Li, Graham Partington, as well as participants at the 2017 Cross Country Perspectives in Finance Symposium for helpful suggestions. Thanks are also due to George Griffiths for proofreading this article, and to the Knowledge Unlatched and the MDPI for supporting this manuscript. The rating data used in this study was purchased thanks to the generous funding from the University of Munich (LMU). I am grateful for Andreas Richter, Susanne Weber, and the Center for Advanced Studies at LMU for the funding support.
Conflicts of Interest
The author declares no conflicts of interest.
Appendix A.
Appendix A outlines different channels over which national culture impacts on corporate rating migration dynamics.
Figure A1.
Possible links between national culture and corporate rating migrations.

References
- Afego, Pyemo N. 2018. Index shocks, investor action and long-run stock performance in Japan: A case of cultural behaviouralism? Journal of Behavioral and Experimental Finance 18: 54–66. [Google Scholar] [CrossRef]
- Allison, Paul D. 1995. Survival Analysis Using SAS: A Practical Guide. Cary: SAS Institute Inc., ISBN 978-1-59994-884-3. [Google Scholar]
- Altman, Edward. 1998. The importance and subtlety of credit rating migration. Journal of Banking and Finance 22: 1231–47. [Google Scholar] [CrossRef]
- Altman, Edward I., and Duen L. Kao. 1992. The implications of corporate bond rating drifts. Financial Analysts Journal 48: 64–75. [Google Scholar] [CrossRef]
- Anderson, Christopher W., Mark Fedenia, Mark Hirschey, and Hilla Skiba. 2011. Cultural influences on home bias and international diversification by institutional investors. Journal of Banking and Finance 35: 916–34. [Google Scholar] [CrossRef]
- Ashraf, Badar N., Changjun Zheng, and Sidra Arshad. 2016. Effects of national culture on bank risk-taking behavior. Research in International Business and Finance 27: 309–26. [Google Scholar] [CrossRef]
- Bae, Sung C., Kiyoung Chang, and Eun Kang. 2012. Culture, corporate governance and dividend policy: International evidence. The Journal of Financial Research 35: 289–316. [Google Scholar] [CrossRef]
- Bangia, Anil, Francis X. Diebold, André Kronimus, Christian Schagen, and Til Schuermann. 2002. Rating Migrations and the Business Cycle, with Applications to Credit Portfolio Stress Testing. Journal of Banking and Finance 26: 445–74. [Google Scholar] [CrossRef]
- Barber, Brad M., and Terrance Odean. 2001. Boys will be boys: Gender, overconfidence and common stock investment. Quarterly Journal of Economics 116: 261–92. [Google Scholar] [CrossRef]
- Blume, Marshall E., Donald B. Keim, and Sandeep A. Patel. 1991. Returns and volatility of low-grade bonds, 1977–1989. Journal of Finance 46: 49–74. [Google Scholar] [CrossRef]
- Boubakri, Narjess, Ali Mirzaei, and Anis Samet. 2017. National culture and bank performance: Evidence from the recent financial crisis. Journal of Financial Stability 29: 36–56. [Google Scholar] [CrossRef]
- Byrnes, James P., David C. Miller, and William Schafer. 1999. Gender Differences in Risk Taking: A Meta-Analysis. Psychology Bulletin 75: 367–83. [Google Scholar] [CrossRef]
- Carty, Lee V., and Jerome S. Fons. 1994. Measuring Changes in Corporate Credit Quality. Journal of Fixed Income 4: 27–41. [Google Scholar] [CrossRef]
- Chang, Chih-Hsiang, and Shih-Jia Lin. 2015. The effects of national culture and behavioral pitfalls on investors’ decision-making: Herding behavior in international stock markets. International Review of Economics and Finance 37: 380–92. [Google Scholar] [CrossRef]
- Chang, Kiyoung, and Abbas Noorbakhsh. 2009. Does national culture affect international corporate cash holdings? Journal of Multinational Financial Management 19: 323–42. [Google Scholar] [CrossRef]
- Chui, Andy, Alison E. Lloyd, and Chuck C. Y. Kwok. 2002. The determination of capital structure: Is national culture a missing piece to the puzzle? Journal of International Business Studies 33: 99–127. [Google Scholar] [CrossRef]
- Cohen, Jeffrey R., Laurie W. Pant, and David J. Sharp. 1996. A methodological note on cross-cultural accounting ethics research. International Journal of Accounting 31: 55–66. [Google Scholar] [CrossRef]
- Cox, David R. 1972. Regression models and life tables. Journal of Royal Statistical Society Series B (Methodological) 34: 187–220. [Google Scholar] [CrossRef]
- Dang, Huong, and Graham Partington. 2014. Rating migrations: The effects of rating history and time. ABACUS 50: 174–202. [Google Scholar] [CrossRef]
- De Mooij, Marieke. 2004. Consumer Behaviour and Culture: Consequence for Global Marketing and Advertising. Thousand Oaks: Sage, ISBN 9781412979900. [Google Scholar]
- De Paoli, Bianca, Glenn Hoggarth, and Victoria Saporta. 2009. Output Costs of Sovereign Crises: Some Empirical Estimates. Bank of England Working Paper No. 362. Available online: https://0-www-bankofengland-co-uk.brum.beds.ac.uk/-/media/boe/files/working-paper/2009/output-costs-of-sovereign-crises-some-emperical-estimates.pdf (accessed on 2 November 2018).
- Desender, Kurt A., Christian E. Castro, and Sergio A. Escamilla De Leon. 2011. Earnings management and cultural values. American Journal of Economics and Sociology 70: 639–70. [Google Scholar] [CrossRef]
- Doupnik, Timothy S., and George T. Tsakumis. 2004. A critical review of tests of Gray’s theory of cultural relevance and suggestions for future research. Journal of Accounting Literature 23: 1–48. [Google Scholar]
- Ferri, Giovanni, Li-gang Liu, and Joseph E. Stiglitz. 1999. The procyclical role of rating agencies: Evidence from the East Asian crisis. Economic Notes 28: 335–55. [Google Scholar] [CrossRef]
- Fidrmuc, Jana P., and Marcus Jacob. 2010. Culture, agency costs and dividends. Journal of Comparative Economics 38: 321–39. [Google Scholar] [CrossRef]
- Figlewski, Stephen, Halina Frydman, and Weijian Liang. 2012. Modeling the Effects of Macroeconomic Factors on Corporate Default and Credit Rating Transitions. International Review of Economics and Finance 21: 87–105. [Google Scholar] [CrossRef]
- Fonseca, Ana R., and Francisco Gonzalez. 2008. Cross country determinants of bank income smoothing by managing loan-loss provisions. Journal of Banking and Finance 32: 217–28. [Google Scholar] [CrossRef]
- Gray, Sidney. 1988. Towards a theory of cultural influence on the development of accounting systems internationally. ABACUS 24: 1–15. [Google Scholar] [CrossRef]
- Gray, Sidney J., and Hazel M. Vint. 1995. The impact of culture on accounting disclosures: Some international evidence. Asia Pacific Journal of Accounting 21: 33–43. [Google Scholar] [CrossRef]
- Griffin, Dale, Omrane Guedhami, Chuck C. Y. Kwok, Kai Li, and Liang Shao. 2015. National Culture, Corporate Governance Practices and Firm Performance. Working Paper. Available online: https://memento.epfl.ch/public/upload/files/Paper_Li.pdf (accessed on 2 November 2018).
- Guiso, Luigi, Helios Herrera, and Massimo Morelli. 2016. Cultural differences and institutional integration. Journal of International Economics 99: 97–113. [Google Scholar] [CrossRef]
- Güttler, André. 2011. Lead-lag Relationships and Rating Convergence among Credit Rating Agencies. Journal of Credit Risk 7: 95–119. [Google Scholar] [CrossRef]
- Güttler, André, and Mark Wahrenburg. 2007. The adjustment of credit ratings in advance of defaults. Journal of Banking and Finance 31: 751–67. [Google Scholar] [CrossRef]
- Han, Sam, Tony Kang, Stephen Salter, and Yong Keun Yoo. 2010. A cross-country study on the effects of national culture on earnings management. Journal of International Business Studies 41: 123–41. [Google Scholar] [CrossRef]
- Hill, Paula, Robert Brooks, and Robert Faff. 2010. Variations in sovereign credit quality assessments across rating agencies. Journal of Banking and Finance 34: 1324–43. [Google Scholar] [CrossRef]
- Hofstede, Geert. 1980. Culture’s Consequences: International Differences in Work-Related Values. Beverly Hills: Sage, ISBN 9780803913066. [Google Scholar]
- Hofstede, Geert. 2001. Culture’s Consequences: Comparing Values, Behaviors, Institutions and Organizations Across Nations. Thousand Oaks: Sage, ISBN 9780803973244. [Google Scholar]
- Hofstede, Geert, Geert Hofstede, and Michael Minkov. 2010. Cultures and Organizations: Software of the Mind, 3rd ed. New York: McGraw-Hill, ISBN 978-0071664189. [Google Scholar]
- Hope, Ole-Kristian. 2003. Firm-level disclosures and the relative roles of culture and legal origin. Journal of International Financial Management and Accounting 14: 218–48. [Google Scholar] [CrossRef]
- Hope, Ole-Kristian, Tony Kang, Wayne Thomas, and Yong Keun Yoo. 2008. Culture and auditor choice: A test of the secrecy hypothesis. Journal of Accounting Public Policy 27: 357–73. [Google Scholar] [CrossRef]
- Hosmer, David W., Stanley Lemeshow, and Susanne May. 2008. Applied Survival Analysis: Regression Modeling of Time-to-Event Data, 2nd ed. New York: Wiley, ISBN 978-0-471-75499-2. [Google Scholar]
- Husted, Bryan. 1999. Wealth culture and corruption. Journal of International Business Studies 3: 339–59. [Google Scholar] [CrossRef]
- Jensen, Michael, and William Meckling. 1976. Theory of the firm: Managerial behavior, agency costs and ownership structure. Journal of Financial Economics 3: 305–60. [Google Scholar] [CrossRef]
- Johnson, Richard. 2004. Rating agency actions around the investment grade boundary. Journal of Fixed Income 13: 25–37. [Google Scholar] [CrossRef]
- Johnson, James, and Tomasz Lenartowicz. 1998. Culture freedom and economic growth: Do cultural values explain economic growth? Journal of World Business 33: 332–56. [Google Scholar] [CrossRef]
- Jorion, Philippe, Charles Shi, and Sanjian Zhang. 2009. Tightening Credit Standards: The Role of Accounting Quality. Review of Accounting Study 14: 123–60. [Google Scholar] [CrossRef]
- Kanagaretnam, Kiridaran, Chee Yeow Lim, and Gerald Lobo. 2011. Effects of National Culture on Earnings Quality of Banks. Journal of International Business Studies 42: 853–74. [Google Scholar] [CrossRef]
- Kwok, Chuck C. Y., and Solomon Tadesse. 2006. National culture and financial systems. Journal of International Business Studies 37: 227–47. [Google Scholar] [CrossRef]
- Laeven, Luc, and Fabian Valencia. 2008. Systemic Banking Crises: A New Database. IMF Working Paper WP/08/224. Available online: https://www.imf.org/external/pubs/ft/wp/2008/wp08224.pdf (accessed on 2 November 2018).
- Lando, David, and Torben M. Skodeberg. 2002. Analyzing ratings transitions and rating drift with continuous observations. Journal of Banking and Finance 26: 423–44. [Google Scholar] [CrossRef]
- Leung, Kwok, Rabi S. Bhagat, Nancy R. Buchan, Miriam Erez, and Cristina B. Gibson. 2005. Culture and international business: Recent advances and their implications for future research. Journal of International Business Studies 36: 357–78. [Google Scholar] [CrossRef]
- Li, Zhichuan. 2016. Endogeneity in CEO power: A survey and experiment. Investment Analysts Journal 45: 149–62. [Google Scholar] [CrossRef]
- Li, Kai, Dale Griffin, Heng Yue, and Longkai Zhao. 2013. How does culture influence corporate risk-taking? Journal of Corporate Finance 23: 1–22. [Google Scholar] [CrossRef] [Green Version]
- Licht, Amir, Chanan Goldschmidt, and Shalom Schwartz. 2005. Culture, law and corporate governance. International Review of Law and Economics 25: 229–55. [Google Scholar] [CrossRef]
- Lobo, Gerald, Luc Paugam, Herve Stolowy, and Pierre Astolfi. 2017. The Effect of Business and Financial Market Cycles on Credit Ratings: Evidence from the Last Two Decades. ABACUS 53: 59–93. [Google Scholar] [CrossRef] [Green Version]
- Manasse, Paolo, Nouriel Roubini, and Axel Schimmelpfennig. 2003. Predicting Sovereign Debt Crisis. IMF Working Paper 03/221. Available online: https://www.imf.org/en/Publications/WP/Issues/2016/12/30/Predicting-Sovereign-Debt-Crises-16951 (accessed on 2 November 2018).
- Mann, Christopher, David Hamilton, Praveen Varma, and Richard Cantor. 2003. What Happens to Fallen Angels? A Statistical Review 1982–2003. Moody’s Investor Service Special Comment. Available online: https://www.moodys.com/sites/products/DefaultResearch/2002000000425343.pdf (accessed on 2 November 2018).
- Mora, Nada. 2006. Sovereign credit ratings: Guilty beyond reasonable doubt? Journal of Banking and Finance 30: 2041–62. [Google Scholar] [CrossRef]
- Nickell, Pamela, William Perraudin, and Simone Varotto. 2000. Stability of ratings transitions. Journal of Banking and Finance 24: 203–22. [Google Scholar] [CrossRef]
- North, Douglass. 1990. Institutions, Institutional Change and Economic Performance. Cambridge: Cambridge University Press, ISBN 9780521397346. [Google Scholar]
- Pan, Yihui, Stephen Siegel, and Tracy Yue Wang. 2017. Corporate Risk Culture. Journal of Financial and Quantitative Analysis 52: 2327–67. [Google Scholar] [CrossRef]
- Paredes, Angel A. P., and Clark Wheatley. 2017. The influence of culture on real earnings management. International Journal of Emerging Markets 12: 38–57. [Google Scholar] [CrossRef]
- PricewaterhouseCoopers. 2008. Reward: A New Paradigm? Available online: https://www.pwc.com/gx/en/banking-capital-markets/pdf/reward.pdf (accessed on 2 November 2018).
- Ramirez, Andrés, and Solomon Tadesse. 2009. Corporate Cash Holdings, Uncertainty Avoidance and the Multinationality of Firms. International Business Review 18: 387–403. [Google Scholar] [CrossRef]
- S&P Global Ratings’ Credit Research. 2013. Default Study: Sovereign Defaults and Rating Transition Data, 2012 Update. New York: Alacra Store. [Google Scholar]
- S&P RatingsDirect. 2009. Use of CreditWatch and Outlooks. September 14. Available online: http://www.maalot.co.il/publications/MT20131212112758c.pdf (accessed on 2 November 2018).
- S&P RatingsDirect. 2013. Corporate Methodology. November 19. Available online: https://www.spratings.com/scenario-builder-portlet/pdfs/CorporateMethodology.pdf (accessed on 2 November 2018).
- Schwartz, Shalom H. 1994. Beyond Individualism-Collectivism: New Dimensions of Values. In Individualism and Collectivism: Theory, Method and Application. Edited by Uichol Kim, Harry C. Triandis, Çiğdem Kâğitçibaşi, Sang-Chin Choi and Gene Yoon. Thousand Oaks: Sage, ISBN 978-0803957633. [Google Scholar]
- Shao, Liang, Chuck C. Y. Kwok, and Omrane Guedhami. 2010. National culture and dividend policy. Journal of International Business Studies 41: 1391–414. [Google Scholar] [CrossRef]
- Shao, Liang, Chuck C. Y. Kwo, and Ran Zhang. 2013. National culture and corporate investment. Journal of International Business Studies 44: 745–63. [Google Scholar] [CrossRef]
- Tang, Linghui, and Peter Koveos. 2008. A framework to update Hofstede’s cultural value indices: Economic dynamics and institutional stability. Journal of International Business Studies 39: 1045–63. [Google Scholar] [CrossRef]
- Titman, Sheridan. 1984. The effect of capital structure on a firm’s liquidation decision. Journal of Financial Economics 13: 137–52. [Google Scholar] [CrossRef]
- Tsakumis, George, Anthony Curatola, and Thomas Porcano. 2007. The relation between national cultural dimensions and tax evasion. Journal of International Accounting, Auditing and Taxation 16: 131–47. [Google Scholar] [CrossRef]
- Vazza, Diane, Devi Aurora, and Ryan Schneck. 2005a. Crossover Credit: A 24-Year Study of Fallen Angel Rating Behavior. New York: Standard & Poor’s Global Fixed Income Research. [Google Scholar]
- Vazza, Diane, Edward Leung, Marya Alsati, and Mike Katz. 2005b. Credit Watch and Ratings Outlooks: Valuable Predictors of Rating Behaviour. New York: Standard & Poor’s Global Fixed Income Research. [Google Scholar]
- Vitell, Scott, Saviour Nwachukwu, and James Barnes. 1993. The effects of culture on ethical decisions making: An application of Hofstede’s typology. Journal of Business Ethics 12: 753–60. [Google Scholar] [CrossRef]
- Weaver, Gary R. 2001. Ethics Programs in Global Businesses: Culture’s Role in Managing Ethics. Journal of Business Ethics 30: 3–15. [Google Scholar] [CrossRef]
- Wei, Lee-Jen, Danyu Lin, and Lisa Weissfeld. 1989. Regression analysis of multivariate incomplete failure time data by modelling marginal distributions. Journal of the American Statistical Association 84: 1065–73. [Google Scholar] [CrossRef]
- Zarzeski, Marilyn T. 1996. Spontaneous harmonization effects of culture and market forces on accounting disclosure practices. Accounting Horizons 10: 18–37. [Google Scholar]
- Zheng, Xiaolan, Sadok Ghoul, Omrane Guedhami, and Chuck C. Y. Kwok. 2012. National culture and corporate debt maturity. Journal of Banking and Finance 36: 468–88. [Google Scholar] [CrossRef]
| 1 | Pan et al. acknowledge that they do not account for social influences and shared experience inside a firm, thus not capturing a firm’s risk culture entirely. |
| 2 | Contributing to this view is the evidence that the cultural differences between Greece and Germany made Greece’s negotiations to avoid a default much more difficult (Guiso et al. 2016). |
| 3 | For example, long-term oriented countries have a higher national saving rate and a higher growth rate. Individualistic countries achieve a higher GNI per capita (Hofstede et al. 2010, pp. 38, 263–65). |
| 4 | For the evidence of downward momentum in rating migration dynamics, see Altman and Kao (1992); Carty and Fons (1994); Altman (1998); Bangia et al. (2002); Lando and Skodeberg (2002); Güttler and Wahrenburg (2007); Figlewski et al. (2012); Dang and Partington (2014) |
| 5 | S&P rating scales were changed in 1983. To calculate the annual changes of employed macro-economic variables in 1985, the values in 1984 and 1985 were needed. Thus, 1985 was chosen as the starting year of the study. |
| 6 | Tang and Koveos (2008) suggest that institutional factors, such as language, religion, climate and legal origin, are subsumed by Hofstede’s uncertainty avoidance and masculinity traits. The correlations between Hofstede’s culture scores and other measures “do not tend to become weaker over time” (Hofstede et al. 2010, p. 39). |
| 7 | Embeddedness is referred to as conservatism in some studies, such as Johnson and Lenartowicz (1998); Chui et al. (2002); Shao et al. (2010). |
| 8 | An example is the handling of the Åland Islands crisis and the Falkland Islands crisis. The Åland Islands crisis was resolved by negotiations in 1921 between feminine countries Finland and Sweden. The Åland Islands remained Finnish but the pro-Swedish islands gained substantial regional autonomy. The Falklands Islands crisis in 1982 involved Argentinean military and British expeditionary forces. The crisis between two masculine countries cost “725 Argentinean and 225 British lives and enormous financial expense.” The Falklands Islands have remained a disputed territory and required “constant British subsidies and military presence” (Hofstede et al. 2010, p. 173). |
| 9 | Contributing to this view is the remark of the President of the European Commission José Manuel Barroso at the European Parliament in May 2010 that ratings are “too cyclical, too reliant on the general market mood rather than on fundamentals...”. |
| 10 | Strong UA countries are intolerant of political ideologies, are “more likely to harbor extremist minorities within their political landscape” and have more “native terrorists” (Hofstede et al. 2010, p. 221). |
| 11 | See, for example, Altman and Kao (1992); Carty and Fons (1994); Altman (1998); Bangia et al. (2002); Lando and Skodeberg (2002); Vazza et al. (2005b); Güttler and Wahrenburg (2007); Figlewski et al. (2012); Dang and Partington (2014). |
| 12 | Most static variables are updated annually. Return of world stock market index is calculated using daily data over a 63-trading day rolling window prior to the beginning of each rating. Dummy OECD member, dummy debt crisis and dummy prior default are updated at the beginning of each rating. |
| 13 | Subtracting one from the hazard ratio (HR) gives the change in risk for a one-unit change in the independent variable. Dummy LTO’s HR of 0.748 represents a 25.2% reduction in downgrade risk for firms in a LTO country (model 1). Dummy LTO (model 1) has a stronger impact than LTO (models 2 and 3). A larger effect of dummy LTO is not unusual in hazard modelling, often because a switch from short-term to long-term orientation represents a substantial change. |
Figure 1.
Distribution of rating observations by duration (survival time). Panel A and Panel B of Figure 1 shows the distribution of migrated ratings by duration (survival time) for the entire sample A(H) and crisis sample C(H-1), respectively. Duration is the length of time a firm stays in a rating grade measured from the time it enters the rating grade subsequent to the beginning of the study until the time it either migrates to another rating grade or becomes censored. A typical firm contributes multiple ratings to the dataset. Sample A(H) and sample C(H-1) includes 17,109 ratings and 3927 ratings, respectively.


Table 1.
Definitions of variables used in the analysis.
| Variable | Definition | References |
|---|---|---|
| Hofstede’s culture dimensions Hofstede (1980) conducted surveys with IBM employees in over 50 countries and used the survey responses to identify four national culture dimensions that were virtually uncorrelated. In Hofstede et al. (2010), the scores on the four dimensions were listed for 76 countries. The fifth dimension, long-term versus short-term orientation, was introduced by Michael Bond in his Chinese Value Survey conducted in 23 countries in 1987, and extended to 93 countries in 2010 by Michael Minkov (Hofstede et al. 2010) | ||
| Power distance index | Power distance index expresses the degree to which members of a society accept and expect that power and authority is distributed unequally. | Licht et al. (2005); Hope et al. (2008); Hofstede et al. (2010); Fidrmuc and Jacob (2010); Kanagaretnam et al. (2011); Zheng et al. (2012); Paredes and Wheatley (2017) |
| Individualism vs. collectivism | Individualism encourages the pursuit of personal interests, autonomy and an active determination of one’s destiny. Collectivism stresses conformity and adherence to societal norms and regulations | Chui et al. (2002); Licht et al. (2005); Tsakumis et al. (2007); Fidrmuc and Jacob (2010); Han et al. (2010); Hofstede et al. (2010); Shao et al. (2010); Kanagaretnam et al. (2011); Zheng et al. (2012); Li et al. (2013); Shao et al. (2013) |
| Masculinity vs. femininity | Masculine countries strive for a performance society and value assertiveness, material accomplishment, ambition, competition and success. Feminine countries strive for a welfare society and value cooperation, modesty, caring for the weak and quality of life | Vitell et al. (1993); Chui et al. (2002); Licht et al. (2005); Hofstede et al. (2010); Anderson et al. (2011); Kanagaretnam et al. (2011); Zheng et al. (2012) |
| Uncertainty avoidance index | The uncertainty avoidance index expresses the degree to which the members of a society feel uncomfortable with uncertainty and ambiguity. | Licht et al. (2005); Kwok and Tadesse (2006); Ramirez and Tadesse (2009); Tsakumis et al. (2007); Hope et al. (2008); Fidrmuc and Jacob (2010); Han et al. (2010); Hofstede et al. (2010); Anderson et al. (2011); Kanagaretnam et al. (2011); Zheng et al. (2012); Li et al. (2013) |
| Long-term vs. short-term orientation | Long-term oriented cultures are oriented toward the future and value perseverance and thrift. Short-term oriented societies foster virtues related to the past and present. | Cohen et al. (1996); Hofstede et al. (2010); Anderson et al. (2011) |
| Schwartz’s culture dimensions Schwartz (1994) collected survey data from school teachers and university students in more than 60 countries. He classified national cultures into six dimensions. Two dimensions embeddedness and hierarchy are employed in this study | ||
| Embeddedness (conservatism) | Embedded cultures value social relationships, emphasize maintaining the status quo and restraining actions that may disrupt in-group solidarity and traditional order | Johnson and Lenartowicz (1998); Chui et al. (2002); Licht et al. (2005); Shao et al. (2010); Zheng et al. (2012) |
| Hierarchy | Hierarchical cultures view the unequal distribution of power, roles, and wealth as legitimate and even desirable. | Chui et al. (2002); Licht et al. (2005); Zheng et al. (2012) |
| S&P’s ratingdata: Source: Standard & Poor’s Ratings Xpress | ||
| Current rating grade | The current rating (start rating) for the rating transition being observed. | Carty and Fons (1994); Figlewski et al. (2012); Dang and Partington (2014) |
| Investment rating boundary | The dummy takes the value of one if the current rating is in the investment grade boundary (BBB−, BBB, BBB+) or zero otherwise | Carty and Fons (1994); Johnson (2004); Dang and Partington (2014) |
| Junk rating boundary | The dummy takes the value of one if the current rating is in the speculative (junk) grade boundary (BB−, BB, BB+) or zero otherwise | Carty and Fons (1994); Johnson (2004); Dang and Partington (2014) |
| Logarithm of age since first rated | Age since first rated is a time-varying variable measuring the duration since a firm was first rated. This variable is updated whenever a migration of interest occurs in the sample | Altman (1998); Figlewski et al. (2012); Dang and Partington (2014) |
| Dummy lag one downgrade | The dummy takes the value of one if the lag one rating ends with a downgrade, and zero otherwise | Carty and Fons (1994); Lando and Skodeberg (2002); Bangia et al. (2002); Figlewski et al. (2012); Dang and Partington (2014) |
| Lag one duration (years) | The duration of the rating immediately preceding the current rating | Carty and Fons (1994); Lando and Skodeberg (2002); Dang and Partington (2014) |
| Dummy prior fallen angel | This variable takes the value of one if a firm had experienced a downgrade from an investment-grade rating to a speculative-grade rating as of the start of the current rating, and zero otherwise | Mann et al. (2003); Vazza et al. (2005a); Güttler and Wahrenburg (2007); Dang and Partington (2014) |
| Dummy large downgrade | This variable takes the value of one if a firm had experienced a big downgrade of at least three rating notches as of the start of the current rating, and zero otherwise | Carty and Fons (1994); Dang and Partington (2014) |
| Dummy large upgrade | This variable takes the value of one if a firm had experienced a big upgrade of at least three rating notches as of the beginning of the current rating, and zero otherwise | Dang and Partington (2014) |
| Rating volatility | This is the average number of migrations per year over a firm’s rating history. It is calculated as the number of migrations a firm had experienced as of the beginning of the current rating divided by age since first rated. | Dang and Partington (2014) |
| S&P’s outlook Source: Standard & Poor’s Ratings Xpress S&P issues an outlook to indicate its opinion regarding the potential direction of a long-term credit rating over the intermediate term (six months–two years) (S&P RatingsDirect 2009). Outlooks can be positive (rating may be raised), negative (rating may be lowered), stable (rating unlikely to change), or developing (rating may be raised/ lowered) | ||
| Dummy negative outlook | This time-varying variable takes the value of one if a firm was assigned a negative outlook by S&P, and zero otherwise. | Vazza et al. (2005a); Hill et al. (2010) |
| Dummy positive outlook | This time-varying variable takes the value of one if a firm was assigned a positive outlook by S&P, and zero otherwise. | Vazza et al. (2005a); Hill et al. (2010) |
| Macro-economic and financial conditions Source: World Bank databases unless otherwise stated | ||
| Dummy prior default | This dummy takes the value of one if a country where a firm resides had a foreign currency-denominated debt default prior to the start of the rating under study, and zero otherwise. Source: S&P Global Ratings’ Credit Research (2013) | Mora (2006); Hill et al. (2010) |
| Dummy debt crisis | This variable takes a value of one if a rating commences during a period of sovereign debt/ banking crisis as listed in Manasse et al. (2003), Laeven and Valencia (2008), or De Paoli et al. (2009), and zero otherwise. | Ferri et al. (1999); Mora (2006) |
| Dummy OECD member | This variable takes a value of one if the country where a firm resides is a member of the OECD at the start of the current rating, and zero otherwise. | Ferri et al. (1999); Mora (2006) |
| Logarithm of GDP per capita | The logarithm of real GDP per capita | Ramirez and Tadesse (2009); Zheng et al. (2012); Figlewski et al. (2012); Shao et al. (2013); Li et al. (2013); Dang and Partington (2014) |
| Change in real GDP growth rate | The change in the real GDP growth rate over the year prior to the start of the rating. | Ferri et al. (1999); Mora (2006); Hill et al. (2010); Shao et al. (2013) |
| Change in inflation | The change in the inflation rate over the year prior to the start of the rating. | Ramirez and Tadesse (2009); Zheng et al. (2012) |
| Change in current account surplus/GDP | The change in the current account surplus or deficit divided by GDP | Ferri et al. (1999); Mora (2006); Hill et al. (2010) |
| Change in term trade | The change in terms of trade. The terms of trade effect equals capacity to imports less exports of goods and services in constant prices. Data are in constant local currency. | |
| Logarithm of ratio stock market capitalization/GDP | The logarithm of the ratio of stock market capitalization to GDP | Zheng et al. (2012); Li et al. (2013); Shao et al. (2013) |
| Return of world stock market index | The average return of the World-Datastream stock market index, which is calculated using daily data over a 63-trading day rolling window prior to the start of the rating under study. Source: Datastream | Hill et al. (2010) |
| Political rights and civil liberties Source: International Country Risk Guide database. The political risk rating comprises the scores of 12 metrics including government stability, bureaucracy quality, corruption, democratic accountability, external conflict, ethnic tensions, internal conflict, investment profile, law and order, military in politics, religion in politics, and socioeconomics conditions. | ||
| Dummy high political risk | This dummy takes a value of one if a country’s political rating score is less than or equal to 40, and zero otherwise 40 | |
| Dummy low political risk | This dummy takes a value of one if a country’s political rating score is higher than or equal to 80, and zero otherwise. | |
Table 1 defines the variables used in Cox’s hazard models. The table provides the data sources, variable names, the definitions of the variables, and references to examples of the literature that have used the variables.
Table 2.
Statistics of rating grades and survival time.
| Panel A: Statistics of S&P’s Numerical Rating Grades | |||
| Sample A(H): All Firms | Sample B(H): Non-US Firms | Sample C(H-1): Crisis Sample | |
| Sample size | 17,109 | 4745 | 3927 |
| Mean | 10.29 | 11.08 | 8.79 |
| Median | 10 (BB) | 11 (BB+) | 8 (B+) |
| Std dev | 4.18 | 4.22 | 3.9 |
| Min | 1 (C) | 1 (C) | 2 (CC) |
| Max | 21 (AAA) | 21 (AAA) | 20 (AA+) |
| Panel B: Statistics of Survival Time for Downgrades | |||
| Sample A(H): All Firms | Sample B(H): Non-US Firms | Sample C(H-1): Crisis Sample | |
| Number of downgrades | 10,411 | 2661 | 1825 |
| Frequency of downgrades | 60.85% | 56.08% | 46.5% |
| Mean (years) | 1.82 | 1.55 | 0.66 |
| Median (years) | 1 | 0.92 | 0.38 |
| Std dev | 2.25 | 1.78 | 0.76 |
| Min (years) | ~ 0 | 0.01 | 0.01 |
| Max (years) | 23.43 | 14.28 | 7.41 |
| Panel C: Statistics of Survival Time for Upgrades | |||
| Sample A(H): All Firms | Sample B(H): Non-US Firms | Sample C(H-1): Crisis Sample | |
| Number of upgrades | 4018 | 1096 | 521 |
| Frequency of upgrades | 23.48% | 23.1% | 13.3% |
| Mean (years) | 2.25 | 1.99 | 1.34 |
| Median (years) | 1.74 | 1.55 | 1.01 |
| Std dev | 1.96 | 1.63 | 1.32 |
| Min (years) | 0.02 | 0.02 | 0.04 |
| Max (years) | 19.72 | 10.3 | 10.3 |
Panel A of Table 2 shows the statistics of rating grades, Panel B and Panel C present the statistics of survival time for downgrades and upgrades, respectively, in the whole sample A(H), non-U.S. sample B(H), and crisis sample C(H-1). For brevity reasons, this table presents the statistics for ratings in the three samples with Hofstede’s culture values.
Table 3.
Descriptive statistics of national culture scores.
| Panel A: Descriptive Statistics of Culture Values for Samples A(H) and A(H-S) of All Firms | |||||
| Mean | Median | Std Dev | Min | Max | |
| Hofstede (H) culture values (N = 17,109) | |||||
| Power distance index (PDI) | 42.7 | 40 | 10.43 | 11 | 104 |
| Individualism vs. collectivism (IDV) | 83.26 | 91 | 17.64 | 12 | 91 |
| Masculinity vs. femininity (MAS) | 60.15 | 62 | 10.4 | 5 | 110 |
| Uncertainty avoidance index (UAI) | 50.28 | 46 | 13.46 | 8 | 112 |
| Long-term vs. short-term orientation (LTO) | 32.91 | 26 | 15.99 | 13 | 100 |
| Schwartz (S) culture values (N = 16,966) | |||||
| Embeddedness | 3.62 | 3.67 | 0.16 | 3.03 | 4.35 |
| Hierarchy | 2.34 | 2.37 | 0.17 | 1.49 | 3.23 |
| Panel B: Descriptive Statistics of Culture Values for Sample B(H) and B(H-S) of Non-U.S. Firms | |||||
| Mean | Median | Std Dev | Min | Max | |
| Hofstede (H) culture values (N = 4745) | |||||
| Power distance index (PDI) | 49.75 | 39 | 17.98 | 11 | 104 |
| Individualism vs. collectivism (IDV) | 63.08 | 71 | 23.63 | 12 | 90 |
| Masculinity vs. femininity (MAS) | 55.32 | 56 | 18.91 | 5 | 110 |
| Uncertainty avoidance index (UAI) | 61.44 | 53 | 21.94 | 8 | 112 |
| Long-term vs. short-term orientation (LTO) | 50.93 | 51 | 21.74 | 13 | 100 |
| Schwartz (S) culture values (N = 4602) | |||||
| Embeddedness | 3.49 | 3.46 | 0.27 | 3.03 | 4.35 |
| Hierarchy | 2.25 | 2.22 | 0.32 | 1.49 | 3.23 |
Table 4.
Cox’s regression models for rating changes of all firms.
| Culture Dummy Mean (Hofstede, N = 17,109) | Numeric Culture Score (Hofstede, N = 17,109) | Numeric Score (Hofstede & Schwartz, N = 16,966) | ||||||||||
|---|---|---|---|---|---|---|---|---|---|---|---|---|
| Downgrade (1) | Upgrade (1) | Downgrade (2) | Upgrade (2) | Downgrade (3) | Upgrade (3) | |||||||
| Variables | Coefficient | HR | Coefficient | HR | Coefficient | HR | Coefficient | HR | Coefficient | HR | Coefficient | HR |
| Hofstede’s national culture dimensions | ||||||||||||
| Power distance index (PDI) | NA | NA | −0.01 *** | 0.99 | NA | NA | ||||||
| Individualism vs. collectivism (IDV) | NA | NA | NA | NA | ||||||||
| Masculinity vs. femininity (MAS) | NA | NA | 0.004 ** | 1.004 | 0.006 *** | 1.006 | ||||||
| Uncertainty avoidance index (UAI) | NA | NA | 0.009 *** | 1.009 | 0.004 *** | 1.004 | ||||||
| Long-term vs. short-term orientation (LTO) | NA | NA | −0.009 *** | 0.991 | -0.011 *** | 0.989 | ||||||
| Dummy large power distance index | NA | NA | NA | NA | ||||||||
| Dummy individualism | NA | NA | NA | NA | ||||||||
| Dummy masculine | 0.17907 *** | 1.196 | NA | NA | NA | NA | ||||||
| Dummy strong uncertainty avoidance | NA | NA | NA | NA | ||||||||
| Dummy long-term orientation | −0.29086 *** | 0.748 | NA | NA | NA | NA | ||||||
| Schwartz’s national culture dimensions | ||||||||||||
| Embeddedness | NA | NA | NA | NA | −0.274 ** | 0.76 | ||||||
| Hierarchy | NA | NA | NA | NA | −0.353 *** | 0.702 | 0.552 *** | 1.737 | ||||
| S&P’s rating data | ||||||||||||
| Current rating grade | −0.01021 *** | 0.99 | −0.10447 *** | 0.901 | −0.009 ** | 0.991 | −0.106 *** | 0.9 | −0.01 ** | 0.99 | −0.108 *** | 0.898 |
| Investment rating boundary (BBB−/BBB/BBB+) | −0.23186 *** | 0.793 | 0.16734 *** | 1.182 | −0.241 *** | 0.786 | 0.167 *** | 1.182 | −0.24 *** | 0.786 | 0.164 *** | 1.179 |
| Junk rating boundary (BB−/BB/BB+) | 0.14226 *** | 1.153 | 0.143 *** | 1.154 | 0.141 *** | 1.152 | ||||||
| Dummy negative outlook (time-varying) | 0.29138 *** | 1.338 | −1.7834 *** | 0.168 | 0.285 *** | 1.33 | −1.783 *** | 0.168 | 0.282 *** | 1.326 | −1.776 *** | 0.169 |
| Dummy positive outlook (time-varying) | −1.73029 *** | 0.177 | 1.206 *** | 3.34 | −1.721 *** | 0.179 | 1.209 *** | 3.35 | −1.713 *** | 0.18 | 1.207 *** | 3.345 |
| Logarithm of age since first rated (time-varying) | −1.57095 *** | 0.208 | −1.45531 *** | 0.233 | −1.556 *** | 0.211 | −1.439 *** | 0.237 | −1.552 *** | 0.212 | −1.434 *** | 0.238 |
| Dummy lag one downgrade | 0.66822 *** | 1.951 | 0.659 *** | 1.933 | 0.665 *** | 1.945 | ||||||
| Lag one rating duration | 0.06974 *** | 1.072 | 0.03321 *** | 1.034 | 0.07 *** | 1.072 | 0.033 *** | 1.034 | 0.07 *** | 1.072 | 0.033 *** | 1.033 |
| Dummy prior fallen angel event(s) | −0.13936 *** | 0.87 | −0.137 *** | 0.872 | −0.119 *** | 0.888 | ||||||
| Dummy large downgrade | 0.15244 *** | 1.165 | 0.28276 *** | 1.327 | 0.171 *** | 1.187 | 0.285 *** | 1.33 | 0.163 *** | 1.177 | 0.281 *** | 1.325 |
| Dummy large upgrade | 0.088 * | 1.092 | ||||||||||
| Rating volatility | −0.05591 | 0.946 | −0.13391 *** | 0.875 | −0.053 | 0.948 | −0.134 *** | 0.874 | −0.051 | 0.951 | −0.135 *** | 0.874 |
| Macro-economic and financial conditions | ||||||||||||
| Dummy prior default | −0.47471 *** | 0.622 | −0.536 *** | 0.585 | −0.442 *** | 0.643 | −0.24 * | 0.787 | ||||
| Dummy debt crisis | −0.1048 * | 0.901 | −0.112 ** | 0.894 | ||||||||
| Dummy OECD member | 0.23915 *** | 1.27 | −0.249 *** | 0.78 | 0.306 *** | 1.358 | −0.269 *** | 0.764 | 0.212 * | 1.236 | ||
| Logarithm of GDP per capita | 0.164 ** | 1.178 | ||||||||||
| Change in real GDP growth rate | −0.02713 *** | 0.973 | −0.028 *** | 0.972 | −0.028 *** | 0.973 | ||||||
| Change in inflation | −0.02144 *** | 0.979 | −0.022 *** | 0.979 | −0.022 *** | 0.978 | ||||||
| Change in current account surplus/GDP | −0.04317 *** | 0.958 | 0.07859 *** | 1.082 | −0.04 *** | 0.961 | 0.079 *** | 1.082 | −0.044 *** | 0.957 | 0.069 *** | 1.071 |
| Change in term trade | ||||||||||||
| Logarithm of ratio stock market cap/GDP | −0.09241 *** | 0.912 | 0.06 *** | 1.062 | −0.078 *** | 0.925 | 0.08 *** | 1.083 | −0.161 *** | 0.852 | ||
| Return of world stock market index | −0.58725 *** | 0.556 | −0.24199 ** | 0.785 | −0.525 *** | 0.592 | −0.228 * | 0.796 | −0.532 *** | 0.588 | −0.251 ** | 0.778 |
| Political risks | ||||||||||||
| Dummy low political risk | 0.09715 *** | 1.102 | −0.08271 ** | 0.921 | 0.067 ** | 1.069 | −0.094** | 0.911 | 0.072 *** | 1.074 | −0.066 * | 0.936 |
| Dummy high Political risk | ||||||||||||
| Events/ sample size | 60.85% | 23.48% | 60.85% | 23.48% | 60.97% | 23.44% | ||||||
| Likelihood ratio χ2 | 8319.85 *** | 5022.41 *** | 8379.83 *** | 5017.3 *** | 8350.8 *** | 4977.2 *** | ||||||
Table 4 presents the results of Cox’s hazard models for upgrades and downgrades in the entire samples. Downgrades (upgrades) were treated as events (censored) in the downgrade model and vice versa. The scores for Hofstede’s culture values are coded as dummy variables (model 1) and numeric variables (model 2 and model 3). The scores for Schwartz’s culture values are coded as numeric variables (model 3). In model (1), scores greater than or equal to the mean take a value of one or zero otherwise. Significant variables were retained in the model using the stepwise selection procedure. A variable has to be significant at the 0.25 level before it can be entered into the model, and a variable has to be significant at the 0.1 level for it to remain in the model. Parameter estimates are given first followed by the corresponding p-values based on Wald chi-square test, with ***, **, * representing significance at the 0.01, 0.05 and 0.10 levels, respectively, using the Wald test. Subtracting 1 from the hazard ratio (HR) gives the percentage change in the hazard for a one-unit change in the independent variable. The likelihood ratio is based on a comparison of the model with variables added versus a model without variables, and tests the null hypothesis that all variables included in the model have coefficients of 0.
Table 5.
Cox’s regression models for rating changes of non-U.S. firms.
| Culture Dummy Mean (Hofstede, N = 4745) | Numeric Culture Score (Hofstede, N = 4745) | Numeric Score (Hofstede & Schwartz, N = 4602) | ||||||||||
|---|---|---|---|---|---|---|---|---|---|---|---|---|
| Downgrade (1) | Upgrade (1) | Downgrade (2) | Upgrade (2) | Downgrade (3) | Upgrade (3) | |||||||
| Variables | Coefficient | HR | Coefficient | HR | Coefficient | HR | Coefficient | HR | Coefficient | HR | Coefficient | HR |
| Hofstede’s national culture dimensions | ||||||||||||
| Power distance index (PDI) | NA | NA | −0.008 *** | 0.993 | NA | NA | ||||||
| Individualism vs. collectivism (IDV) | NA | NA | NA | NA | ||||||||
| Masculinity vs. femininity (MAS) | NA | NA | 0.003 * | 1.003 | 0.004 *** | 1.004 | 0.003 * | 1.003 | ||||
| Uncertainty avoidance index (UAI) | NA | NA | 0.004 *** | 1.004 | ||||||||
| Long-term vs. short-term orientation (LTO) | NA | NA | −0.007 *** | 0.993 | −0.008 *** | 0.992 | ||||||
| Dummy large power distance index | −0.37814 *** | 0.685 | NA | NA | NA | NA | ||||||
| Dummy individualism | NA | NA | NA | NA | ||||||||
| Dummy masculine | NA | NA | NA | NA | ||||||||
| Dummy strong uncertainty avoidance | 0.17973 *** | 1.197 | NA | NA | NA | NA | ||||||
| Dummy long-term orientation | −0.1631 *** | 0.85 | NA | NA | NA | NA | ||||||
| Schwartz’s national culture dimensions | ||||||||||||
| Embeddedness | NA | NA | NA | NA | −0.448 *** | 0.639 | ||||||
| Hierarchy | NA | NA | NA | NA | −0.337 *** | 0.714 | ||||||
| S&P’s rating data | ||||||||||||
| Current rating grade | −0.10145 *** | 0.904 | −0.10145 *** | 0.904 | −0.103 *** | 0.902 | −0.102 *** | 0.904 | ||||
| Investment rating boundary (BBB−/BBB/BBB+) | 0.25624 *** | 1.292 | 0.25624 *** | 1.292 | −0.292 *** | 0.747 | 0.25 *** | 1.284 | −0.263 *** | 0.769 | 0.219 *** | 1.244 |
| Junk rating boundary (BB−/BB/BB+) | 0.17256 ** | 1.188 | 0.17256 ** | 1.188 | 0.17 ** | 1.185 | 0.16 ** | 1.173 | ||||
| Dummy negative outlook (time-varying) | −1.61499 *** | 0.199 | −1.61499 *** | 0.199 | 0.354 *** | 1.425 | −1.618 *** | 0.198 | 0.341 *** | 1.406 | −1.576 *** | 0.207 |
| Dummy positive outlook (time-varying) | 1.27989 *** | 3.596 | 1.27989 *** | 3.596 | −1.787 *** | 0.167 | 1.282 *** | 3.605 | −1.767 *** | 0.171 | 1.306 *** | 3.691 |
| Logarithm of age since first rated (time-varying) | −2.77147 *** | 0.063 | −2.77147 *** | 0.063 | −2.299 *** | 0.1 | −2.765 *** | 0.063 | −2.335 *** | 0.097 | −2.742 *** | 0.064 |
| Dummy lag one downgrade | −0.13508 ** | 0.874 | −0.13508 ** | 0.874 | 0.598 *** | 1.818 | −0.133 ** | 0.876 | 0.575 *** | 1.777 | −0.13 ** | 0.878 |
| Lag one rating duration | 0.15485 *** | 1.167 | 0.167 *** | 1.181 | 0.156 *** | 1.169 | 0.184 *** | 1.202 | 0.16 *** | 1.173 | ||
| Dummy prior fallen angel event(s) | 0.22181 ** | 1.248 | 0.227 ** | 1.255 | 0.174 ** | 1.19 | 0.225 ** | 1.253 | ||||
| Dummy large downgrade | ||||||||||||
| Dummy large upgrade | −0.24784 ** | 0.78 | −0.232 * | 0.793 | −0.189 | 0.828 | ||||||
| Rating volatility | −0.07356 | 0.929 | −0.21696 ** | 0.805 | −0.075 | 0.928 | −0.215 ** | 0.807 | −0.067 | 0.936 | −0.204 ** | 0.816 |
| Macro-economic and financial conditions | ||||||||||||
| Dummy prior default | −0.45461 *** | 0.635 | −0.4 *** | 0.671 | −0.391 *** | 0.676 | ||||||
| Dummy debt crisis | 0.16082 ** | 1.174 | 0.172 *** | 1.188 | 0.171 ** | 1.186 | ||||||
| Dummy OECD member | −0.191 ** | 0.826 | ||||||||||
| Logarithm of GDP per capita | ||||||||||||
| Change in real GDP growth rate | −0.02736 *** | 0.973 | −0.03 *** | 0.971 | −0.031 *** | 0.97 | ||||||
| Change in inflation | −0.016 *** | 0.984 | −0.01629 *** | 0.984 | −0.017 *** | 0.983 | −0.016 *** | 0.984 | −0.017 *** | 0.984 | −0.017 *** | 0.983 |
| Change in current account surplus/GDP | 0.03483 *** | 1.035 | 0.035 *** | 1.036 | 0.037 *** | 1.038 | ||||||
| Change in term trade | ||||||||||||
| Logarithm of ratio stock market cap/GDP | ||||||||||||
| Return of world stock market index | −0.60958 *** | 0.544 | −0.609 *** | 0.544 | −0.683 *** | 0.505 | ||||||
| Political risks | ||||||||||||
| Dummy low political risk | ||||||||||||
| Dummy high Political risk | ||||||||||||
| Events/ sample size | 56.08% | 23.1% | 56.08% | 23.1% | 56.37% | 22.92% | ||||||
| Likelihood ratio χ2 | 2858.04 *** | 1681.21 *** | 2874 *** | 1684.7 *** | 2860 *** | 1630.5 *** | ||||||
Table 5 presents the results of Cox’s hazard models for rating upgrades and downgrades in the samples of non-U.S. firms. Downgrades (upgrades) were treated as events (censored) in the downgrade model and vice versa. The scores for Hofstede’s culture values are coded as dummy variables (model 1) and numeric variables (model 2 and model 3). The scores for Schwartz’s culture values are coded as numeric variables (model 3). In model (1), scores greater than or equal to the mean take a value of one and zero otherwise. Significant variables were retained in the model using the stepwise selection procedure. A variable has to be significant at the 0.25 level before it can be entered into the model, and a variable in the model has to be significant at the 0.1 level for it to remain in the model. Parameter estimates are given first followed by the corresponding p-values based on Wald chi-square test, with ***, **, * representing significance at the 0.01, 0.05 and 0.10 levels, respectively, using the Wald test. Subtracting 1 from the hazard ratio (HR) gives the percentage change in the hazard for a one-unit change in the independent variable. The likelihood ratio is based on a comparison of the model with variables added versus a model without variables, and tests the null hypothesis that all variables included in the model have coefficients of 0.
Table 6.
Cox’s regression model for corporate rating changes: crisis vs. non-crisis periods.
| Crisis Sample (Hofstede, N = 3927) | Non-Crisis Sample (Hofstede, N = 13,182) | Non-Crisis Non-U.S. Sample (Hofstede, N = 3714) | ||||||||||
|---|---|---|---|---|---|---|---|---|---|---|---|---|
| Downgrade | Upgrade | Downgrade | Upgrade | Downgrade | Upgrade | |||||||
| Variables | Coefficient | HR | Coefficient | HR | Coefficient | HR | Coefficient | HR | Coefficient | HR | Coefficient | HR |
| Hofstede’s national culture dimensions | ||||||||||||
| Power distance index (PDI) | −0.019 *** | 0.981 | 0.00405 ** | 1.004 | ||||||||
| Individualism vs. collectivism (IDV) | ||||||||||||
| Masculinity vs. femininity (MAS) | 0.00442 *** | 1.004 | 0.00326 * | 1.003 | ||||||||
| Uncertainty avoidance index (UAI) | 0.009 *** | 1.009 | ||||||||||
| Long-term vs. short-term orientation (LTO) | −0.005 *** | 0.995 | 0.015 *** | 1.015 | −0.0068 *** | 0.993 | −0.00473 *** | 0.995 | ||||
| S&P’s rating data | ||||||||||||
| Current rating grade | −0.055 *** | 0.947 | −0.281 *** | 0.755 | −0.09783 *** | 0.907 | −0.105 *** | 0.9 | ||||
| Investment rating boundary (BBB−/BBB/BBB+) | −0.417 *** | 0.659 | 0.445 * | 1.56 | −0.21511 *** | 0.806 | 0.18773 *** | 1.207 | −0.22824 *** | 0.796 | 0.29756 *** | 1.347 |
| Junk rating boundary (BB−/BB/BB+) | 0.472 *** | 1.603 | 0.15556 *** | 1.168 | 0.17947 ** | 1.197 | ||||||
| Dummy negative outlook (time-varying) | 0.406 *** | 1.501 | −1.512 *** | 0.22 | 0.2374 *** | 1.268 | −1.93868 *** | 0.144 | 0.26543 *** | 1.304 | −1.97581 *** | 0.139 |
| Dummy positive outlook (time-varying) | −1.668 *** | 0.189 | 1.327 *** | 3.769 | −1.72525 *** | 0.178 | 1.17788 *** | 3.247 | −1.91491 *** | 0.147 | 1.20023 *** | 3.321 |
| Logarithm of age since first rated (time-varying) | −1.048 *** | 0.351 | −0.69 *** | 0.502 | −1.73288 *** | 0.177 | −1.47874 *** | 0.228 | −3.19282 *** | 0.041 | −2.99776 *** | 0.05 |
| Dummy lag one downgrade | 0.877 *** | 2.403 | 0.61724 *** | 1.854 | 0.58564 *** | 1.796 | ||||||
| Lag one rating duration | 0.066 *** | 1.068 | 0.07298 *** | 1.076 | 0.03799 *** | 1.039 | 0.18513 *** | 1.203 | 0.17943 *** | 1.197 | ||
| Dummy prior fallen angel event(s) | −0.19549 *** | 0.822 | 0.30926 *** | 1.362 | ||||||||
| Dummy large downgrade | 0.194 *** | 1.214 | 0.17731 *** | 1.194 | 0.32772 *** | 1.388 | 0.17525 | 1.192 | ||||
| Dummy large upgrade | 0.14199 *** | 1.153 | −0.26509 ** | 0.767 | ||||||||
| Rating volatility | −0.107 | 0.899 | −0.10982 ** | 0.896 | −0.46349 *** | 0.629 | −0.19194 ** | 0.825 | ||||
| Macro-economic and financial conditions | ||||||||||||
| Dummy prior default | −0.654 *** | 0.52 | ||||||||||
| Dummy OECD member | −1.008 *** | 0.365 | 0.28907 *** | 1.335 | 0.2497 *** | 1.284 | 0.42189 *** | 1.525 | ||||
| Logarithm of GDP per capita | 0.564 *** | 1.758 | ||||||||||
| Change in real GDP growth rate | −0.055 *** | 0.946 | ||||||||||
| Change in inflation | −0.019 *** | 0.981 | −0.027 *** | 0.973 | ||||||||
| Change in current account surplus/GDP | −0.063 *** | 0.939 | 0.142 *** | 1.152 | 0.04871 *** | 1.05 | ||||||
| Change in term trade | 0.000002 *** | 1 | 0.000037 *** | 1 | 0.00003 *** | 1 | ||||||
| Logarithm of ratio stock market cap/GDP | 0.11571 *** | 1.123 | −0.10045 *** | 0.904 | ||||||||
| Return of world stock market index | −0.367 *** | 0.693 | −0.61 *** | 0.544 | −0.45234 *** | 0.636 | −0.47447 *** | 0.622 | ||||
| Political risks | ||||||||||||
| Dummy low political risk | −0.198 *** | 0.82 | 0.11886 *** | 1.126 | -0.10071 ** | 0.904 | ||||||
| Dummy high Political risk | ||||||||||||
| Events/ sample size | 46.47% | 13.3% | 65.13% | 26.53% | 56.22% | 26.17% | ||||||
| Likelihood ratio χ2 | 1825.3 *** | 697 *** | 6808.65 *** | 4414.7 *** | 2367.02 *** | 1568.68 *** | ||||||
Table 6 presents the results of Cox’s hazard models for corporate ratings pooled across countries during the time they were (were not) experiencing a debt crisis or a banking crisis as defined in Manasse et al. (2003), Laeven and Valencia (2008), and De Paoli et al. (2009). For brevity reasons, only the results of the models with Hofstede’s numeric scores are reported. Downgrades (upgrades) were treated as events (censored) in the downgrade model and vice versa. Significant variables were retained in the model using the stepwise selection procedure. A variable has to be significant at the 0.25 level before it can be entered into the model, and a variable has to be significant at the 0.1 level for it to remain in the model. Parameter estimates are given first followed by the corresponding p-values based on Wald chi-square test, with ***, **, * representing significance at the 0.01, 0.05 and 0.10 levels, respectively, using the Wald test. Subtracting 1 from the hazard ratio (HR) gives the percentage change in the hazard for a one-unit change in the independent variable. The likelihood ratio is based on a comparison of the model with variables added versus a model without variables, and tests the null hypothesis that all variables included in the model have coefficients of 0.
© 2018 by the author. Licensee MDPI, Basel, Switzerland. This article is an open access article distributed under the terms and conditions of the Creative Commons Attribution (CC BY) license (http://creativecommons.org/licenses/by/4.0/).
Share and Cite
MDPI and ACS Style
Dang, H.D. National Culture and Corporate Rating Migrations. Risks 2018, 6, 130. https://0-doi-org.brum.beds.ac.uk/10.3390/risks6040130
AMA Style
Dang HD. National Culture and Corporate Rating Migrations. Risks. 2018; 6(4):130. https://0-doi-org.brum.beds.ac.uk/10.3390/risks6040130
Chicago/Turabian StyleDang, Huong Dieu. 2018. "National Culture and Corporate Rating Migrations" Risks 6, no. 4: 130. https://0-doi-org.brum.beds.ac.uk/10.3390/risks6040130
Note that from the first issue of 2016, this journal uses article numbers instead of page numbers. See further details here.