A Tale of Two Layers: The Mutual Relationship between Bitcoin and Lightning Network


1
Department of Management, Economics and Industrial Engineering, Politecnico di Milano, 20121 Milan, Italy
2
Data Science and Artificial Intelligence, Intesa Sanpaolo, 20121 Milan, Italy
*
Author to whom correspondence should be addressed.
†
The views expressed in this paper are those of the author and should not be attributed to Intesa Sanpaolo or to the author as representative or employee of Intesa Sanpaolo.
Risks 2020, 8(4), 129; https://0-doi-org.brum.beds.ac.uk/10.3390/risks8040129
Submission received: 27 October 2020
/
Revised: 23 November 2020
/
Accepted: 26 November 2020
/
Published: 1 December 2020
(This article belongs to the Special Issue Computational Methods in Quantitative Risk Management)
Abstract
:A major concern of the adoption and scalability of Blockchain technologies refers to their efficient use for payments. In this work, we analyze how Lightning Network (LN), which represents a relevant infrastructural novelty, is influenced by the market dynamics of its referring cryptocurrency, namely Bitcoin. In so doing, we focus on how the LN is efficient in performing transactions and we relate this feature to the market conditions of Bitcoin. By applying the Toda–Yamamoto variant of Granger-causality, we note that market conditions of Bitcoin do not significantly influence the topological configuration of the LN. Hence, although the LN represents a second layer on the Bitcoin blockchain, our findings suggest that its efficient functioning does not appear to be related to the simple market performance of its underlying cryptocurrency and, in particular, of its volatile market fluctuations. This result may therefore contribute to shed light on the practical usage of the LN as a blockchain technology to favor transactions.
1. Introduction
The growing attention on cryptocurrencies and blockchain solutions is generating a new literature recognizing the increasing relevance assumed by these technologies in shaping several economic domains. Undoubtedly, the research agenda has been heavily affected by the impact of cryptocurrencies’ market behaviours and their extremely volatile dynamics. More generally, the use of cryptocurrencies as either means of payment or investment assets has influenced a rich stream of research about the economic fundamentals of these technologies (see, e.g., Baur et al. (2015, 2018) Böhme et al. 2015; Gomber et al. 2017; Selgin 2015; Yermack 2015). Nevertheless, the adoption of these technologies in many contexts still appears in its infancy, thus motivating the current debate and research on how to scale them and, possibly, foster their wider adoption by the business environment in general (Bech and Garratt 2017; Kumhof and Noone 2018; Polasik et al. 2015).
Against this background, the literature has tried to recognize and analyze the key aspects which may limit the diffusion and adoption of cryptocurrencies and blockchain technologies. For instance, since cryptocurrencies are usually not supported by any centralized institution and are generally not related to tangible assets, governance issues may prevent them from being attractive and functioning tools for financial applications (Dwyer 2015; Flori 2019a; Weber 2016; Yermack 2017). In addition, ethical issues may represent a major concern for their adoption and diffusion in business contexts (Angel and McCabe 2015; Dierksmeier and Seele 2018), and in order to respond to critical issues such as money laundering activities, tax evasion and insider trading, an adequate regulatory framework is no longer considered deferable (Blundell-Wignall 2014; Brito et al. 2014; Pieters and Vivanco 2017). Finally, technical aspects may play a significant role in the diffusion of these technologies. For instance, Bitcoin cannot perform consistent amounts of transactions per unit of time since on average every ten minutes only a single block can be mined and added to the blockchain, meaning a maximum of seven transactions per second. As a comparison, well known payment systems such as Visa can process several thousands transactions per second (Croman et al. 2016).
The identification of cryptocurrencies as investment products, commodities, or currencies is still under discussion (see, e.g., Baek and Elbeck 2015; Baur et al. 2018; Carrick 2016; Flori 2019a; Hong 2017; Yermack 2015). However, the technological constraints occurring during transactions and the inherent liquidity limitations suggest that, at least for transaction aspects, cryptocurrencies may resemble commodities, with values reflecting their intrinsic scarcity and mining costs (see, e.g., Dwyer 2015; Selgin 2015). Within such a framework, miners are those actors that can add new blocks containing transaction records to the blockchain, thus playing a pivotal role for the functioning of the underlying system.
From an economic point of view, the interplay between miners and the other actors operating in the system can be gauged for instance by the dynamics of the fees, whose value deeply depends on the amount of transactions waiting to be added into the blockchain but weakly refers to the volume transferred per unit of time (Khan et al. 2019). As an example, during the Bitcoin boom phase at the end of 2017, when demand was very high, fees reached an astonishing level of about USD 40 from less than USD 1 per transaction registered at the beginning of the same year (Lee 2018). Hence, for large transferred amounts, transactions executed through a blockchain technology can represent a more convenient solution than traditional payment systems, while blockchain infrastructures could appear economically inefficient for micro-payments.
For these reasons, many different solutions have been proposed to increase throughput and lower latencies during transactions, such as the deployment in August 2017 of Bitcoin Cash to increase the size of the blocks to 8Mb, or the Segregated Witness implemented after the hardfork of November 2017 to quadruplicate the amount of transactions that can be placed into a single block (SegWit, Bitcoin Improvement Proposal 141). Interestingly, a recent infrastructural novelty refers to a “Layer 2” solution based on smart contracts and formed by a network of channels established mainly for micro-payments. This solution is named Lightning Network (hereinafter, LN) and was deployed in January 2018. More specifically, this network is formed by user counterparts that open bilateral channels through the issue of a multi-signed transaction on the Bitcoin blockchain. In so doing, these pairs of counterparts are then enabled to exchange back and forth a predefined amount of Bitcoin through off-chain transactions that are not uploaded into the blockchain at each operation (Poon and Dryja 2016), thus facilitating faster transactions. Eventually, if a particular channel is no longer needed, a multi-signed transaction corresponding to the final balance between the two counterparts is then uploaded to the blockchain.
Since the LN represents one of the most recognized solutions for scalability, in this paper we aim to evaluate how this infrastructure is evolving over time and, in particular, we investigate how its configuration is reflecting the dynamics of Bitcoin, i.e., the market behavior of its referring cryptocurrency. We opt for the assessment of the efficiency of the LN as a key dimension describing its functioning. In fact, this network of channels forms a multi-hop framework in which counterparts can send flows to other counterparts, even without creating a new channel, whenever a common path linking more channels is available and has enough stored capacity. For this reason, we employ the topological efficiency proposed by Latora and Marchiori (2001, 2003) to assess its likelihood to disseminate information through its nodes, which is a critical aspect for successfully routing transactions in such a multi-hop framework. In line with Martinazzi and Flori (2020), we provide therefore a network theory analysis of the LN, but in this case we propose an evaluation of the efficiency on a daily basis to better assess the impact of market dynamics. We consider the period from 12 February 2018, when the LN started, to 12 August 2020. Our study reveals how the size of the LN, as well as the capacity stored in its channels, increased remarkably over the period, while its efficiency has been characterized by phases of ups and downs.
Interestingly, we observe a few erratic behaviours during the period under study, which may be related to the market dynamics of the underlying cryptocurrency. For this reason, we decide to study the role played by Bitcoin market dynamics primarily by assessing its market efficient conditions. In particular, we test econometrically whether the weak form of the Efficient Market Hypothesis (EMH) (Fama 1970) holds. Several empirical works have already observed that cryptocurrency markets tend indeed to be inefficient, at least during boom and burst phases, meaning that returns appear skewed and heavy-tailed distributed, strong volatility clustering and leverage effects are present, and that multifractality and long-range dependence phenomena for both returns and volatility are quite common (see, e.g., Bariviera et al. 2017; Begušić et al. 2018; Chu et al. 2015; Phillip et al. 2018; Takaishi 2018; Zhang et al. 2018 among others). Therefore, we apply a battery of econometric tests to verify whether Bitcoin market patterns are actually efficient over the sample period. In so doing, we also contribute to the literature by studying market efficiency for recent observations of Bitcoin through the inclusion of a comprehensive set of tests. Our findings, supported also by the application of the Detrended Fluctuation Analysis over the sample period, indicate that Bitcoin is far from being an efficient market.
More in general, the dependence of Bitcoin market efficiency on investors’ behavioral distortions, variations in their risk appetite, changes in market conditions, impact of news, or even novelties in the blockchain infrastructural environment is still under investigation (Brauneis and Mestel 2018; Caginalp and Caginalp 2018; Dyhrberg et al. 2018; Flori 2019b; Fry 2018; Garcia et al. 2014; Kristoufek 2018; Urquhart 2018). In this work, we propose to evaluate the possible mutual effects occurring between Bitcoin market conditions and the functioning of the LN. In particular, we study the nexus between these systems by means of the Toda and Yamamoto (1995)’s variant of the Granger causality test (Toda and Yamamoto 1995), thus avoiding any pretest bias from cointegration issues. Our analysis reveals that Bitcoin market conditions are not able to Granger-cause the topological efficiency of the LN. Hence, the functioning of this second layer of the Bitcoin blockchain does not appear to be affected by how information is correctly or not spread in its referring crypto-market. From an economic perspective, this finding may question the practical usage of the LN as a system to favor the adoption and diffusion of blockchain technologies, since its ability to efficiently route transactions does not appear to be influenced by the market dynamics of its referring crypto-market. In fact, Bitcoin market dynamics may influence the LN in several ways, since strong market appreciation may discourage LN users to block bitcoins within the LN, or may induce them to open channels only with a few selected counterparts, thus impacting on the configuration of the LN. The contribution of this paper is therefore twofold. Firstly, we provide a detailed analysis of the evolution of the LN with respect to its topological configuration to characterize its efficient functioning in routing information through the multi-hop framework. Secondly, we show how such infrastructural efficiency levels relate to the market dynamics of its underlying cryptocurrency, revealing that its dynamics appear poorly connected to the market patterns of Bitcoin. More specifically, we note that Bitcoin market performance does not influence the level of interconnectivity among the users within the LN, but instead it may affect users’ decisions on how much bitcoins to store in the corresponding edges of the LN, thus possibly impacting on the overall functioning of the network.
Bitcoin practical usage and its scalability issue has haunted it, preventing its mass adoption since its initial stages. Our findings can be used to build the case for arguing that there might be a wide difference between Bitcoin’s audience and the users of LN. In this regard, our work reveals the lack of strong relationships between Bitcoin’s market dynamics and one of the most promising technological improvement underneath it. It should be noted, however, that although the referring cryptocurrency of LN is Bitcoin, several studies (see, e.g., Aslanidis et al. 2020; Corbet et al. 2018; Dimpfl and Peter 2019; Katsiampa 2019) have highlighted the market interdependence across cryptocurrencies, possibly hiding the role of events in other currencies through the impact on Bitcoin.
The paper is organized as follows. In Section 2 we present the technical aspects behind the LN and we describe the methodologies applied to compute both the topological and market efficiency measures. In this section we also discuss the mechanism behind the Granger causality testing, while in Section 3 we explore the main findings of our study. Section 4 contains concluding remarks.
2. Methodology
2.1. The Lightning Network
LN is the second layer of Bitcoin created to overcome some issues related to the payment system, which are low throughput (Poon and Dryja 2016) and high confirmation latency (Barber et al. 2012). Two users in the LN can exchange a pre-established amount of Bitcoin (BTC) instantaneously through an off-chain bi-directional payment channel based on a smart contract that also allows to perform an arbitrarily number of transactions exempt from fees. Basically, the only costs are therefore the fees paid to open the channel and to close it and broadcast the final balance between the two counterparts.
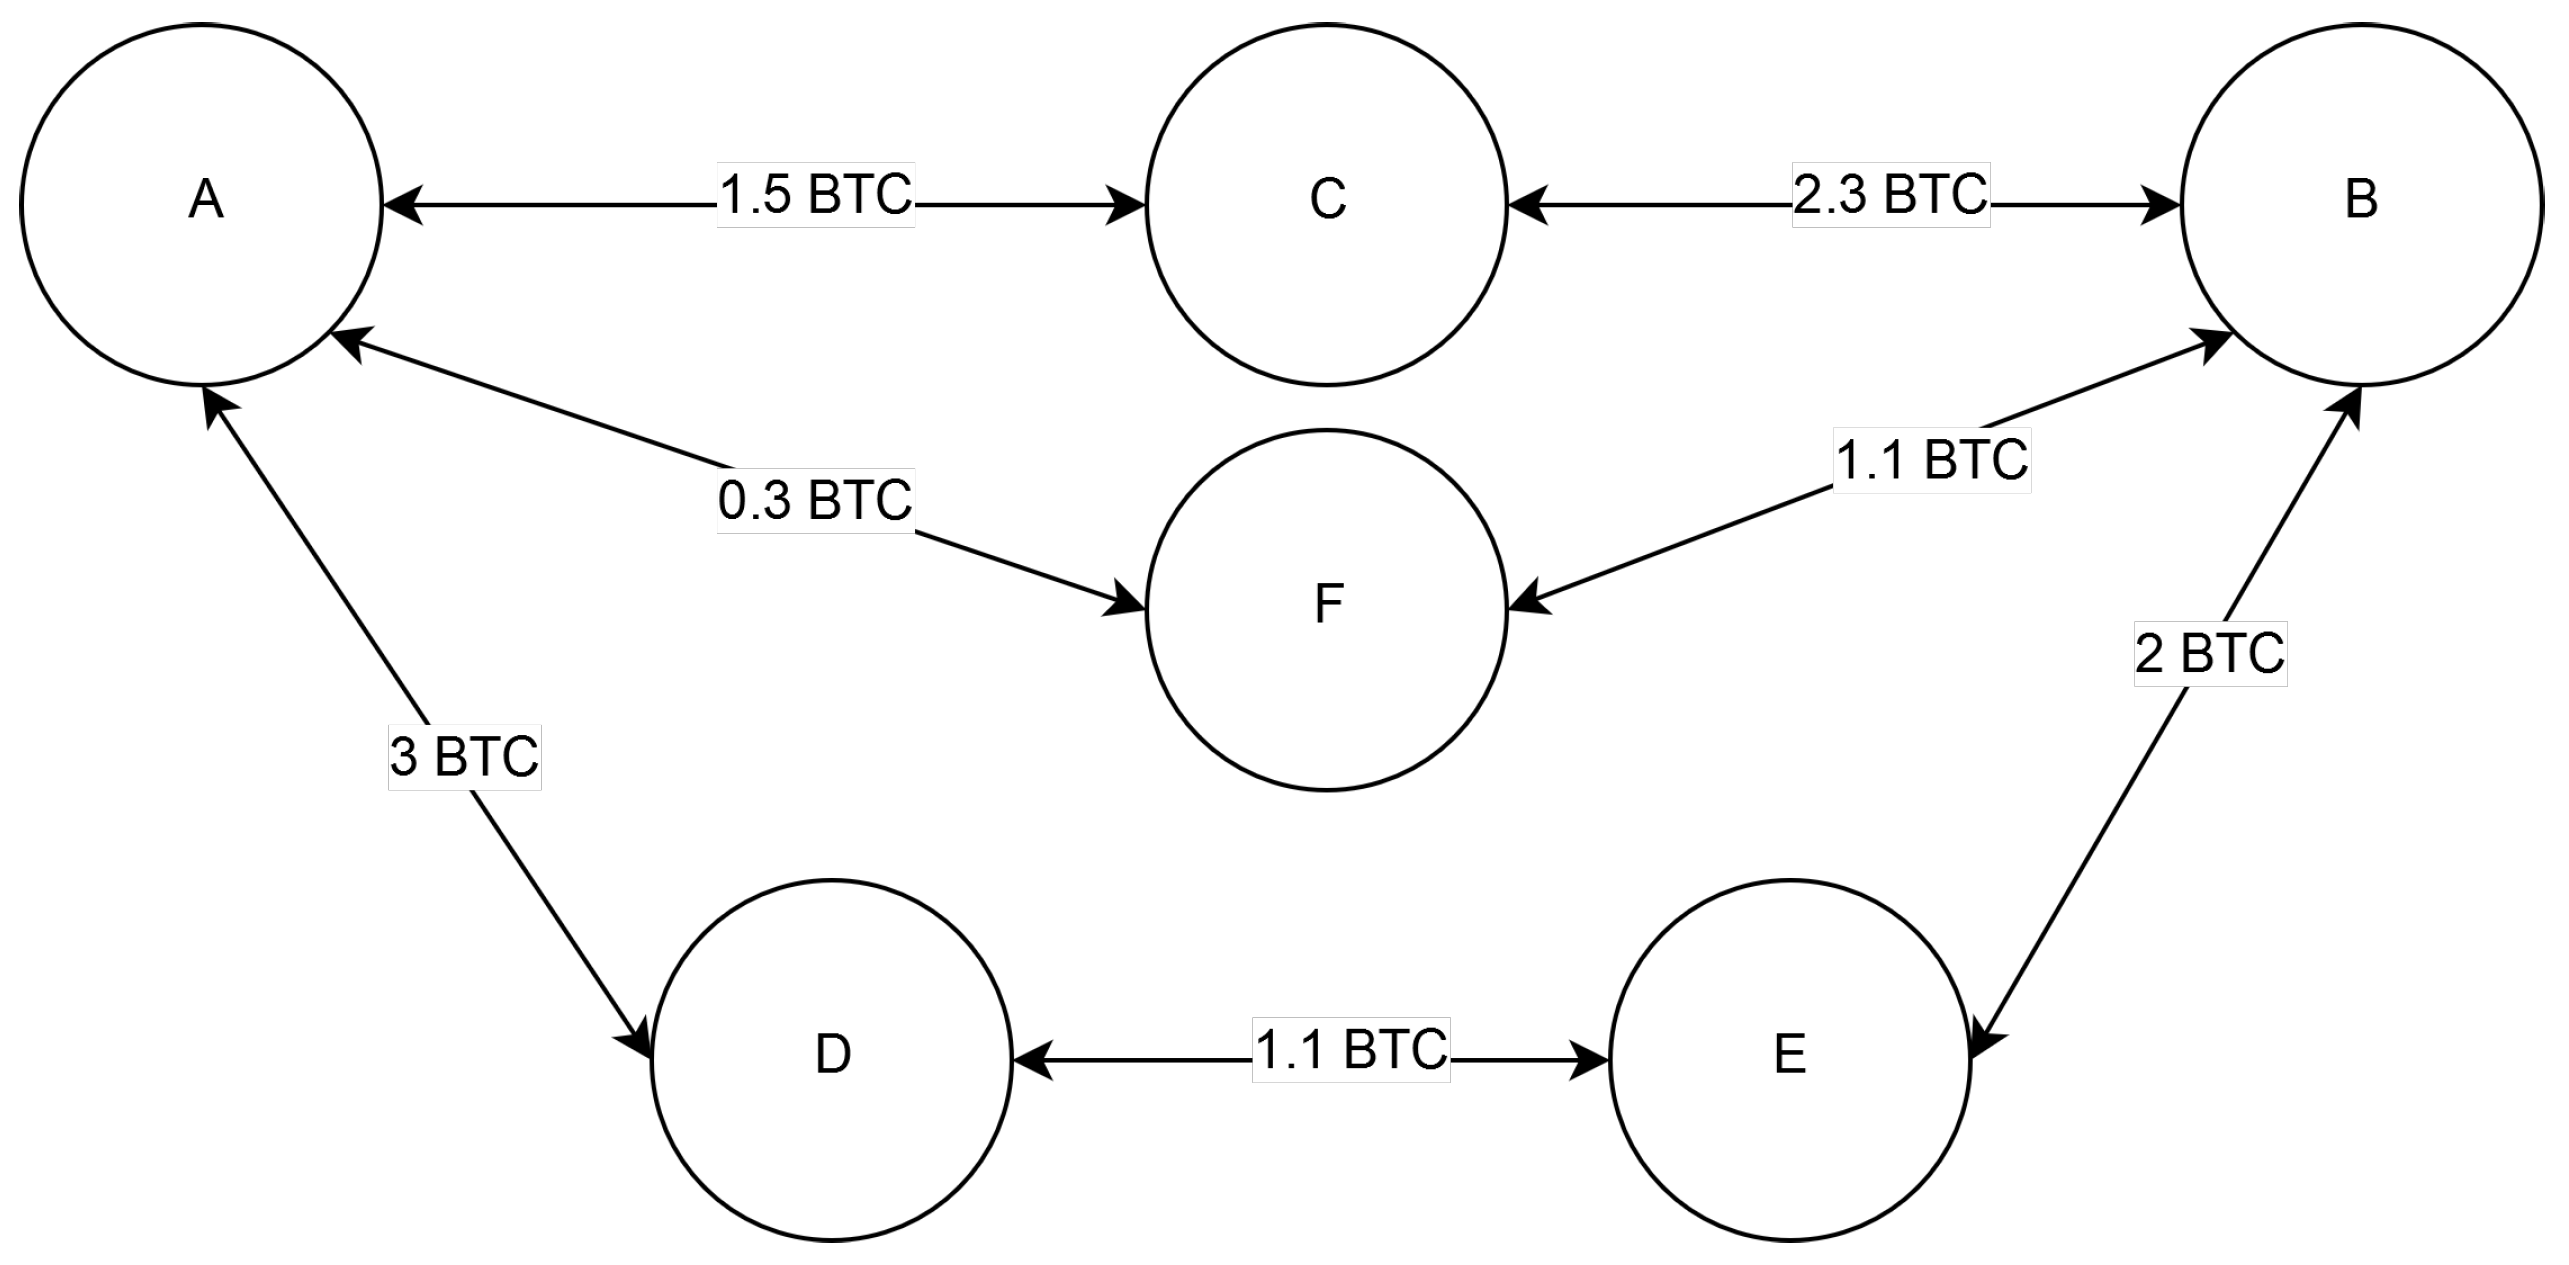
An interesting aspect of the LN is that two separate users that do not share a common channel might still be able to exchange payments if they can find a shared path with enough capacity to route the transaction. This routing framework is known as “multi-hop” (Decker and Wattenhofer 2015; Nowostawski and Tøn 2019; Poon and Dryja 2016). As illustrated in the example of Figure 1, user A may seek to send 1 BTC to user B, but these two counterparts do not share any direct link. However, A and B are directly linked with user C through two different channels. If the capacity installed on those two channels is equal or higher than 1 BTC, A can send its payment to B provided a small fee paid to C for its role as connector. This example can be extended to paths with more than one connector, where payments are forwarded through multiple channels as long as they have enough stored capacity. For instance, A can send 1 BTC to B through users D and E. Conversely, sharing a common path through user F is not sufficient to route 1 BTC payment since one channel carries only 0.3 BTC.
To characterize the LN, we follow the approach proposed in Miller et al. (2019) and Guo et al. (2019), employing a daily view of the LN configuration to study its time evolution. Specifically, we consider a channel to be active if the opening date is the same or earlier than the one in which the daily snapshot is taken, and the closing date is the same or later than the date of the snapshot. We then employ a topological analysis borrowed from network theory to assess the configuration of the LN. In particular, by means of these daily snapshots, we represent the LN at a given date as an undirected weighted graph in which nodes stand for active users which are connected by edges representing the corresponding channels. The weight of a certain edge stands for the stored amount of BTC in the respective channel.
Finally, following the approach proposed in Martinazzi and Flori (2020), we decide to use as main representation of the LN’s configuration its topological efficiency. It depends on key elements of the structure of the network, such as its density and the distribution of the capacity stored in its channels, hence it is a measure capable to aggregate a great deal of relevant information about the functioning of the network. For this reason, we refer to the topological efficiency to evaluate how the resulting configurations are able to spread information throughout the system, meaning how the network can efficiently perform multi-hop transactions. In so doing, we consider the global efficiency proposed in Latora and Marchiori (2001, 2003). This measure refers to the average value of the inverse of the shortest path among each possible couple of nodes. In formula, the global efficiency is: , with G the network composed by N nodes and the shortest path between nodes i and j. Global efficiency is usually normalized by , where is the fully connected graph with the same N nodes, and thus it propagates information in the most efficient possible way. Once normalized, , with 0 standing for the totally inefficient configuration, and 1 meaning the fully connected case. The global efficiency summarizes, therefore, the features of the level of interconnectivity between the nodes of the network and the distribution of the stored capacity among the corresponding edges. For these reasons, we decide to apply it to characterize the effective and efficient functioning of the LN, and we map its evolution over time to evaluate how such system reacted to the dynamics of its referring cryptocurrency, namely Bitcoin.
2.2. Market Efficiency
Several techniques have been applied to detect market efficiency in cryptomarkets. Empirical findings reported in the literature typically find that Bitcoin returns have been not uniformly efficient over time. For instance, inefficient market conditions have been observed by Kristoufek (2018) in the intervals from the mid-2011 to the mid-2012, and between March and November 2014. Similarly, Urquhart (2016) finds inefficient conditions since the inception of Bitcoin but also a tendency towards efficiency in the recent period. By contrast, other authors find opposite results, e.g., Nadarajah and Chu (2017) claim that Bitcoin is an efficient market in the interval from August 2010 to July 2016. Likewise, Tiwari et al. (2018) observe that Bitcoin is largely efficient in the period from July 2010 to June 2017.
The detection of efficient market conditions in cryptomarkets appears, therefore, ambiguous in the literature and findings appear strongly dependent on the selected reference period (for a review see, e.g., Flori (2019a)). In addition, scholars have also applied several estimation procedures borrowed from different and multidisciplinary fields. For instance, long-term dependence has been investigated by Jiang et al. (2018) who exploit the generalized Hurst exponent and a rolling-window estimation procedure to study the time-varying efficiency of Bitcoin, by Alvarez-Ramirez et al. (2018) who also point to the cyclical anti-persistence of price returns, and Bariviera et al. (2017) who additionally find that market liquidity does not seem to affect the level of long-term dependence. Al-Yahyaee et al. (2018) show that Bitcoin presents levels of long-range persistence higher than those of common asset classes (e.g., gold, equity indices, the US dollar index). Significant price fluctuations have also stimulated the detection of the efficient conditions of market volatility. For instance, Bariviera (2017) analyzes the daily volatility of returns and finds that volatility is persistent during the period from August 2011 to February 2017, thus supporting the emergence of volatility clustering, while several other works (see Al-Yahyaee et al. 2018; Baur et al. 2018; Bouri et al. 2019; Drożdż et al. 2018; Phillip et al. 2019 to name a few) note strong persistence and higher levels of volatility compared to traditional financial instruments.
Hence, following these perspectives proposed in the literature, we decide to employ a rich toolbox of different econometric tests to analyze market efficiency. Specifically, to test whether returns are independent observations, we exploit both the Runs Test (Wald and Wolfowitz 1940) and the Bartels Test (Bartels 1982); instead, to verify serial dependence in the returns, we apply the non-parametric BDS Test (Broock et al. 1996) and the Automatic Portmanteau Test (Escanciano and Lobato 2009). Finally, to test whether returns follow a random walk, we consider the DL Test (Domínguez and Lobato 2003) and the AVR Test (Choi 1999; Kim 2009; Lo and MacKinlay 1988). In essence, we refer to these tests to recognize the presence of efficient conditions in the period when LN was deployed. This assessment therefore provides an aggregate view on the efficient market conditions of Bitcoin over the whole reference period, namely from 12 February 2018 to 12 August 2020.
In our analysis the daily returns () at time t are computed as , with the price of Bitcoin at time t, while we compute the corresponding volatility as the absolute value of returns (namely, ).
In line with the current literature on cryptocurrencies investigating long-term dependency, we employ the Detrended Fluctuation Analysis (DFA) (Peng et al. 1994, 1995) to provide a daily evolution of market conditions. DFA is, in fact, a common technique to study the stability conditions in various financial systems (see, e.g., Spelta et al. 2020). Hence, Bitcoin market returns are shifted by their mean and integrated as follows:
then, windows with various lengths are employed to split these transformed series, so that for each window and value of the resulting summed data can be fit. Specifically, we use a local least squares straight-line fit and we minimize the squared errors within each time window. The root-mean-square deviation from the trend is computed as follows:
with L the total number of data points and the piecewise sequence of straight-line fits.
Since indicates the average of the summed squares of the residuals computed in the windows, a log-log graph of versus is expected to be linear if power law scaling is present, meaning that statistical self-affinity expressed as emerges as a straight line on the log-log graph. We compute the scaling exponent as the slope of the fitted line using least-squares. The scaling parameter , which can be also interpreted as the Hurst exponent, indicates the presence of self-similarity, and therefore long-term memory, as it maps the scaling of dispersion around the regressor as the size of the windows increases. The value of is, therefore, informative for signaling the following behaviours:
- : long-term memory and anti-correlation;
- : long-term memory and correlation;
- : uncorrelated signal (no memory);
- : non-stationary signal.
In our work, this entire procedure is repeated daily over sliding windows of 250 observations and one datapoint step forward. For robustness check, in the Appendix A we show also the main results for sliding windows of length equal to 300 and 600 days. We anticipate here that findings are qualitatively very similar to those reported in the main analysis of the paper. We retain the daily value of the exponent to map the evolution of the market efficiency conditions of Bitcoin.
Finally, to study the mutual relationships between LN and Bitcoin market conditions, we consider the Toda–Yamamoto test (Toda and Yamamoto 1995). This is a variant of the Granger causality test that does not rely on pretesting for cointegration issues. Basically, this approach assumes that the Wald test statistic is valid for Granger causality on lags of a certain variable in an overfitted VAR() model in which refers to the highest order of integration in that system. With , a regression equation on the system encompassing variables X and Y is thus of the following form:
where the coefficients on the additional lagged variables are not considered in the Wald statistic, which asymptotically has a chi-square distribution with p degrees of freedom, irrespective of the order of integration or cointegration properties of the variables in the system (Dolado and Lütkepohl 1996). Hence, this approach allows us to test linear or nonlinear restrictions on the first p coefficient matrices using the standard asymptotic theory, even if the processes may be integrated or cointegrated of an arbitrary order (Toda and Yamamoto 1995).
3. Results
Figure 2 shows two different illustrative snapshots of the LN. The plot on the left is the representation of LN on the 12 February 2018, while the plot on the right stands for the 12 August 2020. They refer to the first and the last observation of the LN in our sample. In both snapshots it is possible to notice the presence of a few large nodes surrounded by smaller ones indistinguishable from each other. The presence of a few massively endowed nodes highly connected with the rest of the network, composed by a vast majority of relatively poorly endowed nodes, suggests an overall hub and spoke structure of the system, a feature already highlighted by Martinazzi and Flori (2020).
Moreover, in Table 1 we show some topological measures collected for the LN at the beginning and at the end of the sample period. The LN grows from 538 nodes, connected by 1985 channels and with a total capacity of 6.56 BTC (USD 56,861 according to the historical exchange rate) to 7916 simultaneously active nodes, interconnected by 43,654 channels with a total capacity of 1216.29 BTC (USD 13,945,976). The number of connections per node does not change remarkably in terms of median values (from two to three connections), while the median capacity of the nodes (namely, the strength value) increases about four times. Similarly, the average degree increases from 7.37 to 11.03 connections per node, while the average node’s capacity increases by an order of magnitude. Overall these topological indicators point to the presence of a vast majority of nodes with few connections and, possibly, with only a small amount of stored BTC. Furthermore, as we mentioned before, the multi-hop routing capability of the LN is limited by the possibility of finding paths formed by channels with enough capacity to forward a payment. Hence, it is interesting to note that the median capacity per channel increases from about USD 8 to about USD 57 and the mean value from USD 28.64 to USD 319.47, which means that routing payments are likely to become potentially easier along this period.
We also consider some topological measures taking into account the whole configuration of the network. The assortativity coefficient stands for the tendency of the nodes to connect with others that possess similar degrees of connections. For a weighted network, an assortative behaviour arises when nodes with similar weighted degree bond together. The LN, in its unweighted representation, shows a decisive disassortative behaviour which is typical, for instance, of the internet infrastructure (Noldus and Van Mieghem 2015). Such disassortative feature is present also in the weighted representation of the LN (namely, Assortativity (W)), even if in a less remarkable fashion. Finally, the radius and diameter coefficients, which measure the minimum and maximum eccentricity distance between any pairs of nodes respectively, indicate an increasing dimension of the network as reflected also by the rise in the number of participants.
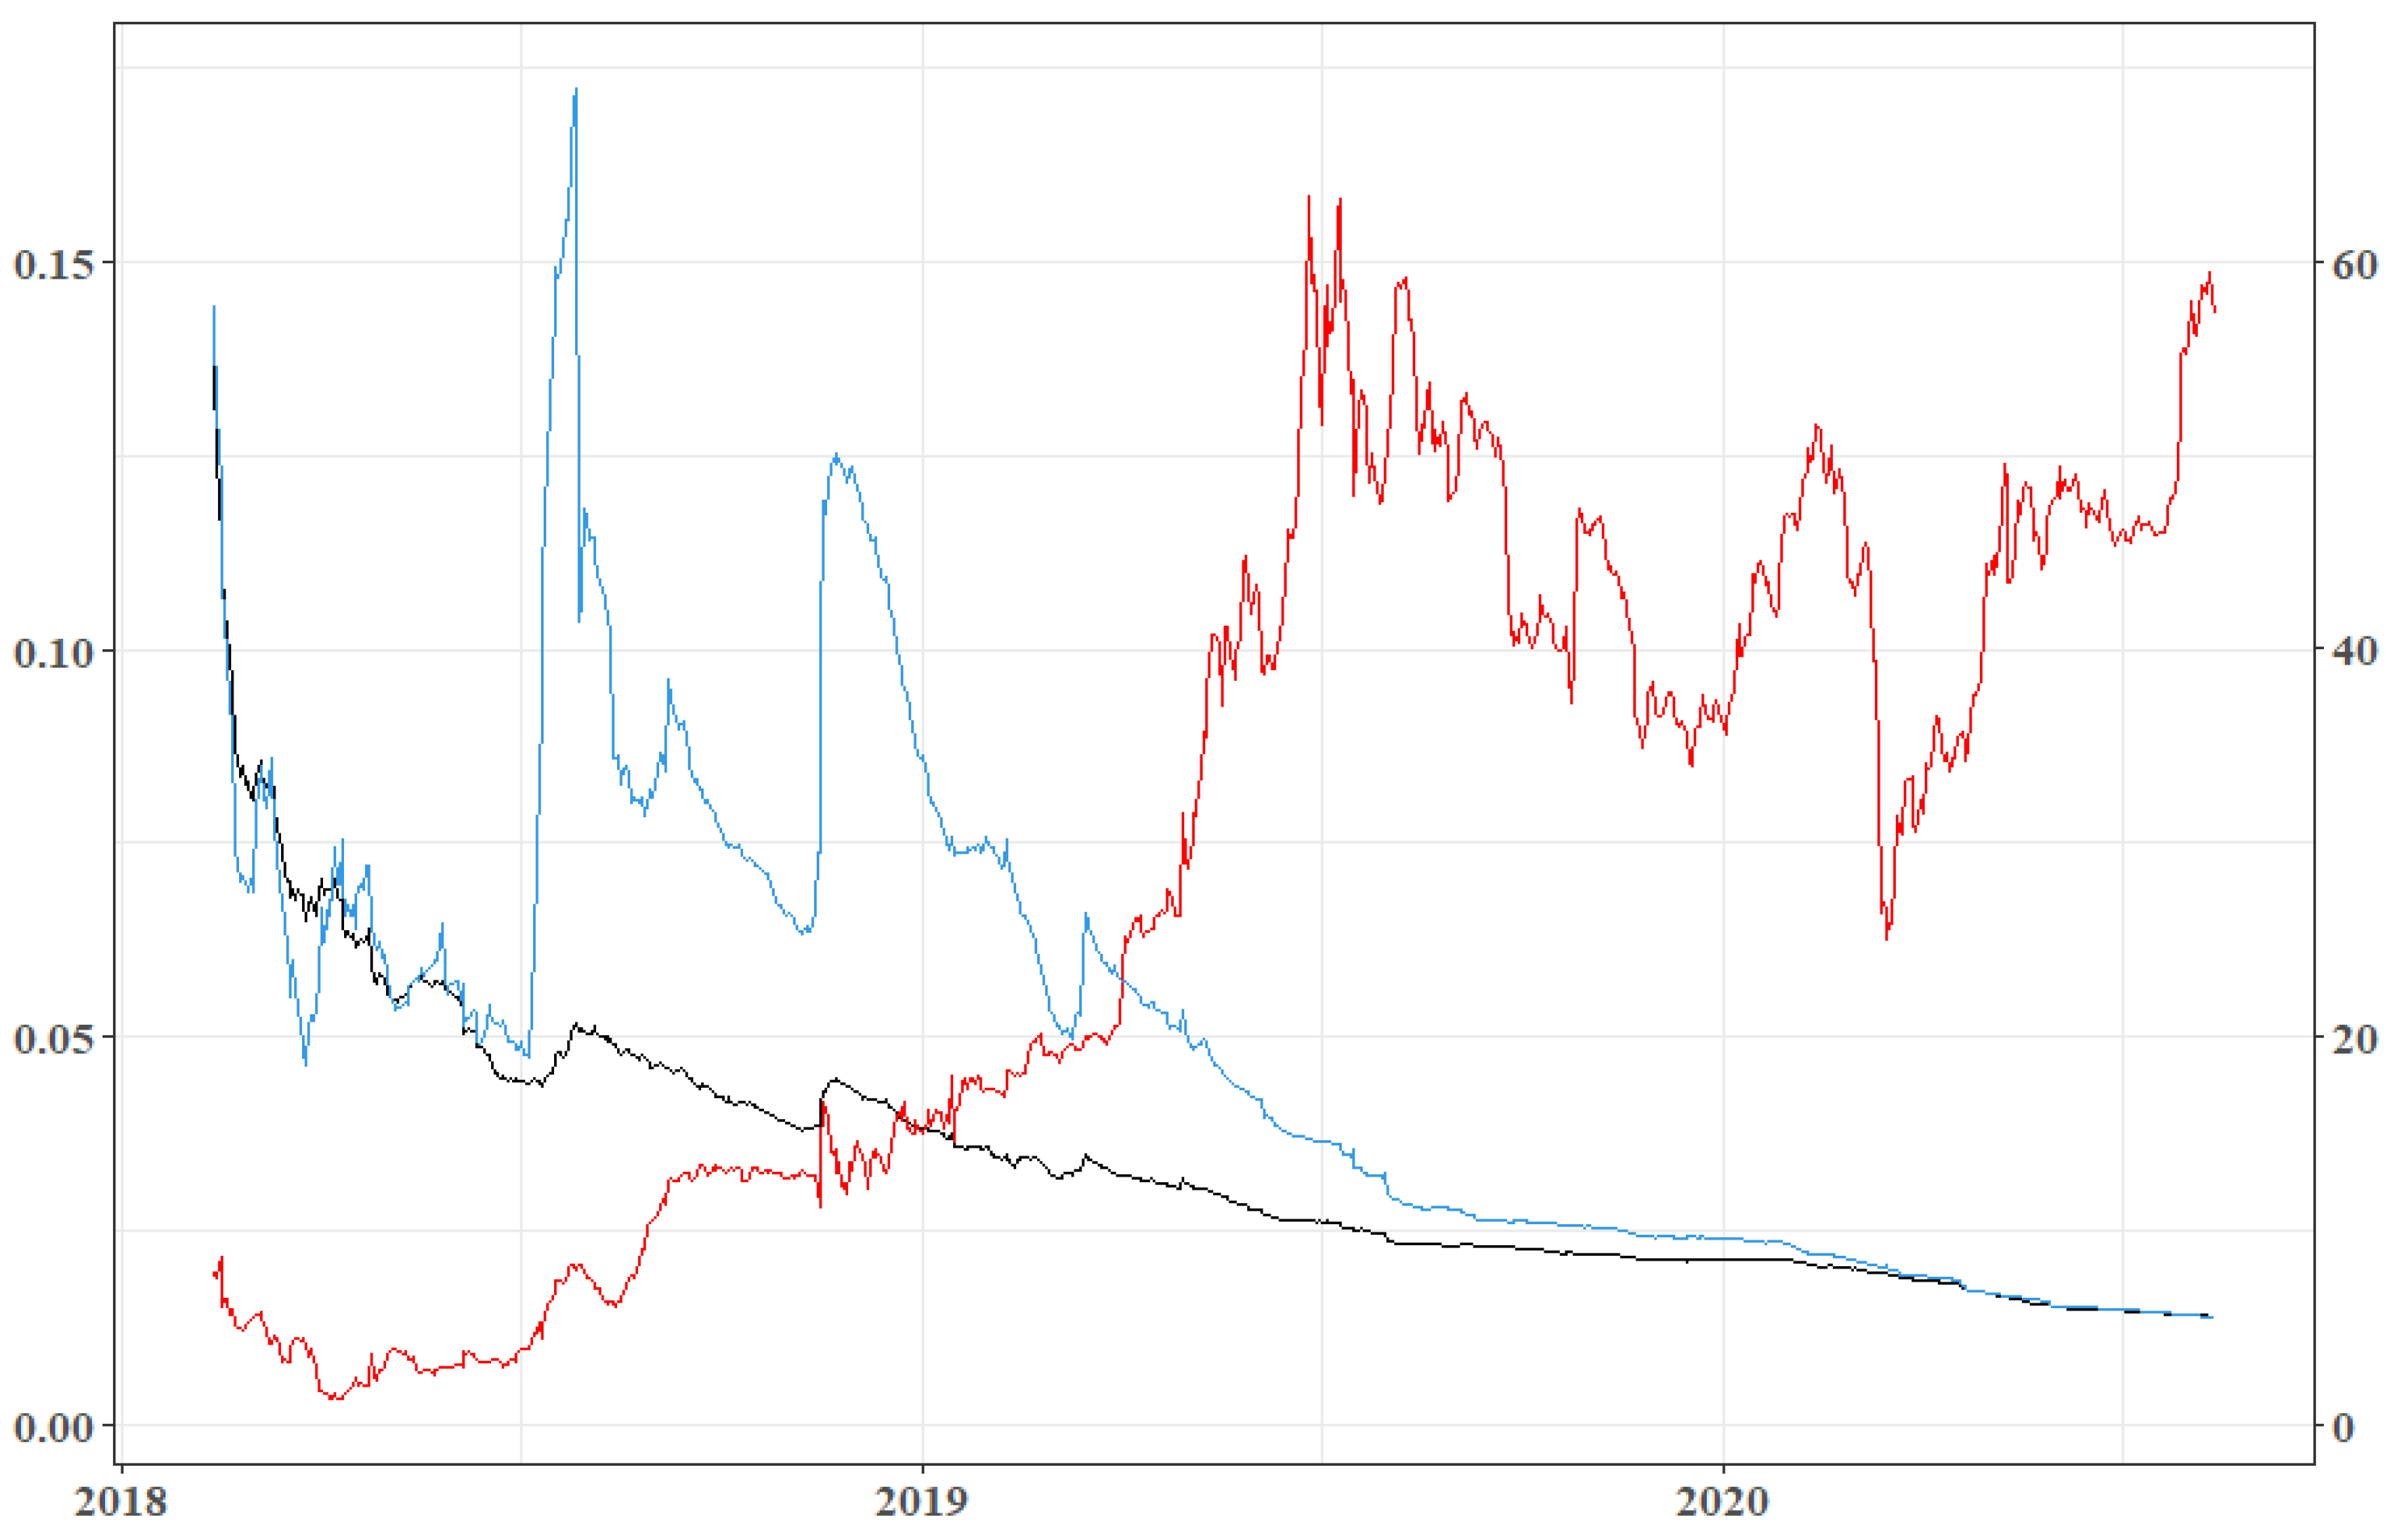
Our main measure of interest, the normalized global efficiency, shows instead a relevant drop from 0.14 to 0.014. The topological efficiency represents a relevant aspect for the assessment of the usability of LN as a payment infrastructure since it indicates how flows can effectively move through the system. In Figure 3 we plot the historical values of the LN’s normalized efficiency against the density of the network and the median capacity of the channels expressed in USD. The latter are chosen to display two key aspects about efficiency, namely the inter-connectivity among nodes and the capacity installed on the corresponding channels. As shown in the figure, the tendency of the normalized efficiency is comparable with the network’s density, while the growth of the median capacity presents an opposite pattern, especially in the last period. While it is intuitive to understand why a decrease in the inter-connectivity of the network deteriorates its efficiency, the relationship with the median capacity could be not so evident. A possible explanation lays, in fact, in the definition of the ideal graph, which has the capacity evenly distributed among all its channels, with respect to the real network characterized by sparser stored capacities and a core of very active nodes. Hence, an increase in the total capacity will be always distributed in a more efficient way in the ideal graph than in the real network, therefore decreasing the normalised efficiency of the latter.
As presented in the Introduction, in order to assess the role played by Bitcoin market conditions on the efficiency levels of the LN, we primarily analyze how its market dynamics efficiently embeds information. In Table 2 we report the results of the tests presented in Section 2.2. Although caution should be taken due to the short sample periods, our findings in Panel A indicate that Bitcoin returns seem to be characterized by inefficient market conditions. We consider several time windows, basically one for each year from 2015 to 2019, and two cases that refer to the interval from 2015 to 12 August 2020 and from 12 February 2018 to 12 August 2020, respectively. The latter case corresponds to our reference period with respect to the deployment of the LN, while the case from 2015 to 12 August 2020 is a scenario extended in terms of the length of the observations in order to enhance the statistical significance of the results. This latter case practically supports the findings reported for each year separately. Similarly, the market conditions for volatility appear largely inefficient during each interval and across each test (see Panel B), thus reflecting the market turbulence characterizing the persistence of the Bitcoin erratic market behavior.
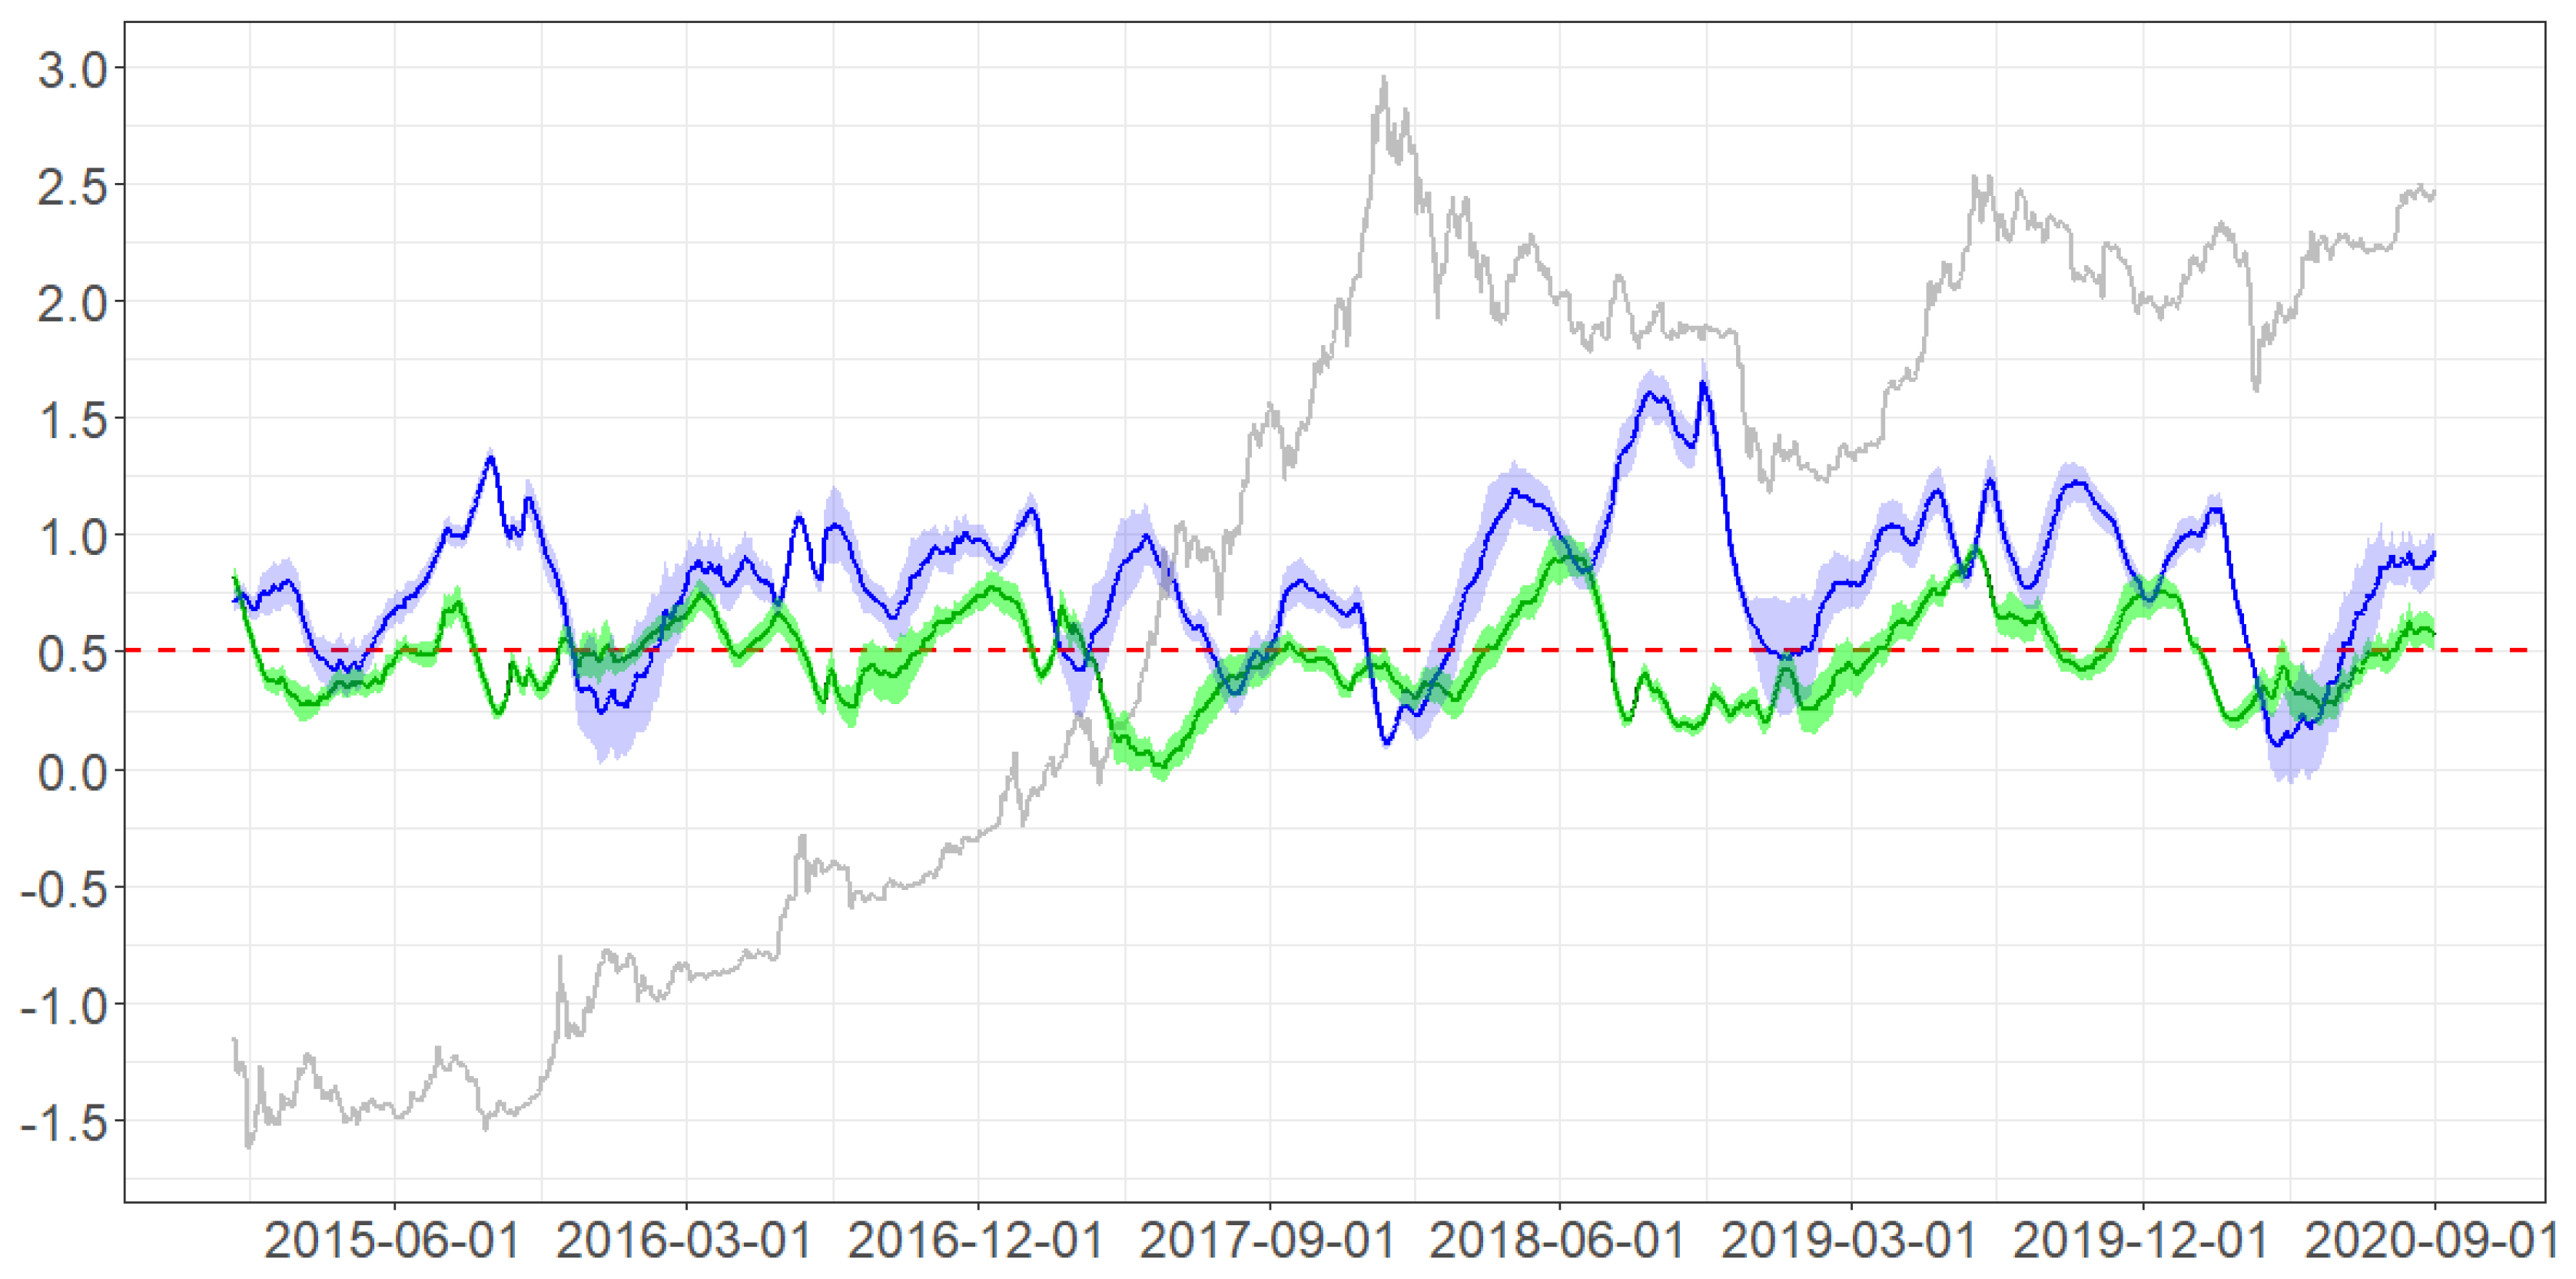
In addition, to depict the market conditions of Bitcoin on a daily basis, we rely on the DFA (Peng et al. 1994, 1995). Figure 4 shows the time evolution of the exponents for both the returns (in green) and volatility (in blue) of Bitcoin. Note how both exponents do not lie in a range around value 0.5 that corresponds to efficient market conditions, thus supporting the results reported in Table 2. Furthermore, although price euphoria has stimulated upwards-downwards market dynamics and relevant price fluctuations, the dynamics of the price of Bitcoin (in gray) does not seem to strongly map on the corresponding patterns of the DFA exponents. This is true also in the period after the remarkable market boom phase starting from the beginning of 2017 and culminating in the early part of 2018 when the LN was established. During the reference period, the correlation values between Bitcoin price and both the DFA exponents of returns and volatility are low and about 0.04 and 0.05, respectively.
In particular, the literature has proposed several aspects that may affect the efficiency of crypto markets (see, e.g., Brauneis and Mestel 2018; Caginalp and Caginalp 2018; Dyhrberg et al. 2018; Flori 2019b; Fry 2018; Garcia et al. 2014; Kristoufek 2018; Urquhart 2018 to name a few). They refer, for instance, to investors’ behavioral biases, the impact of news and infrastructural changes. As far as the latter aspect is concerned, the LN represents one of the main infrastructural novelties within the framework of payments solutions based on blockchain technologies. For this reason, we aim to explore whether its functioning has been influenced by the market conditions of its referring cryptocurrency, namely Bitcoin, or, alternatively, whether it is also possible that LN has affected the market efficiency conditions of Bitcoin.
Findings reported in Table 2 and Figure 4 indicate that the market conditions for Bitcoin seem to have been inefficient when the LN started to operate, basically corresponding to the period just after the remarkable boom phase culminated at the end of 2017. Our next investigation refers, therefore, to the comparison between the market conditions of Bitcoin and the functioning of LN, the latter in terms of its ability to perform transactions in a multi-hop system. In so doing, to map the daily market conditions of Bitcoin we refer to the exponent values from the DFA of both returns and volatility along with its basic price and returns time series, while we employ the topological efficiency to describe the functioning of the LN. Due to the nature of these indicators, which may exhibit erratic patterns, and the potential presence of cointegration issues, we opt for the Granger-like causality test based on the Toda–Yamamoto approach (Toda and Yamamoto 1995). Other methodologies to run a proper causality testing when time-series are non-stationary and, possibly, cointegrated can be utilized as well (see, e.g., Lütkepohl 2005).
We run the Toda–Yamamoto tests over the period from 12 February 2018 to 12 August 2020, thus covering the eighteen months of existence of the LN in our sample. We consider the topological efficiency of the LN, the DFA exponents of the returns and volatility of Bitcoin as well as both its raw price and returns time series. Specifically, the mechanics behind the application of the Toda–Yamamoto test is based on the following steps. First, for each series we compute the maximum order of integration () by calculating the ADF and KPSS tests. Second, we set up VAR models in levels for pairs of variables and we select the maximum lag length for them (p) using information criteria such as AIC, SIC, HQ and FPE. Third, we check whether each VAR model is well specified by verifying that residuals are not serially correlated. Fourth, we add the maximum order of integration to the number of lags, thus estimating augmented VAR () models. Our assessment is finally based on carrying out Wald tests for the first p variables. The Wald test statistics will be asymptotically chi-squared distributed with p degrees of freedom.
Table 3 reports the estimates of the Toda–Yamamoto tests. Panel A reports the case in which column variables may Granger-cause the LN efficiency. Interestingly, although the LN is a second layer of the Bitcoin blockchain, the efficiency of the Bitcoin market does not seem to really impact on the functioning of the LN. In fact, both the tests in which the DFA exponents of the Bitcoin returns and volatility are compared against the LN topological efficiency present very high p-values. Similarly, Bitcoin raw prices and returns do not seem to have a statistically significant influence on the LN efficiency. Hence, it seems that the efficiency of the LN in terms of its ability to perform transactions in the multi-hop structure is not influenced by the market dynamics of Bitcoin. We recall that the efficiency of the LN is here dependent on the level of interconnectivity and on the capacity in terms of bitcoins stored in the edges of the network. Our findings indicate that Bitcoin market performances may thus not have a role in shaping the LN efficiency, while, as expected, Panel B indicates that the LN efficiency configuration is not able to Granger-causes the market dynamics of its main referring cryptomarket. In the Appendix A, we show that such findings are confirmed once we extend the time windows to compute the DFA to 300 and 600 days instead of 250.
Then, in order to better understand whether some aspects of the configuration of LN are instead prone to be influenced by changes in the Bitcoin market performances, we investigate whether topological features related to the efficiency levels of LN might be Granger-caused by the market performance of Bitcoin. Therefore, we replicate a similar analysis as the one reported in Table 3, but in this case we specifically focus on the relationships between Bitcoin returns and a battery of topological indicators. In particular, in Table 4 we report the estimates related to the Granger-causality of Bitcoin returns on the following topological indicators for the LN: assortativity, density, transitivity, the median value of the nodes’ strength, and the median capacity of the edges. Hence, we refer to a simple list of topological indicators that are able to map the configuration of the LN in terms of both the features of its nodes and the way edges connecting these nodes are created (see also Table 1 and the corresponding discussion). Hence, this analysis provides an intuitive indication of the potential elements contributing to the functioning of the LN.
From Table 4 note how Bitcoin returns do not appear to Granger-cause how similar nodes in the LN tend to connect together, as shown by the relationship with assortativity. Similarly, it emerges that the relationship with respect to the overall density of the LN is not significant. Hence, Bitcoin market performance does not seem to be a significant driver for the creation of channels in the LN, at least for what concerns the aggregate level of inter-connectivity in the network. In addition, both the relationships with the assortativity and with the transitivity seem to signal that Bitcoin market performances are not able to significantly affect the structure of the neighborhood of each node. This is also supported by the results involving the median values of the nodes’ strengths, which do not appear influenced by Bitcoin market dynamics. By contrast, it seems that the amount of bitcoins stored in the channels can be related to Bitcoin market movement. Overall, these findings support the interpretation that Bitcoin market performances hardly influence the efficiency of the LN through the creation of channels, but possibly impact on it with the corresponding deployment of stored resources. Finally, the corresponding reverse relationships are not statistically significant.
Previous findings seem to discard the presence of a relevant role for the topological features of the nodes. The LN is, however, characterized by the existence of a bundle of very active players to which a cloud of small nodes (in terms of capacity) are connected. For this reason, we also investigate the potential impact of Bitcoin market returns on the characteristics of these highly centralized nodes whose dynamics may actually influence the overall functioning of the system. Hence, we select the top 0.5% of the nodes in terms of strength, thus representing those nodes in the LN which are likely to affect the overall functioning of the system, and we test the Toda–Yamamoto Granger-causality of Bitcoin market returns on their fraction of capacity with respect to the whole LN. We observe that this relationship is not significant (p-value 0.30). We replicate the same analysis using the top 1% and 10% of the nodes, obtaining similar results (p-values equal to 0.32 and 0.86 respectively). The centralization feature of the LN, already observed by Martinazzi and Flori (2020), may influence its functioning since a huge portion of transactions are likely to occur across the edges of these central nodes. Our analysis suggests that the tendency towards a centralized configuration of the LN does not seem to be impacted by Bitcoin market performances.
4. Conclusions
Since its inception, Bitcoin has been criticized for its inability to efficiently perform as many transactions per second as traditional payments services. This evidence, known as scalability issue, has been addressed with different tentative solutions, but it has never been completely solved. With this regard, the LN is a system based on off-chain payment channels and has been considered since its proposal as a very promising candidate to definitively solve the scalability issue.
This work proposes to investigate the LN functioning by adopting a graph theory perspective to detect how efficient it is in routing information through its multi-hop framework. In particular, in order to assess the efficiency of such infrastructure we analyze whether Bitcoin market conditions affect the functioning of LN. This is a relevant point for practical purposes, since the very volatile nature of Bitcoin, which is the underlying cryptocurrency of LN, may actually influence the configuration of the LN, limiting its wider adoption and, eventually, preventing its use as a solution for the scalability issue.
To detect whether Bitcoin market performances play a role in shaping the configuration of the LN, we opt for an investigation strategy in which Bitcoin market dynamics is synthesized through an intuitive set of indicators. First, we test Bitcoin for the weak Efficient Market Hypothesis on a daily basis by means of the Detrended Fluctuation Analysis (DFA) and various statistical tests. We keep the DFA exponents for the Bitcoin returns and volatility and, alongside prices and returns daily time series, we test if they Granger-cause the efficiency of LN. This analysis does not reveal any significant relationship between market conditions of Bitcoin and the topological efficiency of LN and vice-versa. Then, we focus on a simple indicator of market performance and we test whether Bitcoin daily returns, largely emphasized by market watchers and blockchain fans, actually impact on specific topological properties related with the efficiency of LN, such as assortativity, density, transitivity, median nodal capacity and median channel capacity that we employ to describe the infrastractural features of LN and its adoption. Once again, our findings reveal that Bitcoin market performances do not seem to influence the properties of the configuration of the LN, with the only exception represented by the capacity stored in the channels.
Finally, we investigate the Granger-causality relationship between Bitcoin market returns and the growth of the most endowed nodes in the LN, which represent the most active nodes in the network through which a relevant share of transactions in the multi-hop framework is likely to occur. More precisely, we consider the proportion of the capacity installed over those channels co-owned by the top 0.5%, 1% and 10% nodes. Our estimates indicate that Bitcoin market performances do not seem to influence the core of the network.
These results suggest that the forces that drive Bitcoin market patterns are different from those that affect the evolution of the LN. In the light of these results, we can suppose that the activity of the LN might be only in part influenced by the interest surrounding Bitcoin market performance, since the functioning of the LN does not appear to be strongly related to the market dynamics of its referring cryptocurrency. In fact, our analysis indicates that the very volatile market dynamics of Bitcoin, although it could influence the configuration of LN by impacting for instance on the amount stored in the channels, in practice does not affect its level of efficiency. This is an interesting result for future adoption of LN as an infrastructural solution to favor scalability since it seems to indicate that Bitcoin market turmoil and performance play a marginal role in shaping the LN configuration, which instead seems more related to the distribution of capacities among channels. We can thus speculate that the LN is an innovation that attracts the interest of the most technologically proficient users of Bitcoin, while it has little impact whatsoever for those that consider Bitcoin nothing more than a financial asset.
As noted in (Martinazzi and Flori 2020), the efficiency of the network is one of its main features and it is strongly affected by the structure and the capacity distributed over its channels. Hence, users and proponents of LN might emphasize the importance and usability of LN to increase stored capacity, thus enabling higher effectiveness and making the infrastructure capable to perform indirect payments in a more efficient way.
There are some limitations in this study. First, the scarce length of the period under analysis may hinder our conclusions, especially when considering such volatile market patterns. Second, the nature of Bitcoin and the LN makes impossible to impute precisely node’s ownership, an aspect that would be interesting to take into account to understand how common users operate across these two networks. For instance, nodes’ behavior might be relevant to disentangle those cases where the LN is mostly exploited for testing purposes, where users interested in evaluating and testing this technology may be more prone to open a channel with a node owned by a recognized institution in the LN. The underlying behavioral drivers that shape the development of the LN’s structure should be investigated more carefully in future works also with respect to the overall market dynamics of cryptocurrencies. For instance, interdependences between the co-movements of different cryptocurrencies have been empirically shown in many works (see, e.g., Dimpfl and Peter 2019; Katsiampa 2019) highlighting the presence of herding behavior in the market, which can be exacerbated by periods of market stress (Raimundo Júnior et al. 2020; Vidal-Tomás et al. 2019). Future works may thus focus on how news and main announcements may impact on LN infrastructure, its functioning and relationships with Bitcoin and, more in general, with the marketplace of cryptocurrencies. The detection and stability of clusters of nodes sharing similar features, in line for instance with other applications in finance (see, e.g., Flori et al. 2019; Puliga et al. 2016; Spelta et al. 2018), represent another interesting field that can be investigated to study users’ behavior in the network.
Author Contributions
Conceptualization, S.M., D.R., A.F.; methodology, S.M., D.R., A.F.; formal analysis, S.M., A.F.; investigation, S.M., A.F.; data curation, S.M.; writing—original draft preparation, S.M., A.F.; writing—review and editing, D.R., A.F.; visualization, S.M. All authors have read and agreed to the published version of the manuscript.
Funding
This research received no external funding.
Conflicts of Interest
The authors declare no conflict of interest.
Appendix A

Table A1.
Testing for Granger-causality. The table reports the results of the Toda–Yamamoto test (Toda and Yamamoto 1995). In Panel A we test whether column variables Granger-cause the row variable, while the opposite for Panel B. To compute the DFA, we consider time windows of length for the first two columns and for the last two.
| Panel A: Column G-Causes Row | BTC Alpha | BTC Vol Alpha | BTC Alpha | BTC Vol Alpha | ||
| LN efficiency | statistics | 1.90 | 1.90 | 2.20 | 1.10 | |
| p-value | 0.60 | 0.87 | 0.81 | 0.98 | ||
| Panel B: Row G-Causes Column | BTC Alpha | BTC Vol Alpha | BTC Alpha | BTC Vol Alpha | ||
| LN efficiency | statistics | 0.90 | 3.40 | 3.10 | 5.30 | |
| p-value | 0.83 | 0.64 | 0.68 | 0.50 |
References
- Al-Yahyaee, Khamis Hamed, Walid Mensi, and Seong-Min Yoon. 2018. Efficiency, multifractality, and the long-memory property of the bitcoin market: A comparative analysis with stock, currency, and gold markets. Finance Research Letters 27: 228–34. [Google Scholar] [CrossRef]
- Alvarez-Ramirez, José, Eduardo Rodriguez, and Carlos Ibarra-Valdez. 2018. Long-range correlations and asymmetry in the bitcoin market. Physica A: Statistical Mechanics and Its Applications 492: 948–55. [Google Scholar] [CrossRef]
- Angel, James J., and Douglas McCabe. 2015. The ethics of payments: Paper, plastic, or bitcoin? Journal of Business Ethics 132: 603–11. [Google Scholar] [CrossRef]
- Aslanidis, Nektarios, Aurelio F. Bariviera, and Alejandro Perez-Laborda. 2020. Are cryptocurrencies becoming more interconnected? arXiv arXiv:2009.14561. [Google Scholar]
- Baek, Chung, and Matt Elbeck. 2015. Bitcoins as an investment or speculative vehicle? A first look. Applied Economics Letters 22: 30–34. [Google Scholar] [CrossRef]
- Barber, Simon, Xavier Boyen, Elaine Shi, and Ersin Uzun. 2012. Bitter to better—How to make bitcoin a better currency. In International Conference on Financial Cryptography and Data Security. Berlin and Heidelberg: Springer, pp. 399–414. [Google Scholar]
- Bariviera, Aurelio F. 2017. The inefficiency of bitcoin revisited: A dynamic approach. Economics Letters 161: 1–4. [Google Scholar] [CrossRef] [Green Version]
- Bariviera, Aurelio F., María José Basgall, Waldo Hasperué, and Marcelo Naiouf. 2017. Some stylized facts of the bitcoin market. Physica A: Statistical Mechanics and Its Applications 484: 82–90. [Google Scholar] [CrossRef] [Green Version]
- Bartels, Robert. 1982. The rank version of von neumann’s ratio test for randomness. Journal of the American Statistical Association 77: 40–46. [Google Scholar] [CrossRef]
- Baur, Aaron W., Julian Bühler, Markus Bick, and Charlotte S. Bonorden. 2015. Cryptocurrencies as a disruption? empirical findings on user adoption and future potential of bitcoin and co. In Conference on e-Business, e-Services and e-Society. Berlin and Heidelberg: Springer, pp. 63–80. [Google Scholar]
- Baur, Dirk G., Kihoon Hong, and Adrian D. Lee. 2018. Bitcoin: Medium of exchange or speculative assets? Journal of International Financial Markets, Institutions and Money 54: 177–89. [Google Scholar] [CrossRef]
- Bech, Morten L., and Rodney Garratt. 2017. Central Bank Cryptocurrencies. BIS Quarterly Review. Basel: BIS, September. [Google Scholar]
- Begušić, Stjepan, Zvonko Kostanjčar, H. Eugene Stanley, and Boris Podobnik. 2018. Scaling properties of extreme price fluctuations in bitcoin markets. Physica A: Statistical Mechanics and Its Applications 510: 400–6. [Google Scholar]
- Blundell-Wignall, Adrian. 2014. The bitcoin question. In OECD Working Papers on Finance, Insurance and Private Pensions. Paris: OECD. [Google Scholar]
- Böhme, Rainer, Nicolas Christin, Benjamin Edelman, and Tyler Moore. 2015. Bitcoin: Economics, technology, and governance. Journal of Economic Perspectives 29: 213–38. [Google Scholar]
- Bouri, Elie, Luis A. Gil-Alana, Rangan Gupta, and David Roubaud. 2019. Modelling long memory volatility in the bitcoin market: Evidence of persistence and structural breaks. International Journal of Finance & Economics 24: 412–26. [Google Scholar]
- Brauneis, Alexander, and Roland Mestel. 2018. Price discovery of cryptocurrencies: Bitcoin and beyond. Economics Letters 165: 58–61. [Google Scholar] [CrossRef]
- Brito, Jerry, Houman Shadab, and Andrea Castillo. 2014. Bitcoin financial regulation: Securities, derivatives, prediction markets, and gambling. Columbia Science and Technology Law Review 16: 144. [Google Scholar] [CrossRef] [Green Version]
- Broock, William A., José Alexandre Scheinkman, W. Davis Dechert, and Blake LeBaron. 1996. A test for independence based on the correlation dimension. Econometric Reviews 15: 197–235. [Google Scholar] [CrossRef]
- Caginalp, Carey, and Gunduz Caginalp. 2018. Opinion: Valuation, liquidity price, and stability of cryptocurrencies. Proceedings of the National Academy of Sciences 115: 1131–34. [Google Scholar] [CrossRef] [Green Version]
- Carrick, Jon. 2016. Bitcoin as a complement to emerging market currencies. Emerging Markets Finance and Trade 52: 2321–34. [Google Scholar] [CrossRef]
- Choi, In. 1999. Testing the random walk hypothesis for real exchange rates. Journal of Applied Econometrics 14: 293–308. [Google Scholar] [CrossRef]
- Chu, Jeffrey, Saralees Nadarajah, and Stephen Chan. 2015. Statistical analysis of the exchange rate of bitcoin. PLoS ONE 10: e0133678. [Google Scholar] [CrossRef]
- Corbet, Shaen, Andrew Meegan, Charles Larkin, Brian Lucey, and Larisa Yarovaya. 2018. Exploring the dynamic relationships between cryptocurrencies and other financial assets. Economics Letters 165: 28–34. [Google Scholar] [CrossRef]
- Croman, Kyle, Christian Decker, Ittay Eyal, Adem Efe Gencer, Ari Juels, Ahmed Kosba, Andrew Miller, Prateek Saxena, Elaine Shi, Emin Gün Sirer, and et al. 2016. On scaling decentralized blockchains. In International Conference on Financial Cryptography and Data Security. Berlin and Heidelberg: Springer, pp. 106–25. [Google Scholar]
- Decker, Christian, and Roger Wattenhofer. 2015. A fast and scalable payment network with bitcoin duplex micropayment channels. In Symposium on Self-Stabilizing Systems. Berlin and Heidelberg: Springer, pp. 3–18. [Google Scholar]
- Dierksmeier, Claus, and Peter Seele. 2018. Cryptocurrencies and business ethics. Journal of Business Ethics 152: 1–14. [Google Scholar] [CrossRef]
- Dimpfl, Thomas, and Franziska J. Peter. 2019. Group transfer entropy with an application to cryptocurrencies. Physica A: Statistical Mechanics and Its Applications 516: 543–51. [Google Scholar] [CrossRef]
- Dolado, Juan J., and Helmut Lütkepohl. 1996. Making wald tests work for cointegrated var systems. Econometric Reviews 15: 369–86. [Google Scholar] [CrossRef]
- Domínguez, Manuel A., and Ignacio N. Lobato. 2003. Testing the martingale difference hypothesis. Econometric Reviews 22: 351–77. [Google Scholar] [CrossRef]
- Drożdż, Stanisław, Robert Gebarowski, Ludovico Minati, Paweł Oświecimka, and Marcin Watorek. 2018. Bitcoin market route to maturity? evidence from return fluctuations, temporal correlations and multiscaling effects. Chaos: An Interdisciplinary Journal of Nonlinear Science 28: 071101. [Google Scholar] [CrossRef] [Green Version]
- Dwyer, Gerald P. 2015. The economics of bitcoin and similar private digital currencies. Journal of Financial Stability 17: 81–91. [Google Scholar] [CrossRef] [Green Version]
- Dyhrberg, Anne H., Sean Foley, and Jiri Svec. 2018. How investible is bitcoin? analyzing the liquidity and transaction costs of bitcoin markets. Economics Letters 171: 140–43. [Google Scholar] [CrossRef]
- Escanciano, J. Carlos, and Ignacio N. Lobato. 2009. An automatic portmanteau test for serial correlation. Journal of Econometrics 151: 140–49. [Google Scholar] [CrossRef]
- Fama, Eugene F. 1970. Efficient capital markets: A review of theory and empirical work. The Journal of Finance 25: 383–417. [Google Scholar] [CrossRef]
- Flori, Andrea. 2019a. Cryptocurrencies in finance: Review and applications. International Journal of Theoretical and Applied Finance 22: 1950020. [Google Scholar] [CrossRef]
- Flori, Andrea. 2019b. News and subjective beliefs: A bayesian approach to bitcoin investments. Research in International Business and Finance 50: 336–56. [Google Scholar] [CrossRef]
- Flori, Andrea, Simone Giansante, Claudia Girardone, and Fabio Pammolli. 2019. Banks’ business strategies on the edge of distress. Annals of Operations Research, 1–50. [Google Scholar] [CrossRef] [Green Version]
- Fry, John. 2018. Booms, busts and heavy-tails: The story of bitcoin and cryptocurrency markets? Economics Letters 171: 225–29. [Google Scholar] [CrossRef] [Green Version]
- Garcia, David, Claudio J. Tessone, Pavlin Mavrodiev, and Nicolas Perony. 2014. The digital traces of bubbles: Feedback cycles between socio-economic signals in the bitcoin economy. Journal of the Royal Society Interface 11: 20140623. [Google Scholar] [CrossRef]
- Gomber, Peter, Jascha-Alexander Koch, and Michael Siering. 2017. Digital finance and fintech: Current research and future research directions. Journal of Business Economics 87: 537–80. [Google Scholar] [CrossRef]
- Guo, Yuwei, Jinfeng Tong, and Chen Feng. 2019. A measurement study of bitcoin lightning network. Paper presented at 2019 IEEE International Conference on Blockchain (Blockchain), Atlanta, GA, USA, July 14–17; pp. 202–11. [Google Scholar]
- Hong, KiHoon. 2017. Bitcoin as an alternative investment vehicle. Information Technology and Management 18: 265–75. [Google Scholar] [CrossRef]
- Jiang, Yonghong, He Nie, and Weihua Ruan. 2018. Time-varying long-term memory in bitcoin market. Finance Research Letters 25: 280–84. [Google Scholar] [CrossRef]
- Katsiampa, Paraskevi. 2019. Volatility co-movement between bitcoin and ether. Finance Research Letters 30: 221–27. [Google Scholar] [CrossRef] [Green Version]
- Khan, Nida, and Radu State. 2019. Lightning network: A comparative review of transaction fees and data analysis. In International Congress on Blockchain and Applications. Berlin and Heidelberg: Springer, pp. 11–18. [Google Scholar]
- Kim, Jae H. 2009. Automatic variance ratio test under conditional heteroskedasticity. Finance Research Letters 6: 179–85. [Google Scholar] [CrossRef]
- Kristoufek, Ladislav. 2018. On bitcoin markets (in) efficiency and its evolution. Physica A: Statistical Mechanics and Its Applications 503: 257–62. [Google Scholar] [CrossRef]
- Kumhof, Michael, and Clare Noone. 2018. Central Bank Digital Currencies-Design Principles and Balance Sheet Implications. London: Bank of England. [Google Scholar]
- Latora, Vito, and Massimo Marchiori. 2001. Efficient behavior of small-world networks. Physical Review Letters 87: 198701. [Google Scholar] [CrossRef] [PubMed] [Green Version]
- Latora, Vito, and Massimo Marchiori. 2003. Economic small-world behavior in weighted networks. The European Physical Journal B-Condensed Matter and Complex Systems 32: 249–63. [Google Scholar] [CrossRef] [Green Version]
- Lee, Timothy. 2018. Bitcoin’s Transaction Fee Crisis is Over-For Now. Available online: https://arstechnica.com/tech-policy/2018/02/bitcoins-transaction-fee-crisis-is-over-for-now/ (accessed on 5 April 2019).
- Lo, Andrew W., and A. Craig MacKinlay. 1988. Stock market prices do not follow random walks: Evidence from a simple specification test. The Review of Financial Studies 1: 41–66. [Google Scholar] [CrossRef]
- Lütkepohl, Helmut. 2005. New Introduction to Multiple Time Series Analysis. Berlin and Heidelberg: Springer. [Google Scholar]
- Martinazzi, Stefano, and Andrea Flori. 2020. The evolving topology of the lightning network: Centralization, efficiency, robustness, synchronization, and anonymity. PLoS ONE 15: e0225966. [Google Scholar] [CrossRef] [PubMed]
- Miller, Andrew, Iddo Bentov, Surya Bakshi, Ranjit Kumaresan, and Patrick McCorry. 2019. Sprites and state channels: Payment networks that go faster than lightning. In International Conference on Financial Cryptography and Data Security. Berlin and Heidelberg: Springer, pp. 508–26. [Google Scholar]
- Nadarajah, Saralees, and Jeffrey Chu. 2017. On the inefficiency of bitcoin. Economics Letters 150: 6–9. [Google Scholar] [CrossRef] [Green Version]
- Noldus, Rogier, and Piet Van Mieghem. 2015. Assortativity in complex networks. Journal of Complex Networks 3: 507–42. [Google Scholar] [CrossRef] [Green Version]
- Nowostawski, Mariusz, and Jardar Tøn. 2019. Evaluating methods for the identification of off-chain transactions in the lightning network. Applied Sciences 9: 2519. [Google Scholar] [CrossRef] [Green Version]
- Peng, C.-K., Sergey V. Buldyrev, Shlomo Havlin, Michael Simons, H. Eugene Stanley, and Ary L. Goldberger. 1994. Mosaic organization of dna nucleotides. Physical Review e 49: 1685. [Google Scholar] [CrossRef] [Green Version]
- Peng, C.-K., Shlomo Havlin, H. Eugene Stanley, and Ary L. Goldberger. 1995. Quantification of scaling exponents and crossover phenomena in nonstationary heartbeat time series. Chaos: An Interdisciplinary Journal of Nonlinear Science 5: 82–87. [Google Scholar] [CrossRef]
- Phillip, Andrew, Jennifer Chan, and Shelton Peiris. 2019. On long memory effects in the volatility measure of cryptocurrencies. Finance Research Letters 28: 95–100. [Google Scholar] [CrossRef]
- Phillip, Andrew, Jennifer SK Chan, and Shelton Peiris. 2018. A new look at cryptocurrencies. Economics Letters 163: 6–9. [Google Scholar] [CrossRef]
- Pieters, Gina, and Sofia Vivanco. 2017. Financial regulations and price inconsistencies across bitcoin markets. Information Economics and Policy 39: 1–14. [Google Scholar] [CrossRef] [Green Version]
- Polasik, Michal, Anna Iwona Piotrowska, Tomasz Piotr Wisniewski, Radoslaw Kotkowski, and Geoffrey Lightfoot. 2015. Price fluctuations and the use of bitcoin: An empirical inquiry. International Journal of Electronic Commerce 20: 9–49. [Google Scholar] [CrossRef] [Green Version]
- Poon, Joseph, and Thaddeus Dryja. 2016. The Bitcoin Lightning Network: Scalable Off-Chain Instant Payments. Available online: https://0-scholar-google-com.brum.beds.ac.uk/scholar?q=The+bitcoin+lightning+network:+Scalable+off-chain+instant+payments&hl=zh-CN&as_sdt=0&as_vis=1&oi=scholart (accessed on 1 October 2020).
- Puliga, Michelangelo, Andrea Flori, Giuseppe Pappalardo, Alessandro Chessa, and Fabio Pammolli. 2016. The accounting network: How financial institutions react to systemic crisis. PLoS ONE 11: e0162855. [Google Scholar] [CrossRef] [PubMed] [Green Version]
- Raimundo, Júnior, Gerson de Souza, Rafael Baptista Palazzi, Ricardo de Souza Tavares, and Marcelo Cabus Klotzle. 2020. Market stress and herding: A new approach to the cryptocurrency market. Journal of Behavioral Finance, 1–15. [Google Scholar] [CrossRef]
- Selgin, George. 2015. Synthetic commodity money. Journal of Financial Stability 17: 92–99. [Google Scholar] [CrossRef]
- Spelta, Alessandro, Andrea Flori, and Fabio Pammolli. 2018. Investment communities: Behavioral attitudes and economic dynamics. Social Networks 55: 170–88. [Google Scholar] [CrossRef]
- Spelta, Alessandro, Andrea Flori, Nicolò Pecora, Sergey Buldyrev, and Fabio Pammolli. 2020. A behavioral approach to instability pathways in financial markets. Nature Communications 11: 1–9. [Google Scholar] [CrossRef] [Green Version]
- Takaishi, Tetsuya. 2018. Statistical properties and multifractality of bitcoin. Physica A: Statistical Mechanics and Its Applications 506: 507–19. [Google Scholar] [CrossRef] [Green Version]
- Tiwari, Aviral Kumar, Rabin K. Jana, Debojyoti Das, and David Roubaud. 2018. Informational efficiency of bitcoin—An extension. Economics Letters 163: 106–9. [Google Scholar] [CrossRef]
- Toda, Hiro Y., and Taku Yamamoto. 1995. Statistical inference in vector autoregressions with possibly integrated processes. Journal of Econometrics 66: 225–50. [Google Scholar] [CrossRef]
- Urquhart, Andrew. 2016. The inefficiency of bitcoin. Economics Letters 148: 80–82. [Google Scholar] [CrossRef]
- Urquhart, Andrew. 2018. What causes the attention of bitcoin? Economics Letters 166: 40–44. [Google Scholar] [CrossRef] [Green Version]
- Vidal-Tomás, David, Ana M. Ibáñez, and José E. Farinós. 2019. Herding in the cryptocurrency market: Cssd and csad approaches. Finance Research Letters 30: 181–86. [Google Scholar] [CrossRef]
- Wald, Abraham, and Jacob Wolfowitz. 1940. On a test whether two samples are from the same population. The Annals of Mathematical Statistics 11: 147–62. [Google Scholar] [CrossRef]
- Weber, Beat. 2016. Bitcoin and the legitimacy crisis of money. Cambridge Journal of Economics 40: 17–41. [Google Scholar] [CrossRef]
- Yermack, David. 2015. Is bitcoin a real currency? an economic appraisal. In Handbook of Digital Currency. Amsterdam: Elsevier, pp. 31–43. [Google Scholar]
- Yermack, David. 2017. Corporate governance and blockchains. Review of Finance 21: 7–31. [Google Scholar] [CrossRef] [Green Version]
- Zhang, Wei, Pengfei Wang, Xiao Li, and Dehua Shen. 2018. Some stylized facts of the cryptocurrency market. Applied Economics 50: 5950–65. [Google Scholar] [CrossRef]
Figure 1.
Representation of different options for a multi-hop transaction. Circles represent users’ nodes while the bi-directional channels are represented with arrows in both directions.
Figure 1.
Representation of different options for a multi-hop transaction. Circles represent users’ nodes while the bi-directional channels are represented with arrows in both directions.

Figure 2.
Visual representation of the LN. The plot on the left refers to 2018/02/12, while the one on the right to 2020/08/12.
Figure 2.
Visual representation of the LN. The plot on the left refers to 2018/02/12, while the one on the right to 2020/08/12.

Figure 3.
Evolution of LN’s normalized efficiency. The plot exhibits the evolution of LN’s global normalized efficiency (in light blue), its density (in black) multiplied by 10, and the median capacity installed on its channels (in red). Both density and efficiency can assume values between 0 and 1. The y-axis on the left is related to the density and efficiency measures, while the one on the right is related to the median capacity expressed in USD.

Figure 4.
DFA exponent time evolution. The plot exhibits the DFA exponent (Peng et al. 1994, 1995) for returns (in green) and volatility (in blue). Estimates consider sliding windows of 250 daily observations and one datapoint step forward. The shadow area refers to the standard error of the corresponding coefficient. The log of Bitcoin prices (divided by ) is reported in gray. The dotted red line stands for the 0.5 level of the DFA exponent.

Table 1.
A collection of topological measures for LN. This table presents some topological measures extrapolated from the network at its first and last observation in our sample period.
Table 1.
A collection of topological measures for LN. This table presents some topological measures extrapolated from the network at its first and last observation in our sample period.
| 12 February 2018 | 12 August 2020 | |
|---|---|---|
| Nodes | 538 | 7916 |
| Channels | 1985 | |
| Density | ||
| Median Degree | 2 | 3 |
| Average Degree | ||
| Median Strength(USD) | ||
| Average Strength (USD) | ||
| Average Capacity (USD) | ||
| Median Capacity (USD) | ||
| Total Capacity (USD) | ||
| Assortativity | ||
| Assortativity (W) | ||
| Diameter | 6 | 12 |
| Radius (LCC) | 4 | 6 |
| Transitivity (W) | ||
| Global Efficiency Norm |
Table 2.
Bitcoin market ffficiency conditions. Table reports p-values for the following tests: the Runs Test (Wald and Wolfowitz 1940), the Bartels Test (Bartels 1982), the BDS Test (Broock et al. 1996), the Automatic Portmanteau Test (Escanciano and Lobato 2009), the AVR Test (Choi 1999; Kim 2009; Lo and MacKinlay 1988), and the DL Test (Domínguez and Lobato 2003). For BDS the table reports the average p-values across specifications with embedding dimensions from 2 to 5; for the AVR test we compute 500 bootstrap iterations; for DL the table reports both the wild-bootstrap p-values of the Cramer von Mises test statistic (cp) and of the Kolmogorov-Smirnov test statistic (kp). Panel A refers to Bitcoin returns, while Panel B reports the results for the corresponding volatility computed as the absolute value of the returns (i.e., |returns|).
| PANEL A | |||||||
| Period | Runs Test | Bartels Test | BDS Test | Automatic Portmanteau Test | AVR Test | DL (cp) Test | DL (kp) Test |
| 2015/01/01–2015/12/31 | 0.00053 | 0.00005 | 0.00000 | 0.10644 | 0.35000 | 0.00000 | |
| 2016/01/01–2016/12/31 | 0.01605 | 0.00016 | 0.00000 | 0.08296 | 0.04800 | 0.00000 | 0.00000 |
| 2017/01/01–2017/12/31 | 0.00164 | 0.00000 | 0.00000 | 0.00041 | 0.00000 | 0.00000 | 0.00000 |
| 2018/01/01–2018/12/31 | 0.07434 | 0.00070 | 0.00000 | 0.02037 | 0.01400 | 0.00000 | 0.00000 |
| 2019/01/01–2019/12/31 | 0.00078 | 0.00000 | 0.00148 | 0.00033 | 0.00800 | 0.00000 | 0.00000 |
| 2018/02/12–2020/08/12 | 0.00002 | 0.00000 | 0.00000 | 0.00002 | 0.00200 | 0.00000 | 0.00000 |
| 2015/01/01–2020/08/12 | 0.00000 | 0.00000 | 0.00000 | 0.00000 | 0.00000 | 0.00000 | 0.00000 |
| PANEL B | |||||||
| Period | Runs Test | Bartels Test | BDS Test | Automatic Portmanteau Test | AVR Test | DL (cp) Test | DL (kp) Test |
| 2015/01/01–2015/12/31 | 0.00036 | 0.00000 | 0.00000 | 0.00000 | 0.00000 | 0.00000 | 0.00000 |
| 2016/01/01–2016/12/31 | 0.02127 | 0.00001 | 0.00000 | 0.00055 | 0.00000 | 0.00000 | 0.00000 |
| 2017/01/01–2017/12/31 | 0.00016 | 0.00000 | 0.00037 | 0.00000 | 0.00000 | 0.00000 | 0.00000 |
| 2018/01/01–2018/12/31 | 0.00000 | 0.00000 | 0.00081 | 0.00000 | 0.00000 | 0.00000 | 0.00000 |
| 2019/01/01–2019/12/31 | 0.00016 | 0.00000 | 0.03740 | 0.00092 | 0.00000 | 0.00000 | 0.00000 |
| 2018/02/12–2020/08/12 | 0.00000 | 0.00000 | 0.00009 | 0.00000 | 0.00000 | 0.00000 | 0.00000 |
| 2015/01/01–2020/08/12 | 0.00000 | 0.00000 | 0.00000 | 0.00000 | 0.00000 | 0.00000 | 0.00000 |
Table 3.
Testing for granger-causality. The table reports the results of the Toda–Yamamoto test (Toda and Yamamoto 1995). In Panel A we test whether column variables Granger-cause the row variable, while the opposite for Panel B.
Table 3.
Testing for granger-causality. The table reports the results of the Toda–Yamamoto test (Toda and Yamamoto 1995). In Panel A we test whether column variables Granger-cause the row variable, while the opposite for Panel B.
| Panel A: Column G-Causes Row | BTC Alpha | BTC Vol Alpha | BTC Price | BTC Returns | |
| LN efficiency | statistics | 5.50 | 0.70 | 1.70 | 1.60 |
| p-value | 0.36 | 0.98 | 0.42 | 0.46 | |
| Panel B: Row G-Causes Column | BTC Alpha | BTC Vol Alpha | BTC Price | BTC Returns | |
| LN efficiency | statistics | 7.40 | 2.90 | 0.41 | 0.31 |
| p-value | 0.19 | 0.72 | 0.81 | 0.86 |
Table 4.
Testing for the Granger-causality relationship: BTC returns vs. LN configuration. The table reports the results of the Toda–Yamamoto test (Toda and Yamamoto 1995) in which BTC returns are tested to verify whether they Granger-cause a list of topological indicators for the LN (reported in column). These topological indicators refer to respectively: the assortativity, the density, the transitivity, the median value of the nodes’ strength, and the median capacity of the edges.
| Row G-Causes Column | Assortativity | Density | Transitivity | Median Strength | Median Capacity | |
|---|---|---|---|---|---|---|
| BTC returns | statistics | 0.17 | 0.96 | 3.10 | 0.69 | 4.70 |
| p-value | 0.68 | 0.33 | 0.21 | 0.41 | 0.03 |
Publisher’s Note: MDPI stays neutral with regard to jurisdictional claims in published maps and institutional affiliations. |
© 2020 by the authors. Licensee MDPI, Basel, Switzerland. This article is an open access article distributed under the terms and conditions of the Creative Commons Attribution (CC BY) license (http://creativecommons.org/licenses/by/4.0/).
Share and Cite
MDPI and ACS Style
Martinazzi, S.; Regoli, D.; Flori, A. A Tale of Two Layers: The Mutual Relationship between Bitcoin and Lightning Network. Risks 2020, 8, 129. https://0-doi-org.brum.beds.ac.uk/10.3390/risks8040129
AMA Style
Martinazzi S, Regoli D, Flori A. A Tale of Two Layers: The Mutual Relationship between Bitcoin and Lightning Network. Risks. 2020; 8(4):129. https://0-doi-org.brum.beds.ac.uk/10.3390/risks8040129
Chicago/Turabian StyleMartinazzi, Stefano, Daniele Regoli, and Andrea Flori. 2020. "A Tale of Two Layers: The Mutual Relationship between Bitcoin and Lightning Network" Risks 8, no. 4: 129. https://0-doi-org.brum.beds.ac.uk/10.3390/risks8040129
Note that from the first issue of 2016, this journal uses article numbers instead of page numbers. See further details here.