VNF Chaining Performance Characterization under Multi-Feature and Oversubscription Using SR-IOV


1
École de Technologie Supérieure (ÉTS), Université du Québec, Montreal, QC H3C 1K3, Canada
2
Cisco Systems, Ottawa, ON K2K 3E8, Canada
3
Cisco Systems, San Jose, CA 95134, USA
*
Author to whom correspondence should be addressed.
Informatics 2020, 7(3), 33; https://0-doi-org.brum.beds.ac.uk/10.3390/informatics7030033
Submission received: 2 August 2020
/
Revised: 10 September 2020
/
Accepted: 11 September 2020
/
Published: 14 September 2020
(This article belongs to the Special Issue The Future of Network Softwarization: A Network Function Virtualization Approach)
Abstract
:Network Function Virtualization (NFV) has revolutionized the way network services are offered, leading Enterprise and Service Providers to increasingly adapt their portfolio of network products in order to reap the benefits of flexible network service deployment and cost reduction promises. With this method, network services are offered in the form of software images instead of dedicated hardware. However, NFV presents several challenges, including standard networking challenges (e.g., security, resilience, and availability), management and orchestration challenges, resource allocation challenges, and performance trade-off challenges of using standard x86 servers instead of dedicated and proprietary hardware. The first three challenges are typical challenges found in virtualization environments and have been extensively addressed in the literature. However, the performance trade-off challenge can be the most impactful when offering networking services, negatively affecting the throughput and delay performance achieved. Thus, in this paper, we investigate and propose several configurations on a virtualized system for increasing the performance in terms of throughput and delay while chaining multiple virtual network functions (VNFs) in case of an undersubscribed and oversubscribed system, where the resource demands exceeds the physical resource capacity. Specifically, we use the Single Root Input Output Virtualization (SR-IOV) as our Input/Output (I/O) technology, and analyze the attainable throughput and delay when running multiple chained VNFs in a standard x86 server under various resource footprints and network features configurations. We show that the system throughput and delay in a multi-chained environment, offering multiple features, and under oversubscription can affect the overall performance of VNFs.
1. Introduction
Over the last decade, there has been a shift toward software-centric solutions in the space of network technologies. The key-enabled component that facilitates this shift is virtualization. Network functionalities could not escape this trend, introducing the concept of Network Function Virtualization (NFV). By its definition [1], NFV abstracts the network functionalities from the underlying dedicated and expensive hardware and offers them as software-images called Virtualized Network Functions (VNFs). The main advantage of such an approach is that networking functions can now be provisioned as typical Virtual Machines (VMs) or Containers on top of custom-off-the-shelf (COTS) x86 servers. This approach promotes significant cost reductions, network agility, and increased operational efficiency.
Another term interwoven with NFV is Service Function Chaining (SFC). Often, in order to offer complete network services, several ordered and interconnected VNFs need to be applied to the traffic stream [2]. For example, for a Security Service, we may first use a Firewall (FW), followed by an Intrusion Detection System (IDS), before applying a Network Address Translation (NAT) and a routing functionality to let the traffic enter into a private network or a data center. In the above example, the FW, IDS, NAT, and routing may be four VNFs interconnected with a specific order and offer exactly a security SFC.
However, when adopting the NFV and SFC concepts, major performance drawbacks may arise. For instance, when buying and installing a router, the performance characteristics of the device and under which conditions we may attain the specific performance is published by the equipment vendor. In contrast, when offering the routing functionalities through a VM on a generic x86 server, the performance may vary significantly from the dedicated hardware. The number of VMs running on the server, the number of network features running as software processes inside a VM, the resource configuration of the VMs, the Input Output (I/O) path, and the internal chaining of the VNFs are all examples influencing the overall performance. These set of possible configurations in a virtualized system can significantly affect the performance, and thus we aim to find the best combination among them in order to maximize Key Performance Indicators (KPIs) such as throughput and delay.
Nonetheless, the benefits of using NFV, usually exceeds a possible performance reduction. The ability to consolidate multiple VNFs on a same hardware component instead of acquiring multiple expensive middleboxes can bring unique advantages in terms of capital and operational costs, hardware components used, and network configuration optimization. Usually, the number of VMs, and thus VNFs, running on the same server is limited by the number of available hardware resources. This is a typical constraint when allocating VNFs on top of a server, where the amount of requested virtual resources cannot exceed the available physical resources of the hardware. This approach is referred to as an undersubcription scenario. Yet, to satisfy the greedy behavior of resource voracious networking functions an oversubscription of the resources may be targeted. This approach can create new but unexplored opportunities in terms of trade off between cost reduction and attained performance. Towards this end, another research direction that we try to address is to investigate when oversubscription is beneficial for offering virtualized network services in terms of performance and cost reduction.
In particular, in this paper we try to quantify the impact on the performance in terms of throughput and delay, when scaling the resources of a standard x86 server by incrementally provisioning a large number of VNFs and SFCs and using the Single-Root Input Output Virtualization (SR-IOV) [3] as our I/O path technology. SR-IOV is one of the most performant I/O solution, which allows bypassing many performance bottlenecks in a standard x86 server. Hence, we analyze the performance achieved under three axes of VNF deployment: (i) Chained VNFs vs un-chained VNFs (i.e., by chaining the VNFs of a SFC internally in a server or not), (ii) Single-Feature VM vs Multi-Feature VM (i.e., if there is a single or multiple network features running inside the VM), and (iii) undersubscription vs. oversubscription (as described in the previous paragraph). The key contributions of this paper are summarized as follows:
- We perform a horizontal-scale analysis, where multiple VNFs (chained and non-chained) are contenting for the server’s hardware resources by placing I/O and vCPUs demands on the hypervisor scheduler.
- We assess the performance of multi-feature VMs. In such an environment, multiple network features (e.g., FW, NAT, etc.) are activated in the same VM, thus stressing the performance and resource consumption in a different way to single-feature VM tests.
- We study the impact of running multiple chained and not-chained VNFs (up to 40 VMs) by oversubscribing the x86 server by a factor of 4 (e.g., generate a demand of 80 virtual CPU cores in a server with an available capacity of 20 physical CPU cores).
- We use a commercially available VNF software (Cisco Cloud Services Router 1000V (CSR 1000v) [4]) in order to give extra credibility in our results.
The remainder of the paper is organized as follows. Section 2 provides an overview of the related work. Section 3 provides insights on the VNF deployment configuration options and test methodology. The performance evaluation along with a discussion of the results are presented in Section 4. Finally, Section 5 summarizes the paper.
2. Related Work
For the optimization of the VNF performance, appropriate hardware and software solutions can be applied. Regarding hardware solutions, the most common way to accelerate packet processing and to increase throughput performance is by using Field Programmable Gate Arrays (FPGAs) [5,6]. However, employing additional hardware to the server will add extra costs and break the COTS nature, by not using generic x86 servers anymore. This is in contrast with the aim of NFV that promises relevant cost reductions, while using generic and no specialized x86 server. Thus, in this section and in this paper, we emphasize software-based solutions that can guarantee high performance without additional costs. We categorize these solutions according to the three axes of the VNF deployment presented above, while we also show the impact of the I/O technology used, to justify the selection of SR-IOV as our principal I/O architecture.
Regarding the number of network features running inside a VM and the impact on the performance, authors in [7] showed that VMs with multi-feature deployment can significant reduce the throughput performance compared to single-feature VMs. The impact becomes even larger for processing intensive features, such as IP Security (IPSec), which can negatively affect the performance of the rest features residing on the same VM. Similarly, when comparing the performance of a VM running a typical IPv4 forwarding with a multi-feature VM running at the same time a NAT, a Firewall, a Quality of Service (QoS), and a Deep Packet Inspection (DPI), the performance is always reduced for the multi-feature approach, regardless the packet size and I/O technology used [8,9]. The authors in [10] analyze the performance of different types of VNFs, such as IP Multimedia System (IMS) and two versions of Intrusion Detection (IDS); however, they did not provide a comparison between single and multi-feature deployment but only emphasize the impact of the CPU allocation on either single or multi-feature VM deployments.
The I/O path between the VNFs and the physical Network Interfaces Cards (NICs) of the server can be an additional performance bottleneck. Actually, there is a vast number of works that try to quantify the performance when using various I/O architectures. For example, an extensive comparisons between Open vSwitch (OVS), OVS with Data Plane Deployment Kit (DPDK), Fast Data Input Output Vector Packet Processing (FD.io VPP) and SR-IOV are presented in [8,9]. The authors prove that SR-IOV can maximize the attained performance since it can eliminate the adverse impact of the vSwitch and the hypervisor. SnabbSwitch [11] is an alternative virtual switch that can be used. When compared with other I/O techniques such as SR-IOV, Virtual Function input/output (VFIO), OVS, OVS-DPDK and linux bridges, it was found that SnabbSwitch can achieve a similar performance to VFIO and SR-IOV while out-performing the rest of the I/O techniques. In general, SR-IOV is always proved to be the best I/O architecture even when compared to paravirtualized NIC drivers [12] or used with Linux New API (NAPI) drivers optimizations [13]. Another approach, Packet Aggregration Flow (PA-Flow), was proposed in [14], where similar to FD.io VPP, it encapsulates multiple packets destined for a VNF, in order to increase the throughput performance. However, the authors do not provide a comparative analysis with other existing I/O techniques. Three I/O technologies were analyzed in [15], namely the NAPI, Netmap, and OVS-DPDK. Results revealed that OVS-DPDK could provide a good combination of performance and functionality. All the above works demonstrate different I/O techniques for unchained VNFs. However, the majority of them acknowledge that SR-IOV is one of the best solution for maximizing the throughput performance. This is the reason that we selected this I/O architecture for our performance analysis scenario.
With respect to chained VNFs, there are not many studies on SFC performance analysis and especially for SR-IOV. Some works were found, using however the OVS, DPDK, and FD.io VPP alternatives. For example, the authors in [16,17] investigate the performance when two VNFs are chained together for different packet sizes and when using FD.io VPP and OVS-DPDK. A similar work presented in [18] and later in [19] explore the efficiency of Linux bridges, OVS-DPDK, and OVS when chaining two VNFs and using flows of different packet sizes.The impact of OVS and OVS-DPDK was also considered in [20] for both containarized and VM-based chained VNF deployments. The authors in [21,22] also tried to study the impact of a single chain in an OVS-DPDK environment. Regarding SR-IOV and VNF chaining, a comparison against OVS-DPDK is presented in in [23]. Once more the authors validated the superior performance of SR-IOV; however, only eight pairs of chained VMs were considered. A more fine-grained horizontal scale analysis using SR-IOV and chained VNFs is provided in [24]. The authors test the performance of up to 20 VMs chained by two, using different chaining techniques, and assess the internal chaining bottleneck. However, they do not consider multi-feature deployment.
Finally, the only work found in the literature that studied the impact of oversubscription is [25]. The authors employed SR-IOV and DPDK I/O technologies and concluded that the oversubscription can have a negative impact on the overall performance in terms of throughput, latency, and jitter. However, the authors did not consider any chaining scenarios, and they only consider single-feature VNFs. Furthermore, most of the approaches presented above concentrate on only one of the performance attributes during the VNF deployment. To the best of our knowledge, this is the first work that attempts to create a three axes search space deployment solution that considers (i) the number of VNFs running on a VM, (ii) the impact of service chaining, (iii) and the influence of the oversubscription in order to find the best trade-off regarding performance, cost, and functionality.
3. System Model
In this section, we take a closer look at the various components of our system design and the experimental configuration. We start by providing a brief overview of the SR-IOV technology, the different VNF deployment options, and the chaining configuration of the VNFs in order to create SFCs. Finally, we provide the mechanisms used to effectuate the oversubscription on a hyperthreaded virtualized system.
3.1. SR-IOV
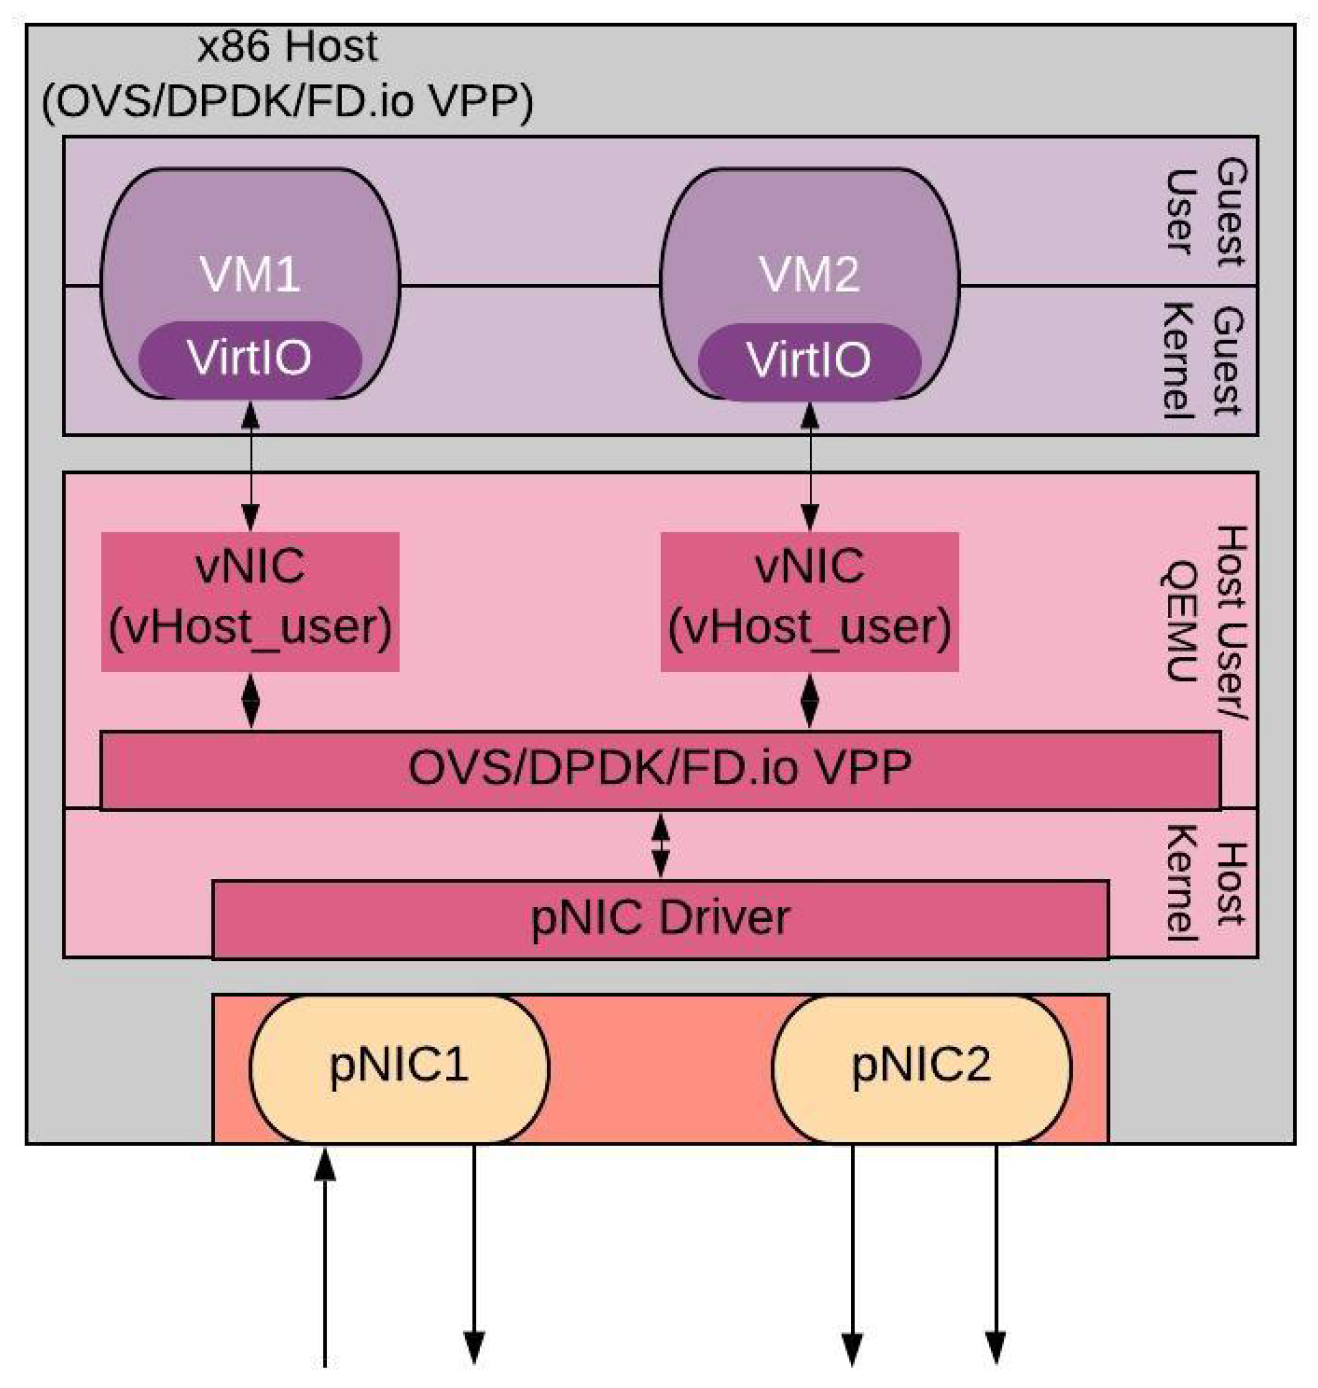
When instantiating VNFs as VMs in a typical x86 server, a communication path needs to be established between the physical NICs (pNIC) of the server and the virtualized NICs (vNIC) of the VMs where the incoming traffic needs to be delivered. Usually, a virtual switch is deployed as an intermediate bridge between the physical and the virtual components of the I/O path as shown in Figure 1. The default technology that can accomplish this communication is the Open-vSwitch (OVS). OVS is typically deployed for traditional virtualization applications, where the I/O demand can be considerably less, and where the main resource requirements are for CPU and memory. In contrast, in an NFV environment, VMs needs to process traffic continuously and thus they are characterized as I/O bound. As OVS was not implemented to efficiently switch a large number of incoming and outgoing packets, it can generate a massive performance bottleneck. Thus, as described in Section 2, alternative vswitch techniques have been recently proposed such as OVS-DPDK, FD.io VPP, etc. Even though all these new technologies can improve the throughput performance, they still rely on the hypervisor and on the physical resources of the server, requiring significant amount of CPU cycles. SR-IOV as a passthrough bypass techniques can alleviate these performance bottlenecks.
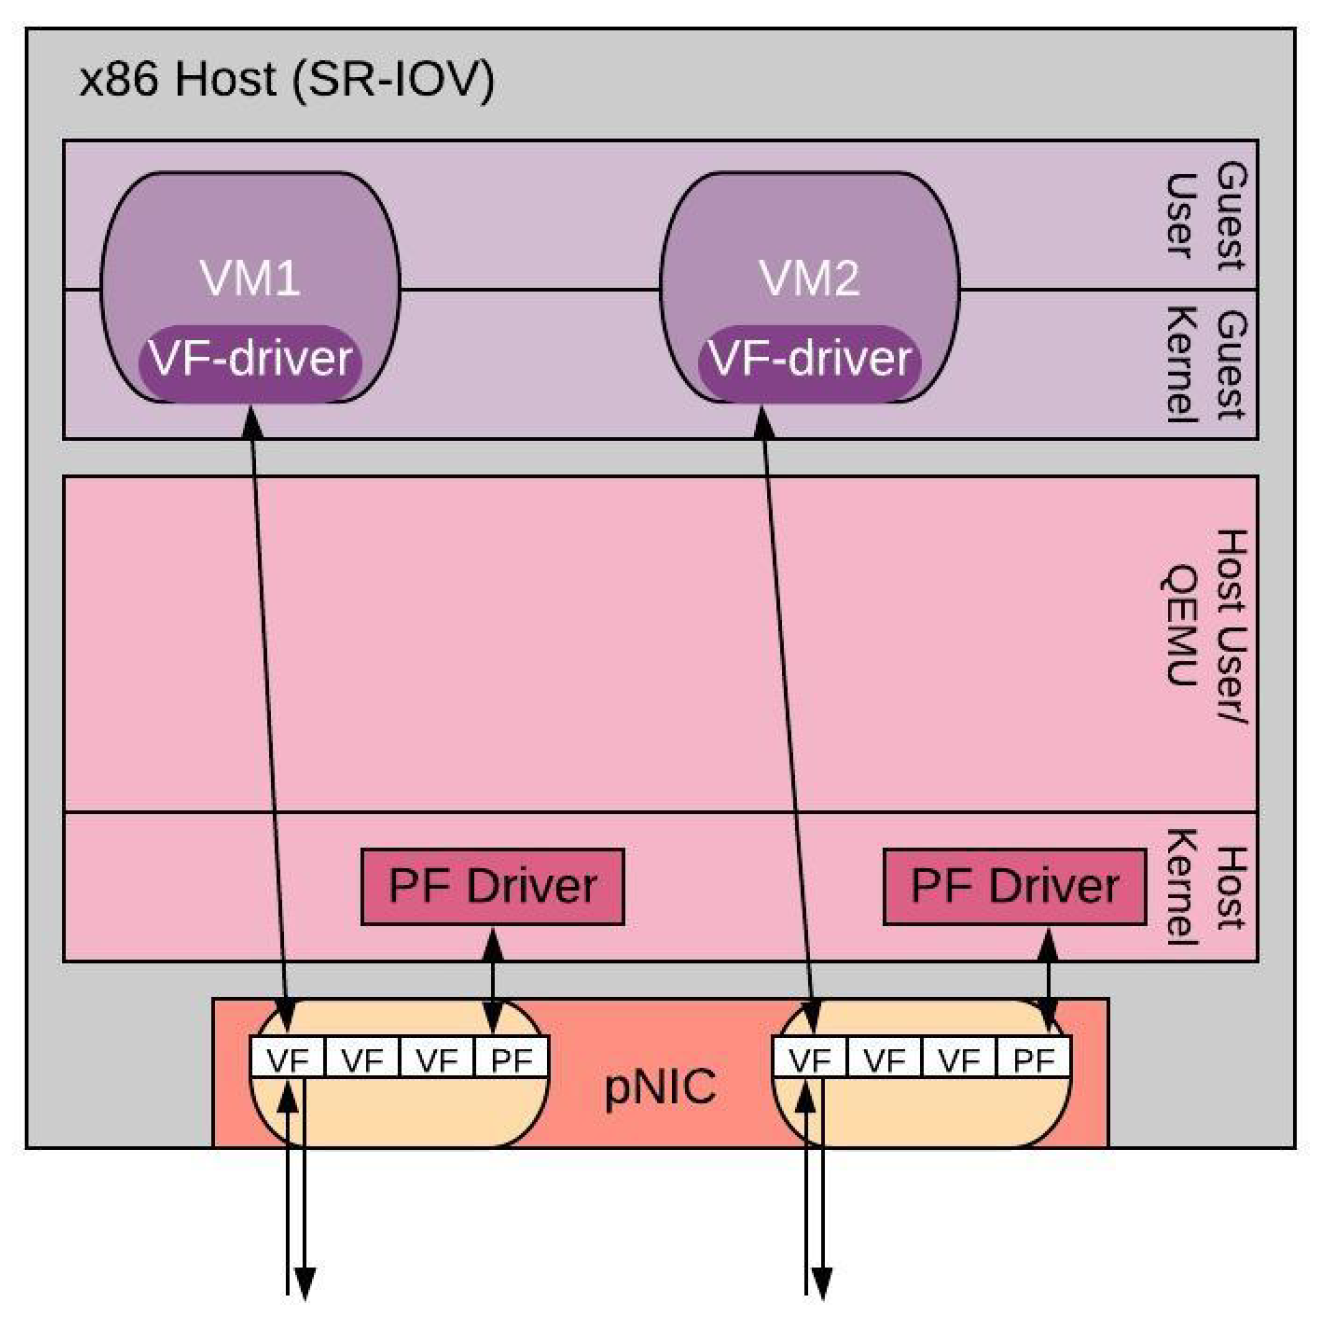
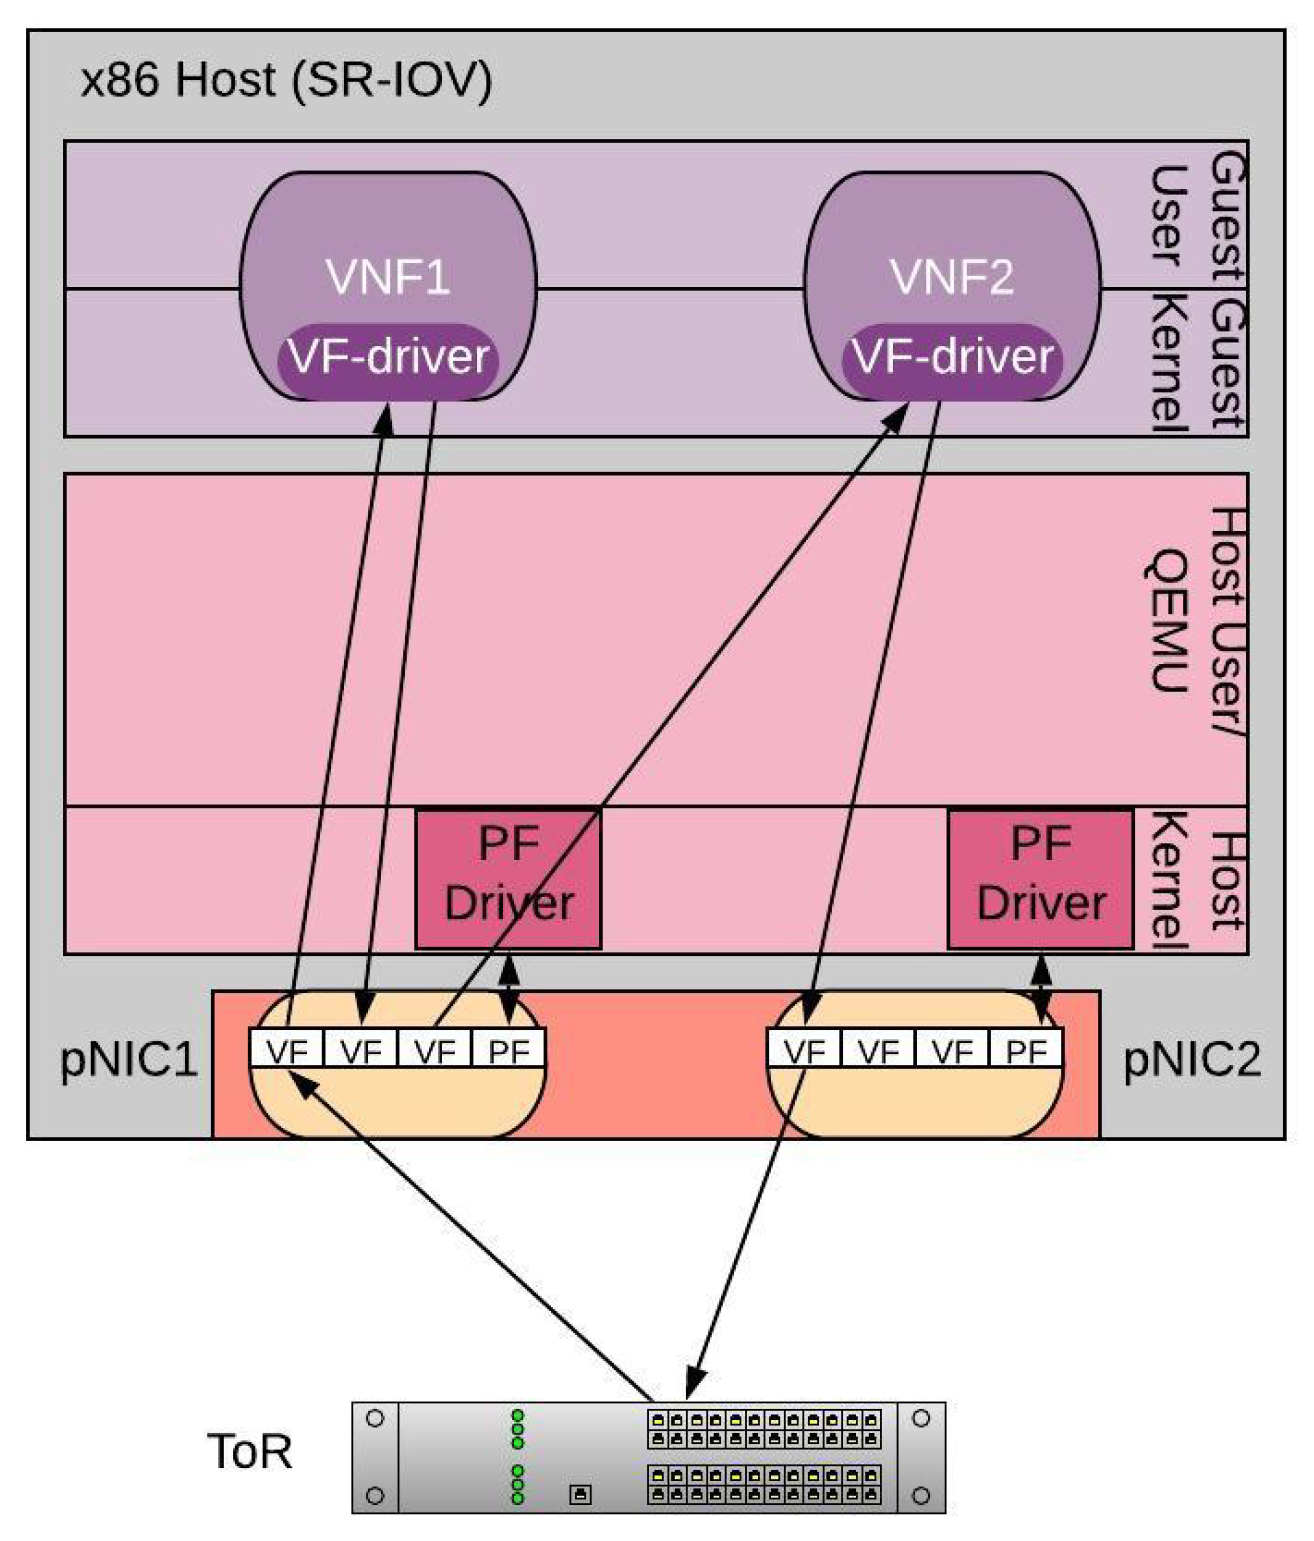
Specifically, SR-IOV is an I/O technology, standardized by the PCI-SIG group [26], with the goal of offering the necessary scalability in order to maximize the number of VMs connected to the same pNIC. This can be done by virtualizing the pNIC itself. As Figure 2 illustrates, a pNIC can be distinguished into two new functions, the physical function (PF) and the virtual functions (VF). The PF can be considered to be an independent and distinct PCIe device that can be managed and configured as any other PCIe device, while the VFs can be seen as lightweight functions that do not need special resource configuration, while inheriting their functionality from the PF. Thus, each VF is a virtualized physical port associated with one PF. Their role is simply to let packets go in and out of the physical port, while they can be directly connected to a VM. This way, SR-IOV can bypass the hypervisor without the need for extra hardware resources for its operation.
Nonetheless, several limitations come with the SR-IOV as well. First of all, the pNIC needs to support the particular functionality, while secondly there is a maximum number of VFs (typically 256 VFs) that can be instantiated per pNIC. Finally, the maximum number of queue pairs can pose another limitation [27]. A special reference should be made on the VF limit. Usually, this limit of 256 VFs, cannot be reached for a VNF based deployment, since the CPU, and memory resources will be outlasted first. However, for containerized-based VNFs (CNFs), the VF limit can restrain the maximum number of CNFs instantiated, as they are much more lightweight in terms of their resource footprint requirements compared to VMs. However, since currently all VNFs in production environments are VM-based, we follow the same VM-based approach for our test methodology.
3.2. VNF Deployment
In the VM-based deployment method, network features are executed as software processes inside the VM. Nonetheless, even through most approaches consider a single feature running inside a VM, there is the possibility to run multiple features on the same VM. This creates two possible VM deployment methods (i) single-feature and (ii) multi-feature. The term feature refers to a networking configuration running inside a VM, which represent a single network function (e.g., NAT) [28].
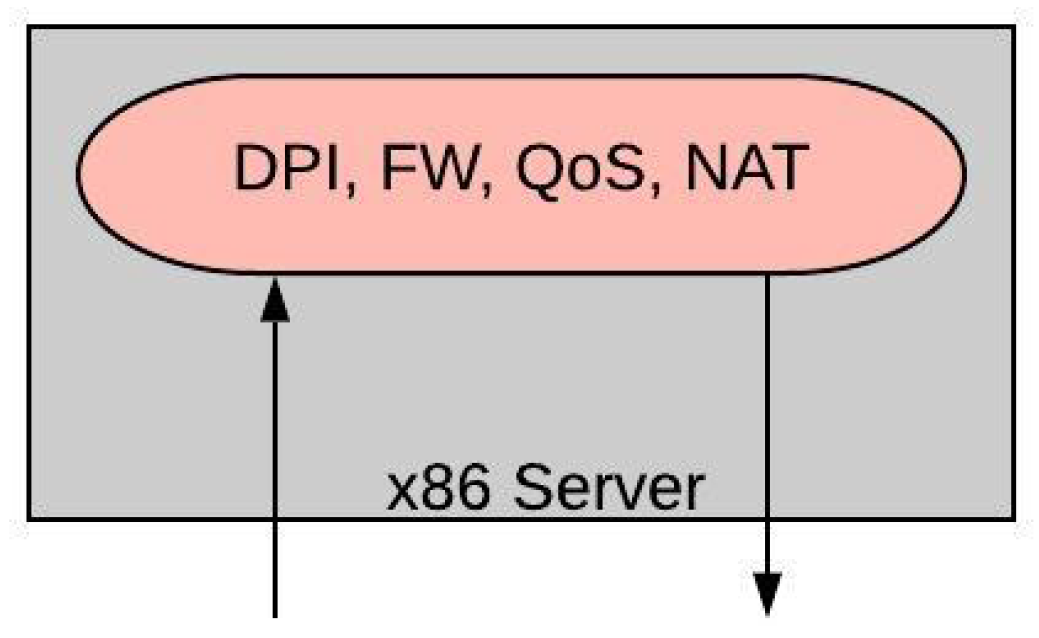
- Single-Feature: In case a single feature deployment is followed, within each VM a single type of network feature can be found. This is the simplest way to deploy VNFs. However, when a SFC needs to be instantiated each VNF needs to be deployed in a separate VM. This means that a logical network will also be created connecting the different VMs. An illustrative example of this deployment model is shown in Figure 3. Herein, we have 4 VNFs, namely a DPI followed by a FW and a QoS, while terminating at a NAT. The chaining of the VNFs can be done internally in the server (i.e., DPI → FW and QoS → NAT), or between two or more servers (i.e., FW → QoS).
- Multi-Feature: In a multi-feature deployment, within each VM multiple network features can be executed as software processes. This creates a certain complexity in the operation of the VM, but if all the VNFs of the SFC can be deployed on the same VM, we can avoid creating chains or logical networks between the VNFs. Figure 4 shows the same 4 VNFs as previously; however, now with a multi-feature deployment all the VNFs can be deployed in a single VM.
Obviously, the VNF deployment method can affect the overall performance. For a single-feature deployment the operation complexity is lower since only one VNF runs inside the VM and this can positively affect the overall system performance. However, we need the deployment of logical connections to create the SFC. At the same time, a higher number of VMs is needed that can contribute in an augmentation of the deployment cost of the solution. In contrast with the multi-feature deployment, the number of VMs needed and thus the cost can be considerably reduced and at the same time no chaining is required. Nonetheless, the execution complexity is elevated, negatively affecting the overall system performance. Even though, we can intuitively extract the trade-off between cost and performance between the two deployment methods, it is very important to actually quantify it in a realistic scenario, as we are going to show in the performance evaluation section.
3.3. Chaining
As shown in the previous sub-section when deploying a SFC, a chaining technique may be required. When chaining VNFs residing on different servers (inter-server) the chaining can be effectuated using the top of the rack (ToR) switch, or several intermediate forwarding devices. However, when the chained VNFs reside on the same server an internal chaining technique (intra-server) can be employed. Following, we analyze the two chaining cases, with illustrative examples of two chained VNFs. The same techniques can be used for more than two chained VNFs. For reasons of simplicity, we concentrate on two chained VNFs.
3.3.1. PVP
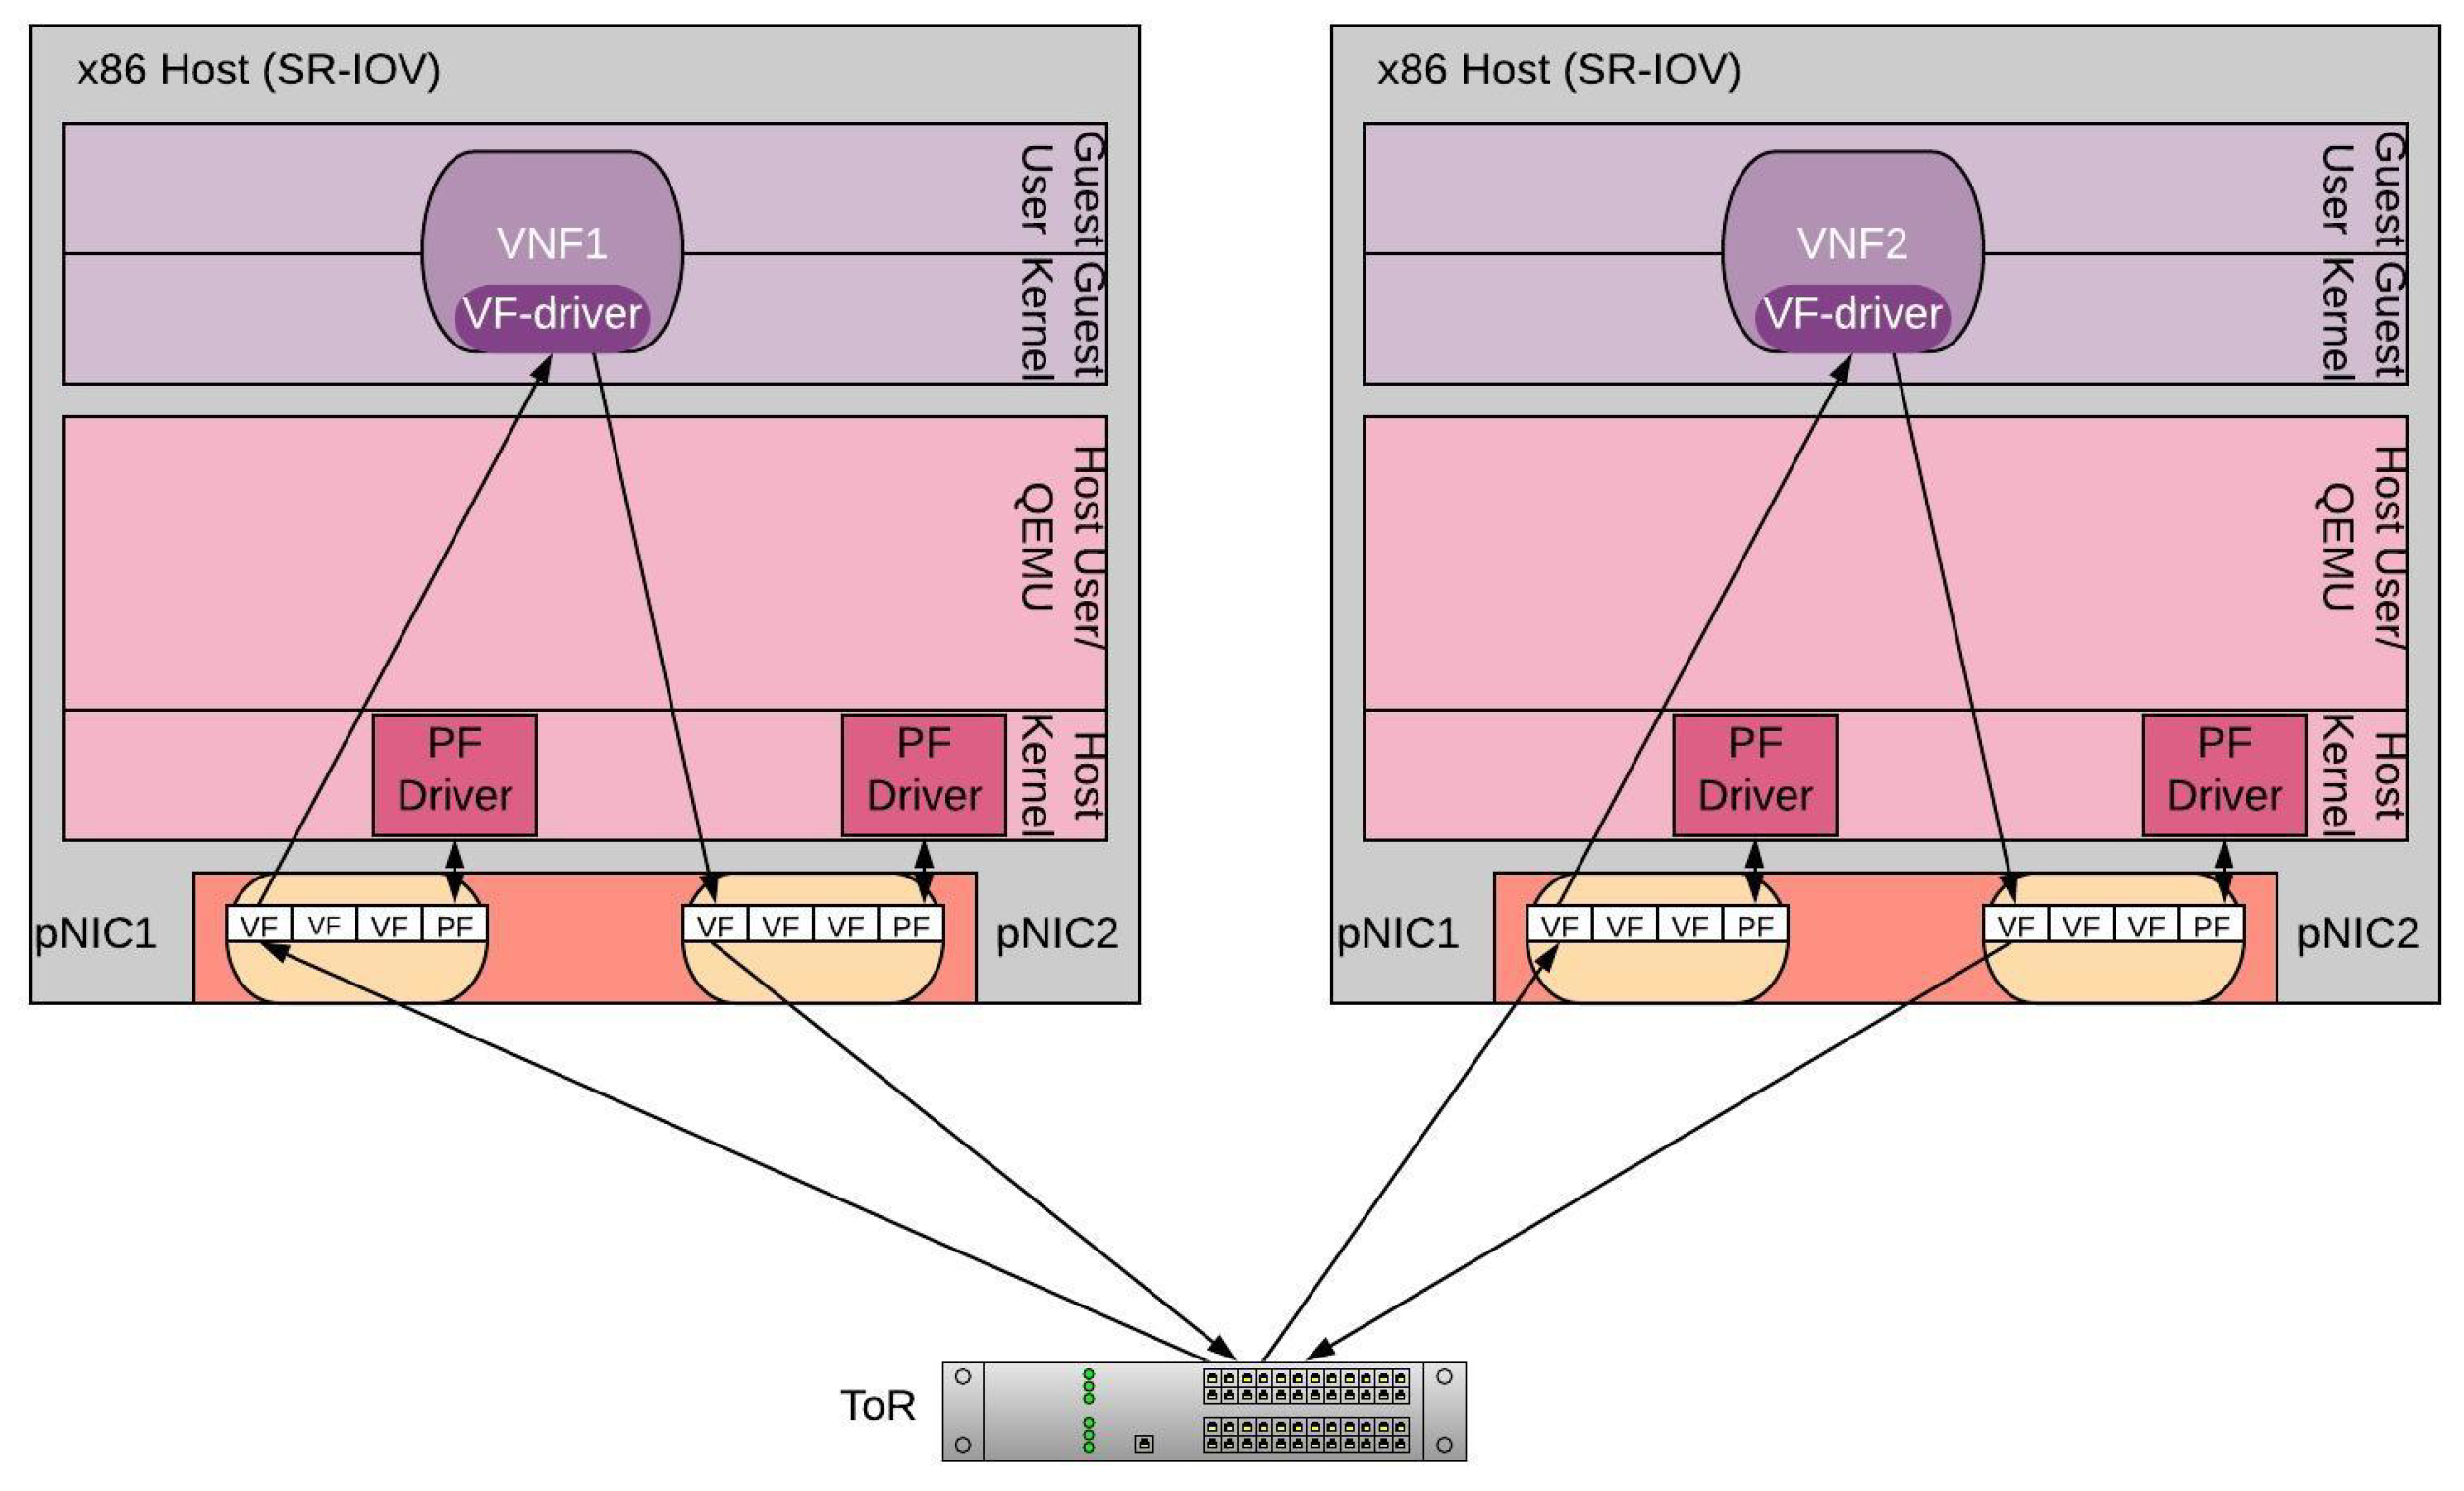
During the inter-server chaining, traffic can be seen as going in and out the VM, following a Physical-to-VM-to-Physical (PVP) path. Figure 5, shows the chaining of two VNFs that reside on different servers. The servers are connected via a ToR switch, but in reality they can be directly connected or even connected via multiple switches/routers depending the underlying infrastructure. In the particular example, incoming traffic from the switch passes to the first VNF, where it is being processed and it returns back to the ToR switch. Following, the ToR switch can forward the traffic to the second VNF. Assuming that the SR-IOV technology is used the VNFs can be directly connected to the VFs of the pNIC. One VF, belonging to pNIC1 will be used for switching the incoming traffic to the VNF and the other one, belonging to pNIC2, to forward the traffic back to the ToR Switch.
3.3.2. PVVP
In the intra-server chaining technique, the VNFs being executed in different VMs need to communicate internally, creating a Physical-to-VM-to-VM-to-Physical (PVVP) path. For the PVVP case there are two ways to create a communication path between two internally chained VNFs.
- Virtual Ethernet Bridge (VEB): VEB is entirely made on the server by creating an internal bridge between the two VMs hosting the VNFs. Examples of this bridge can be on OVS bridge, a linux bridge, or a virtual network provided by the hypervisor.
- Virtual Ethernet Port Aggregator (VEPA): In VEPA the chaining is accomplished by using the ToR switch. Specifically, the traffic after being processed by the first VNF it is returned to the ToR switch, where it is following forwarded to the second VNF. This approach is similar to creating two PVP chains on the same server.
Both approaches have pros and cons. On one hand, with VEB we do not have to involve the ToR switch twice. On the other hand, the creation of the internal bridge can add a severe performance bottleneck, since as we previously presented the OVS bridge, or native bridge functionalities where not designed for NFV purposes. Regarding VEPA, it can avoid the internal bridge; however, the traffic now has to pass four times (2 PVPs) from the physical NICs reducing the physical I/O capacity of the server into one fourth of its total capacity (assuming that our servers are equipped with two pNICs).
A detailed comparison between VEB and VEPA is provided in [24], where the authors show that VEB can present the highest performance in terms of throughput and delay, when using the VFs of the SR-IOV as an internal bridging. This way, there is no need to create an intermediate bridge, limiting the impact of the vSwitch bottleneck. Figure 6 highlights this approach in a SR-IOV I/O architecture. In the particular example, the first VF of pNIC1 is used to forward the incoming traffic into the first VNF, while the second and third VFs of pNIC1 belong to the same subnet and are used to perform the internal switching of the two VNFs. Finally, the first VF of pNIC2 is used to forward the traffic back to the ToR switch. In a multi-PVVP scenario we balance the VFs used between the two pNICs to maximize the physical capacity use.
3.4. Resource Allocation and Oversubscription
In a VM-based VNF deployment approach, it is very important to appropriately schedule the hardware resources. Usually, in a server, we may have several VMs that compete for the server’s resources (e.g., CPU, memory, storage, etc.). How many VMs, we may have on the server, it depends directly on the available hardware resources. This is a typical capacity planning problem where the total demanding virtual resources cannot exceed the available physical ones. However, even this approach, called undersubscription, can guarantee a certain performance, sometimes it is worth investigating the trade-off between cost and performance for an oversubscribed system.
3.4.1. Resource Configuration
Before analyzing the oversubscription, we present the resource configuration of an x86 server. The two main resources that can limit and impact the performance of a horizontal scaling VNF testing, are CPU and Memory.
Regarding memory, when a process requires some memory, the CPU is marking the RAM allocated to that process. The CPU allocates RAM by chunks, which are called pages. The CPU and the operating system have to remember which page belong to which process, and where it is stored. Obviously, the higher number of available pages, the longer it takes to find where the memory is mapped [29]. Most operating systems use huge pages of a default size of 4 K bytes. However, in this paper, we have created Huge pages of 1 GB size to reduce the look up time, while each VM is configured with 4 GB of RAM (4 huge pages). This is the minimum memory requirement of the VNF software that we used. Based on this configuration, we allocate 160 out of 192GB of memory for hugepages, while the rest 32 GB are reserved for the operating system and other local processes in the server. This allows us to instantiate up to 40 VMs.
As for the CPU, in order to allow oversubscription, and maximize the number of VMs in the server, the hyper-threading option is enabled. With hyper-threading, each physical core is split into two logical cores (lCPU)/threads, doubling its physical capacity. For example, in our setup we use a two-socket x86 server, with 12 physical cores in each socket, with a total of 24 physical cores. With hyper-threading enabled the OS can see 48 logical cores or threads, with 24 logical cores at each socket. Following, we present the CPU configuration and allocation for an undersubscribed and an oversubscribed system.
3.4.2. CPU Allocation
For the CPU allocation, we isolate 20 out of the 24 physical cores for the VMs, while we reserve the rest of the 4 cores for the operational system, I/O, and the hypervisor. With hyper-threading enabled, we can take advantage of the 40 logical cores. These 40 logical cores are isolated and pinned to the instantiated VMs as follows:
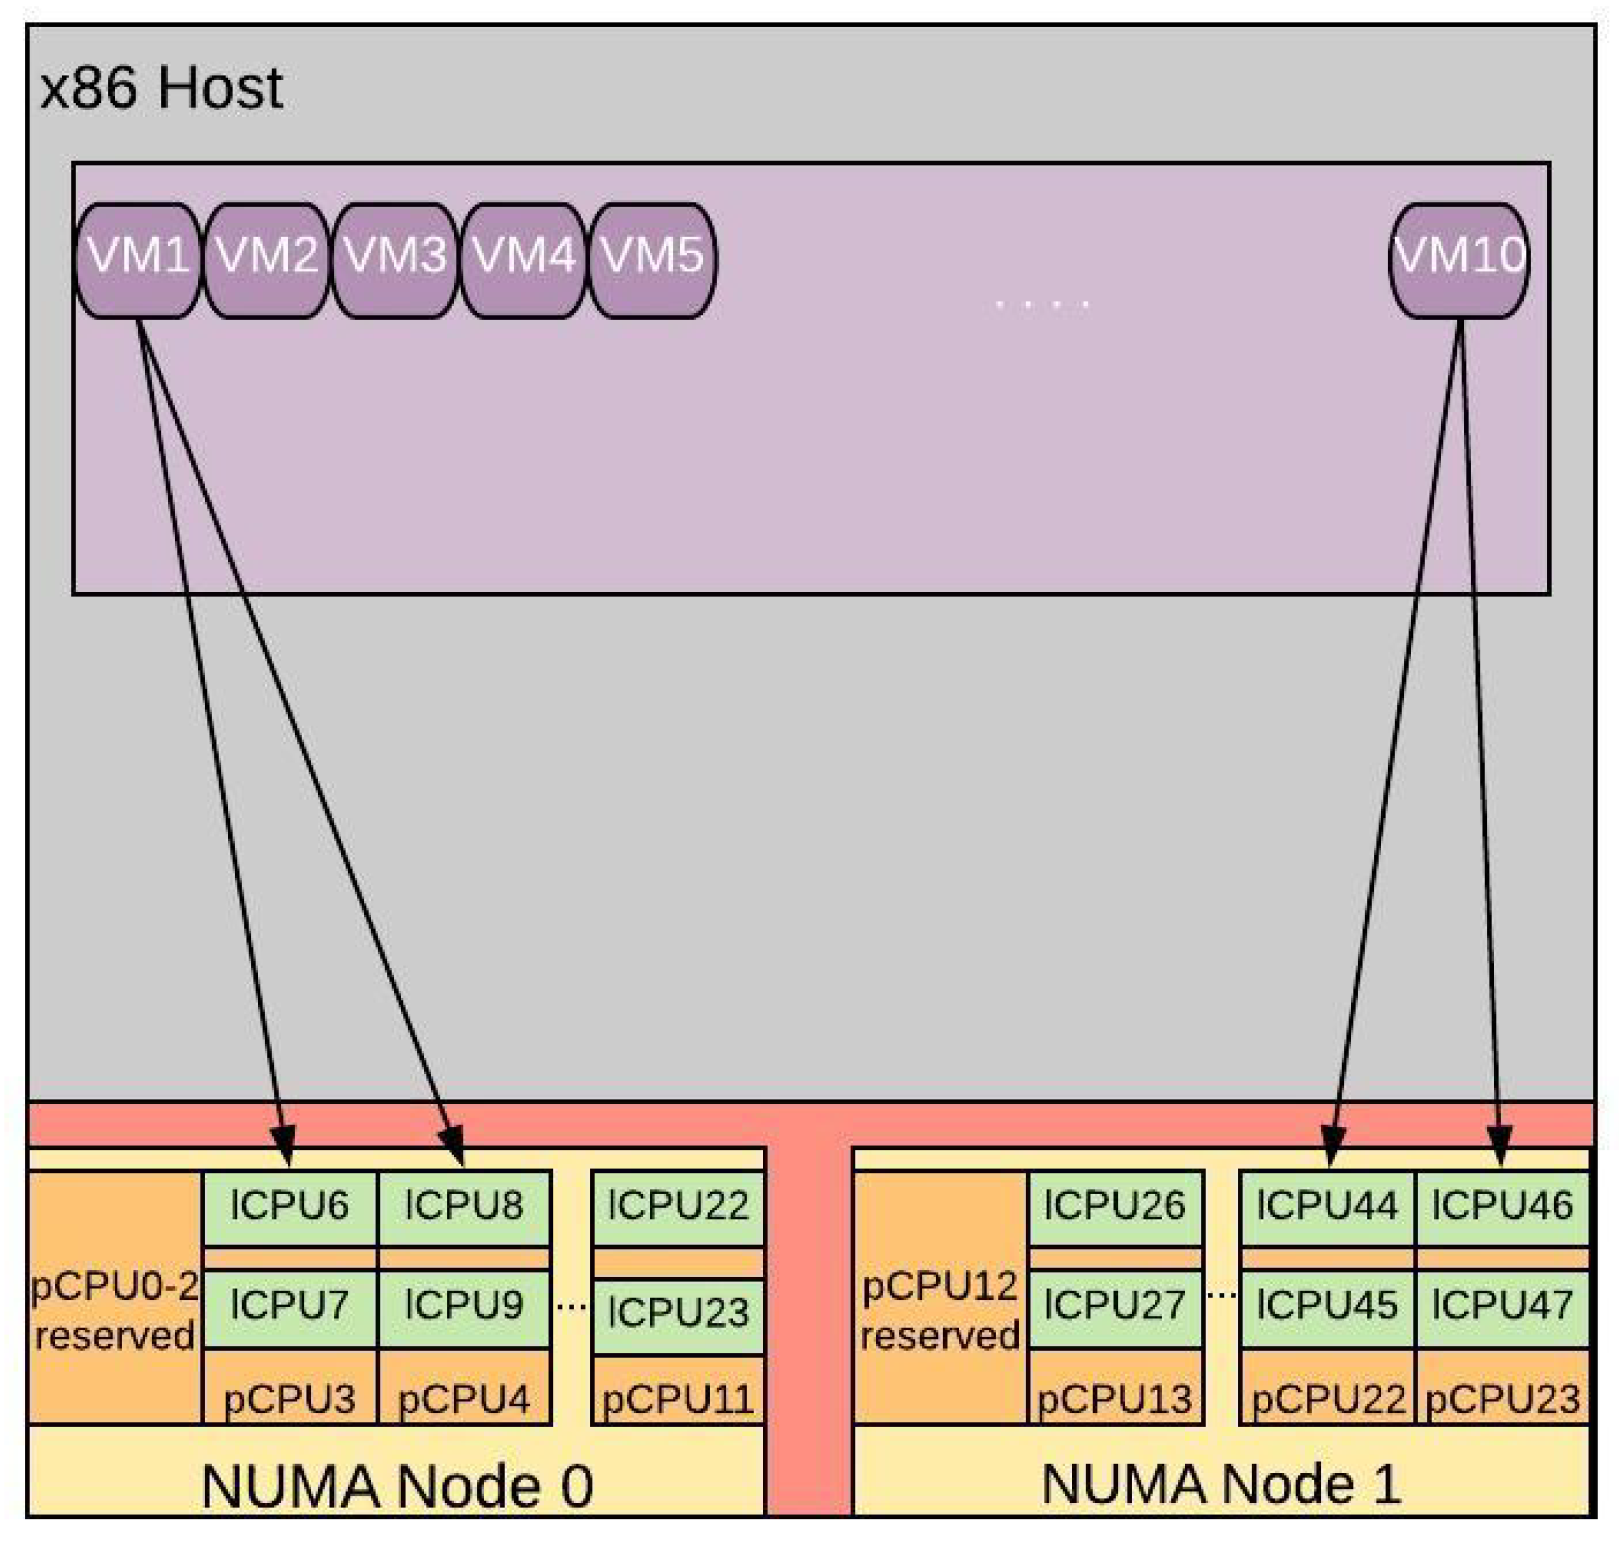
- Undersubscription: For an undersubscibed system we instantiate 10 VMs each configured with 2 virtual CPUs (vCPUs), bringing a total of 20 vCPUs. Each vCPU is pinned to a single physical Core (pCPU) occupying one of the two available logical threads. This CPU allocation configuration is depicted in Figure 7. The CPU cores of a socket and their respective memory caches are build into a Non-Uniform Memory Access (NUMA) nodes. From the first NUMA node we reserve 3 pCPUs (pCPUs0-3) and from the second Node we reserve pCPU12. In the particular configuration, we allocate only one lCPU from each pCPU to ensure the necessary CPU isolation between the VMs. Hence, VM1 is pinned to lCPU6 from pCPU3 and lCPU8 from pCPU4, the two vCPUs of VM2 are allocated to lCPU10 from pCPU5 and lCPU12 from PCPU6, and so on.
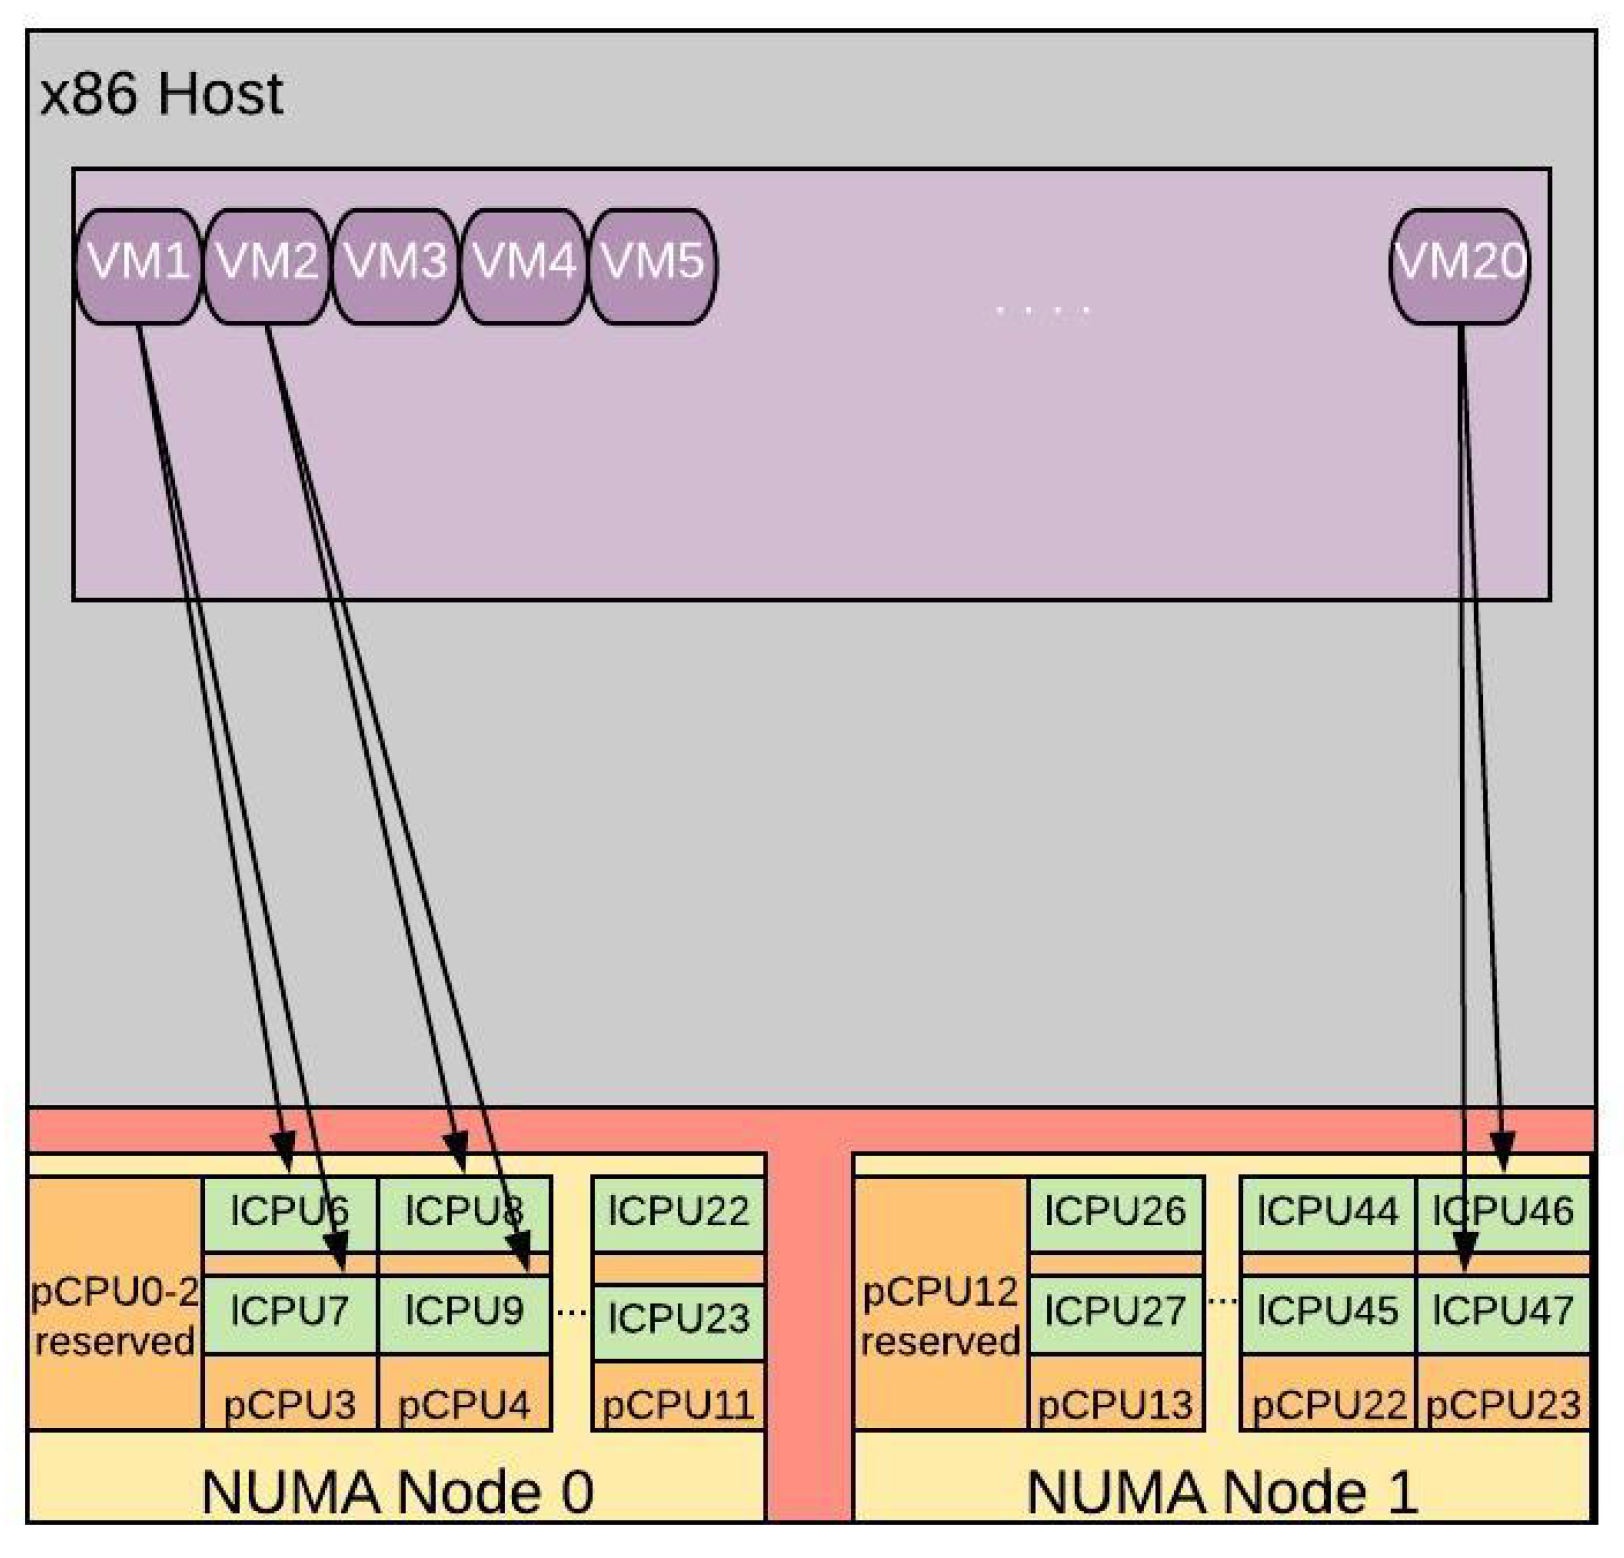
- 2:1 Oversubscription: For the first type of oversubscription examined, we use all available lCPUs. Thus, we instantiate 20 VMs, creating a total demand of 40 vCPUs over 20 pCPUs (ratio 2:1). Figure 8, illustrates this type of CPU oversubscription. In the particular configuration, the two vCPUs of each VM are allocated on the two logical cores of each pCPU. For example, VM1 is pinned to lCPU6 and lCPU7 of pCPU3, VM2 is pinned to lCPU8 and lCPU9 of pCPU4, etc.
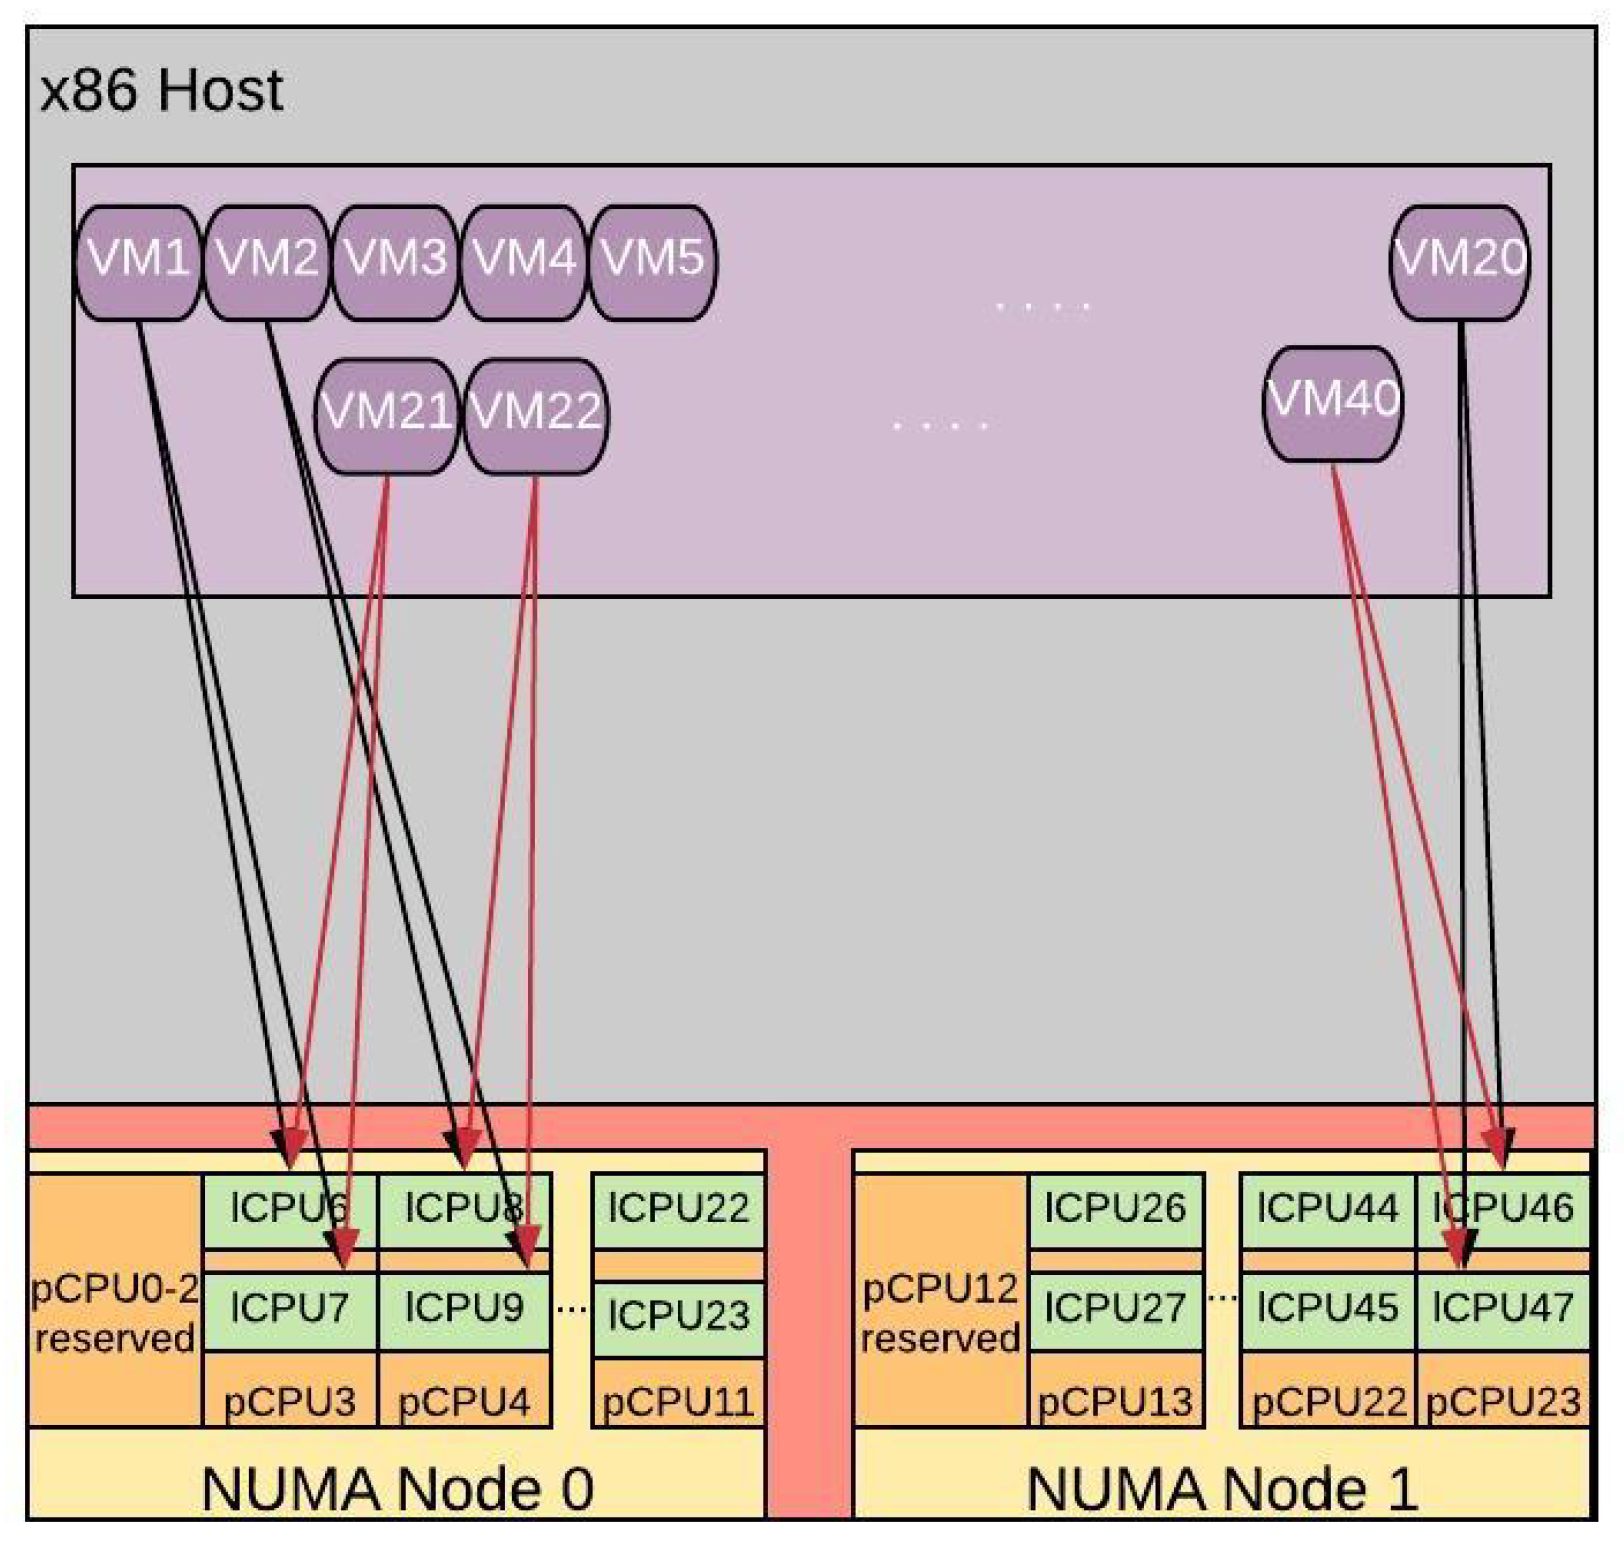
- 4:1 Oversubscription: to stress even more the available CPU capacity, as a second scenario we oversubcribe our system with a ratio of 4:1. Specifically, we instantiate 40 VMs generating a total demand of 80 vCPUs over 20 pCPUs. Figure 9, illustrate the CPU allocation in a 4:1 oversubscribed system. As we can see, two VMs are now allocated on the same pCPU sharing both of its lCPUs. For instance VM1 and VM21 are pinned to lCPU6 and lCPU7 of pCPU3, VM2 and VM22 are allocated to lCPU8 and lCPU9 of pCPU4, and so on.
3.5. Performance Impact of System Configuration
The combination of the different system configuration presented above can affect the overall performance. For example, choosing a single-feature over multi-feature deployment can increase the overall performance, since stacking multiple features on a single VM can create an inter-VM bottleneck that will restrain the VM from efficiently applying the multiple processing-intensive VNFs to the incoming traffic. Adding additional resources to the multi-feature VMs can partially alleviate the inter-VM bottleneck; however, since VNFs are I/O bound and less CPU-bound the performance gains will be marginal [7]. Regarding chaining, a PVVP configuration will add an internal chaining bottleneck since traffic needs to pass through the server twice, limiting to half the throughput performance [24]. Finally, when opting to use oversubscription, we may increase the number of VMs hosted to the server, but realistically we expect a performance reduction [25].
The system configuration can impact the cost of the VNF deployment solution as well. With this regard, a single-feature approach will result in much more VM and CPU requirements, drastically increasing the requested resources and thus the deployment cost. In contrast, the multi-feature approach can significantly reduce the number of needed VMs and communication links, since the chain “lives” inside the VM, resulting in significant deployment cost reductions. For inter-server chaining following a PVP solution the cost can increase, since now we need to increase the number of servers and the number of intermediate forwarding devices, with significant cost impact. On the other hand, the PVVP, helps consolidating multiple VMs on the same server, and perform the chaining internally, thus contributing to lower deployment costs. As far the CPU allocation, an oversubscribed system can further enhance the consolidation ratio and cost reductions compared to undersubscribed systems.
To this end, a trade-off is being generated between performance and cost. In particular, aiming for an oversubscribed, multi-feature and chained deployment, an optimal deployment will be generated in terms of cost at the expense of lower performance. When selecting an undersubscribed, single-feature VNF deployment with no internal chaining we can maximize the attained performance but considerably increase the cost. All other combinations will produce a trade-off between cost and performance. This trade-off depends on the complexity of the system configuration and has not been yet quantified. Our work aims to shed light in this quantification by providing the benefits and the disadvantages of the different combinations between the various system configurations.
The findings of this analysis is of utmost importance for both industrial and academic initiatives. On one hand, results of this analysis can be reused by production environments for realistic horizontal-scale use-cases that wants to satisfy high scale requirements. The applicability of this analysis becomes even more convenient since we avoid complex tuning steps and BIOS configurations that may be difficult to operationalize. On the other hand, the specific analysis can crystalize ambiguities raised during the capacity planning of resources. This is a typical research problem in the academia called VNF Placement problem [30]. In this type of problem, the main goal is to minimize the overall deployment cost (i.e., minimize the number of computational and communication resources). However, existing works do not consider the impact of the deployment solution to the overall throughput and delay performance. This yet, starts to become a significant requirement when evaluating the VNF placement solutions for the emerging throughput and delay critical IoT and 5G applications, which will largely rely on the NFV technology.
Thus, the challenge of performance degradation when using the NFV technology is more timely than ever. For instance, IoT and 5G infrastructures will be highly virtualized, applying VNFs to the network stream through the use of SFC or Network Slices. At the same time, taking into consideration the limited resources available of an end-to-end infrastructure that has to be highly shareable and scalable, a meticulous VNF deployment solution should be designed. Accordingly, our goal is to propose appropriate network and system configurations both for a standard x86 server and for the VMs deployed on it, in order to find a balanced solution in terms of throughput, delay, and overall cost. Regarding cost, we explore when oversubscription and multi-feature deployment can be beneficial by reducing the overall deployment cost without sacrificing performance. Furthermore, we quantify the performance achieved when VNFs need to be chained internally in the server, a network configuration that is not usually taken into account when extracting the system performance of a virtualized system. In a nutshell, the performance analysis of realistic VNF deployment solutions is still an open challenge in the context of NFV. Hence, through this paper we propose unexplored configuration solutions and insights in terms of oversubscription, multi-feature deployment, and novel SR-IOV chaining techniques that could be used from network operators to efficiently plan their infrastructure towards achieving the long coveted but conflicting goal of jointly maximizing the cost reduction and performance.
4. Performance Evaluation
In this section, we compare the various deployment configuration combinations including the number of features, chaining, and oversubscription scenarios, in terms of throughput and delay. Specifically, we perform two sets of experiments. In the first experiment VNFs are deployed as PVP chains and we evaluate the impact of single-feature and multi-feature deployment for the different oversubscription ratios. Similarly, in the second experiment, we follow the same approach, using however a PVVP configuration.
Our testbed consists of two DELL PowerEdge R740 x86 hosts running 18.04 Ubuntu and a KVM hypervisor and they are both connected via an Intel NIC with two 10 Gigabit Ethernet interfaces to a Layer 2 Cisco Catalyst WS-C3850 switch. The first server acts as a traffic generator, while the second acts as our device under test (DUT). For the traffic generator we use the open-source tool NFVBench [31], which allows the execution of multiple PVP and PVVP chains. The VNFs are instantiated as VMs using the Cisco® CSR 1000V virtual routers. The CSR 1000v VNFs are configured either as single-feature VMs by performing basic IPv4 forwarding (Cisco Express Forwarding—CEF), or they can apply multi-feature processing by executing NAT, FW, QoS, and DPI on the traffic stream.
The traffic generator sends IP traffic with an IMIX packet profile to a variable number of chains hosted on the DUT, by accepting a packet loss rate of 0.001% over a 1 min measurement interval, according to RFC2544 [32]. This measurement technique starts by sending traffic at full speed and continuously adjusting it until it founds the maximum throughput value with the target packet drop rate. Finally, each experiment is executed 10 times, while we provide the average value. The specifics of the setup are summarized in Table 1.
4.1. PVP Configuration
4.1.1. Single-Feature Results
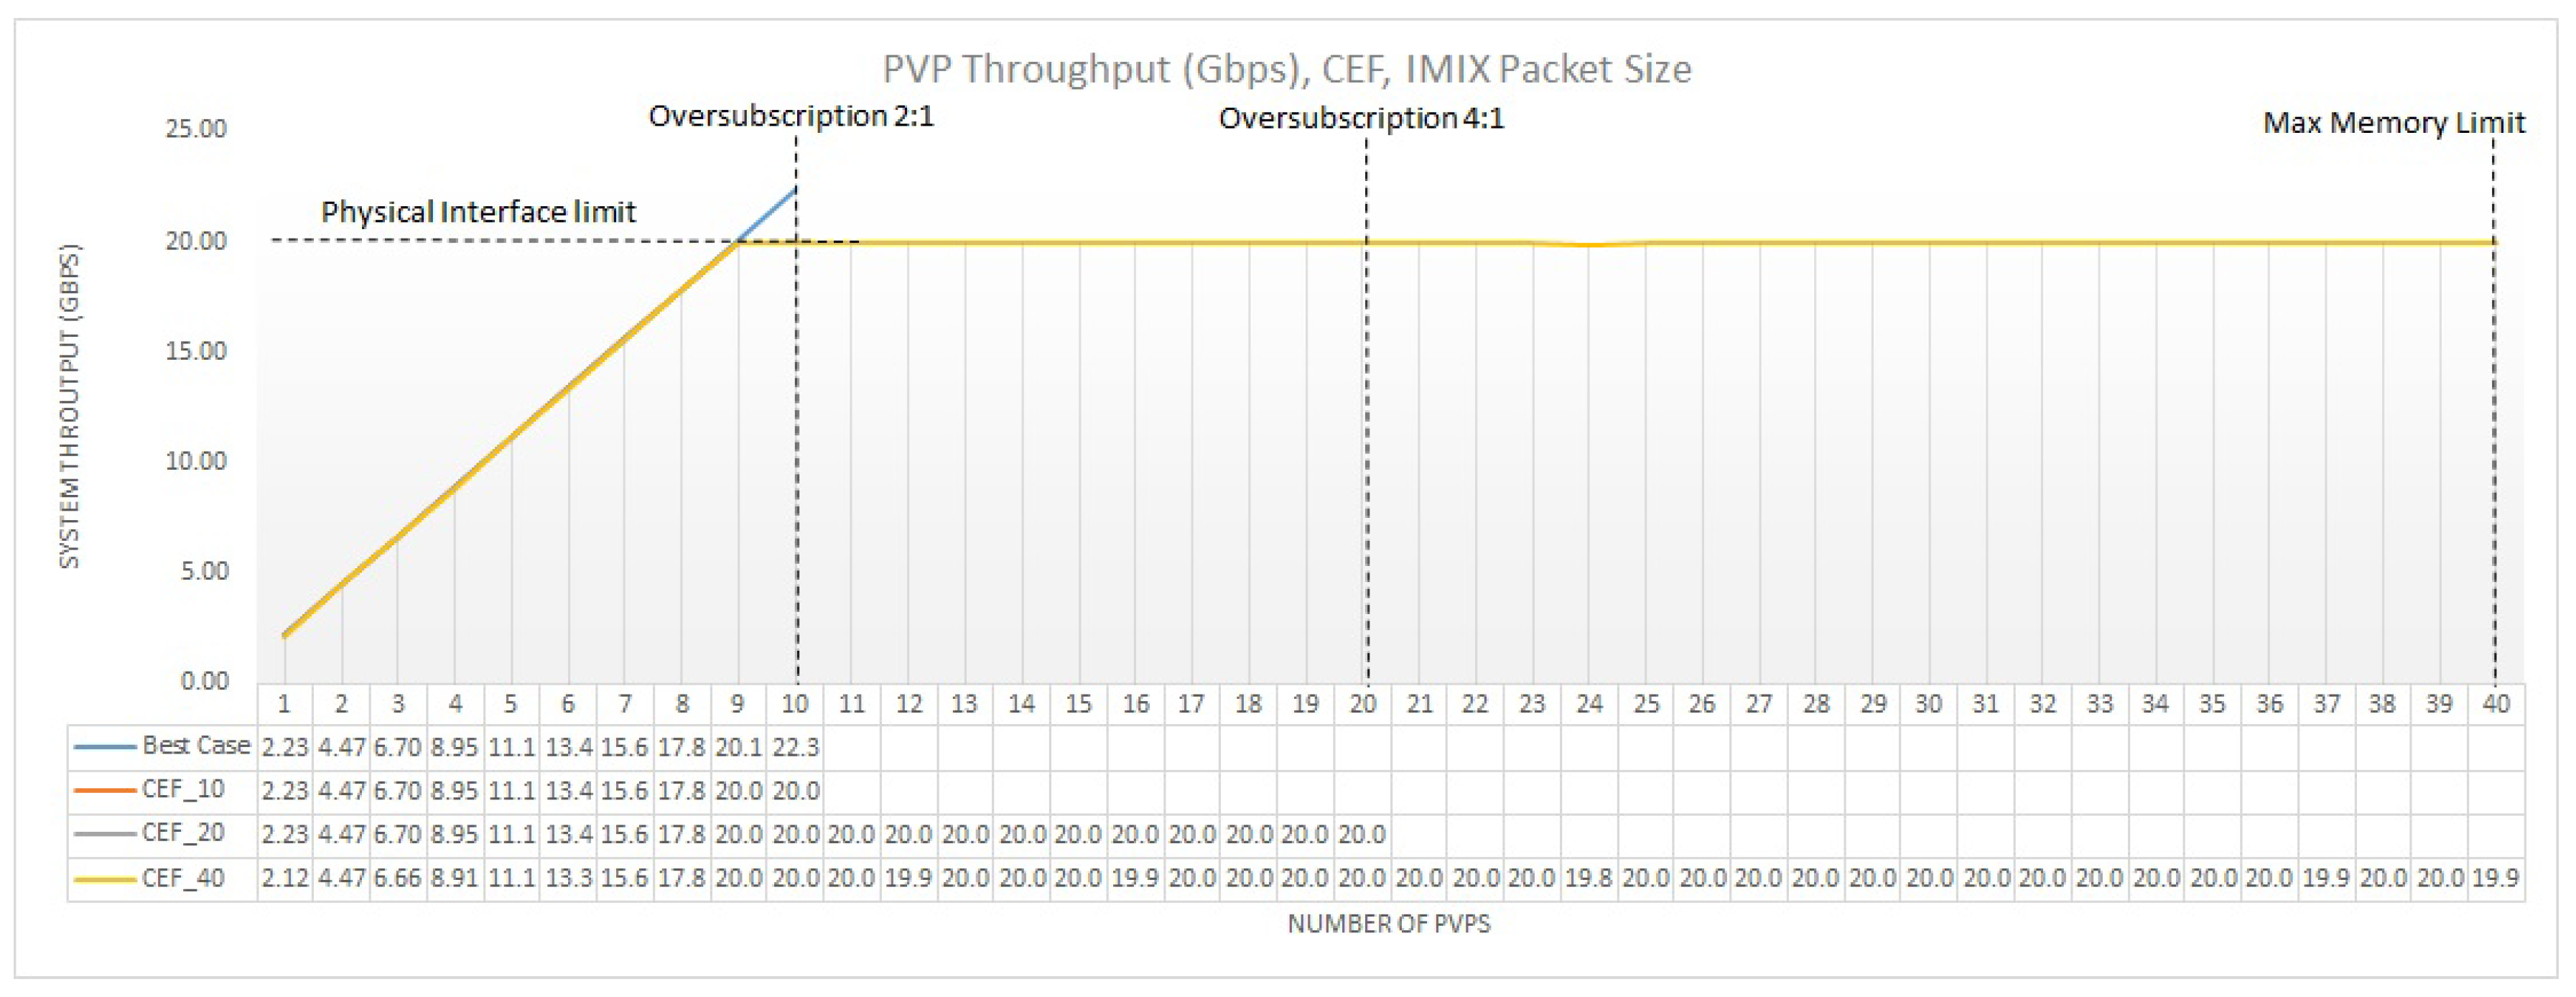
Figure 10 shows the system throughput of multiple single-feature PVPs for IPv4 forwarding (CEF) with an IMIX packet profile for the different CPU allocation strategies. As a benchmark we use an additive linear extrapolation of the single-PVP test, named Best Case. The reason is that ideally, we would like the throughput to linearly grow as PVPs are added. CEF_10 denotes the case of undersubscription with a total of 10 VMs or 20 vCPUs that are pinned to a different physical core, CEF_20 demonstrates the 2:1 oversubscription scenario where we have 20 VMs or 40 vCPUs that are are pinned to a different logical core, and CEF_40 presents the 4:1 oversubscription case with 40 VMs or 80 vCPUs, where every 2 vCPUs are pinned to a single logical core.
The results show a perfect linear contribution to the overall system throughput for each additional VNF, reaching the physical interface limit. with 9 PVPs regardless the oversubscription scenario used. This is a very important observation, since for light processing VNFs, the impact of oversubscription is marginal. In such deployment scenarios we can target for both high performance and low cost deployment solutions, maximizing the benefits of NFV. We need to clarify that the traffic generator measures the attained throughput of the bi-directional traffic. Thus, the physical interface limit is 20 Gbps (10 Gbps of the incoming NIC plus 10Gbps of the outgoing NIC).
To understand why throughput exhibits such a linear additive behavior, we need to delve into which factors could prevent such behavior. In general, when no internal chaining occurs, four main bottlenecks can affect the system’s throughput, namely the (i) physical NIC bottleneck (herein 20G bps), (ii) the hypervisor bottleneck (i.e., the capacity of the hypervisor to promptly allocate the necessary CPU cycles to the VMs), (iii) the vSwitch bottleneck (i.e., how fast the traffic is forwarded from the pNIC to the VM), and iv) the intra-VM bottleneck (i.e., how the maximum capacity of the VM itself can limit the throughput) [7]. When using SR-IOV we have the advantage that VMs are directly connected to the pNIC without the need of a vSwitch or a hypervisor to handle this traffic transition. So immediately, we eliminate the hypervisor and vSwitch bottlenecks that could prevent a linear throughput increase.
Another observation is that a single PVP can achieve a throughput of 2.23 Gbps. In an ideal deployment someone would expect that a single PVP would reach the line rate and hit the pNIC bottleneck. However, in a production environment, VNFs come with licenses that restrict the bandwidth of the VM. Furthermore, the resources allocated to the VM and the I/O architecture used can restrain its maximum processing capacity. For the particular experiment, we used the ax 2500 M CSR 1000v license that enables the security features available (e.g., FW and DPI) limiting however the throughput achieved at 2.5 Gbps. The reason we notice a small difference between the 2.23 Gbps achieved and the 2.5 Gbps available from the licence, is that we have not performed any complex BIOS and tuning configurations that would be difficult to operationalize that however could slightly increase the performance. Furthermore, the fact that hyper-threading is enabled to support higher rates of oversubscription has also a minor effect on the single PVP performance since it can result in lower L1 cache hit rates.
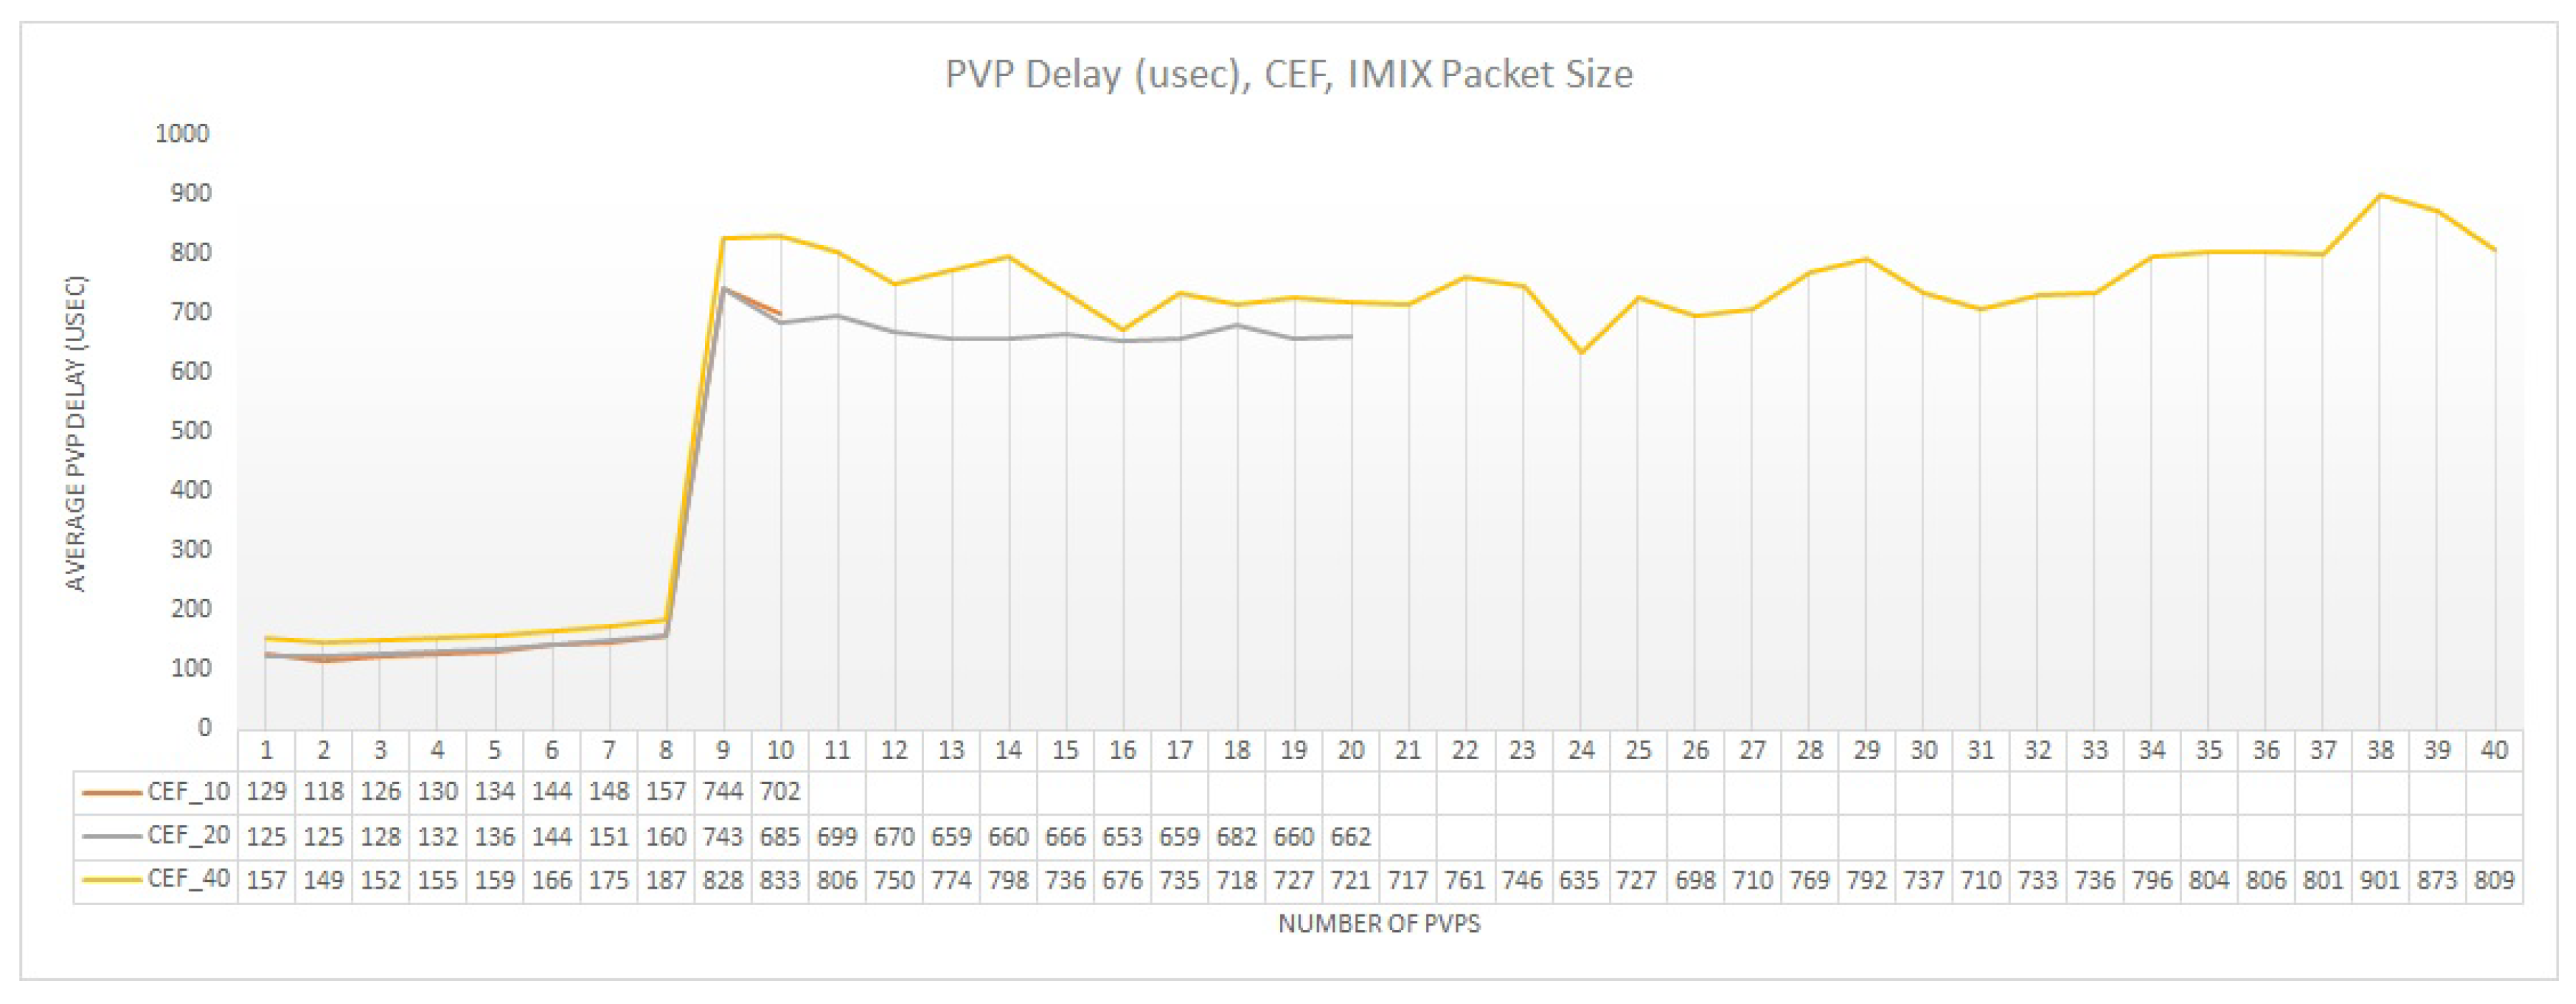
The average PVP delay is illustrated in Figure 11. As we can see, there is no significant change up to the 9th PVP for the different oversubscription scenarios. After this point, the physical interface limit is reached and we notice an abrupt increase on the average delay. This is reasonable, as the buffers of the NIC interfaces are overflowed leading to considerable delay. Furthermore, for 40 PVPs we notice a small increase in the delay in comparison with the rest CPU allocation strategies, since some requested CPU cycles will not be immediately available on the VMs. However, this increase is of less than 30 usec, which is practical negligible. Finally, for all three tested scenarios the delay presents a slow ascending trend up to the 9th PVP, since the physical capacity of the NICs becomes stressed.
4.1.2. Multi-Feature Results
In this part of the experiment, we activate four features in each VM, namely the NAT, QoS, FW, and DPI features. Figure 12 presents the system throughput for the different CPU configurations. The first observation is that by activating processing intensive features the system throughput is impacted. For example, if we compare Figure 10 with Figure 12 we see that for the multi-feature configuration the physical interface limit is not attained. However, for the undersubscription configuration with 10 PVPs (FEAT_10), the system throughput increases almost with the same rate as the best case additive line for the particular configuration (Best Case_10), maximizing at 16.7 Gbps. This is where we hit the CPU oversubsciption limit. Intuitively, we can conclude that for a more powerful server with a higher number of CPU cores, the system throughput would continue to grow linearly until we hit the physical NIC bottleneck. In this part of the experiment different number of VMs (10, 20, and 40) produce different single-PVP throughput values. Thus, we provide three best case additive lines, each one corresponding to one of the three CPU allocation scenarios.
When oversubscription is allowed, the impact on the system throughput becomes more obvious. For 20 PVPs (FEAT_20) the overall throughput is considerably less than 10 PVPs by starting deviating also from the best case additive line (Best Case_20). Nonetheless, a highly linear throughput growth is presented. The throughput reduction is even more evident, when 40 PVPs are instantiated on the server (FEAT _40), with however a larger deviation from the best case additive line (Best Case_40). In the particular configuration, throughput increases in a linear manner up to the 20th PVP. After this point each newly added PVP is being allocated on an already used pCPU making the hypervisor to struggle in order to allocate on time the requested CPU cycles for each PVP. This has a direct effect on the overall system throughput that maximizes at around 8 Gbps regardless the number of PVPs that we add after the 4:1 oversubscription limit. We have to note that even the system throughput remains stable the individual PVP throughput is reduced. For example for 20 PVPs the system throughput is approximately 9 Gbps which gives an average PVP throughput of 0.45 Gbps, while for 40 PVPs the throughput is 8.5 Gbps which gives an average PVP throughput of 0.21 Gbps. Such a degradation complicates the operators capacity planning processes. Nonetheless, a guarantee of approximately 200 Mbps can be enough for specific use cases.
Comparing Figure 8 with Figure 9 we see that the 20 VM deployment has the same CPU allocation with the first 20 VMs of the 40 VM deployment. Thus, it would make sense for the 20 PVPs configuration (FEAT_20) to have the exact same throughput performance with the corresponding part of the 40 PVPs configuration (FEAT_40). The difference noticed is attributed on the fact that in the case of the FEAT_40 configuration all 40 VMs are activated on the server, even though at each measurement point a lower number of VMs are actually processing traffic. This is a reasonable assumption, since on a production environment not all VMs will be continuously being used, but they can be on a stand-by/idle mode. To this end, we can safely deduce that the throughput reduction noticed between the 20 and 40 PVP configuration is due to extra CPU cycles requested from all 40 VMs running on the server. To better understand this clause, we need to further explore how the VMs generates CPU requests for the hypervisor. In particular, in addition to the vCPU processes configured for a VM (in our case 2 vCPUs), numerous VM system threads are also generating processing loads. Examples are the VM kernel process, virtual Network Interface Cards (NIC) processes, or interrupt request (IRQ) processes. The aggregate of all vCPU processes from the set of VMs as well as the VM-specific processes are presented to the hypervisor layer for scheduling onto physical CPU (pCPUs) cores [7]. This explains the different performance behavior with regards to the total number of activated VMs/PVPs.
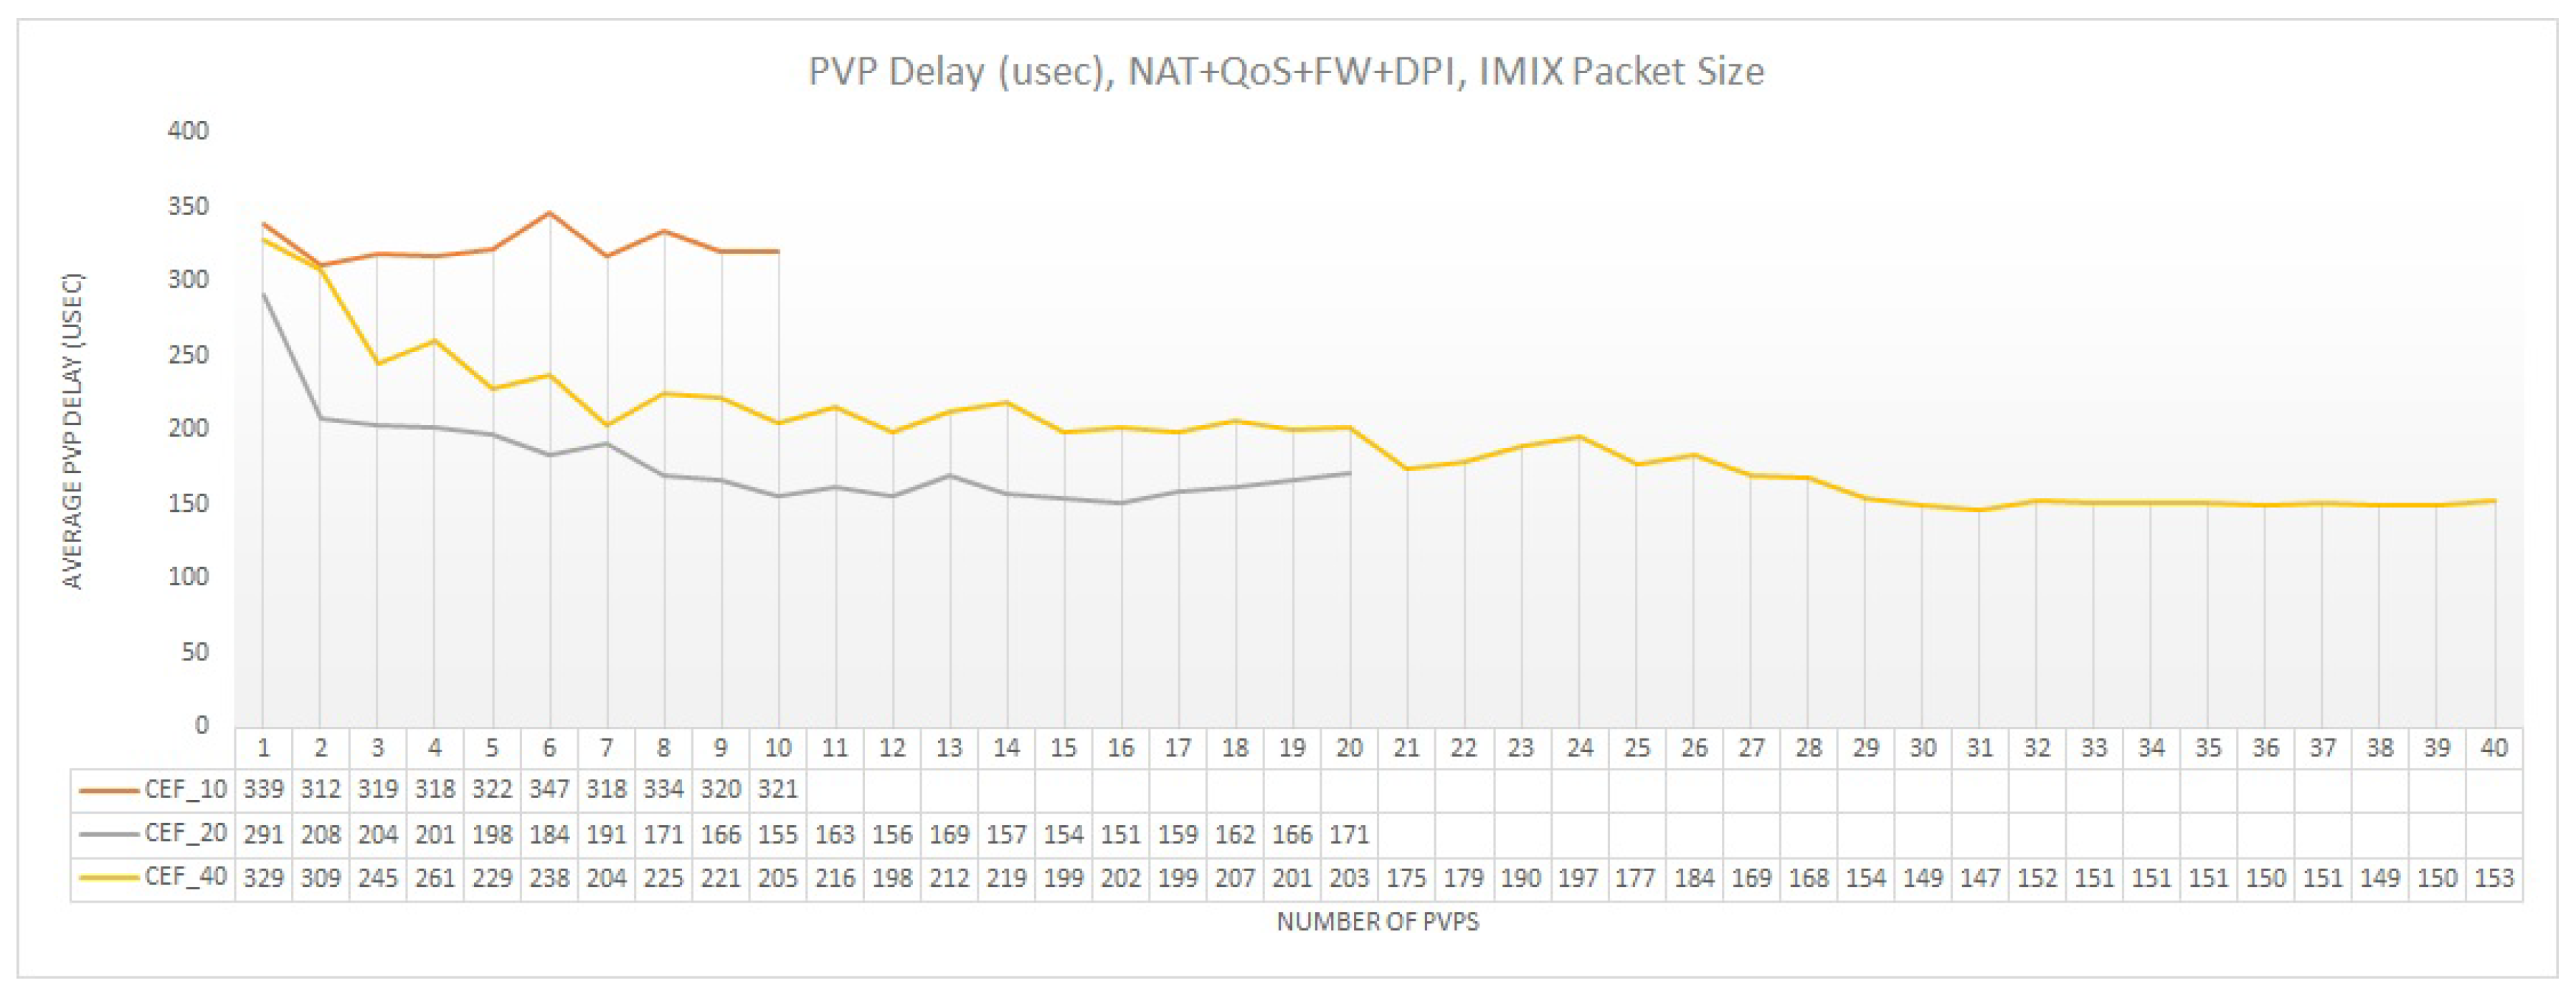
Regarding delay, as Figure 13 demonstrates, the multi-feature configuration almost doubles the average PVP delay in comparison to single-feature deployment (Figure 11). This is normal, since we add extra processing delay in our communication path, by applying four processing intensive features. For the undersubscription scenario (FEAT_10) we observe that the delay is approximately constant per PVP at around 320 usec. This was expected as the amount of packets processed by each PVP remains the same as we add more PVPs (i.e., throughput of FEAT_10 is identical to Best Case_10). Nonetheless, this behavior is not being noticed for the oversubscription scenario. For the 2:1 oversubscription factor, the delay is less than the undersubscription scenario since the throughput is lower and thus fewer packets are being processed. Furthermore, as the throughput of FEAT_20 deviates from the best case additive line, this means that for each additional PVP the average PVP throughput drops. This drop in throughput is translated into a lower number of packets being processed and thus a lower average PVP delay. This explains the descending behavior of the delay in Figure 13. The same trend is noticed for 40 PVPs (FEAT_40); however, in this case we need to take into account an additional delay from the CPU deprivation which slightly increase the average PVP delay in comparison to FEAT_20.
4.2. PVVP Configuration
4.2.1. Single-Feature Results
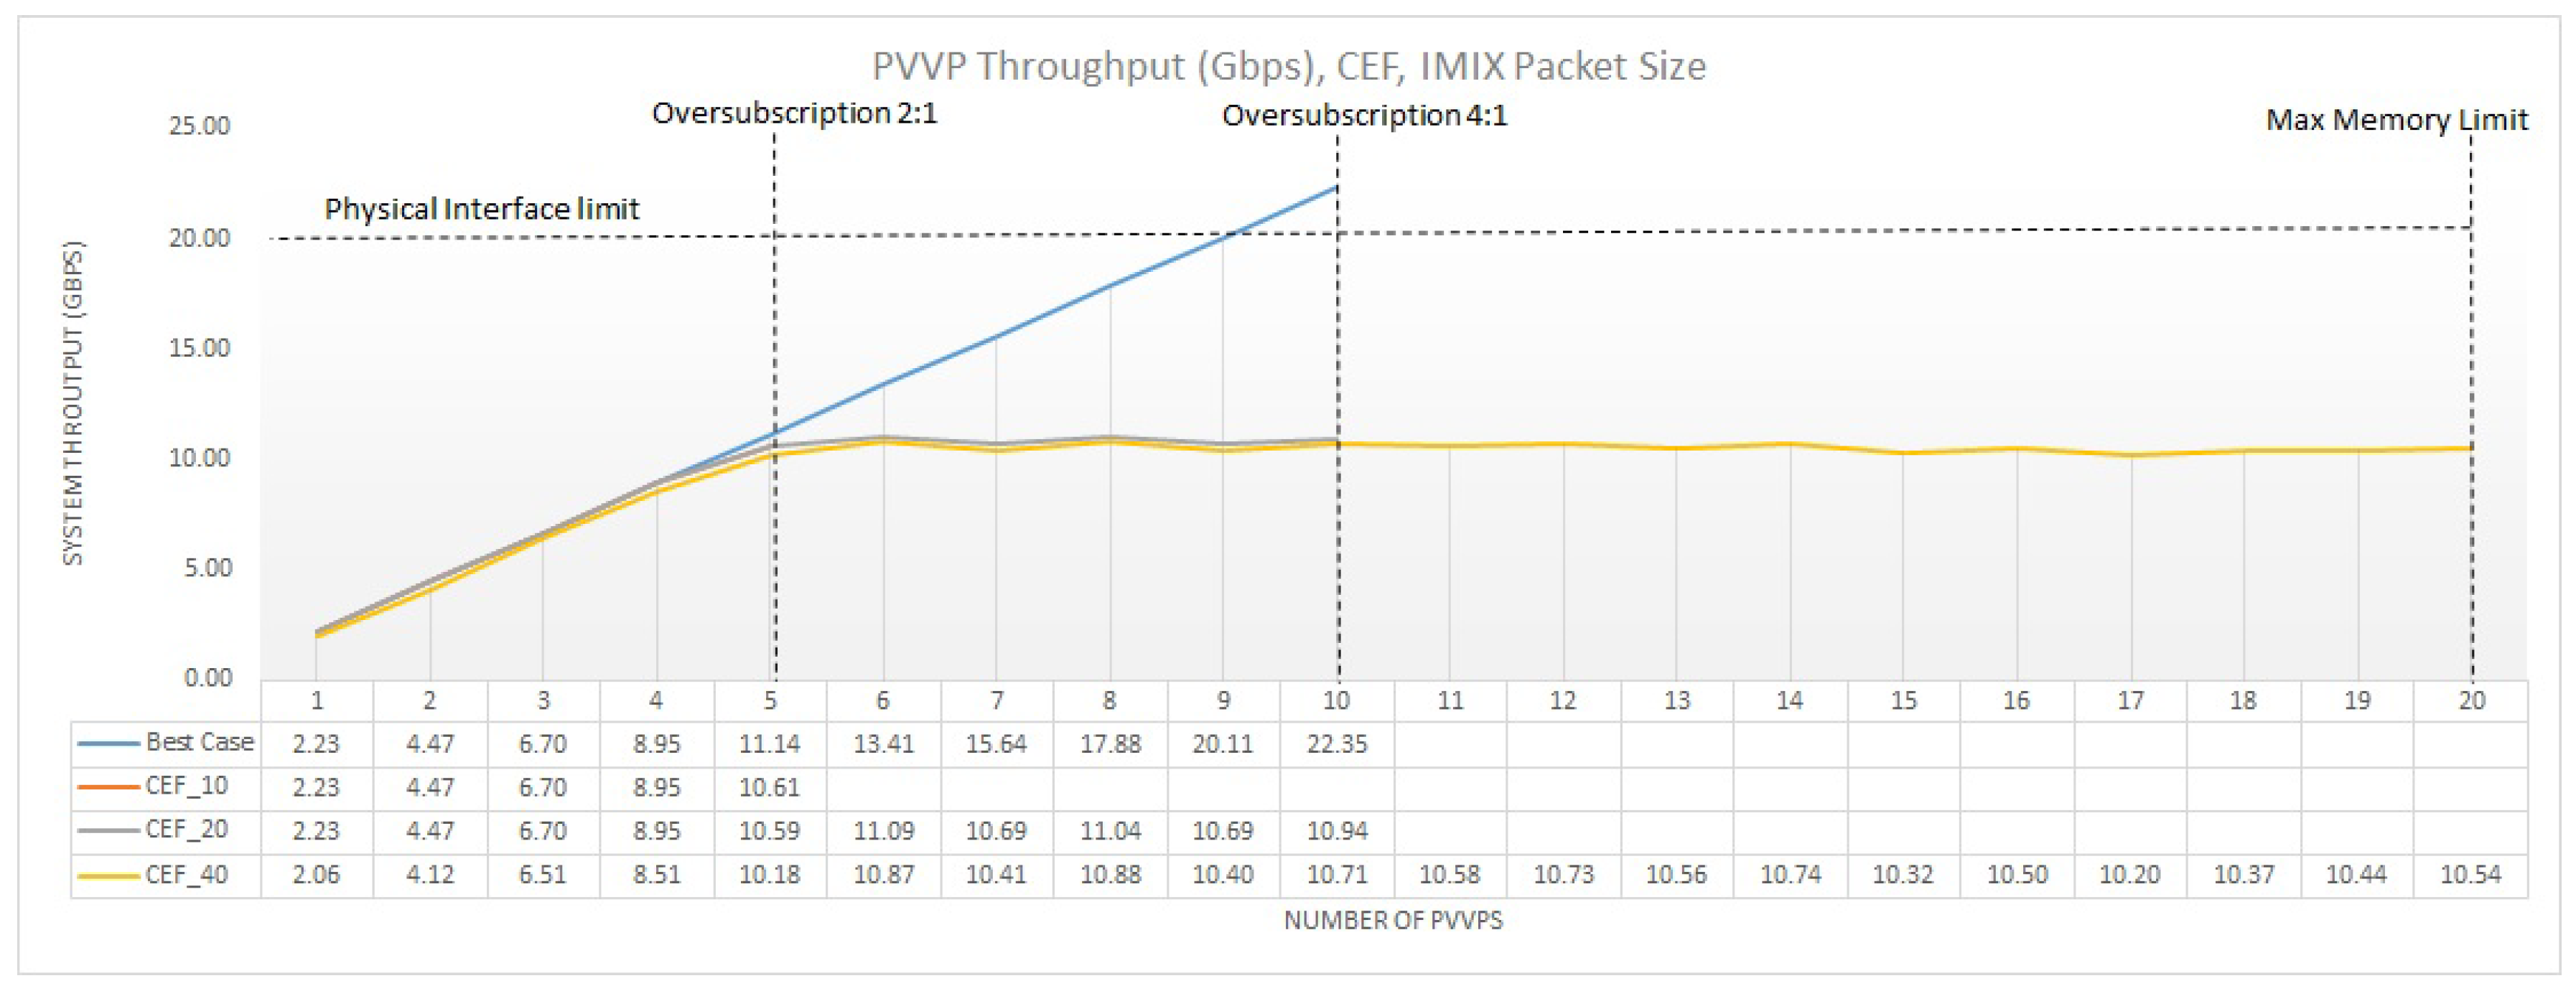
Figure 14 demonstrates the overall throughput system for an incremental number of PVVP chains (internal chaining). In this plot, each measurement point corresponds to two additional VMs chained together. Thus, similar to Section 4.1, we instantiate 10, 20, and 40 VMs, for the different CPU allocation configurations, which correspond to 5, 10, and 20 PVVPs respectively. As we can see, there is no particular difference between the different oversubscription ratios, when a single feature such as IPv4 forwarding is applied. This is inline with the PVP results showed in Figure 10. However, the great difference between the PVP and PVVP chaining technique, is that with PVVP the maximum system throughput is halved. In particular, this maximum throughput can be attained with 5 PVVPs, and after this point we do not observe a significant modification on the system throughput regardless the number of PVVPs added and the type of oversubscription followed. However, we need to take again into consideration that a stable system throughput, as the number of PVVPs increases, is translated into a reduced individual throughput for each PVVP. This reveals that the internal chaining creates an additional bottleneck and the impact of that is not always negligible. If we compare Figure 10 and Figure 14 we see that there is no difference for the first 10 VMs (10 PVPs or 5 PVVPs). However, beyond this point, PVP continues to grow linearly, while PVVP not. The reason is that in the case of PVVP the traffic is being passed two times from the pNIC; one for getting in and out of the server and one for the internal chaining, which explains why the system throughput is halved.
Unfortunately, this adverse impact of the internal chaining cannot be avoided without the addition of extra physical NICs. In particular, we have extensively analyzed the effect of internal chaining (e.g., through VEB and VEPA) for undersubscribed scenarios when using a single-feature deployment technique in [24]. In fact, for VEB two approaches where examined where first the internal switching is effectuated through a virtual bridge being set up from the hypervisor and second the VFs of SR-IOV where used to perform the internal chaining (as in this paper). However, for all techniques examined the internal chaining posed an additional bottleneck since traffic is processed twice leading the throughput to be approximately halved in comparison to when no chaining occurs. Nonetheless, for all internal chaining techniques used, the SR-IOV VEB-based chaining approach showed the best performance and this is why we chose it for the internal chaining.
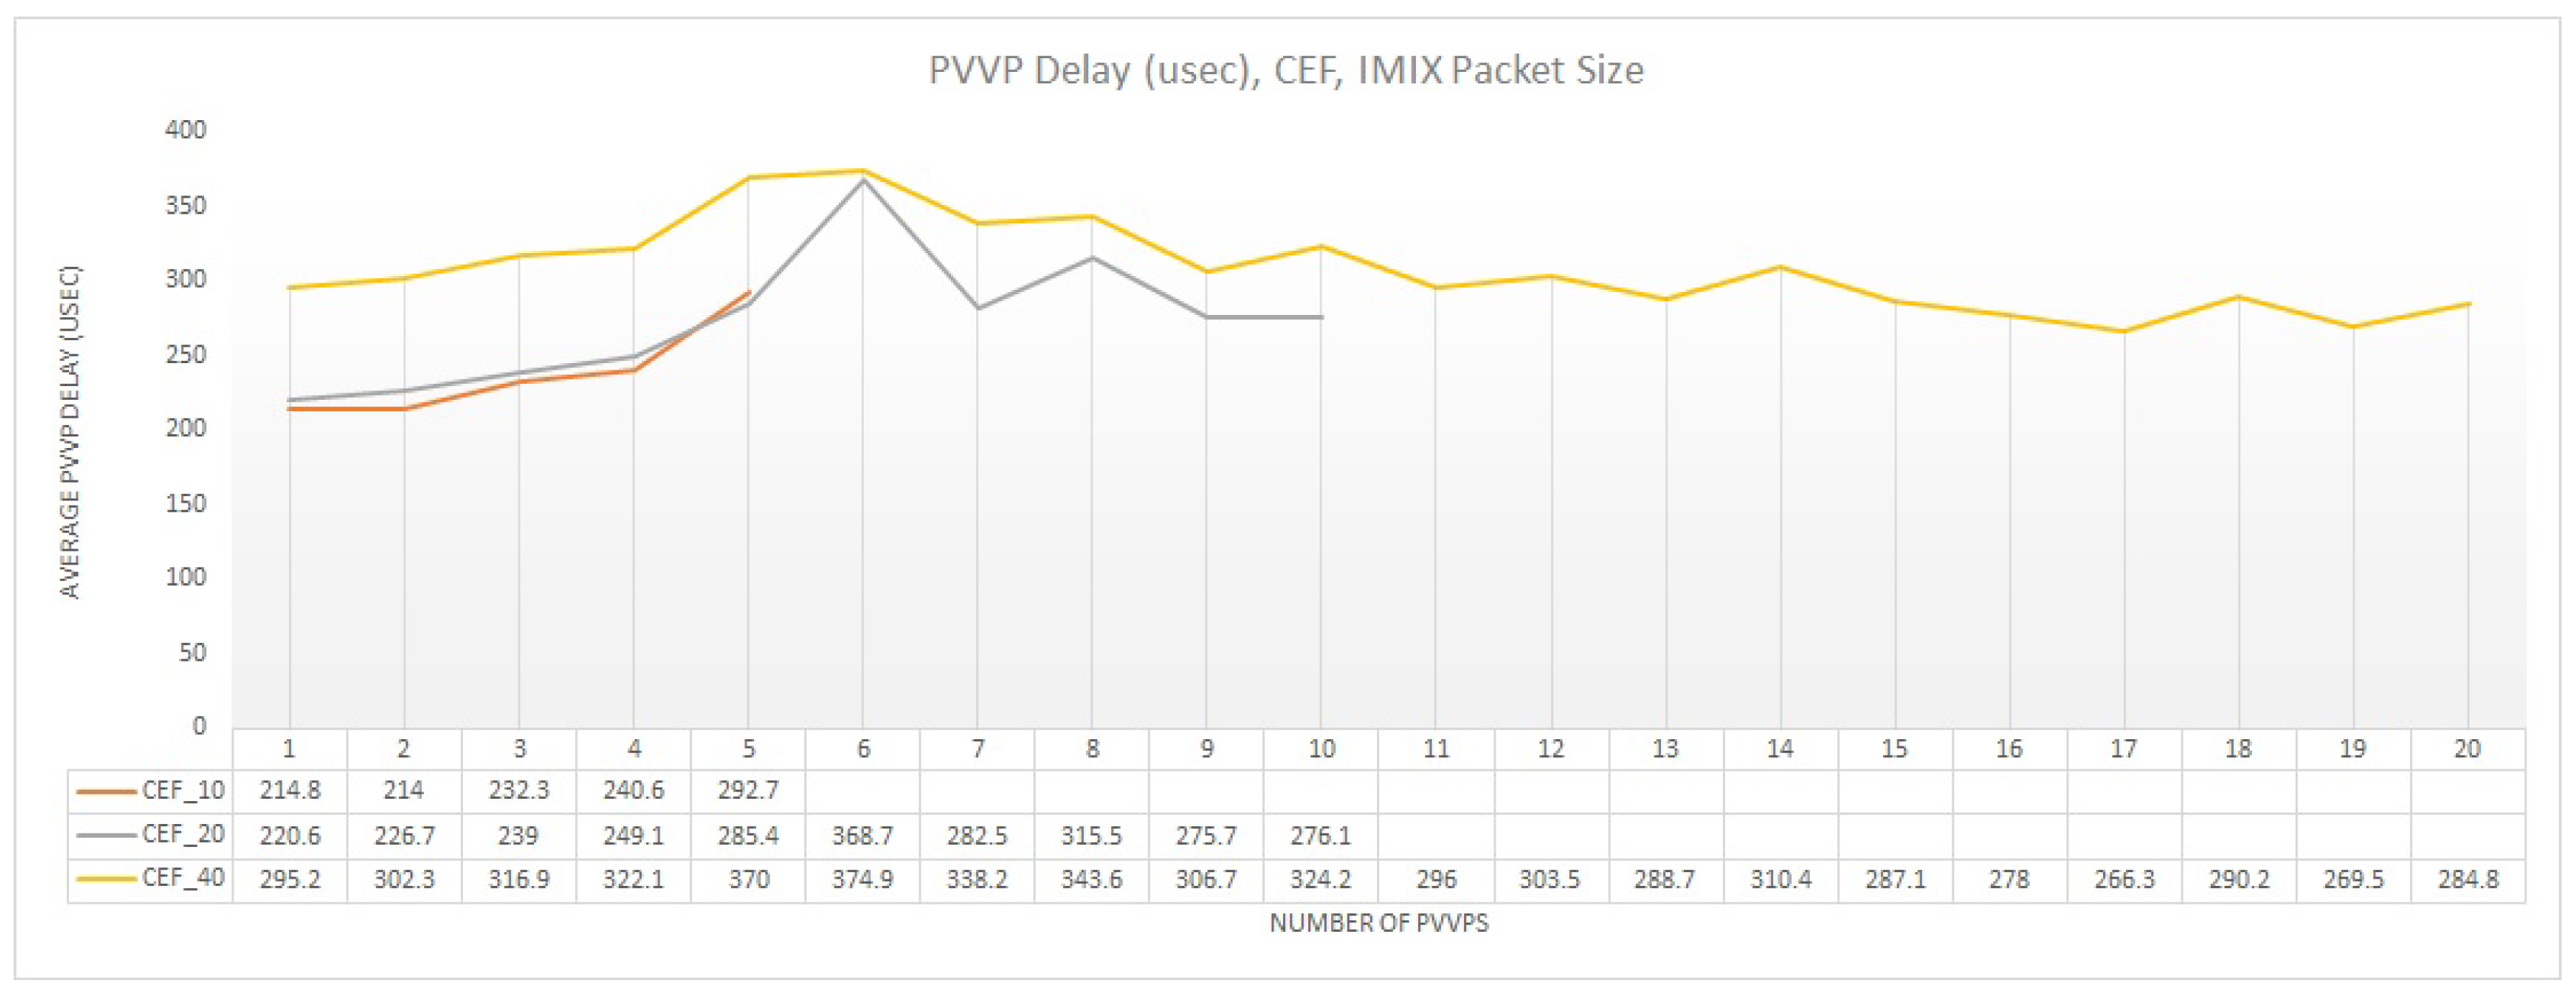
Regarding delay, as Figure 15 demonstrates, an increase is noticed with regards to PVP (Figure 11), which is almost doubled. However, the same delay trend is noticed. For the first 5 PVVPs the delay is increased as the buffers of the pNICs are stressed. Yet after the maximum throughput is attained the delay starts to decrease as the throughput per PVVP is decreased, and thus less traffic is processed per PVVP. This is more evident when having 20 and 40 VMs activated (CEF_20 and CEF_40). Finally, for 40 VMs (CEF_40) the delay introduced for a 4:1 oversubscription ratio is more important than the rest of CPU allocation strategies. This can be a decisive parameter when performing the capacity planning, and particular when we want to achieve a trade-off between throughput and delay.
4.2.2. Multi-Feature Results
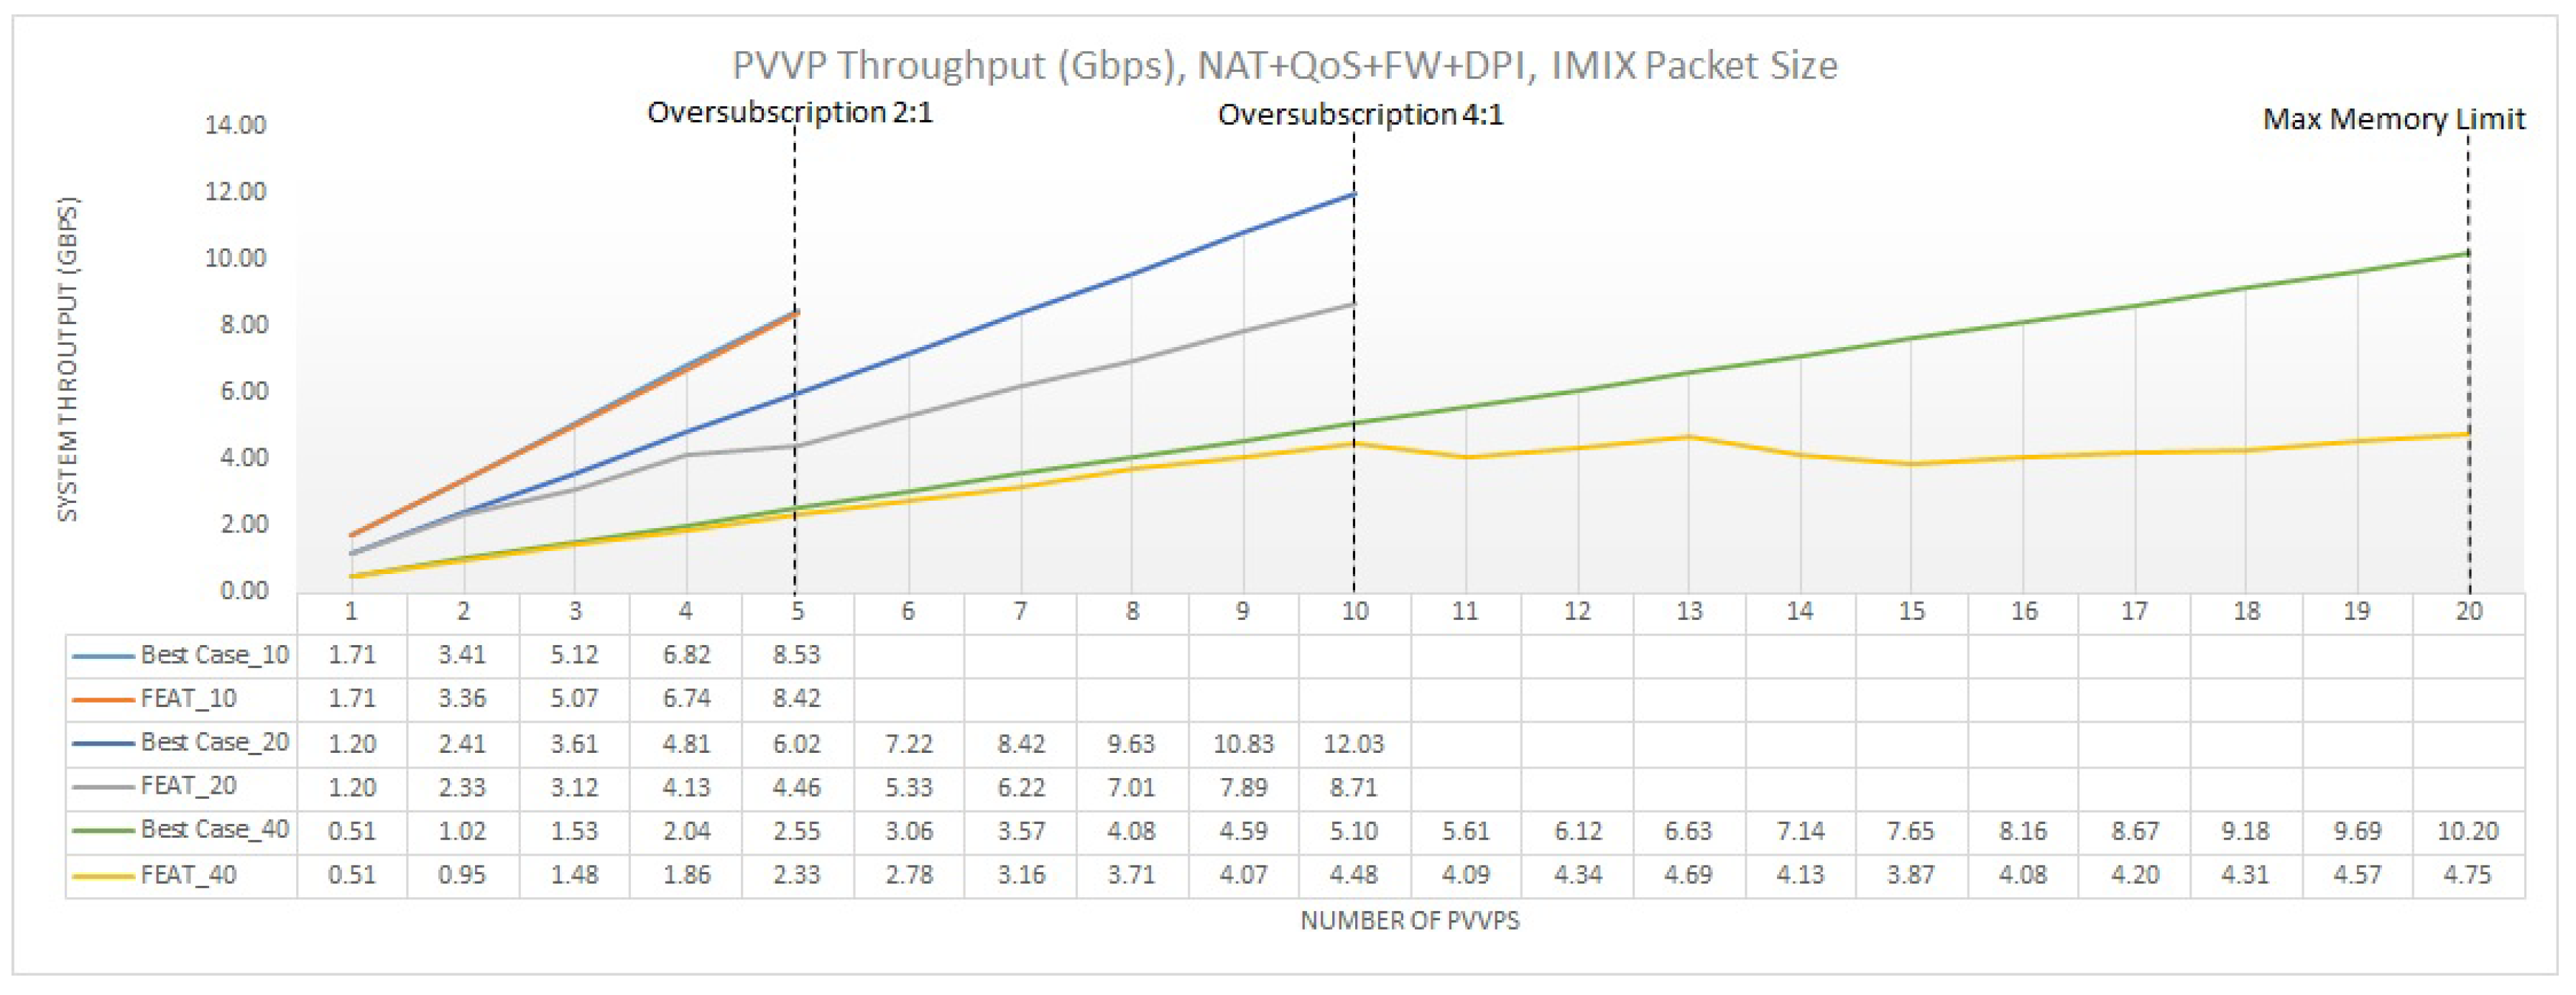
For a multi-feature configuration, a considerable change in the overall performance is noticed. Here, since we create a new PVVP chain for every two VMs, only the second VM activates the 4 features, while the first one continues to simply forward the traffic. This way, it is the second VM that regulates the overall throughput. Figure 16 presents the throughput performance for the different CPU allocation scenarios. For an undersubscribed system (FEAT_10), with only 5 PVVPs, the throughput shows a linear contribution to the overall system throughput for each additional PVVP. On top of that, the throughput follows the best case additive case (Base Case_10), meaning that each PVVP positively contributes to the overall throughput. However, as we increase the oversubcription factor the more we deviate from the best case additive throughput. Furthermore, the activation of features, as in the case of PVP, reduces the throughput, while the hypervisor further decelerates the throughput increase, especially when the 4:1 oversubscription ratio point is surpassed. Comparing, Figure 12 and Figure 16, we also notice the impact of the internal chaining bottleneck on the system’s performance (as a reminder we used the VEB technique). For PVP, the throughput maximizes at 17 Gbps for 10 and 20 VMs and at 8 Gbps for 40 VMs. In contrast, for PVVP the system throughput presents the highest values of 8.5 Gbps for 10 and 20 VMs and 4 Gbps for 40 VMs. This behavior corroborates the results found in PVVP, when only IPv4 forwarding is activated, where the internal chaining has as an outcome the reduction of the throughput at the half of its PVP value.
Another interesting aspect, which applies in both PVP and PVVP, when multiple features and oversubscription are enabled, is that we start noticing a higher variance in the results. Specifically, the system throughput presents a ±1 Gbps deviation from the average value, which justifies the fluctuation noticed after the 4:1 oversubscription point. This implies that a higher number of experiments may need to be executed to have a more smooth throughput distribution, but at the same time it points the fact that capacity planning, in terms of throughput satisfaction, becomes a complicated task for the network operator. Nonetheless, on average we can safely say that for 20 PVVPs we can have an average throughput value of approximately 240 Mbps.
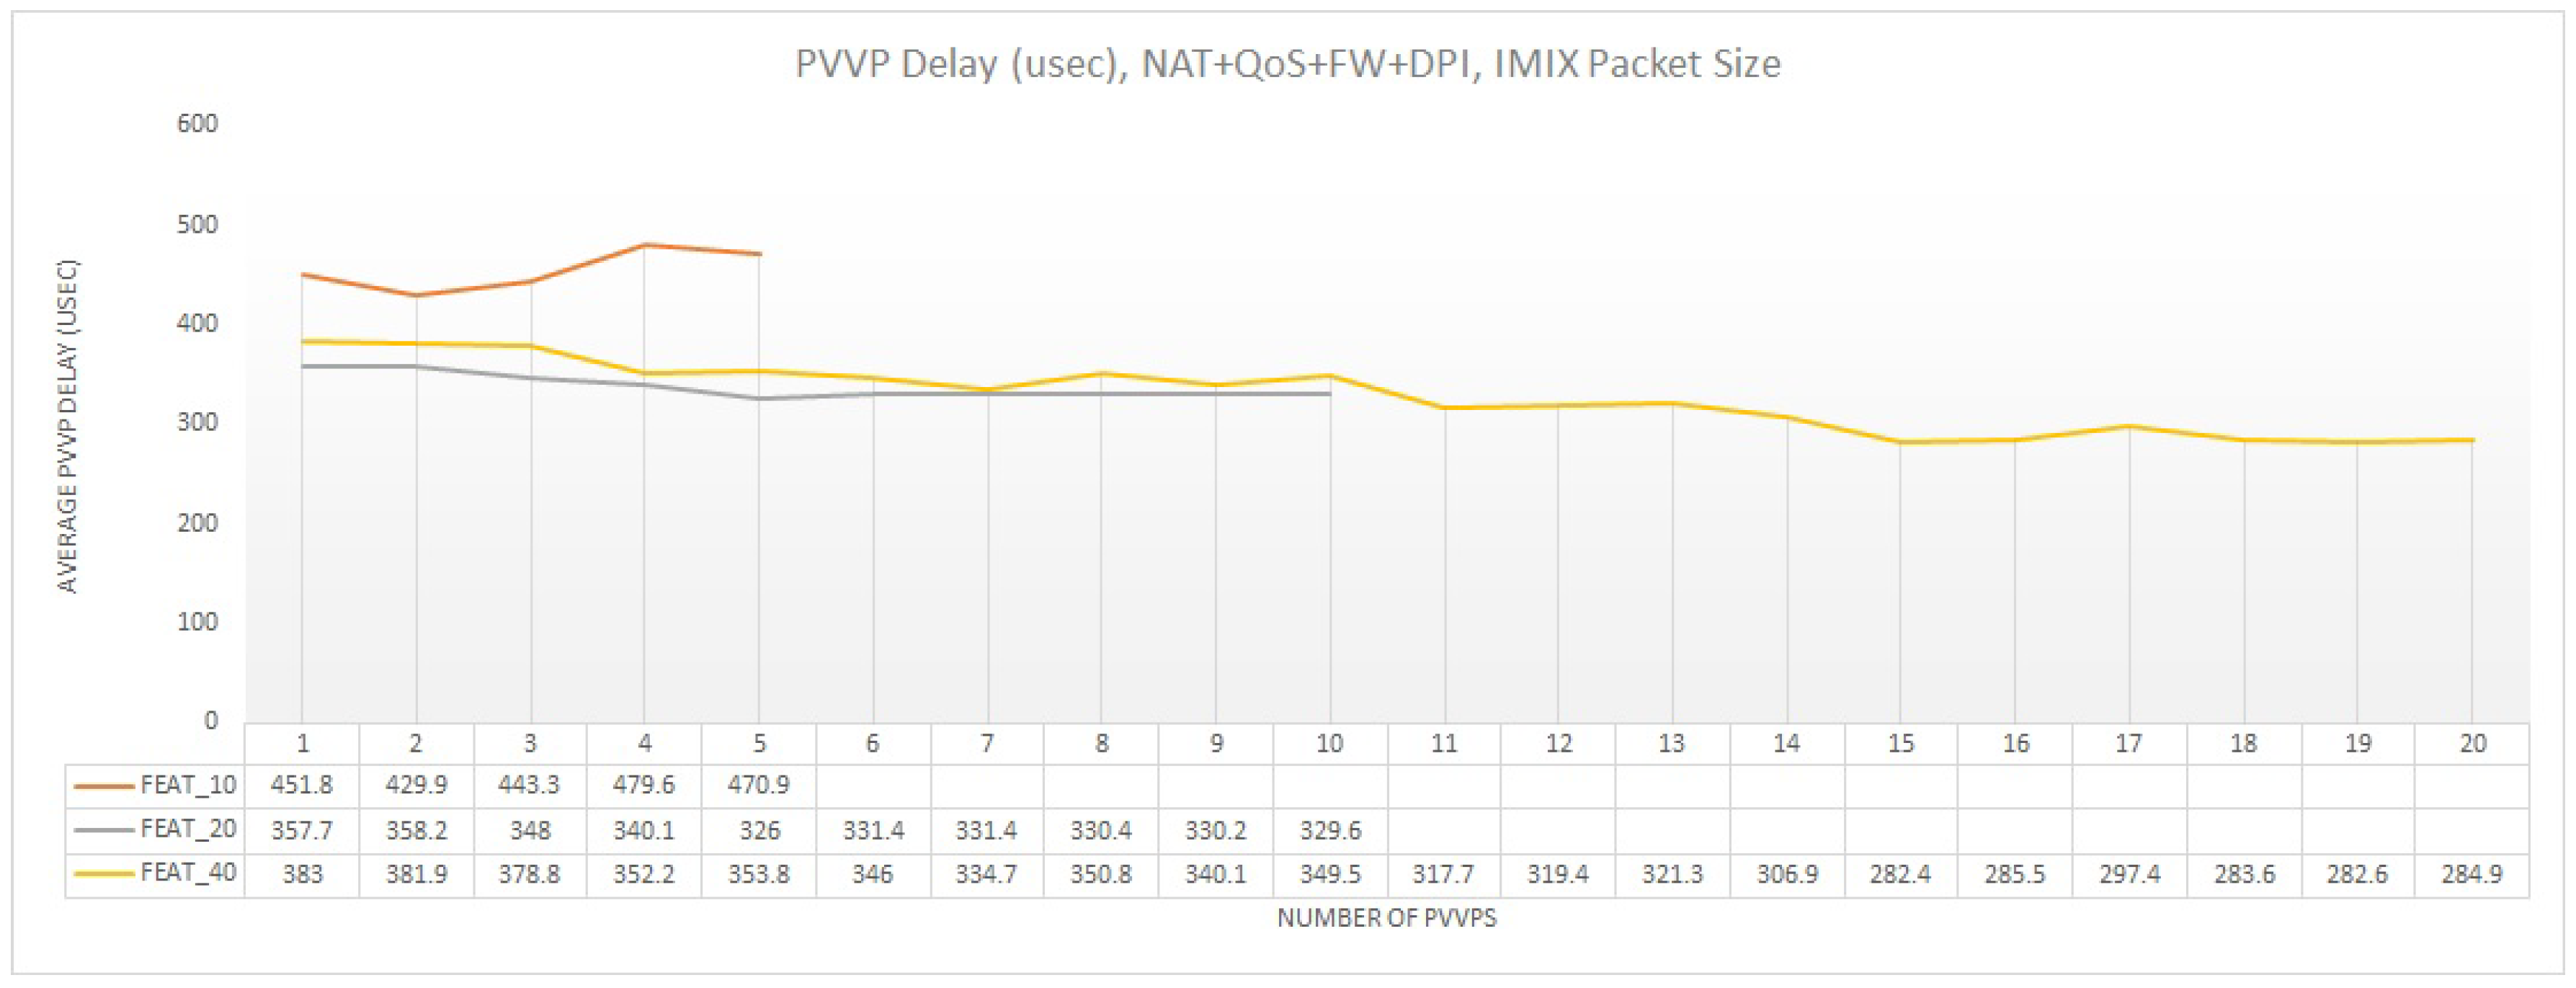
Finally, Figure 17 depicts the average delay for each PVVP when multiple features are enabled. In this case, we can quantify the impact of having both multi-feature and internal chaining enabled on the delay. This combination, results in the highest possible delay. Specifically, for an undersubscribed system (FEAT_10) the average delay ranges between 450 usec to 480 usec having an ascending trend, since the average throughput per PVVP increases according to the best case additive scenario and stressing the buffers of the pNIC by including an increased queuing delay. Nonetheless, for the oversubscription configurations (FEAT_20 and FEAT_40), the average throughput increase is not additive, and thus the average throughput per PVVP drops, resulting in a descending delay trend as we increase the number of PVVPs.
4.3. Results Discussion
The above results demonstrate the impact of the deployment and configuration of the VNFs and virtualized system in the overall performance. In general, it is safe to say that the higher the performance the higher the cost of the deployment solution. This deployment cost is usually referred to as the computational and communication resources a service chain needs to in order to be provisioned [33]. For example, for all tested scenarios the single-feature deployment presents higher throughput and delay performance compared to multi-feature deployment. However, a single-feature deployment would lead to higher number of deployed VMs, higher resource consumption and thus higher deployment cost. In our experiments, the multi-feature VMs include a NAT, FW, QoS, and DPI functionalities that with a single-feature approach would result in 4 VMs. Nonetheless, the multi-feature approach can reduce the maximum attained performance from 15% for an undersubscribed system to 55% for an oversubscribed system.
The type of chaining can also impact the overall performance and cost. For a PVP approach, we can maximize the performance; however, this is at the expense of an additional cost. If we want to chain two VMs with a PVP approach this either mean that we have to send the traffic back to the switch to reach the second VM, adding communication resources for the chaining, or using a second server to deploy a second VM, adding both computational and communication resources. In contrast, the PVVP approach allows the traffic to be handled internally, thus minimizing the communication costs, with a decrease however, in the throughput and delay performance. This decrease is quantified to an approximately 48–50% performance reduction regardless the type of feature and CPU allocation configuration made.
The final aspect of performance examined is the oversubscription. Oversubscription can enhance the VM consolidation and the sharing of resources, contributing significantly into the cost reduction. However, this cost reduction sacrifices a portion of the overall performance. In detail, we ascertain that oversubscription can reduce the system throughput and increase the average delay. The impact becomes more severe for higher ratios of oversubscription. Nonetheless, we also proved that oversubscription can positively contribute to both cost reduction and performance maximization, when the VNFs apply light-weight processing functions. Specifically, for single-feature VNFs, when applying only simple IPv4 forwarding the impact of oversubscription is negligible regardless the type of chaining and the factor of oversubscription used. In contrast, when applying processing-intensive features, oversubscription is not anymore contributing positively in the additive system throughput. For instance, in case a multi-feature deployment is selected, a 2:1 oversubscription factor results in a much more shallower throughput increase, however the maximum attained system throughput is similar to the undersubscription scenario. The oversubscription becomes more problematic for a factor of 4:1, where the maximum system throughput is reduced by 45% for both PVP and PVVP deployments, significantly affecting the individual chain throughput.
5. Conclusions
In this paper, we analyzed the performance of running multiple VNFs under different chaining technologies, feature configurations, and oversubscription ratios using the SR-IOV as our primary I/O architecture. Such a system configuration is becoming increasingly popular in cloud-based deployments where the same server can be virtualized to offer network services to different end-users. Our results demonstrated the performance we can achieve in terms of the overall system throughput and the average delay per chain, for an incremental number of chained and unchained VMs. Our goal was to show realistic deployment VNF solutions that can find a good trade-off between overall performance and deployment cost. The main findings of such an analysis revealed that multi-feature deployments even they can be cost-efficient solutions they can have a direct impact on the performance of the VNFs. Furthermore, if a multi-feature deployment is combined with an oversubscribed system the throughput and delay would be considerably affected, especially when allocating the same physical core for four vCPUs from two different VMs. Nonetheless, even with this configuration, an acceptable average throughput and delay may be provided that can be sufficient for specific applications. Finally, the internal chaining adds another bottleneck in the communication path that should be taken into consideration during the capacity planning of the infrastructure. Future research items include the testing of contenarized VNFs and their comparison to VM-based deployments.
Author Contributions
All authors contributed equally in Conceptualization, Investigation and Writing—original draft. All authors have read and agreed to the published version of the manuscript.
Funding
This research received no external funding.
Conflicts of Interest
The authors declare no conflict of interest.
Abbreviations
The following abbreviations are used in this manuscript:
| NFV | Network Function Virtualization |
| VNF | Virtualized Network Function |
| COTS | Custom off the shelf |
| VM | Virtual Machine |
| SFC | Service Function Chain |
| KPI | Key Performance Indicator |
| FPGA | Field Programmable Gate Arrays |
| IPSec | Internet Protocol Security |
| IDS | Intrusion Detection System |
| FW | Firewall |
| NAT | Network Address Translation |
| I/O | Input/Output |
| QoS | Quality of Service |
| DPI | Deep Packet Inspection |
| IMS | IP Multimedia Subsystem |
| IDS | Intrusion Detection System |
| NIC | Network Interface Card |
| OVS | Open vSwitch |
| DPDK | Data Plane Development Kit |
| FD.io VPP | Fast Data Input/Output Vector Packet Processing |
| NAPI | Linux New API |
| PA-Flow | Packet Aggregation Flow |
| pNIC | physical NIC |
| vNIC | virtual NIC |
| PF | Physical Function |
| VF | Virtual Function |
| PVP | Physical-to-VM-to-Physical |
| PVVP | Physical-to-VM-to-VM-to-Physical |
| VEB | Virtual Ethernet Bridge |
| VEPA | Virtual Ethernet Port Aggregator |
| pCPU | physical CPU |
| vCPU | virtual CPU |
| lCPU | logical CPU |
| DUT | Device Under Test |
| CEF | Cisco Express Forwarding |
References
- Chiosi, M.; Larke, D.; Feger, J.; Bugenhagen, M.; Khan, W.; Fargano, M.; Chen, C.; Huang, J.; Benitez, J.; Michel, U.; et al. Network Function Virtualization: An Introduction, Benefits, Enablers, Challenges & Call for Action. In Proceedings of the SDN and OpenFlow World Congress, Darmstadt, Germany, 22–24 October 2012. [Google Scholar]
- Service Function Chaining (SFC) Architecture. Available online: https://tools.ietf.org/html/rfc7665 (accessed on 19 October 2015).
- Intel Corporation. Pci-Sig SR-IOV Primer: An Introduction to SR-IOV Technology. Available online: http://www.intel.com/content/www/us/en/pci-express/pci-sig-sr-iov-primer-sr-iov-technology-paper.html (accessed on 13 September 2010).
- Cisco, Cisco Cloud Services Router 1000v Series. Available online: http://www.cisco.com/c/en/us/products/routers/cloud-services-router-1000v-series/index.html (accessed on 13 September 2020).
- Forconesi, M.; Sutter, G.; Lopez-Buedo, S.; de Vergara, J.E.L.; Aracil, J. Bridging the gap between hardware and software open-source network developments. IEEE Netw. 2014, 28, 13–19. [Google Scholar] [CrossRef]
- Kachris, C.; Sirakoulis, G.; Soudris, D. Network Function Virtualization based on FPGAs:A Framework for all-Programmable network devices. arXiv 2014, arXiv:1406.0309. [Google Scholar]
- Falkner, M.; Leivadeas, A.; Lambadaris, I.; Kesidis, G. Performance analysis of virtualized network functions on virtualized system architectures. In Proceedings of the 2016 IEEE 21st International Workshop on Computer Aided Modelling and Design of Communication Links and Networks (CAMAD), Toronto, ON, Canada, 23–25 October 2016; pp. 71–76. [Google Scholar]
- Pitaev, N.; Falkner, M.; Leivadeas, A.; Lambadaris, I. Multi-VNF performance characterization for virtualized network functions. In Proceedings of the 2017 IEEE Conference on Network Softwarization (NetSoft), Bologna, Italy, 3–7 July 2017; pp. 1–5. [Google Scholar]
- Pitaev, N.; Falkner, M.; Leivadeas, A.; Lambadaris, I. Characterizing the performance of concurrent virtualized network functions with OVS-DPDK, FD.io VPP, and SR-IOV. In Proceedings of the ACM International Conference on Performance Engineering (ICPE), Berlin, Germany, 9–13 August 2018; pp. 285–292. [Google Scholar]
- Cao, L.; Sharma, P.; Fahmy, S.; Saxena, V. NFV-VITAL: A Framework for Characterizing the Performance of Virtual Network Functions. In Proceedings of the IEEE International Conference on Network Function Virtualization and Software Defined Network (NFV-SDN), San Francisco, CA, USA, 18–21 November 2015; pp. 93–99. [Google Scholar]
- Paolino, M.; Nikolaev, N.; Fanguede, J.; Raho, D. Snabbswitch user space virtual switch benchmark and performance optimization for NFV. In Proceedings of the IEEE Conference on Network Function Virtualization and Software Defined Networking (NFV-SDN), San Francisco, CA, USA, 18–21 November 2015; pp. 86–92. [Google Scholar]
- Dong, Y.; Yang, X.; Li, X.; Li, J.; Tian, K.; Guan, H. High performance network virtualization with SR-IOV. In Proceedings of the IEEE International Symposium on High Performance Computer Architecture (HPCA), Bangalore, India, 9–14 January 2010; pp. 1–10. [Google Scholar]
- Huang, Z.; Ma, R.; Li, J.; Chang, Z.; Guan, H. Adaptive and scalable optimizations for high performance SR-IOV. In Proceedings of the 2012 IEEE International Conference on Cluster Computing, Beijing, China, 24–28 September 2012; pp. 459–467. [Google Scholar]
- Taguchi, Y.; Kawashima, R.; Nakayama, H.; Hayashi, T.; Matsuo, H. PA-Flow: Gradual Packet Aggration at VIrtual Network I/O for Efficient Service Chaining. In Proceedings of the IEEE International Conference on Cloud Computing Technology and Science (CloudCom), Hong Kong, China, 11–14 December 2018; pp. 335–340. [Google Scholar]
- Kawashima, R.; Nakayama, H.; Hayashi, T.; Matsuo, H. Evaluation of Forwarding Efficiency in NFV-Nodes Toward Predictable Service Chain Performance. IEEE Trans. Netw. Serv. Manag. 2017, 14, 920–933. [Google Scholar] [CrossRef]
- Validating Cisco’s NFV Infrastructure Part 1. Available online: http://www.lightreading.com/nfv/nfv-tests-and-trials/validating-ciscos-nfv-infrastructure-pt-1/d/d-id/718684 (accessed on 13 September 2020).
- Validating Cisco’s NFV Infrastructure Part 2. Available online: http://www.lightreading.com/nfv/nfv-tests-and-trials/validating-ciscos-nfv-infrastructure-pt-2/d/d-id/718898 (accessed on 13 September 2020).
- Emmerich, P.; Raumer, D.; Wohlfart, F.; Carle, G. Performance characteristics of virtual switching. In Proceedings of the 2014 IEEE 3rd International Conference on Cloud Networking (CloudNet), Luxembourg, 8–10 October 2014; pp. 120–125. [Google Scholar]
- Emmerich, P.; Raumer, D.; Wohlfart, F.; Carle, G. Assessing soft- and hardware bottlenecks in pc-based packet forwarding systems. In Proceedings of the Intertional Conference on Networks (ICN), Anaheim, CA, USA, 16–19 February 2015; pp. 78–83. [Google Scholar]
- Bonafiglia, R.; Cerrato, I.; Ciaccia, F.; Nemirovsky, M.; Risso, F. Assessing the performance of virtualization technologies for NFV: A preliminary benchmarking. In Proceedings of the IEEE European Workshop on Software Defined Networks (EWSDN), Bilbao, Spain, 30 September–2 October 2015; pp. 67–72. [Google Scholar]
- Zhang, W.; Liu, G.; Zhang, W.; Shah, N.; Lopreiato, P.; Todeschi, G.; Ramakrishnan, K.; Wood, T. OpenNetVM: A platform for high performance network service chains. In Proceedings of the ACM Conference on Hot Topics in Middeboxes and NFV (HotMIddlebox), New York, NY, USA, 26 August 2016; pp. 26–31. [Google Scholar]
- Paolino, M.; Fanguede, J.; Nikolaev, N.; Raho, D. Turning an open source project into a carrier grade vswitch for NFC: Vosyswitch challenges & results. In Proceedings of the IEEE International Conference on Network Infrastructure and Digital Content (NIDC), Beijing, China, 23–25 September 2016; pp. 22–27. [Google Scholar]
- SR-IOV for NFV Solutions Practical Considerations and Thoughts. Available online: https://www.intel.com/content/dam/www/public/us/en/documents/technology-briefs/sr-iov-nfv-tech-brief.pdf (accessed on 13 September 2020).
- Leivadeas, A.; Falkner, M.; Pitaev, N. Analyzing Service Chaining of Virtualized Network Functions with SR-IOV. In Proceedings of the IEEE International Conference on High Performance Switching and Routing, Newark, NJ, USA, 11–14 May 2020; pp. 1–7. [Google Scholar]
- Wang, C.; Spatscheck, O.; Gopalakrishnan, V.; Xu, Y.; Applegate, D. Toward High-Performance and Scalable Network Functions Virtualization. IEEE Int. Comput. 2016, 20, 10–20. [Google Scholar] [CrossRef]
- Peripheral Component Interconnect Special Interest Group PCI-CIG. Available online: https://pcisig.com/ (accessed on 13 September 2020).
- NIC Drivers DPDK, I40E/IXGBE/IGB Virtual Function Driver. Available online: https://doc.dpdk.org/guides-16.04/nics/intel_vf.html (accessed on 13 September 2020).
- Leivadeas, A.; Falkner, M.; Lambadaris, I.; Kesidis, G. Optimal Virtualized Network Function Allocation for an SDN enabled Cloud. Elsevier Comput. Stand. Interfaces 2017, 54, 266–278. [Google Scholar] [CrossRef]
- Debian, Why Huge Pages? Available online: https://wiki.debian.org/Hugepages (accessed on 13 September 2020).
- Leivadeas, A.; Kesidis, G.; Falkner, M.; Lambadaris, I. A graph partitioning game theoretical approach for the VNF service chaining problem. IEEE Trans. Netw. Serv. Manag. 2017, 14, 890–903. [Google Scholar] [CrossRef]
- NFVbench. Available online: https://wiki.opnfv.org/display/nfvbench/NFVbench (accessed on 13 September 2020).
- Bradner, S.; McQuaid, J. Benchmarking Methodology for Network Interconnect Devices. IETF Technical Report. 1999. Available online: https://www.ietf.org/rfc/rfc2544.txt (accessed on 13 September 2020).
- Leivadeas, A.; Falkner, M.; Lambadaris, I.; Ibnkahla, M.; Kesidis, G. Balancing delay and cost in virtual network function placement and chaining. In Proceedings of the IEEE International Conference on Network Softwarization and Workshops (NetSoft), Montreal, QC, Canada, 25–29 June 2018; pp. 433–440. [Google Scholar]
Figure 1.
Non SR-IOV Architecture.

Figure 2.
SR-IOV Architecture.

Figure 3.
Single-Feature Deployment.

Figure 4.
Multi-Feature Deployment.

Figure 5.
PVP chaining.

Figure 6.
PVVP chaining.

Figure 7.
CPU allocation in an undersubscribed system.

Figure 8.
CPU allocation in a 2:1 oversubscribed system.

Figure 9.
CPU allocation in a 4:1 oversubscribed system.

Figure 10.
Single-Feature multi-PVP system throughput with CEF.

Figure 11.
Single-Feature multi-PVP average delay with CEF.

Figure 12.
Multi-Feature multi-PVP system throughput with NAT, QoS, FW, and DPI.

Figure 13.
Multi-Feature multi-PVP average delay with NAT, QoS, FW, and DPI.

Figure 14.
Single-Feature multi-PVVP system throughput with CEF.

Figure 15.
Single-Feature multi-PVVP average delay with CEF.

Figure 16.
Multi-Feature multi-PVVP system throughput with NAT, QoS, FW, and DPI.

Figure 17.
Multi-Feature multi-PVVP average delay with NAT, QoS, FW, and DPI.


Table 1.
Details of the experimentation setup.
| Test Component | Description |
|---|---|
| x86 Host | PowerEdge R740 Server: 2 sockets Intel Xeon Gold 5118 2.3 GHz with 12 CPU cores each, |
| 192 GB RAM, and 2 TB SSD SATA storage | |
| Phys. Interfaces | 1 NIC with 2 x 10GE ports; Intel X520-DA2 NIC |
| Hypervisor | Linux kernel 4.15.0-58; Libvirt 4.0.0; QEMU 2.11.1 |
| Switch | Cisco Catalyst WS-C3850-12X48U-L |
| Traffic Generator | NFVBench version 3.5.1 |
| VNFs | Cisco CSR 1000V® virtual Router, IOS XE version 16.06.02; 2 vCPUs, 4GB RAM |
© 2020 by the authors. Licensee MDPI, Basel, Switzerland. This article is an open access article distributed under the terms and conditions of the Creative Commons Attribution (CC BY) license (http://creativecommons.org/licenses/by/4.0/).
Share and Cite
MDPI and ACS Style
Ben Hamed, A.; Leivadeas, A.; Falkner, M.; Pitaev, N. VNF Chaining Performance Characterization under Multi-Feature and Oversubscription Using SR-IOV. Informatics 2020, 7, 33. https://0-doi-org.brum.beds.ac.uk/10.3390/informatics7030033
AMA Style
Ben Hamed A, Leivadeas A, Falkner M, Pitaev N. VNF Chaining Performance Characterization under Multi-Feature and Oversubscription Using SR-IOV. Informatics. 2020; 7(3):33. https://0-doi-org.brum.beds.ac.uk/10.3390/informatics7030033
Chicago/Turabian StyleBen Hamed, Asma, Aris Leivadeas, Matthias Falkner, and Nikolai Pitaev. 2020. "VNF Chaining Performance Characterization under Multi-Feature and Oversubscription Using SR-IOV" Informatics 7, no. 3: 33. https://0-doi-org.brum.beds.ac.uk/10.3390/informatics7030033
Note that from the first issue of 2016, this journal uses article numbers instead of page numbers. See further details here.