
Removal of Acetone Vapor from Air Using a Biotrickling Filter Packed with Polymeric Bioballs


Research Institute of Environmental Protection, Vilnius Gediminas Technical University, LT-10223 Vilnius, Lithuania
*
Author to whom correspondence should be addressed.
Processes 2022, 10(1), 57; https://0-doi-org.brum.beds.ac.uk/10.3390/pr10010057
Submission received: 24 November 2021
/
Revised: 18 December 2021
/
Accepted: 24 December 2021
/
Published: 28 December 2021
(This article belongs to the Special Issue Recent Advances in Biofilter Process Treatment)
Abstract
:Acetone released into the atmosphere can adversely affect human health and the environment. The aim of this work was to evaluate the performance of a laboratory-scale biotrickling filter (BTF) with bioball packing material to remove acetone vapor from contaminated air. The acetone removal efficiency was investigated in two different scenarios: with and without the inoculation of microorganisms. Three strains of bacteria, Pseudomonas putida, Rhodococcus aerolatus, and Aquaspirillum annulus, were used in the BTF. In both cases, the filter units were simultaneously operated for 100 days under three different inlet acetone concentrations (0.18 ± 0.01 g/m3, 0.25 ± 0.01 g/m3, and 0.40 ± 0.02 g/m3) and two different gas flow rates (2.54 and 5.09 m3/h). The results showed that acetone removal was greater in the filter with the inoculated bacteria. In the filter operated without inoculum, the acetone removal efficiency gradually decreased with filtration time from 90.1% to 6.1%. While employing three types of bacteria in the BTF, the efficiency of acetone removal remained relatively stable and varied between 70.2% and 97.6%. The study also revealed that bioballs can be successfully used as a packing material in air biofiltration systems designed for acetone removal from the air.
1. Introduction
Most volatile organic compounds (VOCs) released into the atmosphere can be harmful to the environment and human health [1]. Acetone is one of the most common organic compounds used as a solvent in paint [2], pharmaceutical products [3], polymers processing [4], etc. When released into the air, it can harm the human respiratory system, skin, and eyes [5]. Therefore, it is important to control and eliminate acetone emissions from various industrial sources.
Biotrickling filters (BTFs) and biofilters (BFs) are some of the most efficient, simplest, and inexpensive technologies for the removal of VOCs from the air, including ammonia, butanol, acetone, xylene, and toluene [6,7,8,9,10]. They are also some of the most environmentally friendly technologies since the biofiltration process is based on the biodegradation of VOCs into non-toxic substances (i.e., water and CO2) by microorganisms [11]. Biotrickling filters are the most efficient at removing hydrophilic VOCs from the air; however, the removal of hydrophobic compounds can also be accomplished efficiently by regulating various operational parameters of biofiltration devices [12,13]. The removal of VOCs is dependent on the microorganisms present in the packing material of the BTF. Different types of microorganisms such as bacteria, fungi, and yeasts can be used to degrade the target pollutant. For the biodegradation of hydrocarbons (e.g., acetone), heterotrophic bacteria such as the Bacillus and Pseudomonas species have commonly been used in biofiltration systems [14,15].
The air purification process of BTFs is influenced by their packing material. Air contaminated by VOCs passes through this packing material that has been treated with a mineral salt solution [16]. The packing material provides support for the microorganism growth and contributes to the formation of a biofilm layer. VOCs are absorbed by the biofilm layer, which then ensures the biodegradation of the captured VOCs [17]. The packing material characteristics, such as the surface area, porosity, and humidity as well as adsorption and absorption properties determine the growth and development of the microorganisms, which ensure efficient cleaning of the air forced through the biofiltration systems [18].
The selection of the packing material is important in order to ensure the long-term stability of the BTF performance. Natural packing materials such as compost, coconut fiber, peat [19], and wood chips [20] are commonly used as packing materials as they have large surface areas, good moisture retention, high void fraction, and low bulk density [21]. The main disadvantages of natural packing materials are their low durability and low long-term stability, which led to an investigation into the application of synthetic materials. Various synthetic packing materials such as polyurethane foam, perlite granules [22], lava rock [19], etc., have been used in different air biofiltration studies with varying degrees of success. Pielech-Przybylska et al. studied acetone removal in BTFs packed with either plexiglass chips or coconut fiber and found that the maximum acetone elimination capacities were 95.7 g/(m3 h) and 77.8 g/(m3 h), respectively. The packing material made of plexiglass chips was more durable and had a greater specific surface area compared to that made of coconut fiber [23].
Eco-friendly plastic biological ball filters (hereafter referred to as “bioballs”) were originally used for microorganism growth in aquarium systems [24]. Microorganisms attach to the surface of the bioballs and form a biofilm layer. In recent years, various studies have been conducted using bioballs as biofilm carriers for the removal of nitrogen, phosphorus, and organic compounds from water [25,26]. Studies have shown that bioballs improved the growth of microorganisms that degrade organic compounds and prevented the colonization of harmful bacterial species [27]. In the study of Masłoń and Tomaszek (2015), the bioballs were applied in a moving bed biofilm reactor, and it was found that they provided better attachment for microbial colonization than conventional plastic carriers [25]. In addition, the bioballs could be used as an inert packing material in air biofiltration systems. However, there has been a limited number of studies that investigate various VOC treatments in biofiltration systems using bioballs as a packing material. Karthikeyan et al. (2017) used robust methanotrophs for CH4 removal with biofilters packed with plastic bioballs. It was found that pilot-scale outdoor biofilters removed about 95–97% CH4 at an air-flow rate of 0.1 L/min and with 1% CH4 in air. In addition, thick methane-utilizing bacterial biofilms were observed on the bioball packing material [28]. Whether plastic bioballs are suitable as a medium for bacterial growth in air biofiltration systems will need additional investigation.
Several studies have been performed to remove acetone from contaminated air using BTFs or BFs. Balasubramanian et al. (2012) studied the performance of laboratory-scale BTF packed with polyvinyl chloride to remove acetone from an air stream. The inlet loading rate of the pollutant was varied from 52.4 to 559.1 g/(m3 h), and the volumetric flow rate was varied from 0.09 to 0.24 m3/h. The authors found that 100% acetone removal efficiency was achieved at inlet loading rates of up to 320 g/(m3 h) [29]. Pielech-Przybylska et al. (2006) achieved almost 100% acetone removal at inlet loading rates of up to 97 and 40 g/(m3 h) in laboratory-scale BTFs packed with plexiglass chips and coconut fiber, respectively. These efficiencies were obtained under acetone inlet loading rates of 33.4–119.6 g/(m3 h) and air-flow rates of 0.2–0.3 m3/h [23]. In another study, Chan and Lai (2010) obtained a maximum acetone elimination capacity of 50.5 g C/(m3 h) in BF under pollutant loads of up to 700 g C/(m3 h) and an air-flow rate of 0.102 m3/h [30]. These studies have confirmed that high acetone removal efficiency can be achieved at low airflow rates.
In the present study, a laboratory-scale BTF using plastic bioballs as a packing material was designed. A consortium of microorganisms consisting of Pseudomonas putida, Rhodococcus aerolatus, and Aquaspirillum annulus that could effectively decompose acetone was used. The overall aim of the study was to evaluate the performance of the designed BTF loaded with bioballs to purify air from acetone vapor. The BTF was run in continuous mode under different inlet pollutant concentrations and airflow rates. In addition, to evaluate the influence of bacteria on acetone-removal efficiency, a parallel investigation was performed using the same type of filter unit only without an inoculation of bacteria.
2. Materials and Methods
2.1. Experimental Set-Up
The laboratory-scale system consisted of a BTF unit, a nutrient-solution tank, a pollutant supply chamber, two aspirators (MIGUNOV 822 and APV 4–12), and rubber connection hoses, which were connected to the BTF (Figure 1). A BTF unit consisted of a plexiglass column with an inner diameter of 0.15 m and a height of 1.0 m. The column of BTF was filled with plastic bioballs (Figure 2). Bioballs are designed in such a way that they can provide increased surface area within the volume they occupy for microorganisms’ growth [24]. The bioballs had a spherical shape and porous structure. The diameter of one bioball was 22 ± 1 mm, and the specific surface area was 620 m2/m3. The porosity of the bioball packing material was 75%.
To maintain an even distribution of moisture and airflow throughout the entire volume of the packing material and to reduce the pressure drop of the BTF, the packing material layer was divided into 5 sections (the height of each section was 0.13 m) using metal sieves. Each section was filled with a 0.10 m thick bioball layer. The distances between bioball layers were 0.03 m. The nutrient-solution tank was installed at the bottom of the BTF to capture excess water that was drained through the metal sieves.
The pollutant used in the study was acetone. A solution of water and acetone was added to the pollutant supply chamber to achieve the desired concentration of acetone vapor in the air. The biotrickling filter was operated in up-flow mode. Air contaminated with acetone vapor was drawn from the pollutant supply chamber and into the BTF using two aspirators connected to the device. The aspirators were also used to regulate the speed of airflow through the BTF. The contaminated air entered the BTF through an inlet of the device and flowed up through the five sections to an outlet at the top of the device. After each section, sampling sites of 0.013 m in diameter were inserted to measure pollutant concentration and air velocity. Sampling sites were sealed with rubber plugs.
The biotrickling filter was continuously operated at two different gas flow rates, namely 2.54 and 5.09 m3/h. At these flow rates, the empty bed contact times (EBCT) were 12.5 and 6.3 s, respectively. The experiments were performed at volumetric gas loadings (which shows the volume of gas passed 1 m3 of packing material per 1 h) of 288 and 576 m3/(m3 h), respectively. Acetone treatment efficiency was studied at the aforementioned gas flow rates and at the three different inlet acetone concentrations, namely 0.18 ± 0.01 g/m3, 0.25 ± 0.01 g/m3, and 0.40 ± 0.02 g/m3. These concentrations were obtained by selecting the ratio of acetone and deionized water, which were 1:350, 1:325, and 1:300. The concentrations of acetone in the treated air were measured after each section of the packing material.
Before the experiments, the packing material was moistened using a nozzle installed on the top of the unit. The nutrient solution was pumped to the nozzle using a pump installed in the nutrient-solution tank. The moisture content of the packing material was kept at approximately 75%.
The efficiency of acetone removal was simultaneously investigated in two different cases: (1) without inoculation of microorganisms (acetone absorption in nutrient solution); (2) with inoculated microorganisms. In each case, the filter units were operated in four different phases, as shown in Table 1.
2.2. Inoculation Procedure
Microorganisms of the genera Pseudomonas putida, Rhodococcus aerolatus, and Aquaspirillum anulus were used in the designed BTF. The seeding was performed by filling the nutrient-solution tank with nutrient solution and microorganisms. The nutrient solution consisted of 1 g/L K2HPO4, 0.5 g/L KCl, 0.5 g/L MgSO4·7H2O, 0.1 g/L FeSO4·7H2O, and 0.9 g/L NaNO3. The bacteria concentrations in the nutrient solution were 2.0 × 10⁸ CFU/mL, 1.5 × 10⁸ CFU/mL, and 2.0 × 10⁴ CFU/mL for Pseudomonas putida, Rhodococcus aerolatus, and Aquaspirillum annulus, respectively. The nutrient solution from the nutrient-solution tank was pumped to the nozzle using a circulating pump and sprayed on the packing material at an intensity of 0.1 L/min. The sprayed, activated water droplets entered each section below through the openings of the metal sieves. The drained solution was pumped back into the nutrient-solution tank.
Microorganisms present in nutrient solution attached to the surface of bioballs and formed the biofilm. In order to acclimate inoculated microorganisms before the experiments, air contaminated with acetone was supplied to the BTF for two days; the concentration of acetone in the air was 0.05 mg/m3. This gave the microorganisms the oxygen and carbon they required. Acetone was transferred from the gas phase to the liquid phase (i.e., a biofilm) due to the concentration gradient between the two phases. A scheme of the pollutant biofiltration process on bioballs is shown in Figure 3.
2.3. Analytical Methods
Acetone concentration in the airstream was measured at each BTF section (at packing material heights of 0.1, 0.2, 0.3, 0.4, and 0.5 m) using a MiniRAE 2000 VOC monitor. The sampling rate of the device for the acetone-contaminated air was 450–550 cm3/min. The measuring range of the device was 0–10,000 mg/m3. The accuracy of the measurement at a pollutant concentration of 0–2000 ppm was ±2 ppm.
Removal efficiency (%) of acetone was calculated as follows:
where
is the inlet acetone concentration (g/m3), and is acetone concentration measured at a certain height of the packing material (g/m3).
Elimination capacity (g/(m3 h)) was calculated as follows:
where
is the filter packing material volume (m3), and is the air-flow rate (m3/h).
Volumetric gas loading (m3/(m3 h)) was calculated as follows:
Empty bed contact time (s) was calculated as follows:
Inlet load of acetone (g/(m3 h)) was calculated as follows:
2.4. Analysis of Bacteria
For bacterial analysis, the packing material samples were collected at days 1, 12, 25, 26, 38, 50, 51, 63, 75, 76, 88, and 100 of biofiltration. Samples were taken from each packing material section (at section heights of 25, 50, and 75 mm) using tweezers. The taken samples were placed in 100 mL sterile dishes. The serial dilution technique was used for the identification of bacteria. The bacterial suspensions were prepared at 1:1000, 1:10,000, 1:100,000, 1:1,000,000. Before the seeding the tubes were shaken. Aliquots of 1 mL of the appropriate dilution of the suspension were plated in Petri dishes and filled with nutrient agar. Nutrient agar consisted of 15.0 g/L agar, 5.0 g/L peptone, 5.0 g/L NaCl, 5.0 g/L yeast extract, and 1 g/L meat extract. The number of bacteria and their types were determined using a Nikon ECLIPSE Ci-L microscope. Different species of bacteria were identified according to the different shapes of the bacterial cells.
2.5. Statistical Analysis
Statistical analysis was performed using the Microsoft Excel program. Acetone concentration measurements were repeated 3 times. The Shapiro–Wilks test and Bartlett’s test were used to analyze data normality and the homogeneity of variances, respectively. Calculated data are presented as mean values ± standard deviations. An analysis of variance (ANOVA) followed by a post hoc Tukey test (α = 0.05) was used to differentiate between the means of acetone removal efficiencies and its elimination capacities at different days and different operation phases. In addition, ANOVA was also used to compare the means of bacteria counts obtained at specified days. Pearson’s correlation was used to determine the relationship between acetone elimination capacity and its inlet load in the filter without inoculum.
3. Results and Discussion
3.1. Acetone Removal in the Trickling Filter without Using the Inoculum
In the first case of the experiment, the acetone removal efficiency was determined without the inoculation of the packing material. Therefore, the efficiency of the contaminant removal by the trickling filter was studied considering only the acetone absorption in the nutrient solution. The trickling filter was operated in four different phases, which are described in Table 1. During the initial phase of the filtration, the volumetric air-flow rate was fixed at 2.54 m3/h, and the inlet acetone concentration was maintained at approximately 0.18 g/m3 (Figure 4). On the first day of filtration, the acetone removal was the highest and reached 90.1%. At 25 days, the removal efficiency had steadily decreased to 75.6%. When the inlet acetone concentration was increased to 0.25 g/m3, the acetone removal efficiency reached 66.2% (on day 26) and further decreased to 42.2% (on day 50). During Phase III, when the contaminant concentration remained at 0.25 g/m3 and the air-flow rate was increased to 5.09 m3/h, the acetone removal efficiency was in the range of 20.3–32.8%. When the inlet contaminant concentration was increased again (i.e., Phase IV) from 0.25 to 0.40 g/m3 without changing the air-flow rate, the acetone removal efficiency was in the range of 6.1–15.2%.
As can be seen from Figure 4, the acetone removal efficiency decreased during all the phases the longer the trickling filter was in operation. In addition, a negative correlation (r = −0.73) between its acetone-elimination capacity and acetone inlet load was observed (Figure 5). Acetone vapor has a high solubility in water [31]. The decrease in acetone-elimination capacity of BTF could be related to the increase in the dissolved acetone concentration in the nutrient solution over time, which subsequently caused the decrease in its solubility capacity in the nutrient solution.
3.2. The Acetone Removal in the Biotrickling Filter with Activated Packing Material
Another investigation was performed by employing VOC-decomposing bacteria (Pseudomonas putida, Rhodococcus aerolatus, and Aquaspirillum anulus) in the BTF. The biofilm on the packing material firstly absorbed acetone, which was subsequently decomposed in the aqueous phase by the microorganisms [32]. The performance of the BTF was dependent upon inlet pollutant load or volumetric airflow. As in the first experiment, the BTF was operated in four different phases, and the inlet load of acetone was maintained at approximately 52, 73, 145, and 230 g/(m3 h) (Figure 6).
The highest biofiltration efficiency, varying from 96.1 to 97.6%, was achieved in Phase I when the airflow was maintained at 2.54 m3/h, and the initial pollutant concentration was the lowest (0.18 ± 0.01 g/m3). On day 26, when the air-flow rate remained at 2.54 m3/h and inlet acetone concentration was increased to 0.25 g/m3, the acetone removal efficiency significantly decreased (p < 0.05) to 87.1%. Up to day 50, the acetone removal efficiency steadily increased, reaching 97.2%. In Phase III, with an increase in the air-flow rate, an initial decrease in acetone removal efficiency was observed, as compared to the previous phase. The acetone removal efficiency was restored in approximately 12 days, and it exceeded 90% during days 63–75 of BTF operation. The increase of the inlet pollutant concentration to 0.40 g/m3 (Phase IV) led to the decrease in biofiltration efficiency to 70.2%. The acetone removal efficiency steadily increased up to and including day 100, reaching 90.1%.
For efficient BTF operation, the optimal inlet pollutant concentration and the appropriate air-flow rate must be selected [33]. On average, the acetone removal efficiency was significantly higher (p < 0.05) at lower inlet concentrations (0.18–0.25 g/m3) and an air-flow rate of 2.54 m3/h, as compared to an inlet pollutant concentration of 0.40 g/m3 and an air-flow rate of 5.09 m3/h. To ensure more efficient pollutant degradation in the BTF at a higher inlet acetone concentration (0.40 g/m3), it would be necessary to reduce the air-flow rate to 2.54 m3/h. The longer the contact time between acetone and the packing material is the higher the removal efficiency of the acetone should be.
The results showed successful acetone degradation via used bacteria, and therefore, the inoculation of the bacterial community resulted in a better performance of the BTF, as compared to the trickling filter. Without inoculum, high acetone removal efficiency (approximately 90%) was only achieved within the first 6 days of operation due to the high acetone absorption in the nutrient solution. Later, with the increase in operation time acetone removal decreased substantially due to the increased dissolved acetone concentration in the solution. The bacteria notably improved the acetone removal process of contaminated air, especially in Phases II–IV. On average, the acetone removal efficiency by BTF with inoculum was 13.0%, 37.6%, 62.9%, and 72.4% higher for phases I, II, III, and IV, respectively, than that by the same trickling filter without inoculum. The lowest difference between the two filters was obtained in Phase I. This could imply that the high and steady acetone removal efficiency by BTF obtained during Phase I was due to the initial high acetone absorption in the nutrient solution, considering that the bacterial community had not yet been sufficiently acclimated to the treated contaminant [7]. The decrease in the acetone removal efficiency of the BTF was only observed immediately after the increase of the inlet acetone concentration or a decrease in the EBCT, likely due to the “shock load” of the pollutant. By increasing the concentration of the acetone vapor in the treated air, the efficiency of the device decreased due to the microorganisms not being able to fully decompose large amounts of acetone. In industrial uses, the biofilters or BTFs are usually operated under different contaminant inlet loads. Therefore, the increase in the acetone concentration during the industrial process could result in a decrease in its removal efficiency [34].
The effect of the inlet load of acetone on its elimination capacity is shown in Figure 7. A near-linear relationship (almost 100% acetone removal) between the elimination capacity and the inlet load was obtained until an inlet load of 72.1 g/(m3 h). The maximum acetone elimination capacity by BTF was on day 100 of operation, where it reached 207.8 g/(m3 h).
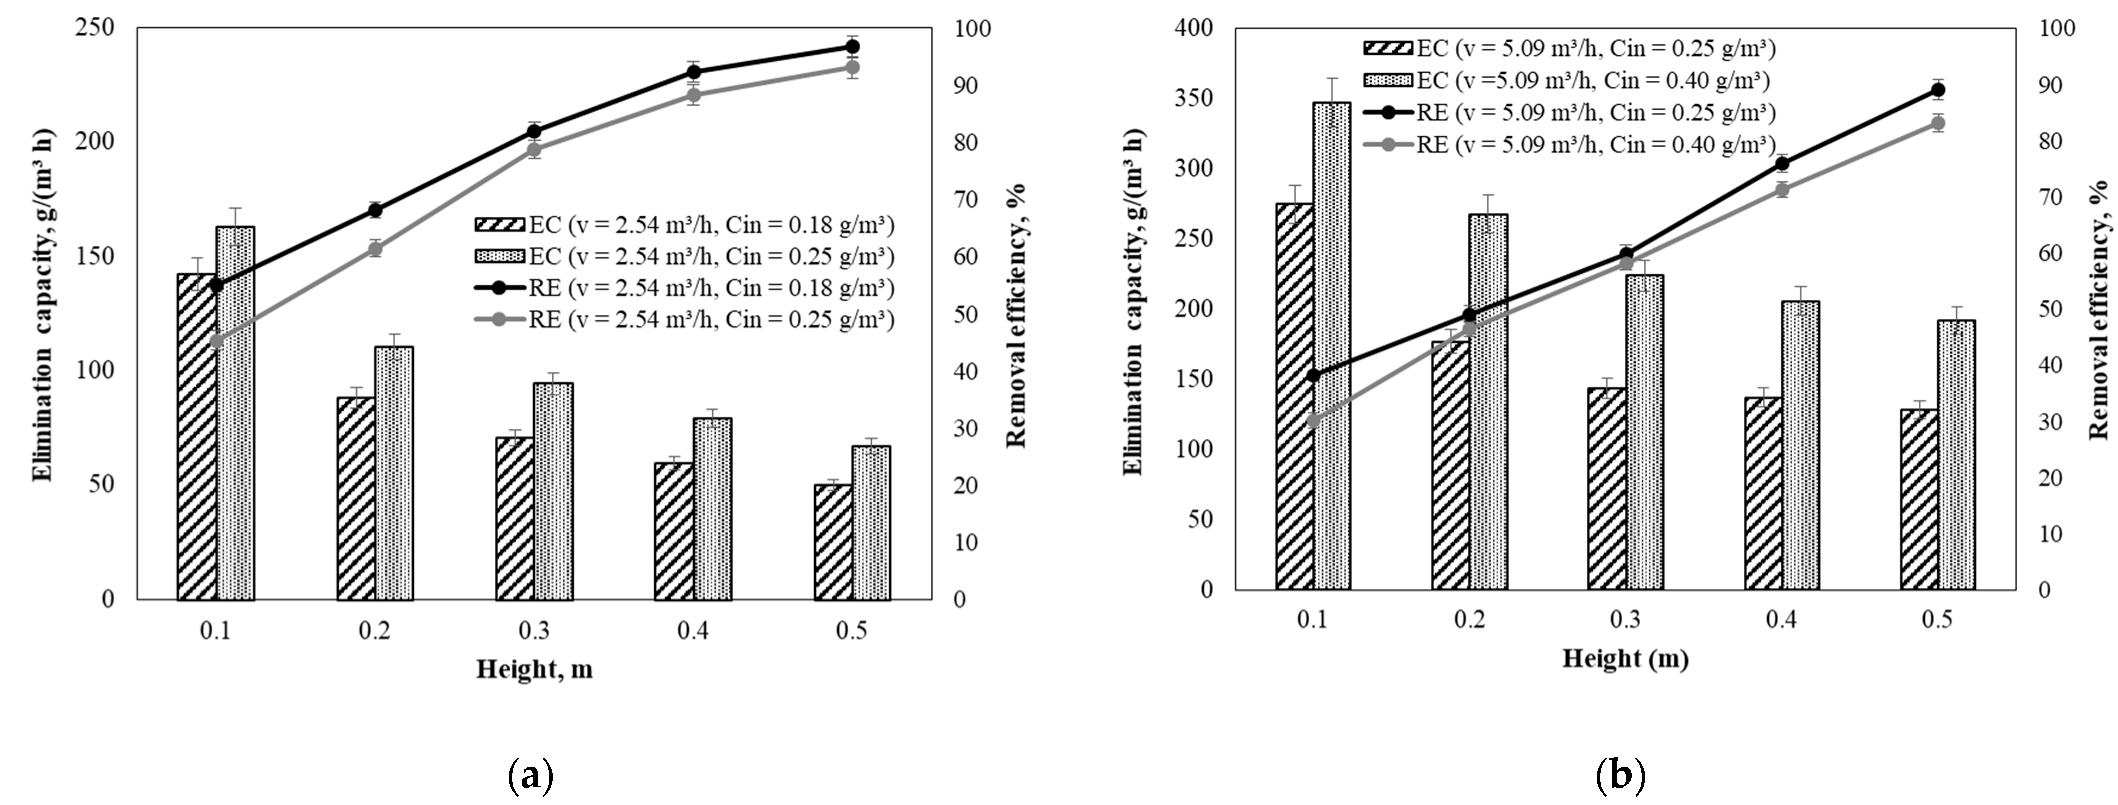
Our experimental studies also determined the dependencies of the biofiltration efficiency on the number of packing material layers at different air-flow rates and different inlet pollutant concentrations (Figure 8).
As predicted, in all cases, the bulk of the contaminant was removed in the first section of the packing material. When the air-flow rate was kept at 2.54 m3/h and the inlet acetone concentration was 0.18 and 0.25 g/m3, the average removal efficiency of acetone after the first section of the packing material was 55.0% and 45.3%, respectively. After the second, third, fourth, and fifth packing material sections, the average acetone removal efficiency increased to 68.1%, 81.9%, 92.3%, and 96.7% as well as 61.4%, 78.7%, 88.3%, and 93.1% for inlet concentrations of 0.18 and 0.25 g/m3, respectively. Similar results were obtained when the airflow was increased to 5.09 m3/h, and the inlet acetone concentration was at 0.25 and 0.40 g/m3. With the increase in height from 0.1 to 0.5 m, the efficiency of the BTF to remove acetone increased from 38.1% and 30.1% to 89.1% and 83.1%, respectively, for inlet acetone concentrations of 0.25 and 0.40 g/m3, respectively.
3.3. Abundance of Bacterial Community in the Biotrickling Filter
The efficiency of contaminant removal of a BTF is dependent on the robustness of the bacterial community. Three types of bacteria, namely Pseudomonas putida, Rhodococcus aerolatus, and Aquaspirillum annulus, were inoculated. Figure 9 shows the bacterial community changes in the bioball packing material during the acetone-removal process.
As shown in Figure 9, in almost all cases, Pseudomonas putida was the most abundant bacteria in the BTF packing material, followed by Rhodococcus aerolatus and Aquaspirillum annulus. It could be assumed that, during metabolism, the Pseudomonas putida better-assimilated carbon than the other bacterial species and the energy of the Pseudomonas putida was the highest when using acetone as a carbon source. Pseudomonas strains are commonly used for VOC degradation in biofiltration systems [1,23,35]. Previous studies have also shown that acetone could be successfully degraded in biofilters using P. putida [14]. The Rhodococcus strains have also proven to be a suitable choice for the biodegradation of VOCs and can be used in various types of biofilters [36]. The counts of Pseudomonas putida, Rhodococcus aerolatus, and Aquaspirillum annulus were similar (p > 0.05) between different days of Phase I and, respectively, varied within the ranges of 1.18–1.22 × 10⁸, 1.32–1.54 × 10⁷, and 2.14–2.34 × 10⁴ CFU/g dry packing materials. During Phase II, the count of Aquaspirillum annulus remained similar and varied between 1.55 × 10⁴ and 2.51 × 10⁴ CFU/g dry packing material. While the number of Pseudomonas putida significantly decreased (p < 0.05) to 1.01 × 10⁷ CFU/g dry packing material at day 38 of biofiltration, when it returned to the similar level at day 50. At the first day of Phase III, the counts of the different studied bacteria substantially decreased to 1.52 × 10⁵, 7.30 × 10⁴, and 6.30 × 10² CFU/g dry packing material for Pseudomonas putida, Rhodococcus aerolatus, and Aquaspirillum annulus, respectively. This could be related to the intoxication of the bacteria with the supplied contaminant. The increase in airstream velocity could have resulted in the increased amount of acetone in the biofilm layer, which then exceeded the capacities of the biological reactions [37,38]. The mass of bacteria steadily increased until the end of Phase III, reaching 1.90 × 10⁷, 8.20 × 10⁶, and 1.92 × 10⁴ CFU/g dry packing material for Pseudomonas putida, Rhodococcus aerolatus, and Aquaspirillum annulus, respectively. Similar tendencies in counts of bacteria were also observed in Phase IV when the inlet acetone concentration was increased to 0.40 g/m3. It should be noted that during Phases III and IV, the changes in the mass of the bacteria corresponded to the changes in the acetone removal efficiencies in the BTF. Therefore, the increase in the contaminant inlet load could have contributed to the decrease in bacterial numbers and subsequently caused the acetone breakthrough from BTF.
Bioballs proved to be suitable as a packing material for the growth of bacteria and acetone elimination in the BTF. Table 2 shows the maximum acetone-elimination capacities obtained in the other studies using BTFs or biofilters packed with different materials. Li et al. (2012) used pall rings as a packing material in a field-scale BTF at low inlet acetone concentrations and found a maximum acetone-elimination capacity of 4.7 g/(m3 h) [11]. Balasubramanian et al. (2012) studied acetone removal in a BTF inoculated with Pseudomonas aeruginosa, Bacillus sp., and Chryseobacterium joostei on polyvinyl chloride and found a maximum elimination capacity of 380 g/(m3 h) at an EBCT of 25 s [29]. Chan and Lai (2010) reported a maximum acetone-elimination capacity of 81.4 g/(m3 h) in a biofilter packed with polyvinyl alcohol/peat/KNO3/GAC-composite beads [30]. In another study, Rene et al. (2010) used sieved perlite beads as a biofilter packing material and found a maximum acetone-elimination capacity of 151 g/(m3 h) when the inlet pollutant concentration ranged between 47.6 and 234.5 g/(m3 h) [39].
A biotrickling filter packed with bioballs worked effectively when the thickness of the packing material reached 0.5 m. However, in order to further increase the efficiency of air cleaning and considering the high porosity of the bioball packing material, the height of the packing material could be increased up to 1.0 m. The studied BTF was effective for 100 days. Plastic bioballs are long-lasting and resistant to microorganisms, so the BTF could work effectively for several years. The short contact time of the pollutant with the microorganisms could significantly reduce the size of the BTF. In practice, BTFs packed with bioballs could consist of several units, depending on the required operational performance. The capacity of one unit could reach 1000 m3/h. In this case, the dimensions of one unit would be 1.4 m in length and 1.4 m in width. The height of the BTF unit, considering the space occupied by additional equipment, could reach up to 2.0 m. The results showed that a consortium of microorganisms, which consisted of Pseudomonas putida, Rhodococcus aerolatus, and Aquaspirillum annulus, could be successfully applied for the decomposition of acetone in bioball packing material. However, various issues, such as the clogging of the plastic bioballs by accumulated biomasses or the uneven thickness of the biofilm, should also be considered. The bioballs packed BTF, which uses a biomass removal system may be suitable for industrial applications.
4. Conclusions
The results of this study showed that plastic bioballs were a suitable material as a bacterial biofilm carrier in BTF intended to remove acetone from the air. Nearly 100% of acetone was removed at loading rates less than 72.1 g/(m3 h) when the inlet air-flow rate was 2.54 m3/h. The maximum acetone-elimination capacity was 207.8 g/(m3 h) at a gas-flow rate of 5.09 m3/h and an inlet load of 231 g/(m3 h). In all biofiltration phases, the highest amount of acetone was removed in the first section of the BTF packing material. The highest acetone-removal efficiency (55%) after the first section was obtained at the lowest air-flow rate and inlet pollutant load. Three types of bacteria were used for acetone biodegradation in the BTF, and Pseudomonas putida was the dominant bacteria in the packing material, followed by Rhodococcus aerolatus and Aquaspirillum annulus.
Future studies are needed to investigate the performance of BTFs packed with bioballs in removing other VOCs from air under various operating parameters, such as liquid pH, inlet air temperature, and flow pattern.
Author Contributions
Conceptualization, A.Z. and T.J.; methodology, A.Z. and V.D.; validation, T.J. and A.Z.; investigation, A.Z.; resources, T.J.; data curation, V.D.; writing—original draft preparation, A.Z.; writing—review and editing, T.J. and V.D.; supervision, A.Z. All authors have read and agreed to the published version of the manuscript.
Funding
This research received no external funding.
Institutional Review Board Statement
Not applicable.
Informed Consent Statement
Not applicable.
Data Availability Statement
The data generated during the current study are available from the corresponding author on reasonable request.
Conflicts of Interest
The authors declare no conflict of interest.
References
- Delhoménie, M.-C.; Heitz, M. Biofiltration of Air: A Review. Crit. Rev. Biotechnol. 2005, 25, 53–72. [Google Scholar] [CrossRef]
- Vincent, G.; Schaer, E.; Marquaire, P.-M.; Zahraa, O. CFD modelling of an annular reactor, application to the photocatalytic degradation of acetone. Process Saf. Environ. Prot. 2011, 89, 35–40. [Google Scholar] [CrossRef]
- Enright, A.-M.; McHugh, S.; Collins, G.; O’Flaherty, V. Low-temperature anaerobic biological treatment of solvent-containing pharmaceutical wastewater. Water Res. 2005, 39, 4587–4596. [Google Scholar] [CrossRef]
- Liu, K.; Schuch, F.; Kiran, E. High-pressure viscosity and density of poly(methyl methacrylate)+acetone and poly(methyl methacrylate)+acetone+CO2 systems. J. Supercrit. Fluids 2006, 39, 89–101. [Google Scholar] [CrossRef]
- Natarajan, R. Performance Evaluation of Biodegradation of Isoprene–Acetone Mixture in Integrated Biofilter. J. Environ. Eng. 2020, 146, 04020030. [Google Scholar] [CrossRef]
- Cox, H. Co-treatment of H2S and toluene in a biotrickling filter. Chem. Eng. J. 2002, 87, 101–110. [Google Scholar] [CrossRef]
- Rybarczyk, P.; Szulczyński, B.; Gospodarek, M.; Gębicki, J. Effects of n-butanol presence, inlet loading, empty bed residence time and starvation periods on the performance of a biotrickling filter removing cyclohexane vapors from air. Chem. Pap. 2020, 74, 1039–1047. [Google Scholar] [CrossRef] [Green Version]
- San-Valero, P.; Gabaldón, C.; Álvarez-Hornos, F.J.; Izquierdo, M.; Martínez-Soria, V. Removal of acetone from air emissions by biotrickling filters: Providing solutions from laboratory to full-scale. J. Environ. Sci. Health Part A 2019, 54, 1–8. [Google Scholar] [CrossRef]
- Jiménez, L.; Arriaga, S.; Muñoz, R.; Aizpuru, A. Effect of extended and daily short-term starvation/shut-down events on the performance of a biofilter treating toluene vapors. J. Environ. Manag. 2017, 203, 68–75. [Google Scholar] [CrossRef]
- Melse, R.W.; Ploegaert, J.P.M.; Ogink, N.W.M. Biotrickling filter for the treatment of exhaust air from a pig rearing building: Ammonia removal performance and its fluctuations. Biosyst. Eng. 2012, 113, 242–252. [Google Scholar] [CrossRef]
- Li, J.; Ye, G.; Sun, D.; An, T.; Sun, G.; Liang, S. Performance of a biotrickling filter in the removal of waste gases containing low concentrations of mixed VOCs from a paint and coating plant. Biodegradation 2012, 23, 177–187. [Google Scholar] [CrossRef]
- Gospodarek, M.; Rybarczyk, P.; Szulczyński, B.; Gębicki, J. Comparative evaluation of selected biological methods for the removal of hydrophilic and hydrophobic odorous VOCs from air. Processes 2019, 7, 187. [Google Scholar] [CrossRef] [Green Version]
- Yang, C.; Qian, H.; Li, X.; Cheng, Y.; He, H.; Zeng, G.; Xi, J. Simultaneous removal of multicomponent VOCs in biofilters. Trends Biotechnol. 2018, 36, 673–685. [Google Scholar] [CrossRef]
- Asadi, M.; Najafpour, G.D.; Hashemiyeh, B.A.; Mohammadi, M. Removal of acetone from contaminated air in biofilter using Pseudomonas putida. Am. J. Sustain. Agric. 2009, 5, 712–719. [Google Scholar]
- Chang, K.; Lu, C. Biofiltration of toluene and acetone mixtures by a trickle-bed air biofilter. World J. Microbiol. Biotechnol. 2003, 19, 791–798. [Google Scholar] [CrossRef]
- Schiavon, M.; Ragazzi, M.; Rada, E.C.; Torretta, V. Air pollution control through biotrickling filters: A review considering operational aspects and expected performance. Crit. Rev. Biotechnol. 2016, 36, 1143–1155. [Google Scholar] [CrossRef]
- Singh, R.S.; Rai, B.N.; Upadhyay, S.N. Removal of toluene vapour from air stream using a biofilter packed with polyurethane foam. Process Saf. Environ. Prot. 2010, 88, 366–371. [Google Scholar] [CrossRef]
- Baltrėnas, P.; Januševičius, T.; Kleiza, J. Effect of Packing Material Composition on the Aerodynamic Processes in a Wavy Lamellar Plate-Type Biofilter. Processes 2021, 9, 625. [Google Scholar] [CrossRef]
- Dorado, A.D.; Lafuente, J.; Gabriel, D.; Gamisans, X. The role of water in the performance of biofilters: Parameterization of pressure drop and sorption capacities for common packing materials. J. Hazard. Mater. 2010, 180, 693–702. [Google Scholar] [CrossRef]
- Parseh, I.; Hajizadeh, Y.; Jaafarzadeh, N.; Goudarzi, G.; Shakerinejad, G.; Badeenezhad, A.; Mengelizadeh, N.; Fallahizadeh, S. Removal behavior of gaseous furfural using a biofilter packed with perlite, ripe compost, and oak woodchips. Process Saf. Environ. Prot. 2021, 149, 135–143. [Google Scholar] [CrossRef]
- Andres, Y.; Dumont, E.; Le Cloirec, P.; Ramirez-Lopez, E. Wood Bark as Packing Material in a Biofilter used for Air Treatment. Environ. Technol. 2006, 27, 1297–1301. [Google Scholar] [CrossRef]
- Prenafeta-Boldú, F.X.; Illa, J.; van Groenestijn, J.W.; Flotats, X. Influence of synthetic packing materials on the gas dispersion and biodegradation kinetics in fungal air biofilters. Appl. Microbiol. Biotechnol. 2008, 79, 319–327. [Google Scholar] [CrossRef] [Green Version]
- Pielech-Przybylska, K.; Ziemiński, K.; Szopa, J.S. Acetone biodegradation in a trickle-bed biofilter. Int. Biodeterior. Biodegrad. 2006, 57, 200–206. [Google Scholar] [CrossRef]
- Fontanarrosa, M.S.; Allende, L.; Rennella, A.M.; Boveri, M.B.; Sinistro, R. A novel device with macrophytes and bio balls as a rehabilitation tool for small eutrophic urban ponds: A mesocosm approximation. Limnologica 2019, 74, 61–72. [Google Scholar] [CrossRef]
- Masłoń, A.; Tomaszek, J.A. A study on the use of the BioBall® as a biofilm carrier in a sequencing batch reactor. Bioresour. Technol. 2015, 196, 577–585. [Google Scholar] [CrossRef]
- Suantika, G.; Pratiwi, M.I.; Situmorang, M.L.; Djohan, Y.A.; Muhammad, H.; Astuti, D.I. Ammonium Removal by Nitrifying Bacteria Biofilm on Limestone and Bioball Substrate Established in Freshwater Trickling Biofilter. Poultry, Fish. Wildl. Sci. 2016, 4, 157. [Google Scholar] [CrossRef] [Green Version]
- Foysal, M.J.; Fotedar, R.; Gupta, S.K.; Chaklader, M.R. Biological ball filters regulate bacterial communities in marron (Cherax cainii) culture system. Lett. Appl. Microbiol. 2019, 68, 455–463. [Google Scholar] [CrossRef]
- Karthikeyan, O.P.; Saravanan, N.; Cirés, S.; Alvarez-Roa, C.; Razaghi, A.; Chidambarampadmavathy, K.; Velu, C.; Subashchandrabose, G.; Heimann, K. Culture scale-up and immobilisation of a mixed methanotrophic consortium for methane remediation in pilot-scale bio-filters. Environ. Technol. 2017, 38, 474–482. [Google Scholar] [CrossRef]
- Balasubramanian, P.; Philip, L.; Murty Bhallamudi, S. Biotrickling filtration of VOC emissions from pharmaceutical industries. Chem. Eng. J. 2012, 209, 102–112. [Google Scholar] [CrossRef]
- Chan, W.-C.; Lai, T.-Y. Compounds interaction on the biodegradation of acetone and methyl ethyl ketone mixture in a composite bead biofilter. Bioresour. Technol. 2010, 101, 126–130. [Google Scholar] [CrossRef]
- Fida, T.T.; Gassara, F.; Voordouw, G. Biodegradation of isopropanol and acetone under denitrifying conditions by Thauera sp. TK001 for nitrate-mediated microbially enhanced oil recovery. J. Hazard. Mater. 2017, 334, 68–75. [Google Scholar] [CrossRef]
- Baltrėnas, P.; Zagorskis, A. Investigation into the air treatment efficiency of biofilters of different structures. J. Environ. Eng. Landsc. Manag. 2010, 18, 23–31. [Google Scholar] [CrossRef]
- Rene, E.R.; Murthy, D.V.S.; Swaminathan, T. Effect of Flow Rate, Concentration and Transient—State Operations on the Performance of a Biofilter Treating Xylene Vapors. Water Air Soil Pollut. 2010, 211, 79–93. [Google Scholar] [CrossRef]
- Rene, E.R.; Veiga, M.C.; Kennes, C. Performance of a biofilter for the removal of high concentrations of styrene under steady and non-steady state conditions. J. Hazard. Mater. 2009, 168, 282–290. [Google Scholar] [CrossRef] [Green Version]
- Baltrėnas, P.; Zagorskis, A.; Misevičius, A. Research into acetone removal from air by biofiltration using a biofilter with straight structure plates. Biotechnol. Biotechnol. Equip. 2015, 29, 404–413. [Google Scholar] [CrossRef] [Green Version]
- Martinkova, L.; Uhnakova, B.; Patek, M.; Nesvera, J.; Kren, V. Biodegradation potential of the genus Rhodococcus. Environ. Int. 2009, 35, 162–177. [Google Scholar] [CrossRef]
- Atoche, J.C.; Moe, W.M. Treatment of MEK and toluene mixtures in biofilters: Effect of operating strategy an performance during transient loading. Biotechnol. Bioeng. 2004, 86, 468–481. [Google Scholar] [CrossRef] [PubMed]
- Moe, W.M.; Li, C. Comparison of Continuous and Sequencing Batch Operated Biofilters for Treatment of Gas-Phase Methyl Ethyl Ketone. J. Environ. Eng. 2004, 130, 300–313. [Google Scholar] [CrossRef]
- Rene, E.R.; Špačková, R.; Veiga, M.C.; Kennes, C. Biofiltration of mixtures of gas-phase styrene and acetone with the fungus Sporothrix variecibatus. J. Hazard. Mater. 2010, 184, 204–214. [Google Scholar] [CrossRef] [Green Version]
Figure 1.
Schematic diagram of the biotrickling filter.

Figure 2.
Plastic biological ball filters (i.e., bioballs): (a) plastic bioball; (b) top view of bioball; (c) bioballs in the biotrickling filter.
Figure 2.
Plastic biological ball filters (i.e., bioballs): (a) plastic bioball; (b) top view of bioball; (c) bioballs in the biotrickling filter.

Figure 3.
Schematic diagram of the acetone biofiltration process on bioballs.

Figure 4.
Influence of inlet acetone loading on the removal efficiency of the trickling filter.

Figure 5.
Influence of inlet acetone loading on the elimination capacity of the trickling filter.

Figure 6.
Influence of inlet acetone loading on the removal efficiency of the biotrickling filter.

Figure 7.
Influence of acetone inlet loading on the elimination capacity of the biotrickling filter.
Figure 7.
Influence of acetone inlet loading on the elimination capacity of the biotrickling filter.

Figure 8.
The dependence of the acetone removal efficiency and its elimination capacity on the height of the packing material: (a) at the air-flow rate of 2.54 m3/h and inlet concentration of 0.18–0.25 g/m3; (b) at the air-flow rate of 5.09 m3/h and inlet concentration of 0.25–0.40 g/m3. Values correspond to the average removal efficiencies and elimination capacities obtained during each phase.

Figure 9.
Bacterial community changes in bioball packing material during the biofiltration process.


Table 1.
Operation parameters of the biotrickling filter for continuous acetone degradation.
| Phase | Period of Operation (Days) | VB (m3) | Inlet Concentration (g/m3) | QG (m3/h) | Q m3/(m3 h) | L g/(m3 h) | EBCT (s) |
|---|---|---|---|---|---|---|---|
| I | 1–25 | 0.00883 | 0.18 | 2.54 | 288 | 51.8 | 12.5 |
| II | 26–50 | 0.25 | 2.54 | 288 | 72.0 | 12.5 | |
| III | 51–75 | 0.25 | 5.09 | 576 | 144.0 | 6.3 | |
| IV | 76–100 | 0.40 | 5.09 | 576 | 230.4 | 6.3 |
Table 2.
Maximum acetone elimination capacities by various biofiltration systems.
| Filter | Packing Material | Pollutant | Inoculum | Operation Time, Days | QG, m3/h | EBCT (s) | L, g/(m3 h) | The Maximum EC, g/(m3 h) | Reference |
|---|---|---|---|---|---|---|---|---|---|
| BTF | Bioballs | Acetone | Pseudomonas putida, Rhodococcus aerolatus, and Aquaspirillum anulus | 100 | 5.09 | 6.3 | 231 | 207.8 | This study |
| BTF | Pall rings | Acetone mixed with various VOC | Activated sludge | 80 | 405 | 14 | 4.8 | 4.7 | [11] |
| BTF | Polyvinyl chloride | Acetone | Pseudomonas aeruginosa, Bacillus sp., and Chryseobacterium joostei | 101 | 0.24 | 25 | 559 | 380 | [29] |
| BTF | Plexi glass chips | Acetone | Burkholderia cepacia and Acinetobacter baumannii | 112 | 0.3 | 75 | 97.1 | 95.7 | [23] |
| BTF | Coconut fiber | Acetone | Burkholderia cepacia and Acinetobacter baumannii | 112 | 0.3 | 75 | 97.1 | 77.8 | [23] |
| BF | Polyvinyl alcohol/peat/ KNO3/GAC composite bead | Acetone | Activated sludge | - | 0.102 | 28 | 886 | 81.4 | [30] |
| BF | Sieved perlite beads (4–6 mm) | Acetone mixed with styrene | Fungus Sporothrix variecibatus | 84 | 0.05 | 137 | 47.6–234.5 | 151 | [39] |
BTF: biotrickling filter; BF: biofilter.
Publisher’s Note: MDPI stays neutral with regard to jurisdictional claims in published maps and institutional affiliations. |
© 2021 by the authors. Licensee MDPI, Basel, Switzerland. This article is an open access article distributed under the terms and conditions of the Creative Commons Attribution (CC BY) license (https://creativecommons.org/licenses/by/4.0/).
Share and Cite
MDPI and ACS Style
Zagorskis, A.; Januševičius, T.; Danila, V. Removal of Acetone Vapor from Air Using a Biotrickling Filter Packed with Polymeric Bioballs. Processes 2022, 10, 57. https://0-doi-org.brum.beds.ac.uk/10.3390/pr10010057
AMA Style
Zagorskis A, Januševičius T, Danila V. Removal of Acetone Vapor from Air Using a Biotrickling Filter Packed with Polymeric Bioballs. Processes. 2022; 10(1):57. https://0-doi-org.brum.beds.ac.uk/10.3390/pr10010057
Chicago/Turabian StyleZagorskis, Alvydas, Tomas Januševičius, and Vaidotas Danila. 2022. "Removal of Acetone Vapor from Air Using a Biotrickling Filter Packed with Polymeric Bioballs" Processes 10, no. 1: 57. https://0-doi-org.brum.beds.ac.uk/10.3390/pr10010057
Note that from the first issue of 2016, this journal uses article numbers instead of page numbers. See further details here.