Article

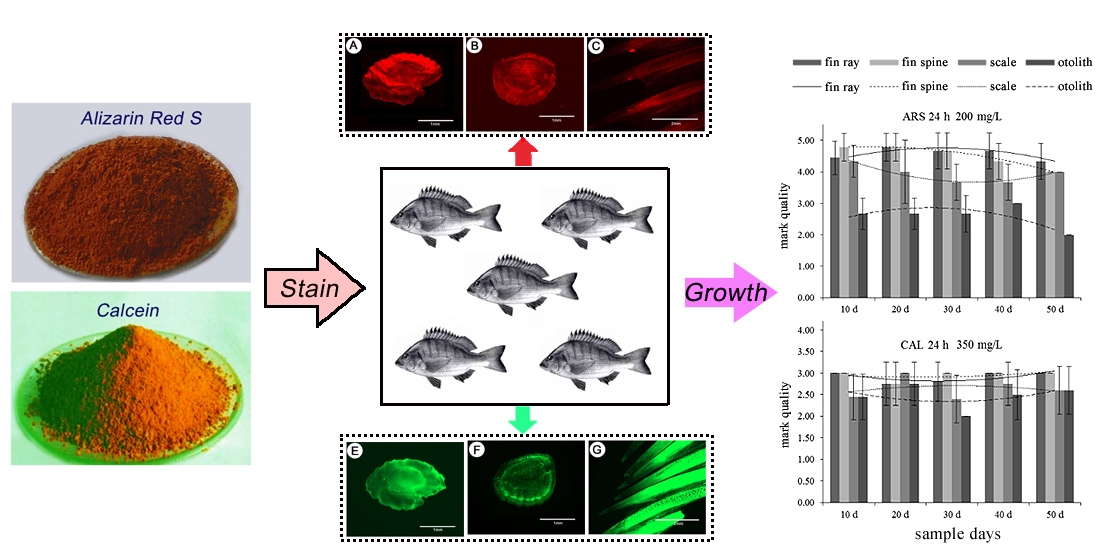
Comparative Evaluation of Marking Effects of Two Fluorescent Chemicals, Alizarin Red S and Calcein, on Black Sea Bream (Acanthopagrus schlegelii)

1
Key Laboratory of Marine Ranching, Ministry of Agriculture and Rural Affairs, South China Sea Fisheries Research Institute, Chinese Academy of Fisheries Sciences, Guangzhou 510300, China
2
Fisheries Management and Law Enforcement Service Center, Ministry of Agriculture and Rural Affairs, Shanghai 200092, China
*
Authors to whom correspondence should be addressed.
Submission received: 13 September 2022 / Revised: 5 October 2022 / Accepted: 8 October 2022 / Published: 9 October 2022

Abstract

:
Two fluorescent dyes, alizarin red S (ARS) and calcein (CAL), were applied to evaluate the marking effects on the juveniles of Acanthopagrus schlegelii. The total mortality rates of the experimental groups were significantly lower (p < 0.05) than those of control groups, but no significant difference was detected between those of the two staining methods. The fluorescence microscopy observation results showed that the marking quality of ARS was better than that of CAL, with fin spines and fin rays being the best marking tissues. The optimal concentration for ARS and CAL was 200 mg/L and 350 mg/L, respectively. To ensure mark quality, the recommended dye grade was above 3, and the most suitable marking conditions were suggested to be fluorescence labeling with ARS dye at a concentration of 200 mg/L, with immersion for 24 h. The results will provide useful data information for future research on stock enhancement using the chemical marking method.

Graphical Abstract

1. Introduction

Black sea bream, Acanthopagrus schlegelii (Bleeker 1854), is an important commercial and sport fishing species, widely distributed throughout coastal areas of Asia, including Japan, Korea, Mainland China, Hong Kong and Taiwan [1]. Hatchery release of black sea bream in China began in the early 1980s after the black sea bream wild individuals were depleted [2], because overfishing had led to sharp declines in local populations over the years [3]. Traditionally, the effectiveness of the stock enhancement program for black sea bream has been evaluated by the increment in landings [4]. It is very important to establish a simple and useful marking method to evaluate the releasing effect of stock enhancement.
Among marking techniques, fluorescence labeling uses fluorescent dyes to mark the bony tissues of target objects, and it has been used to mark many released fish species, including Danio rerio [5], Poecilia reticulata [6], Hypophthalmichthys molitrix [7], Macquaria ambigua [8], Argyrosomus regius [9] and Mylopharyngodon piceus [10]. Several chemicals, such as alizarin, calcein, tetracycline, strontium and lanthanides, are used as fish markers. Among them, strontium and lanthanides can be readily deposited in bones and fin rays to give traceable tags, but they can only be detected by using mass spectrometry or scanning electron microscopy [11]. Tetracycline is an antibiotic fluorescent dye and has been reported to pose potential risks to fish health, such as changing fish behavior and growth [12]. The fluorescent dye alizarin red S (ARS) has been used most widely due to its cost advantage and the general quality of its marking effect [8,13,14,15,16,17,18], while calcein (CAL) allows the growth of labeled organisms to be accurately measured without affecting their survival or growth [10].
In the present study, a staining experiment was conducted with black sea bream (Acanthopagrus schlegelii) based on different concentrations and immersion times for ARS and CAL. The aims of this study were to (1) evaluate the mortality of black sea bream caused by the two fluorescent markers; (2) compare the marking quality of the markers on different tissues of black sea bream; (3) assess the appropriate immersing time and concentration of different markers. The results of this study will provide a basic and useful reference for the appropriate marking of hatchery-reared black sea bream.

2. Materials and Methods

2.1. Temporary Rearing of Test Fish

Juvenile black sea bream (A. schlegelii) (body length of 40.0–49.0 mm and body weight of 1.3–2.8 g) were provided by the Shenzhen Experimental Base of the South China Sea Fisheries Research Institute of the Chinese Academy of Fishery Sciences, China. These test fish were temporarily reared in a 500-L fish-farming barrel for 10 d at a temporary rearing density of 1.6 fish/L. During this period, feeding was conducted twice a day, in the morning and evening, until the fish were satiated with the particular feed. The water was maintained at a temperature of 23.0 ± 2.5 °C, salinity of 33.0 ± 2.0, dissolved oxygen of 6.22 mg/L, pH of 7.6–7.8 and a light cycle of 14 L/10 D. The daily water exchange rate was 30% of the volume of the fish-farming barrel. The protocol used in this animal study was reviewed and approved by the Institutional Animal Care and Use Committee at South China Sea Fisheries Research Institute, Chinese Academy of Fisheries Sciences (approval number: SCSFRI 2021-0531).

2.2. Alizarin Red S (ARS) and Calcein (CAL) Immersion Marking

Stock solutions of ARS (concentration of 2000 mg/L) and CAL (500 mg/L) were prepared with sand-filtered seawater (salinity 30, the same as below). For the ARS and CAL staining solutions, concentration gradients of 100, 200, 300 and 400 mg/L and 50, 150, 250 and 350 mg/L were established, respectively, in addition to a blank control group. Sand-filtered seawater was used to dilute the stock solutions to the corresponding concentration gradients, with three treatment replicates for each concentration. A 60-L temporary fish-rearing barrel (filled with 30 L of staining solution) was used as the immersion container, and the water was conditioned to a pH of 7.6 and a natural temperature of 23.0 ± 2.3 °C. In each experimental temporary fish-rearing barrel, 60 randomly selected black sea bream juveniles were assigned to two immersion time treatments, 18 h and 24 h, for each replicate. After the immersion, clean seawater was used to soak the juvenile black sea bream to wash away the staining solution throughout the body, and the fish were then placed in 54 fish-farming barrels filled with fresh seawater to observe their mortality at 48 h after staining.

2.3. Growth Experiment

To evaluate the post-immersion survival and growth of juvenile black sea bream, 90 individuals were randomly selected from each of the immersion marking groups and the control group for a fish-farming experiment. Each experimental group consisted of three replicates (30 fish for each replicate) that were reared in three recirculating fish-farming barrels. During the experimental period, a micro-flow sand-filtered seawater system for fish farming (water temperature of 24–29 °C, salinity of 35.0 ± 1.0, dissolved oxygen of 5.73–6.62 mg/L, pH of 7.6–8.0 and a light cycle of 14 L/10 D) was continuously aerated.
Before the experiment, the body lengths and body weights of the juveniles were determined to a precision of 1 mm and 0.1 g, respectively. The fish farming lasted for 50 d, and, every 10 d, 10 test fish were randomly selected from each replicate to determine the body length and body weight indexes.

2.4. Sampling and Mark Detection

During the fish-farming experiment, three juveniles were randomly selected from each replicate every 10 d, and one pair of otoliths, approximately 10 scales (from the upper part of the lateral line, the bottom part of the base of the dorsal fin, the bottom part of the lateral line and the upper part of the base of the anal fin), all fin rays (dorsal fin ray, pectoral fin ray, ventral fin ray, anal-fin ray and caudal fin ray) and all fin spines (dorsal fin spine, pectoral fin spine and anal fin spine) were sampled to detect the fluorescence labeling. All samples were washed, dried and stored in the shade; mark detection and analysis were completed within 1 month after storage.
A fluorescence microscope (Olympus BX51) equipped with a digital camera (Olympus DP70) was used to observe the fluorescence labeling (see Table 1 for wavelength parameters). Mark quality was quantitatively evaluated, and the grading standard was in accordance with the grading standards described in [15]. The fluorescent labels of all the samples were observed, and their staining qualities were evaluated and recorded. The mark quality scores of the samples were individually evaluated and recorded by two researchers, and in case of a discrepancy, the score was determined by a third observer. In the present experiment, the quality of the mark was considered “good” if the score was ≥2.

2.5. Data Analysis

In the present study, regression analysis was conducted using Excel 2016, and statistical analysis was performed with the statistical package SPSS 19.0 (SPSS Inc., Chicago, IL, USA), with significant differences being determined by one-way analysis of variance (ANOVA).

3. Results and Analysis

3.1. Mortality after Immersion and Growth after Marking

Table 2 and Table 3 show the juvenile fish mortality caused by the staining effects of ARS and CAL, respectively. Generally, the mortality rates of the experimental groups were significantly lower (p < 0.05) than those of control groups for both of the two staining methods. In the 24-h group subjected to ARS immersion, 4~45 fish had died by the end of marking at all concentration gradients, except 400 mg/L, for a survival rate ranging from 75.00% to 97.78%. In the 18-h group, there were no deaths at the 300-mg/L and 400-mg/L concentrations, but there were 4~45 deaths at the other three concentrations, for a survival rate ranging from 75.56% to 97.78% (Table 2). For the CAL immersion, there were 12~45 deaths at each of the concentration gradients in the 24-h group, resulting in a survival rate ranging from 75.00% to 93.33%; in the 18-h group, there were 4~44 deaths, for a survival rate ranging from 75.56% to 97.78% (Table 3).
At 48 h after staining under the ARS immersion, fish deaths ranged from 1 to 15 with increasing concentrations in the 24-h group and from 1 to 5 in the 18-h group (Table 2). For the CAL immersion, fish deaths ranged from 1 to 5 with increasing concentrations in the 24-h group and from 1 to 5 in the 18-h group (Table 3). No significant difference was found between the staining groups and controls (p > 0.05).
After the 50-d farming experiment, the increments in body length were 11.55 ± 3.05 mm for the ARS marking groups, with a range of 8.34–16.38 mm, while the corresponding values for CAL marking groups were 10.80 ± 2.91 mm and 6.22–14.47 mm. Meanwhile, body weight increased by 2.12 ± 0.70 g and 2.53 ± 0.46 g for the ARS and CAL marking groups, respectively. However, no significant difference (p > 0.05) was found between the effects of ARS and CAL on the growth of juvenile black sea bream. In addition, one-way ANOVA also showed no significant differences (p > 0.05) in the body lengths and weights of the marked and control fish at 0, 10, 20, 30, 40 and 50 d during the fish-farming process (Figure 1).

3.2. Mark Quality

For each group, otolith, scale, fin ray and fin spine samples were taken every 10 d, and the quality of the fluorescence labeling was observed under three types of fluorescence microscopy (ultraviolet excitation light DAPI, green excitation light GFP and blue excitation light RFP). The mark quality of the same sample under each stain concentration/time treatment was consistent under the various light sources (p > 0.05). Among the light sources, ARS was more readily observed under the green light, and CAL was more apparent under the blue light source (Figure 2). The mark quality was significantly higher with ARS than CAL (Table 4).

3.2.1. Comparison of Mark Quality between Different Sampling Tissues

In this study, fin ray and fin spine samples were collected, and mark quality was determined for all treatments. Under ARS immersion, mark quality was best in both the P fin ray and P fin spine for both the 18-h and 24-h groups. Specifically, in the 18-h group, the mark quality of the P fin ray was extremely significantly different to that of the other locations on the fin ray (p < 0.01), and the mark quality of the P fin spine was significantly different to that of the other locations on the fin spine (p < 0.05). In the 24-h group, the mark quality scores of the fin ray/fin spine were extremely significantly different (p < 0.01). Comparisons of mark quality between the fin ray (P), fin spine (P), scale and otolith showed that mark quality followed the order of fin spine = fin ray > scale > otolith (no significant difference between fin spine and fin ray, p > 0.05) in the 18-h group; the other sample tissues extremely significantly differed in mark quality, p < 0.01. In the 24-h group, the order was fin spine > fin ray > scale > otolith (there were extremely significant differences in mark quality among all the sample tissues, p < 0.01).
In the 18-h group under CAL immersion, the P, V, D and C fin rays had the best mark quality among the fin ray tissues (all showing extremely significant differences from A, p < 0.01), but of the fin spine tissues, the P, A, D and V locations had the best mark quality (all showing significant differences from C, p < 0.05). In the 24-h group, in the fin spine tissues, the A, D and P locations had the best mark quality (showing significant differences from the other fin spine locations, p < 0.05). Comparisons of mark quality among the fin ray (the V location was chosen for the comprehensive evaluation), fin spine (the V location), scale and otolith showed that the order of mark quality was fin spine = fin ray > scale > otolith (no significant difference between fin spine and fin ray, p > 0.05; the other sample tissues extremely significantly differed in mark quality, p < 0.01) in the 18-h group. Within the 24-h group, the order was fin spine > fin ray > scale > otolith (there was a significant difference between the fin spine and fin ray, p < 0.05, and an extremely significant difference between the fin spine and the other sample tissues, p < 0.01).

3.2.2. Comparison of Mark Quality between Immersion Times

The mark quality scores of fish in the 18-h and 24-h groups were compared under both ARS and CAL immersion. For the ARS dye immersion, extremely significant differences (p < 0.01) existed within the same sample tissue for all tissues between the different immersion times, within the same sampling time point for all the sampling time points, and within the same immersion concentration for all the concentrations. In particular, the 24-h group significantly outperformed the 18-h group. For the CAL dye immersion, the mark quality scores of fish were analyzed between the different immersion times. Specifically, comparisons of the mark quality scores of the different sample tissues showed extremely significant differences (p < 0.01) between the scale and otolith, but there were no significant differences among the other tissues (p > 0.05). Comparison of the mark quality scores between different sampling time points showed a significant difference (p < 0.05) between the two immersion times at 20 d, but there was no significant difference at the other sampling time points (p > 0.05). Comparison of the mark quality scores between the different immersion times at the different concentrations showed a significant difference (p < 0.01) between the two immersion times at the 50-mg/L concentration, but there was no significant difference between the two immersion times with the other concentrations (p > 0.05). For all the above differences in mark quality under CAL immersion, the 24-h group significantly outperformed the 18-h group.

3.2.3. Comparison of Mark Quality among Immersion Concentrations

The mark quality scores of fish were compared among the four ARS concentrations. Within the 18-h group, there were no significant differences among the groups (p > 0.05). However, within the 24-h group, there was a significant difference in marker quality (p < 0.05) between the concentrations of 100 mg/L and 200 mg/L (better mark quality), and there were no significant differences among the other groups (p > 0.05). The mark quality scores of fish subjected to the four CAL concentrations were also compared, and no significant differences were found among the various concentrations (p > 0.05) within the 18-h and 24-h groups.

3.2.4. Changes in Mark Quality with Time

The results of this study (Table 4 and Section 3.2.1, Section 3.2.2 and Section 3.2.3 of the Results section) showed that ARS dye immersion achieved optimal mark quality in the 24-h group at the 200-mg/L concentration, and CAL dye immersion reached its highest average mark quality in the 24-h group at the concentration of 350 mg/L (2.74 ± 0.28; the average results did not significantly differ between dyes, as opposed to significant differences in quality among concentrations within the 24-h group).
Taking the data from these two groups as representative, the pattern of change in mark quality with time was analyzed. The relationship between the mark quality of the different sampling tissues and sampling time was determined, and the polynomial function showed the best fit for each group. Of the various sample tissues under ARS dye immersion, the mark quality of the fin spine, fin ray and otolith first increased and then decreased with time, whereas scale mark quality showed the opposite trend. Of the various sample tissues under CAL dye immersion, the mark quality of the fin spine remained stable (all with a mark quality of 3 at the V location), and the mark quality of the ventral fin and scale showed the trend of first increasing and then decreasing. The mark quality of the otolith showed the opposite trend (Figure 3).

4. Discussion

In this study, ARS and CAL were used as dyes to immersion-mark juvenile black sea bream, and mark quality scores were obtained for the scale, fin spine, fin ray and otolith. Based on the fluorescence detection in all the samples, the total marking rate reached as high as 99.27%, suggesting strong applicability; overall mark quality gradually increased with increased immersion concentration and marking duration, with the marking effect of ARS being superior to that of CAL. These results are consistent with the results of a study of black sea bream by Liu et al. [18], studies of Paralichthys olivaceus by Lv [19] and Katayama et al. [20] and a study of Channa asiatica by Xu et al. [21]. There were slight differences between the sample replicates, indicating that their growth stages might not have been synchronized, so growth rates may have differed among various individuals, thereby leading to variations in dye deposition. When the immersion concentration and time reached a certain level, the fluorescence detection results tended to be consistent, suggesting no concern with mark stability.
Studies have shown that high concentrations or a long immersion duration of dyes may lead to high mortality in the marked objects. Catostomus commersoni exhibited 100% mortality (all dead) when immersed in ARS at 400 mg/L [22], and Coregonus albula showed a decreasing survival rate with prolonged ARS immersion [23]. There was also a certain level of immersion-caused mortality in this study, but the occurrence was different from that in C. commersoni and C. albula; in this study, higher mortalities occurred in the low-concentration groups and the blank control group. The black sea bream is a ferocious predatory fish species with obvious aggregation behavior when feeding [24], and the reared fish would attack each other and exhibit self-mutilation when the food supply was inadequate. Meanwhile, the sequential sensory development associated with feeding behavior in black sea bream is as follows: visual, gustatory, tactile and auditory [25]. Additionally, the feeding intensity of the fish under artificial rearing conditions also peaks during the daytime [26]. Therefore, the results of this study may be explained as follows. Since no shading was provided for the low-dye-concentration groups and the control group at the high population density (2 fish/L), the juvenile black sea bream subjected to immersion attacked each other and self-mutilated, which were the main causes of mortality among the fish subjected to immersion.
As persistence is one of the most important indexes in marker development and selection, a fish-farming experiment was conducted for 50 d after marking in this study, during which continuous sampling was carried out to determine mark quality. Fluorescent dye staining is a biological process in which the dye is bound to the calcium and sclerotin in the body of the marked target. The results of this study showed that mark quality reached its optimal value at 10 d and then decreased slowly when using ARS dye. Due to the short culture time of this experiment, the mark quality when using CAL dye did not significantly change within 50 d. Previous reports showed that staining could be retained in the bodies of the fish Salmo salar [27] and Paralichthys dentatu [28] for 18 months or more.
The effectiveness of mark detection in different sampled tissues followed a descending order, fin spine ≥ fin ray > scale > otolith, which was consistent with the results of Liu et al. [18]. Comparison of the mark quality between different immersion times revealed significantly better mark quality in the 24-h group than the 18-h group, and previous results also showed that marking effectiveness generally improves with longer immersion times [5,7,29] and in marked individuals who are smaller or in earlier developmental stages [9,15,30]. However, staining with a concentration of ARS or other fluorescent dye that is too high or using a long immersion time significantly increases the mortality of test fish [8,13,21]. Hence, screening for a safe dye concentration and immersion time cannot be ignored when ensuring mark quality.

5. Conclusions

In this study, alizarin red S (ARS) and calcein (CAL) were used to assess the marking effects on the juveniles of Acanthopagrus schlegelii. The results showed that the most suitable marking conditions are suggested to be fluorescence labeling with ARS dye at a concentration of 200 mg/L, with immersion for 24 h. The recommended dye and concentration yielded a mark quality grade of 3 and above, exhibiting an obvious practical effect; the marks could be directly observed with the naked eye. Generally, the results of the present study will provide a basic and useful reference for the research of stock enhancement using the chemical marking method. Further research should focus on the safety impacts on the marked fish caused by the immersion concentration and immersion time.

Author Contributions

Conceptualization, Y.L. and D.S.; data curation, C.Y. and M.L.; formal analysis, B.S. and Y.L.; funding acquisition, D.S. and Y.G.; investigation, B.S.; validation, L.W.; visualization, W.Y. and L.W.; writing—original draft, Y.L. and C.Y.; writing—review and editing, Y.L. and Y.G. All authors have read and agreed to the published version of the manuscript.

Funding

This work was supported by the Hainan Provincial Natural Science Foundation of China (No. 320QN358), National Natural Science Foundation of China (No. 42206109), and the Central Public-Interest Scientific Institution Basal Research Fund, South China Sea Fisheries Research Institute, Chinese Academy of Fishery Science, under contract No. 2021SD14.

Data Availability Statement

Not applicable.

Conflicts of Interest

The authors declare no conflict of interest.

References

  1. Smith-Vaniz, W.F. Reef Fishes of Hong Kong. BioOne 2001, 2001, 577–578. [Google Scholar] [CrossRef]
  2. Tang, J.H.; Cheng, M.H. Experiments on propagation and release of Sparus macrocephalus in the coastal waters of Jiangsu and Zhejiang Province. J. Shanghai Fish. Univ. 1998, 7, 167–171. [Google Scholar]
  3. Sadovy, Y.; Cornish, A.S. Reef fishes of Hong Kong; Hong Kong University Press: Hong Kong, China, 2000; p. 321. [Google Scholar]
  4. Gonzalez, E.B.; Umino, T.; Nagasawa, K. Stock enhancement programme for black sea bream, Acanthopagrus schlegelii (Bleeker), in Hiroshima Bay, Japan: A review. Aquac. Res. 2010, 39, 1307–1315. [Google Scholar] [CrossRef]
  5. Xu, L.J. Making Juvenile Zebrafish with Fluorescent Substances and Its Effects on Antioxidases; Southwest University: Chongqing, China, 2012. [Google Scholar]
  6. Bashey, F. A Comparison of the suitability of alizarin red S and calcein for inducing a nonlethally detectable mark in juvenile guppies. Trans. Am. Fish. Soc. 2004, 133, 1516–1523. [Google Scholar] [CrossRef]
  7. Lü, H.J.; Fu, M.; Xi, D.; Zhang, Z.X. Experimental evaluation of calcein and alizarin red S for immersion marking of silver carp Hypophthalmichthys molitrix (Valenciennes, 1844). J. Appl. Ichthyol. 2016, 32, 83–91. [Google Scholar] [CrossRef]
  8. Crook, D.A.; O’Mahony, D.J.; Sanger, A.C.; Munro, A.R.; Gillanders, B.M.; Thurstan, S. Development and evaluation of methods for osmotic induction marking of golden perch Macquaria ambigua with calcein and alizarin reds. N. Am. J. Fish. Manag. 2009, 29, 279–287. [Google Scholar] [CrossRef]
  9. Morales-Nin, B.; Grau, A.; Pérez-Mayol, S.; Gil, M.M. Marking of otoliths, age validation and growth of Argyrosomus regius juveniles (Sciaenidae). Fish. Res. 2010, 6, 76–80. [Google Scholar] [CrossRef]
  10. Zhu, Y.H.; Jiang, T.; Chen, X.b.; Liu, H.b.; Yang, J. Effect evaluation of alizarin complexone marking for otoliths of juvenile black carp (Mylopharyngodon piceus). South China Fish. Sci. 2021, 17, 93–100. [Google Scholar]
  11. Clear, N.P.; Gunn, J.S.; Rees, A.J. Direct validation of annual increments in the otoliths of juvenile southern bluefifin tuna, Thunnus maccoyii, by means of a large-scale mark–recapture experiment with strontium chloride. Fish. Bull. 2000, 98, 25–40. [Google Scholar]
  12. Blom, G.; Nordeide, J.T.; Svasand, T.; Borge, A. Application of two flfluorescent chemicals, alizarin complexone and alizarin red S, to mark otoliths of Atlantic cod, Gadus morhua L. Aquac. Fish. Manag. 1994, 25, 229–243. [Google Scholar]
  13. Lü, H.J.; Fu, M.I.; Zhang, Z.X.; Su, S.Q.; Yao, W.Z. Marking fish with fluorochrome dyes. Rev. Fish. Sci. Aquac. 2020, 28, 117–135. [Google Scholar] [CrossRef]
  14. Liu, Q.; Zhang, X.M.; Zhang, P.D.; Nwafili, S.A. The use of alizarin red S and alizarin complexone for immersion marking Japanese flounder Paralichthys olivaceus. Fish. Res. 2009, 98, 67–74. [Google Scholar] [CrossRef]
  15. Spires, J.E.; Dungan, C.F.; North, E.W. Marking the shells of pediveliger eastern oysters Crassostrea virginica, with a calcein fluorochrome dye. J. Shellfish. Res. 2022, 40, 479–487. [Google Scholar] [CrossRef]
  16. Moran, A.L. Calcein as a marker in experimental studies newly-hatched gastropods. Mar. Biol. 2000, 137, 893–898. [Google Scholar] [CrossRef]
  17. Chen, P.M.; Yuan, H.R.; Jia, X.P.; Qin, C.X.; Cai, W.G.; Yu, J.; Su, L.M.; Li, X.G.; Zhou, Y.B. Changes in fishery resources of Yangmeikeng artificial reef area in Daya Bay. South China Fish. Sci. 2013, 9, 100–108. [Google Scholar]
  18. Liu, Y.; Sun, D.R.; Geng, Q.; Yang, C.P.; Zhao, J.; Duan, Y. Comparative study on immersion marking with alizarin red S and calcein for black porgy Acanthopagrus schlegelii of different sizes. South China Fish. Sci. 2016, 12, 17–24. [Google Scholar]
  19. Lv, H.J. Experimental Studies of Marking Techniques and Mark-Recapture for Juvenile Black Rockfish (Sebasews schlegelii) and Japanese Flounder (Paralichthys olivaceus); Ocean University of China: Qingdao, China, 2013. [Google Scholar]
  20. Katayama, S.; Isshiki, T. Variation in otolith macrostructure of Japanese flounder (Paralichthys olivaceus): A method to discriminate between wild and released fish. J. Sea Res 2007, 57, 180–186. [Google Scholar] [CrossRef]
  21. Xu, C.; Chen, G.Z.; Lin, X.T.; Yao, D.Z.; Zhao, T. Otolith tagging and daily increments validation with fluoresecent substance in larval Channa asiatica. J. Hydro. 2012, 33, 110–114. [Google Scholar]
  22. Daniel, W.B.; Robert, G.S. A simple method for marking fish otoliths with alizarin compounds. T. Am. Fish. Soc. 1996, 125, 146–149. [Google Scholar]
  23. Poczyczyński, K.K.; Kozłowski, J.; Martyniak, A. Marking and return method for evaluating the effects of stocking larval vendace, Coregonus albula (L.), into Lake Wigry in 2000–2001. Arch. Pol. Fish. 2011, 19, 259–265. [Google Scholar] [CrossRef]
  24. Shen, H.; Wan, X.H.; Wang, L.B.; Zhang, Z.Y.; Yao, G.Q.; Hu, C.M.; Ling, Y. Comparative studies of behaviors of the predation of different fishes and hedging of Exopalaemon carinicauda Holthuis. J. Aquac. 2010, 31, 40–42. [Google Scholar]
  25. Hang, X.R.; Zhuang, P. Status and practice of fish behavioral studies. Freshw. Fish 2002, 32, 53–56. [Google Scholar]
  26. Wu, C.W.; Xu, M.Y.; Hu, C.C. Study on the behavioral characteristics of fishes in the deep water sea cage. J. Fish. China 2006, 30, 481–488. [Google Scholar]
  27. Simon, J.; Dörner, H. Marking the European eel with oxytetracycline, alizarin red and coded wire tags: An evaluation of methods. J. Fish Biol. 2005, 67, 1486–1491. [Google Scholar] [CrossRef]
  28. Jerre, W.M. Immersion of larval Atlantic salmon in calcein solutions to induce a non-lethally detectable mark. N. Am. J. Fish. Manag. 1997, 17, 751–756. [Google Scholar]
  29. Monaghan, J. Notes: Comparison of calcein and tetracycline as chemical markers in summer flounder. T. Am. Fish. Soc. 1993, 122, 298–301. [Google Scholar] [CrossRef]
  30. Le, J.B.; Wei, Q.W.; Sun, Q.L.; Li, L.X.; Gan, F. Alizarin marking of otolith at eyed eggs and larvae stages in Brachymystax lenok tsinlingensis. Freshw. Fish 2011, 41, 10–16. [Google Scholar]
Figure 1. Mean body lengths and weights of black sea bream at different times after ARS (A,B) and CAL (C,D) marking treatment. Data were collected on the 0, 10th, 20th, 30th, 40th and 50th d of the growth experiment.
Processes 10 02041 g001
Figure 2. Marking quality of otolith (A,E), scale (B,F), fin ray (C,G) and fin spine (D,H) using ARS under green light (AD) and CAL under blue light (EH). Scale bars: A, B, E, F = 1 mm, C, D, G, H = 2 mm.
Processes 10 02041 g002
Figure 3. Effects of marking in the fin ray, fin spine, scale and otolith of black sea bream subjected to ARS (200 mg/L) and CAL (350 mg/L) treatment for 24 h. Data were collected on the 0, 10th, 20th, 30th, 40th and 50th day of the growth experiment.
Processes 10 02041 g003
Table 1. Wavelength parameters of the fluorescent light source used to detect the fluorescent mark.
Light SourceWavelength
Excitation FilterBarrier Filter
DAPI357/44447/60
GFP470/22510/42
RFP531/40593/40
Table 2. Effects of ARS staining on juvenile fish mortality (180 test fish per group).
Concentration
mg/L
Marking Duration (h)Number of DeathsTotal Mortality (%)
Deaths during MarkingDeaths 48 h after Marking
02445326.67
1844527.22
1002491513.33
18523.89
20024444.44
18000.00
30024412.78
18010.56
40024010.56
18010.56
Table 3. Effects of CAL staining on juvenile fish mortality (180 test fish per group).
Concentration mg/LMarking Duration (h)Number of DeathsTotal Mortality (%)
Deaths during MarkingDeaths 48 h after Marking
02445326.67
1844527.22
502423113.33
181317.78
1502428518.33
181518.89
2502414410.00
18423.33
350241238.33
18423.33
Table 4. Effects of different immersion times on marking in the fin spine, fin ray, scale and otolith of black sea bream for different concentrations of ARS.
TimeConcentration
mg/L
24 h18 h
Fin Spine (P) Fin Ray (P)ScaleOtolithFin Spine (P)Fin Ray (P)ScaleOtolith
10 d1004.78 ± 0.445.00 ± 0.003.67 ± 0.712.44 ± 0.534.00 ± 0.004.25 ± 0.503.50 ± 1.003.00 ± 0.00
2004.44 ± 0.534.78 ± 0.444.33 ± 0.502.67 ± 0.504.00 ± 0.004.50 ± 0.584.00 ± 0.002.75 ± 0.50
3004.78 ± 0.444.78 ± 0.444.33 ± 0.502.33 ± 0.504.00 ± 0.004.00 ± 0.003.75 ± 0.502.50 ± 0.58
4004.78 ± 0.444.78 ± 0.444.22 ± 0.672.44 ± 0.534.00 ± 0.004.00 ± 0.003.25 ± 0.502.25 ± 0.50
20 d1004.78 ± 0.444.89 ± 0.334.00 ± 0.712.64 ± 0.504.00 ± 0.004.40 ± 0.552.20 ± 0.452.00 ± 0.00
2004.78 ± 0.444.78 ± 0.444.00 ± 1.002.67 ± 0.503.25 ± 0.963.50 ± 1.003.00 ± 1.151.75 ± 0.50
3004.78 ± 0.444.89 ± 0.333.67 ± 0.872.56 ± 0.534.00 ± 0.004.00 ± 0.002.00 ± 0.001.40 ± 0.55
4004.44 ± 0.534.44 ± 0.533.67 ± 0.712.78 ± 0.443.20 ± 0.843.40 ± 0.892.40 ± 0.892.00±0.00
30 d1004.40 ± 0.554.60 ± 0.553.80 ± 1.102.40 ± 0.553.80 ± 0.453.60 ± 0.552.00 ± 0.001.80 ± 0.45
2004.67 ± 0.584.67 ± 0.583.67 ± 0.582.67 ± 0.584.00 ± 0.004.00 ± 0.002.00 ± 0.002.00 ± 0.00
3004.80 ± 0.454.60 ± 0.554.00 ± 0.002.40 ± 0.554.00 ± 0.004.00 ± 0.002.00 ± 0.002.00 ± 0.00
4004.60 ± 0.554.40 ± 0.554.00 ± 0.712.40 ± 0.554.20 ± 0.454.20 ± 0.452.40 ± 0.891.80 ± 0.45
40 d1003.50 ± 0.584.25 ± 0.502.75 ± 0.502.25 ± 0.503.80 ± 0.453.60 ± 0.552.00 ± 0.002.00 ± 0.00
2004.67 ± 0.584.33 ± 0.583.67 ± 0.583.00 ± 0.003.67 ± 0.583.67 ± 0.582.00 ± 0.002.00 ± 0.00
3003.67 ± 1.613.61 ± 1.562.86 ± 1.242.43 ± 1.114.00 ± 0.003.80 ± 0.452.00 ± 0.002.00 ± 0.00
4004.12 ± 0.984.11 ± 1.003.10 ± 0.772.69 ± 0.624.00 ± 0.004.00 ± 0.002.00 ± 0.002.00 ± 0.00
50 d1003.67 ± 0.583.67 ± 0.583.33 ± 0.582.33 ± 0.584.00 ± 0.003.67 ± 0.582.00 ± 0.002.00 ± 0.00
2004.33 ± 0.584.00 ± 0.004.00 ± 0.002.00 ± 0.003.80 ± 0.453.80 ± 0.452.00 ± 0.002.00 ± 0.00
3003.67 ± 0.583.67 ± 0.583.00 ± 0.003.00 ± 0.003.60 ± 0.893.60 ± 0.892.00 ± 0.002.00 ± 0.00
4004.00 ± 0.634.00 ± 0.003.00 ± 0.003.00 ± 0.003.80 ± 0.453.60 ± 0.552.00 ± 0.002.00 ± 0.00
Publisher’s Note: MDPI stays neutral with regard to jurisdictional claims in published maps and institutional affiliations.

