Article

Assessment and Removal of Heavy Metals and Other Ions from the Industrial Wastewater of Faisalabad, Pakistan

1
Department of Chemistry, Hafiz Hayat Campus, University of Gujrat, Gujrat 50700, Pakistan
2
Department of Chemistry, University of Okara, Okara 56300, Pakistan
*
Authors to whom correspondence should be addressed.
Submission received: 9 September 2022 / Revised: 12 October 2022 / Accepted: 18 October 2022 / Published: 22 October 2022

Abstract

:
The contamination of surface and groundwater is of major concern around the globe due to the fast industrialization and urbanization. The groundwater and water quality of rivers, Ravi and Chenab in Faisalabad, Pakistan are contaminated due to the industrial wastewater. The aim of this study was the assessment of the physiochemical contaminants of Faisalabad’s industrial wastewater area and the adsorptive removal of ions present in high concentrations following the National Environmental Quality Standards (NEQS) for the municipal and industrial liquid effluents of Pakistan. One of the two samples was collected from a drain carrying wastewater from different industries and other from the outlet of a drain discharging wastewater into river Chenab. The analysis results obtained indicate that most of the contaminants were below the acceptable limit of industrial wastewater NEQS, Pakistan. However, contaminants like sulfate ions (714 mg/L), total dissolved solids (33,951–34,620 mg/L) and barium ions (11–15 mg/L) were found to be higher than the allowable level of NEQS for the municipal and industrial liquid effluents for Pakistan. A novel biosorbent synthesized indigenously from Monotheca buxifolia seeds was used for the removal of sulfate, barium and TDS from the wastewater effluent samples. This biosorbent successfully reduced the sulfate ion concentration in the wastewater sample from 714 to 420 mg/L at pH 6 in 1 h. Similarly, the concentration of TDS reduced to 33,951 from 6295 mg/L at pH 4, whereas barium ions were removed from 15 to 1 mg/L at pH 10 in 1 h. Treatment of wastewater through the synthesized biosorbent efficiently removed the high concentration ions and could potentially be applied to reduce the toxic effects of these contaminants on local public health.

1. Introduction

The production of waste by human activities is inevitable and a major part of these wastes often enter water as wastewater [1]. Industrial wastewater entering water sources is one of the main causes of ecological pollution as it affects the quality of drinking water, soil and aquatic environment [2]. There are several types of industrial wastewater based on the different industries and nature of pollutants. Each industrial zone generates its own specific mixture of contaminants [3]. Contamination of surface and groundwater is a growing problem due to fast industrialization and urbanization [4]. The setting up of new industries and the extension of the present industries are already producing abundant volumes of industrial waste [5]. The textiles, food, chemicals, paper and pulp, leather and tanneries, mining, metallurgy, and manufacturing products related industries are mainly responsible for industrial wastewater [6]. The boiler-feed, evaporative cooling and process water, and irrigation of grounds surrounding the industrial plant are the most common waters used by different industries [7].
The industrial wastes causing environmental contamination by trace and heavy metals and chemicals is one of the foremost health problems in industrial cities. During industrial metallurgical processing, a massive quantity of slags is produced and it can become a large source of heavy metals in water pollution. Industrial contamination directly impacts health through different chemicals when they discharge from the industries. When these chemicals cross a specific limit they have adverse effects in the blood, heart, kidneys, liver, and reproductive organs in humans [8]. Hence, the assessment of heavy metals to ensure they are kept within permissible concentrations is a key factor in maintaining the environment and preventing its contaminations. The sample collection and analysis of industrial wastes takes place as per laws and regulations. The two central laws for wastes discharged from industries that governs the compliance are the Clean Water Act and the Resource Conservation and Recovery Act. These laws not only ensure restrictions on different contaminants, but they also involve different procedures for sample collection and analysis of wastewater [9].
The wastewater of industries is a potential risk to water quality throughout the world. However, in developing countries such as Pakistan the condition is worse as the industrial wastes are directly discharged without any specific treatment [10]. In Pakistan the water quality is suffering from a lot of activities, such as wastewater released from industrial and agricultural runoff. The ground and surface water are mostly polluted from the derivatives of several industries, i.e., textile, sugar processing, metal, chemicals, dying, pesticides, pharmaceutical, and leather [11]. Municipal water and industrial effluents that reach the rivers are carried by canals and drains thus creating water contamination. Major pollutants in the rivers are nitrates, sulfates, and toxic metal ions that make the water unfit for drinking and other domestic purposes. The larger rivers Chenab and Ravi are severely polluted because of unplanned industrial wastewater management [12].
Faisalabad is the 3rd biggest city in Pakistan with a population of more than 4 million [13,14,15]. Faisalabad is a hub of various industries which includes textiles, paints, glass, bricks, rubber, pigments, cosmetic, pharmaceutics, ceramics, and other chemicals. All these industries produce wastewater in huge quantities and therefore industrial wastewater is one of the main environmental issue in Faisalabad city [14]. The groundwater and water quality of the river Ravi in Faisalabad is mostly contaminated due to the anthropogenic activities, including industrial, agricultural, domestic use of water, and discharge of drain water into the river without pre-treatment [16]. The production of wastewater is common due to the shortage of canal water, mostly in the areas located close to the industrial units. Due to the improper planning of industrial development and random urbanization, the city is facing various environmental problems [17]. Until now very little comprehensive research has been done on the assessment and mitigation of the industrial wastewater of Faisalabad. It is therefore pertinent to investigate the complete industrial wastewater profile of the industrial area of Faisalabad.
The usage of biosorbents for wastewater treatment is an active, green and cost effective technique to adsorb toxic heavy metals from wastewater that pollute groundwater and the aquatic environment [18]. Therefore, an attempt was made to assess the heavy metals and chemical content of the industrial wastewater of Faisalabad. Then, we prepared a cost effective and eco-friendly biosorbent to remove ions which were present in high concentrations and the study design is depicted in Scheme 1.

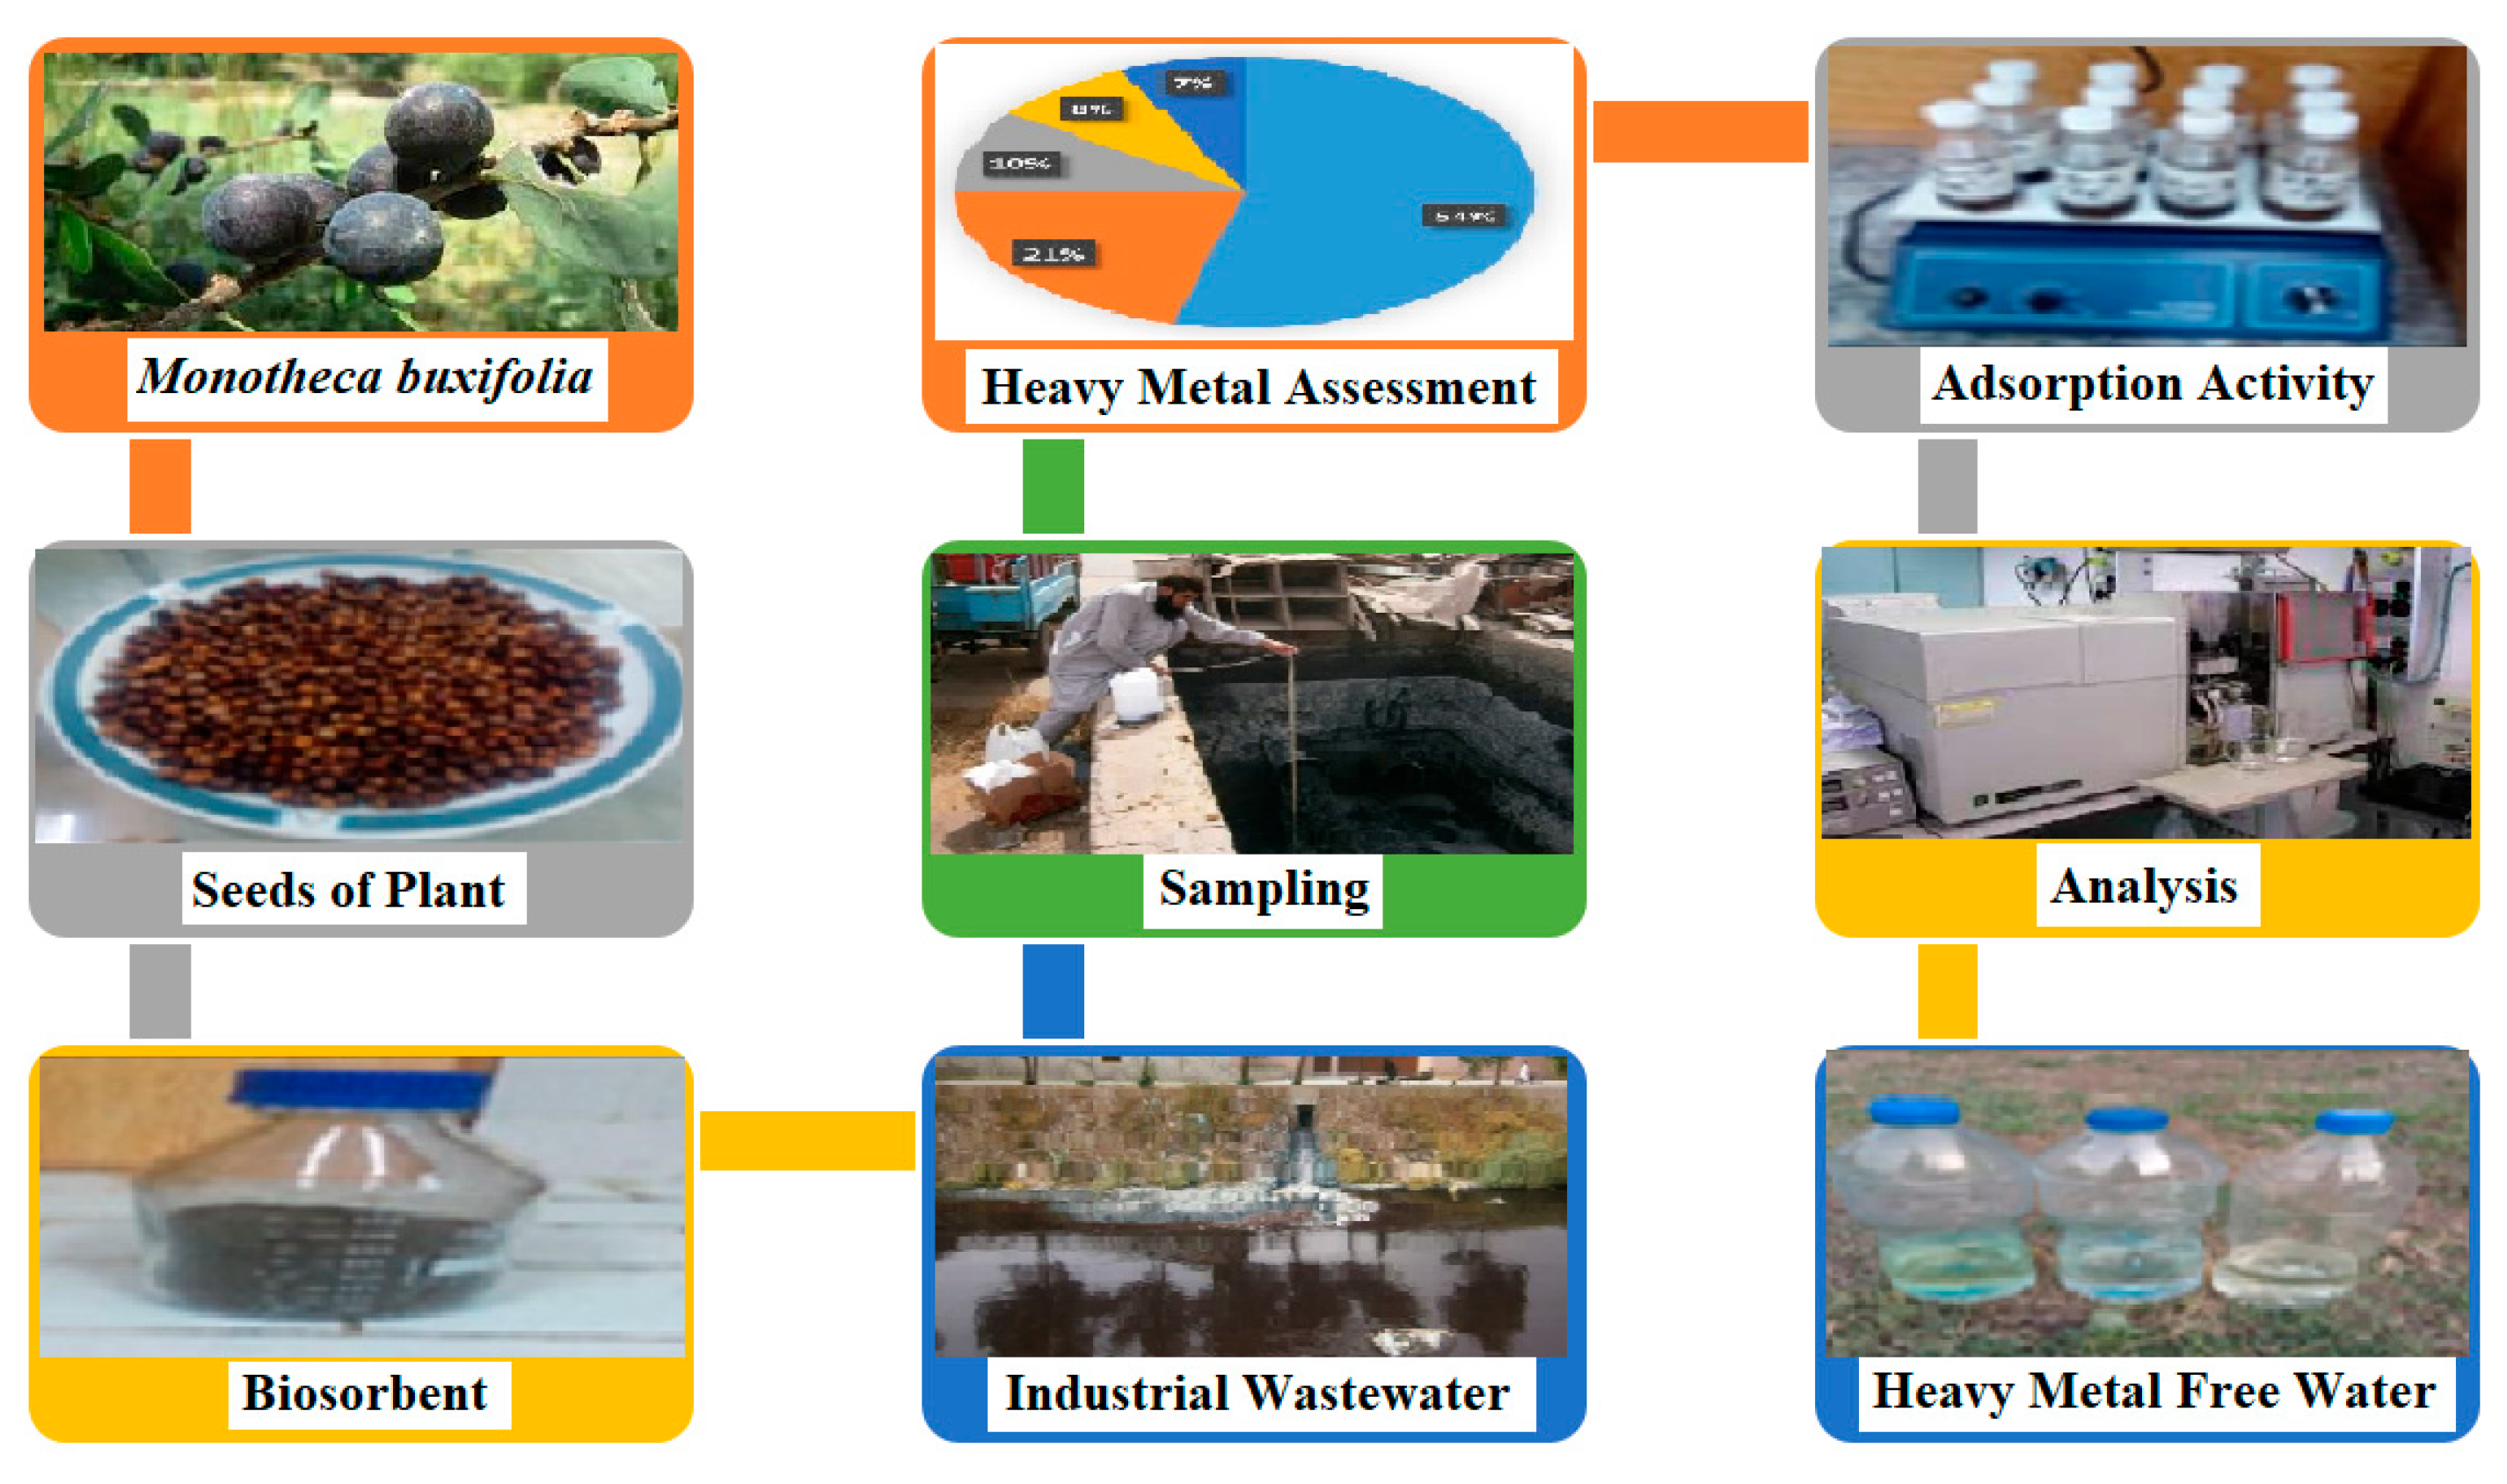
2. Materials and Methods
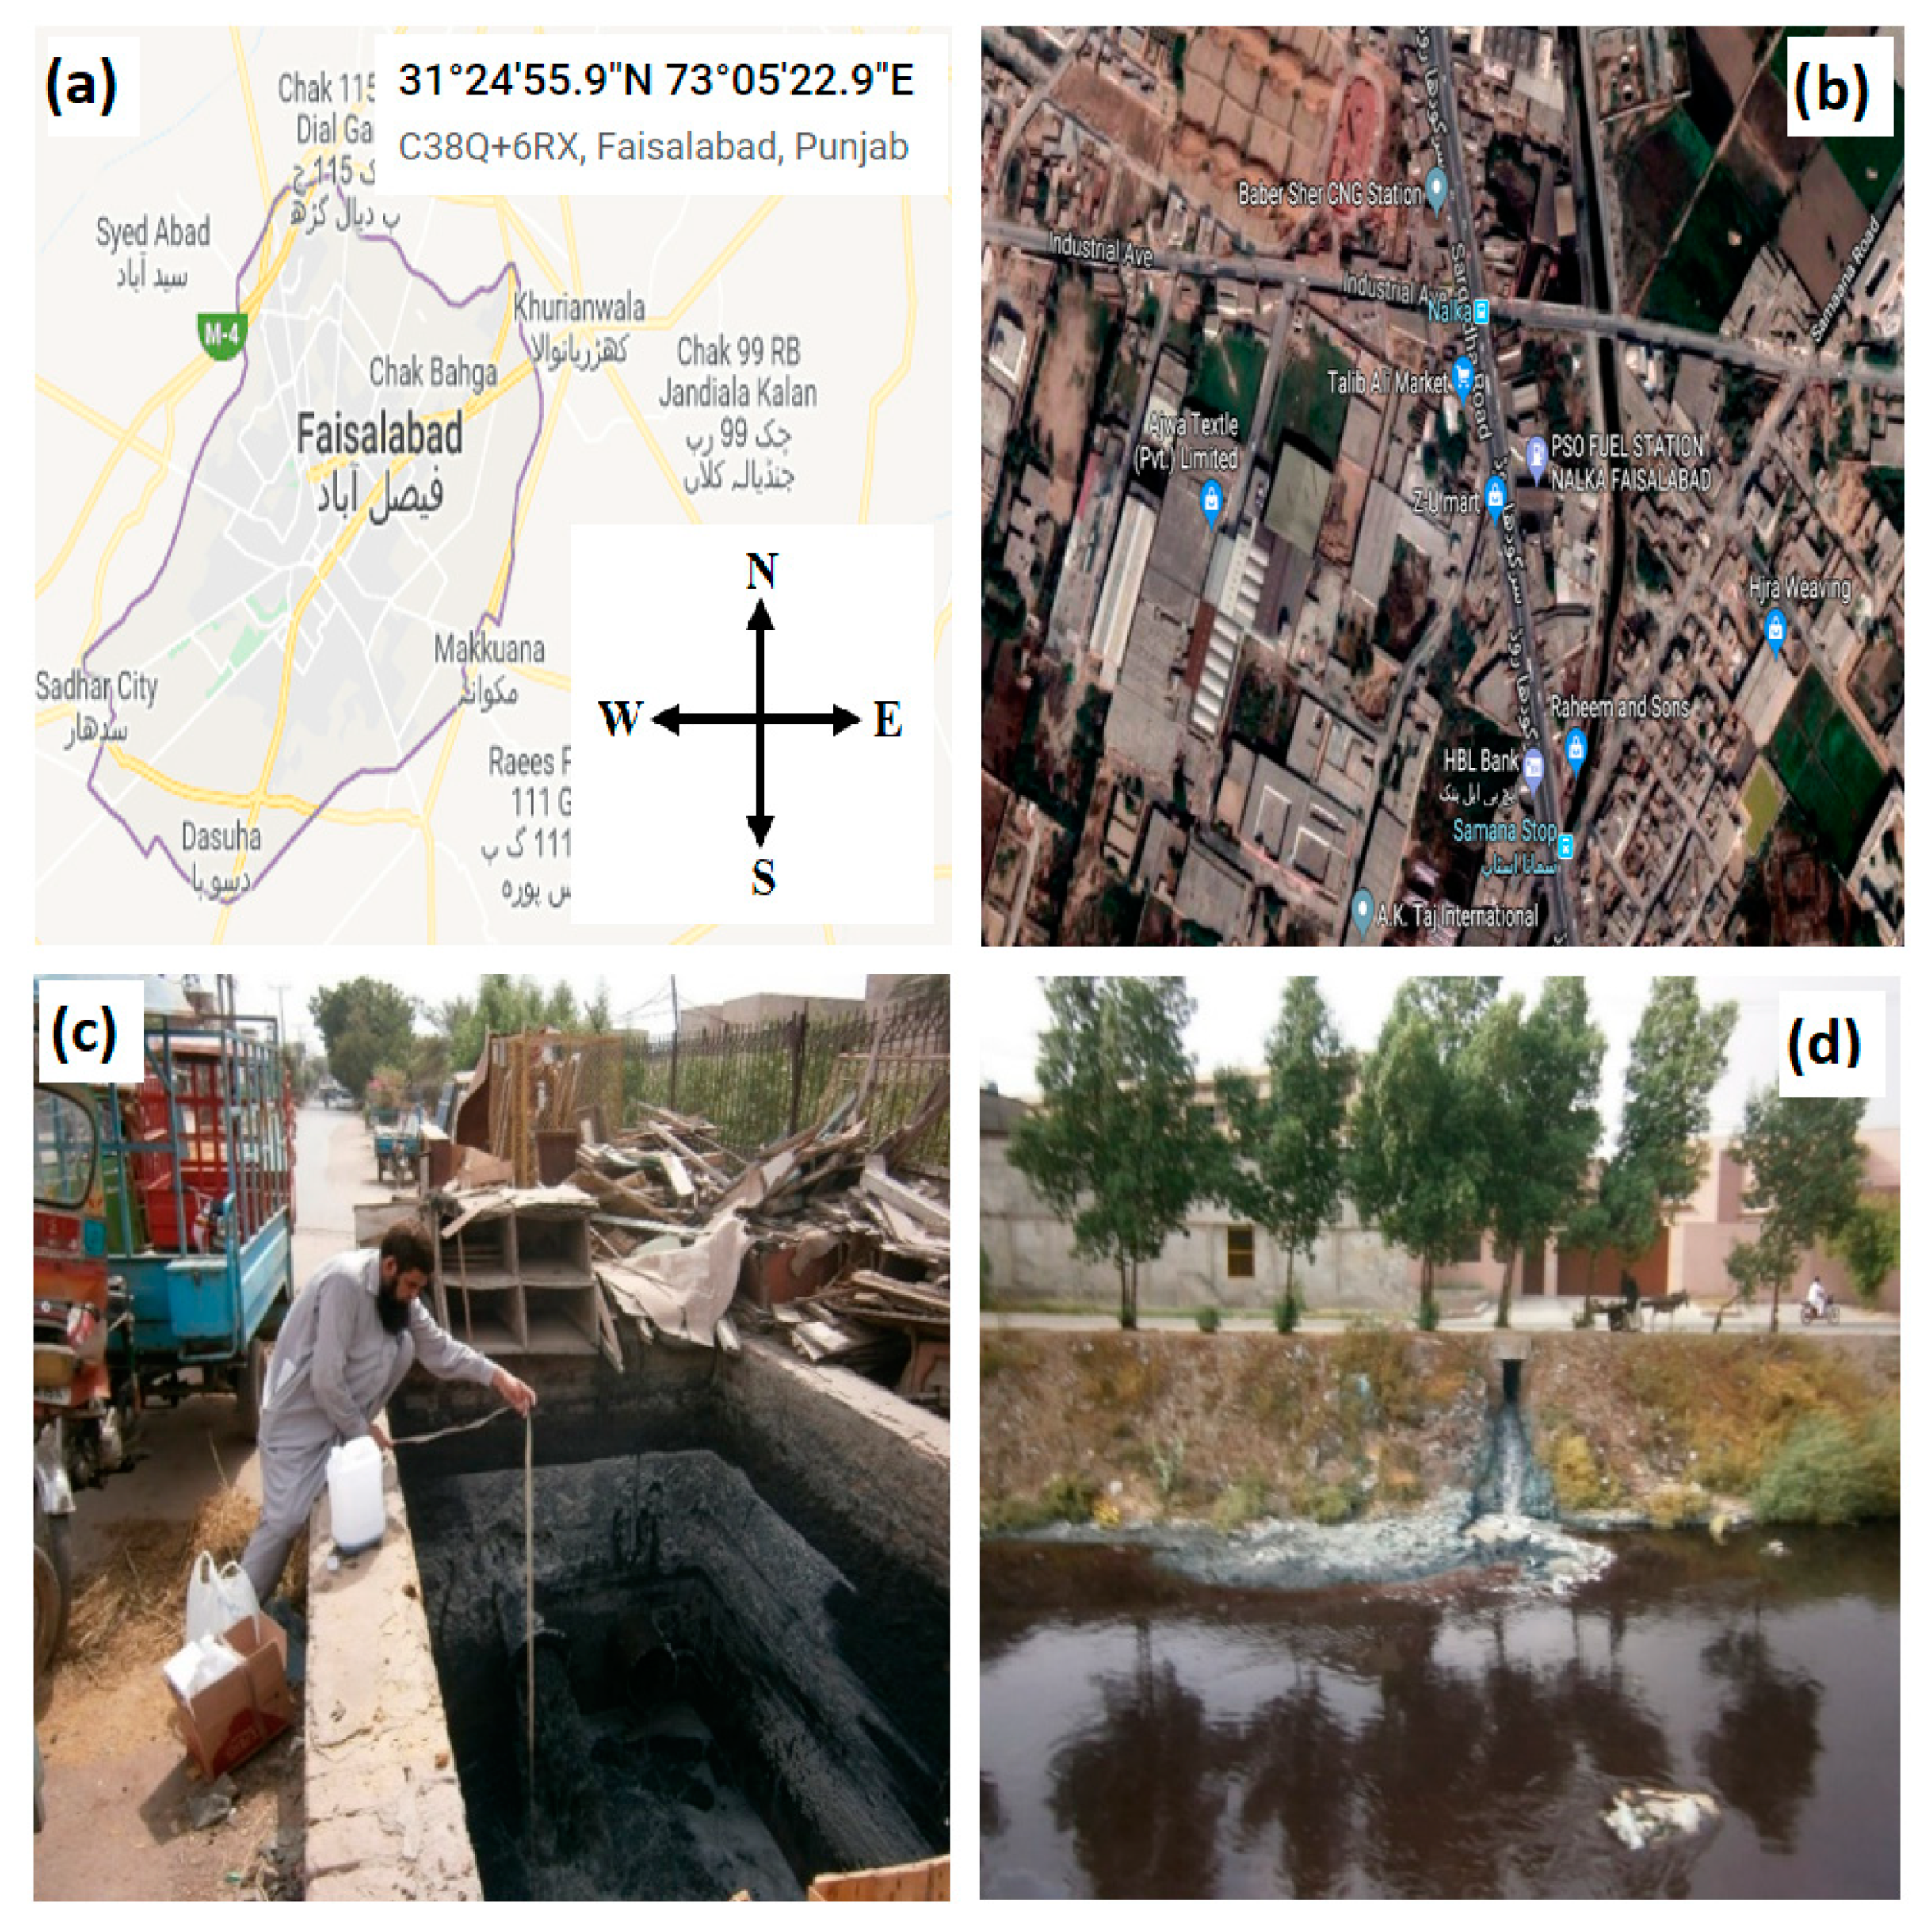
2.1. Study Area

The study was carried out in Faisalabad’s industrial area which is one of the most important industrial cities of the Punjab province of Pakistan. Faisalabad is located between two main persistent rivers, Chenab and Ravi, at 73.08′ E, 31.25′ N and at an altitude of 214 m above sea level. A map of Faisalabad and the sample collection area is shown in Figure 1a,b.

2.2. Samples Collection and Preservation

A total of two samples of wastewater were collected in polyethylene cans from the industrial area of Faisalabad, near the Sargodha road. One sample was collected from the main drain carrying the wastewater of different industries and the other sample was collected from the outlet of the main drain, passing toward agricultural land and finally into river Chenab (Figure 1c,d). After sample collection, the samples were filtered and preserved by the addition of HNO3 (pH > 2) as per standard methods [19].

2.3. Material & Instrumental Details

All chemicals used in this research were of analytical grade. The NaOH (Merck, Darmstadt, Germany) and HNO3 (Duksan Pure Chemicals Co. LtD, Ansan, Korea) were used for stock solution preparation with deionized water. Different glassware, filter papers, pH meter (OHAUS ST 10, Parsippan, NJ, USA), stopwatch, analytical balance (Sartorius CP323P, Gottingen, Germany), and orbital shaker (KJ-201BD, Ningbo, China) were used in adsorption studies. The different analytical techniques and instruments used for the different contaminants and heavy metals detection are shown in Table 1.

2.4. Preparation of Biosorbent

A novel biosorbent (Monotheca buxifolia seeds) was used for the removal of contaminants at high concentrations. The seeds were collected from M. boxifolia fruits and were first washed with tap water and then with deionized water to remove undesired particles. The seeds were then ground and dried in an oven at 110 °C for 24 h and the powder was preserved in an airtight bottle for adsorption studies.

2.5. Adsorption Activity

The batch adsorption technique was used for the removal of pollutants at high concentration by M. boxifolia. A stock solution was prepared by mixing equal ratios of 1 M sodium hydroxide and HNO3. The required solution of 0.1 M HNO3/NaOH was prepared from the stock solution to adjust the pH of sample solutions during the experiment. The adsorptive removal of ions was carried out at different pH, i.e., 2, 4, 6, 8, 10 and 12 by taking 50 mL of industrial wastewater in 100 mL Erlenmeyer flasks. The pH of the flasks was adjusted, using a pH meter and 0.1 M HNO3/NaOH mixture solution. The pH measurements were conducted at room temperature. Then, 0.1 g of biosorbent was placed in the flask and the resultant suspensions were shaken on an orbital shaker for 12 h at 110 rpm. The suspension was filtered through Whatman filter paper and the final concentration of the adsorbate species were determined by using a colorimeter, a conductivity meter, and a spectrophotometer [22,24,25].
The procedure for the study for the effect of contact time was the same as that of the pH study mentioned above; however, the suspension was shaken for time intervals, i.e., 5, 10, 15, 20, 25, 30, 35, 40, 45, 50, 55 and 60 mins at a fixed pH. In both cases, the amount of adsorbate, adsorbed per unit mass of M. buxifolia was calculated by the following q = (Ci − Cf) V/W × 1000, where q is the quantity of adsorbent adsorbed (mg/gm), Ci is the initial concentrations, Cf is the final concentrations (mg/L) and W is the weight of the adsorbent (gm).

3. Results and Discussion

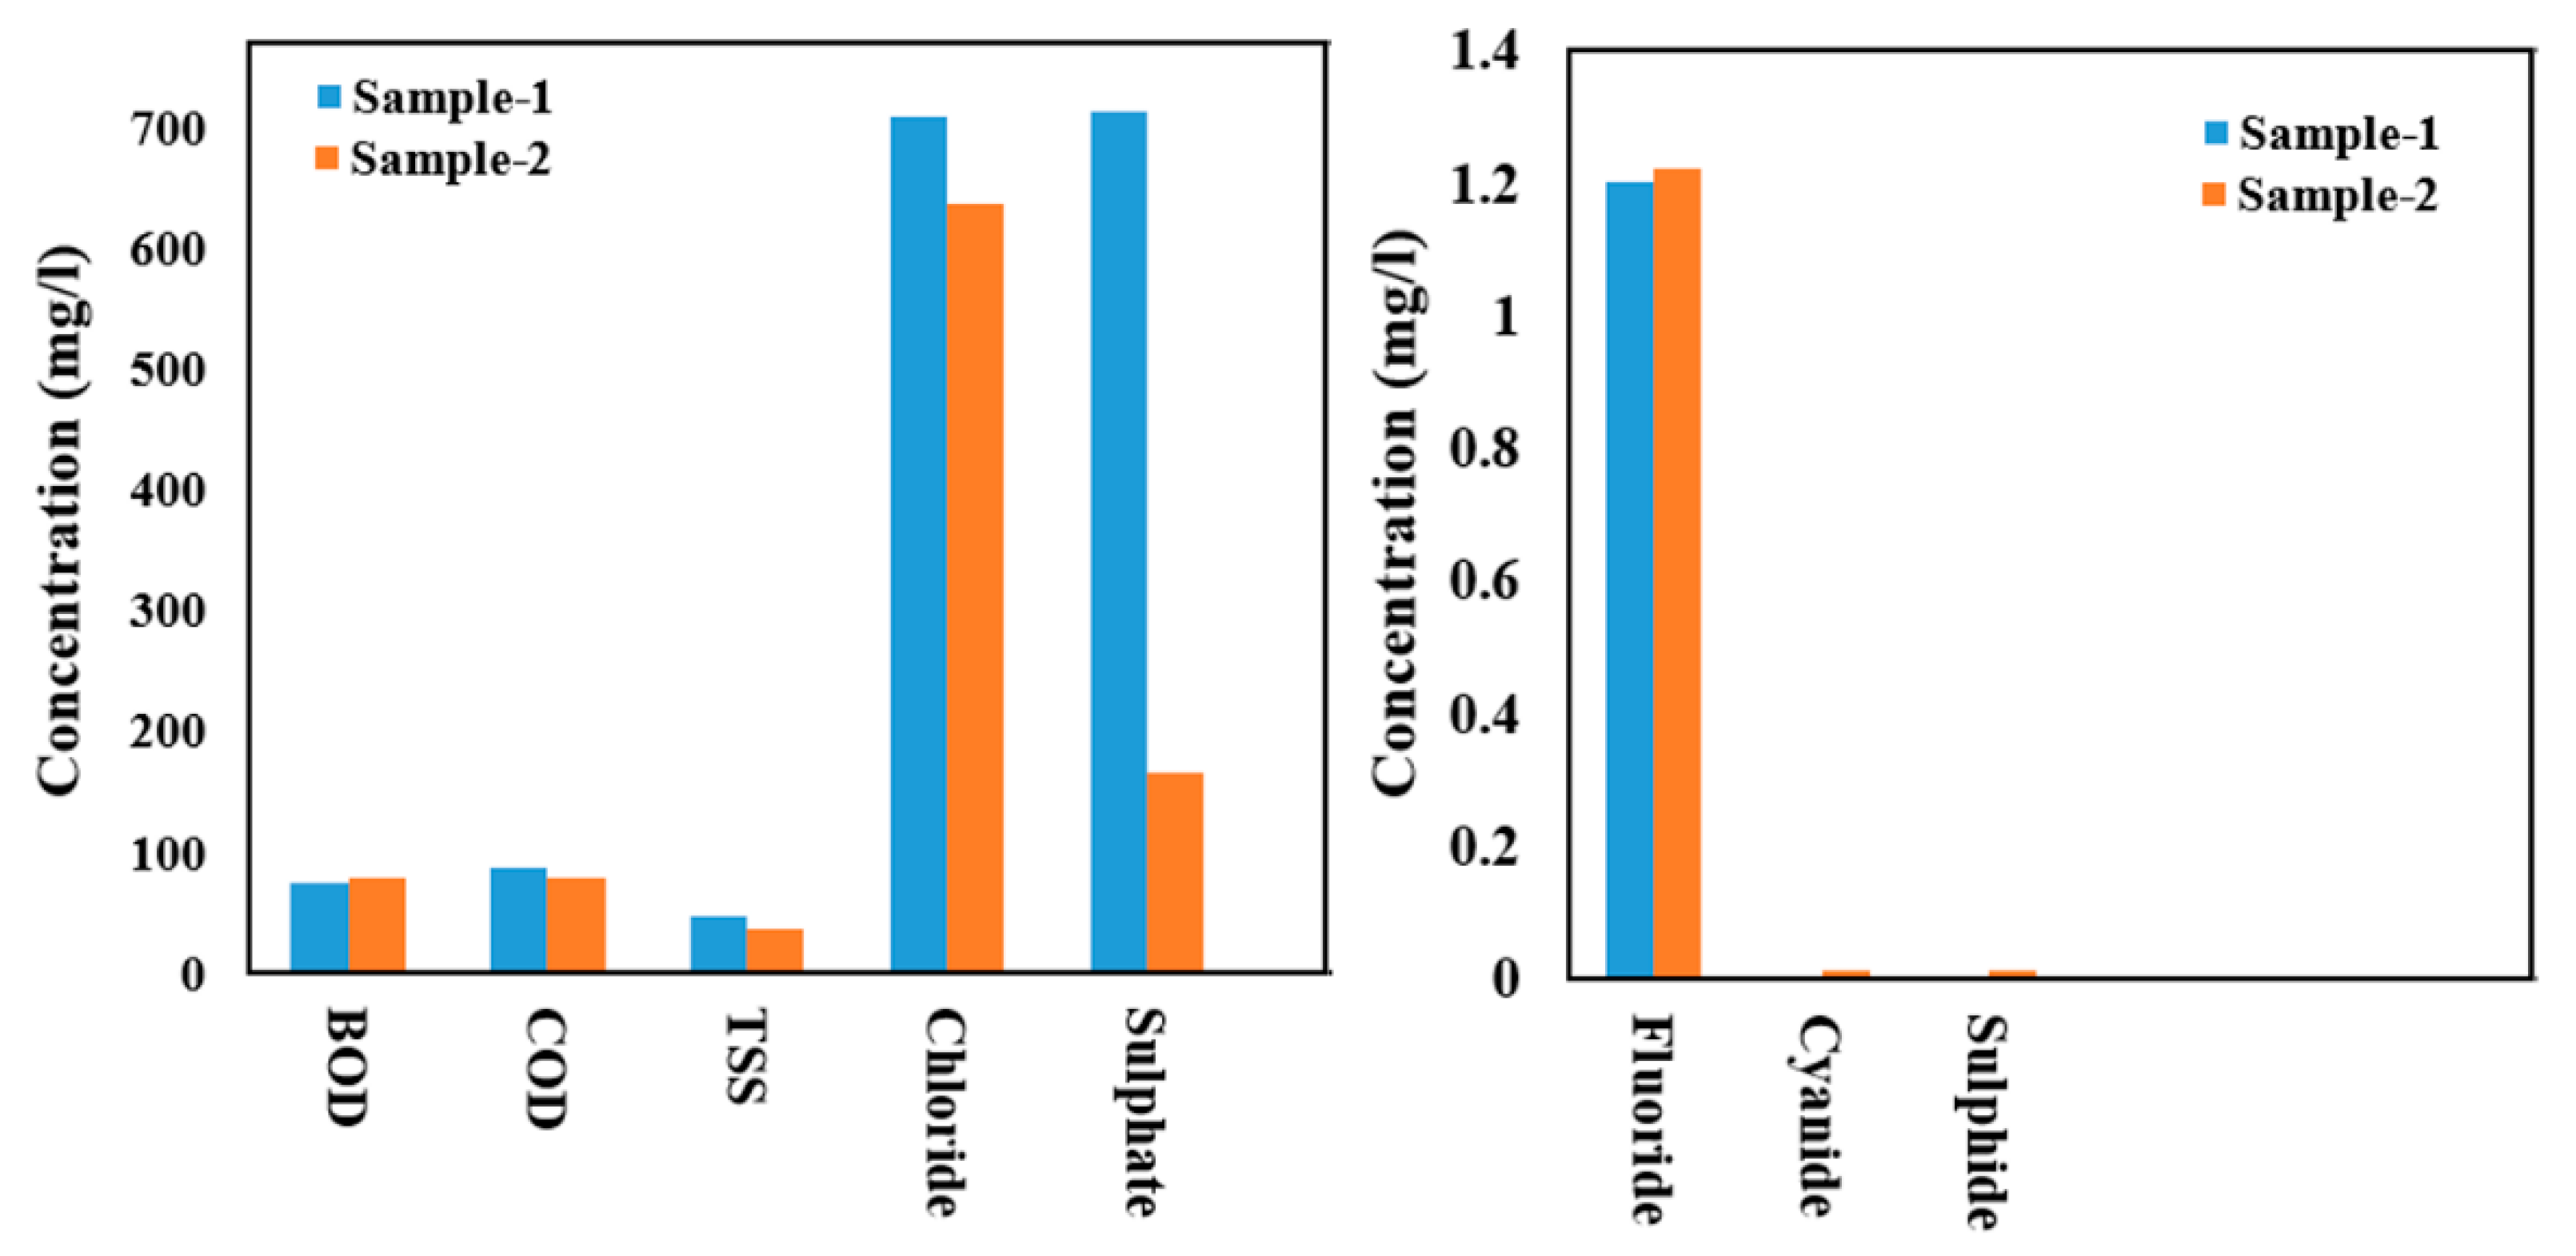
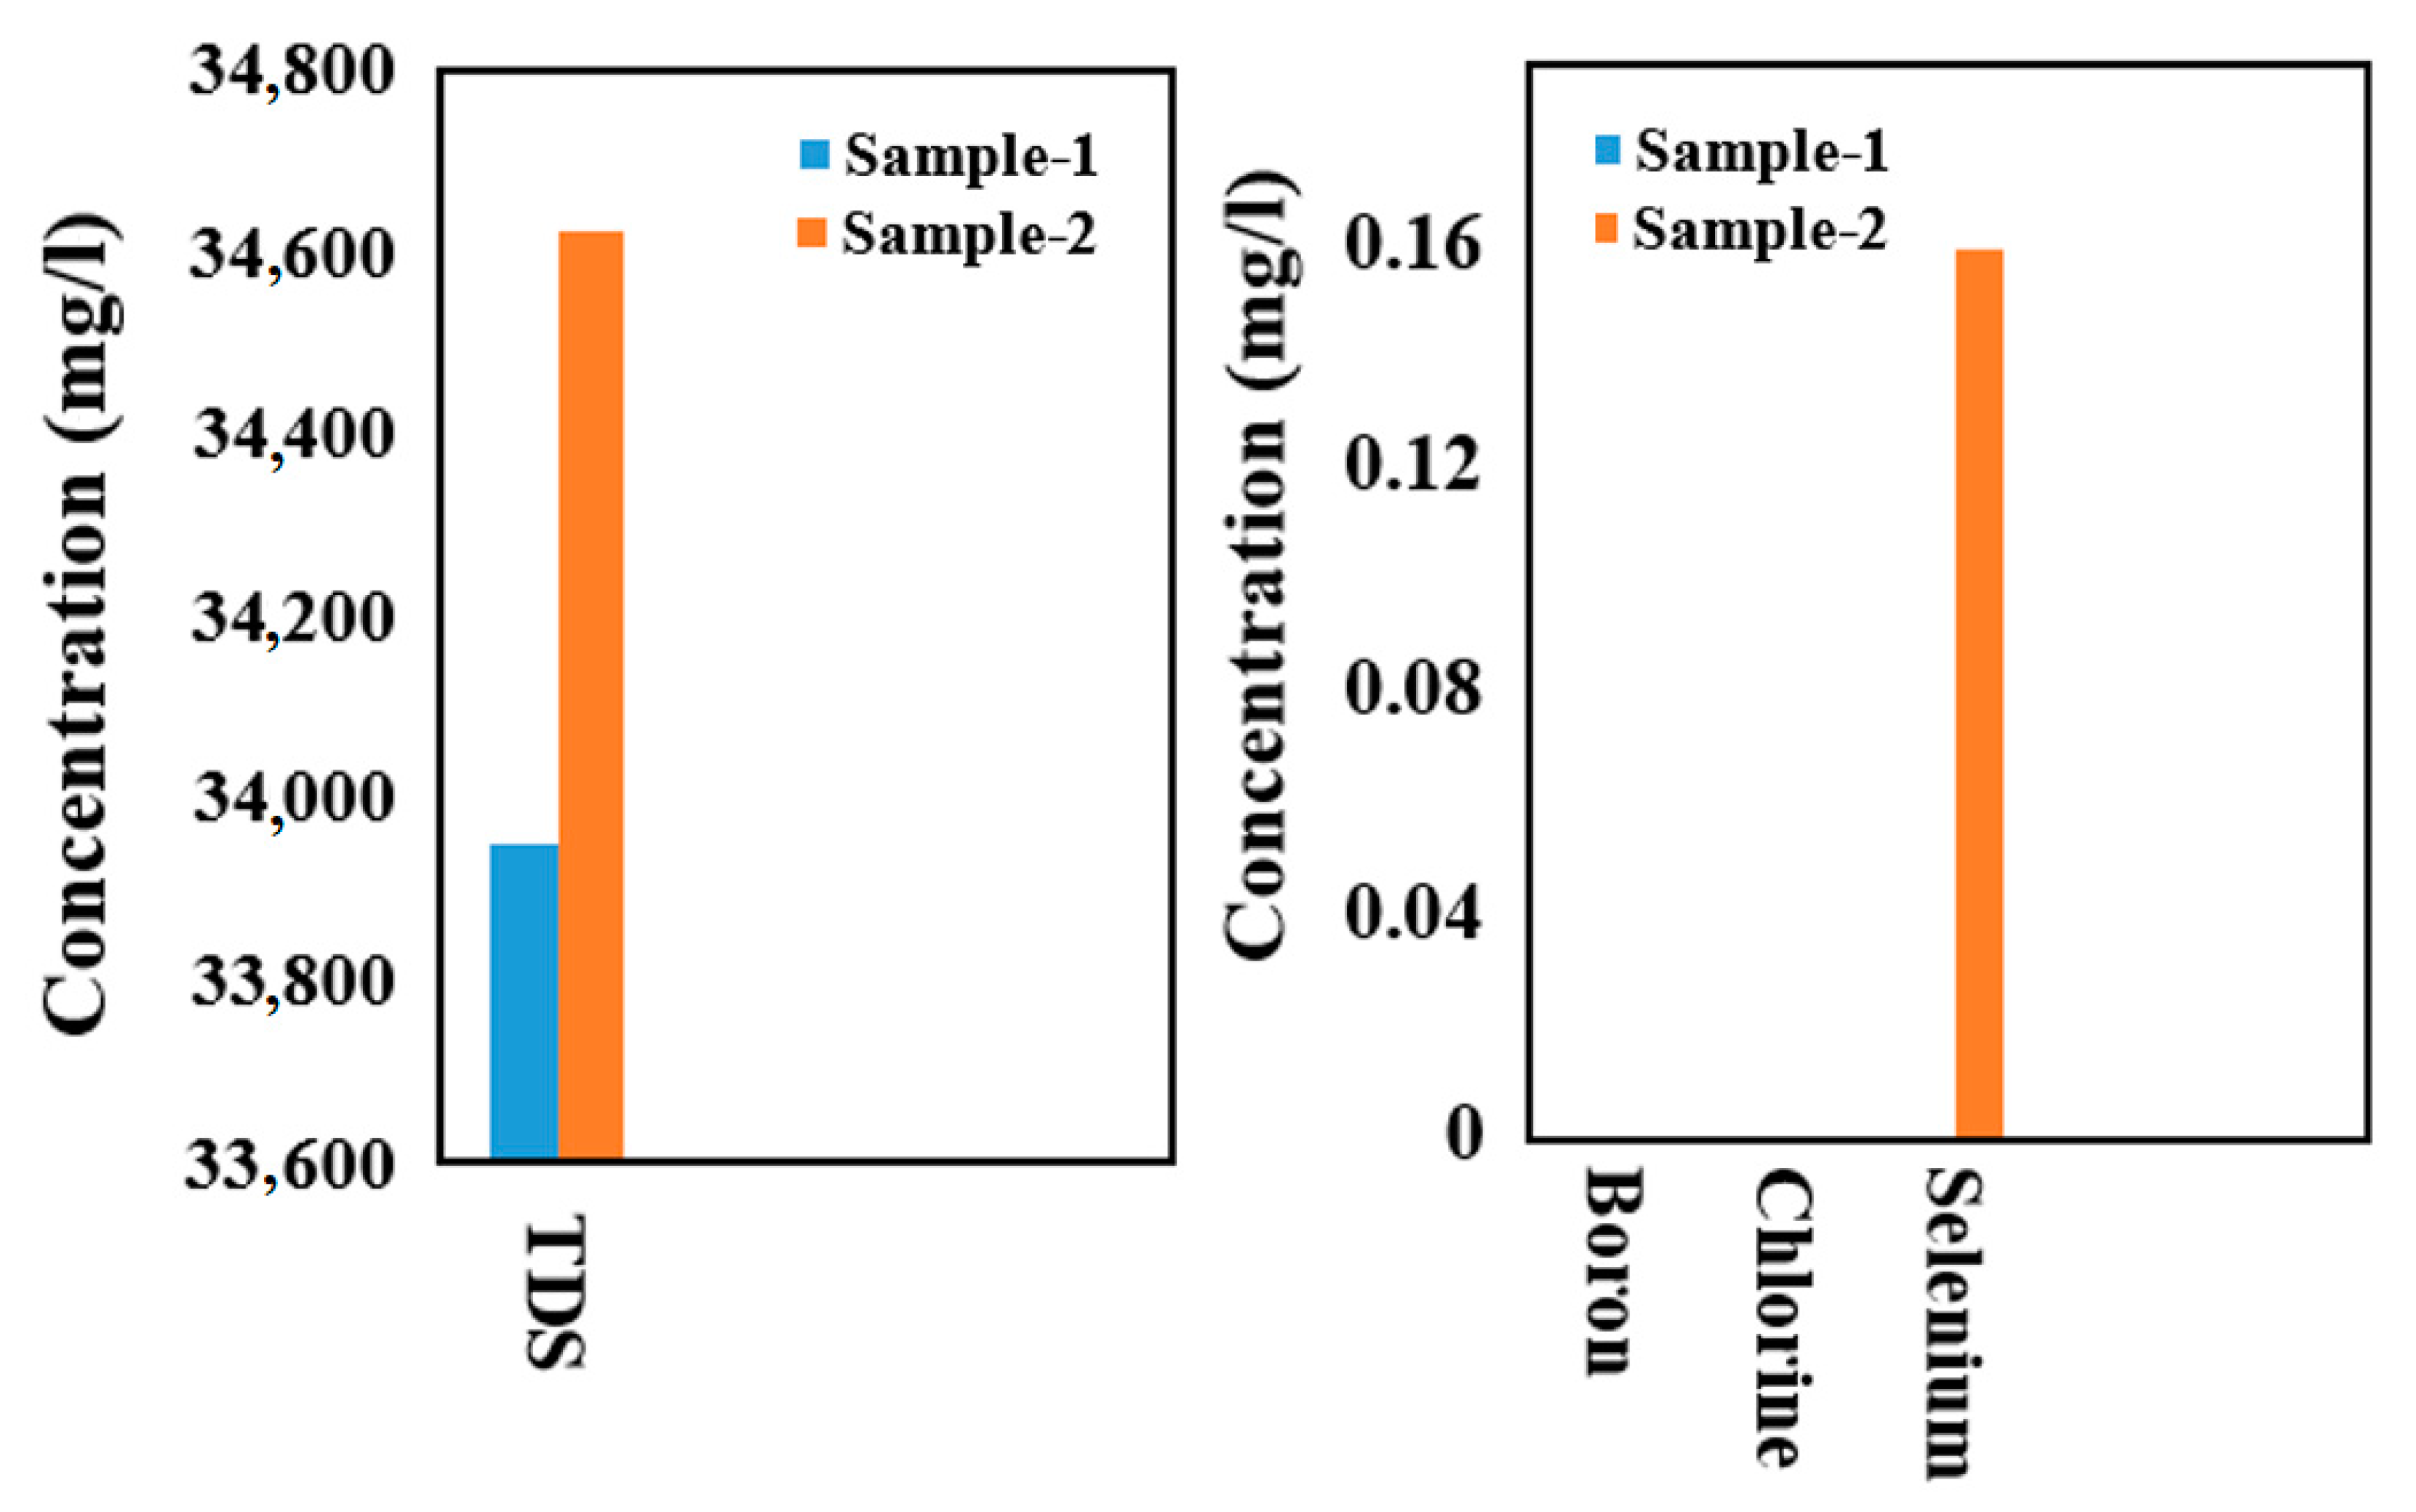
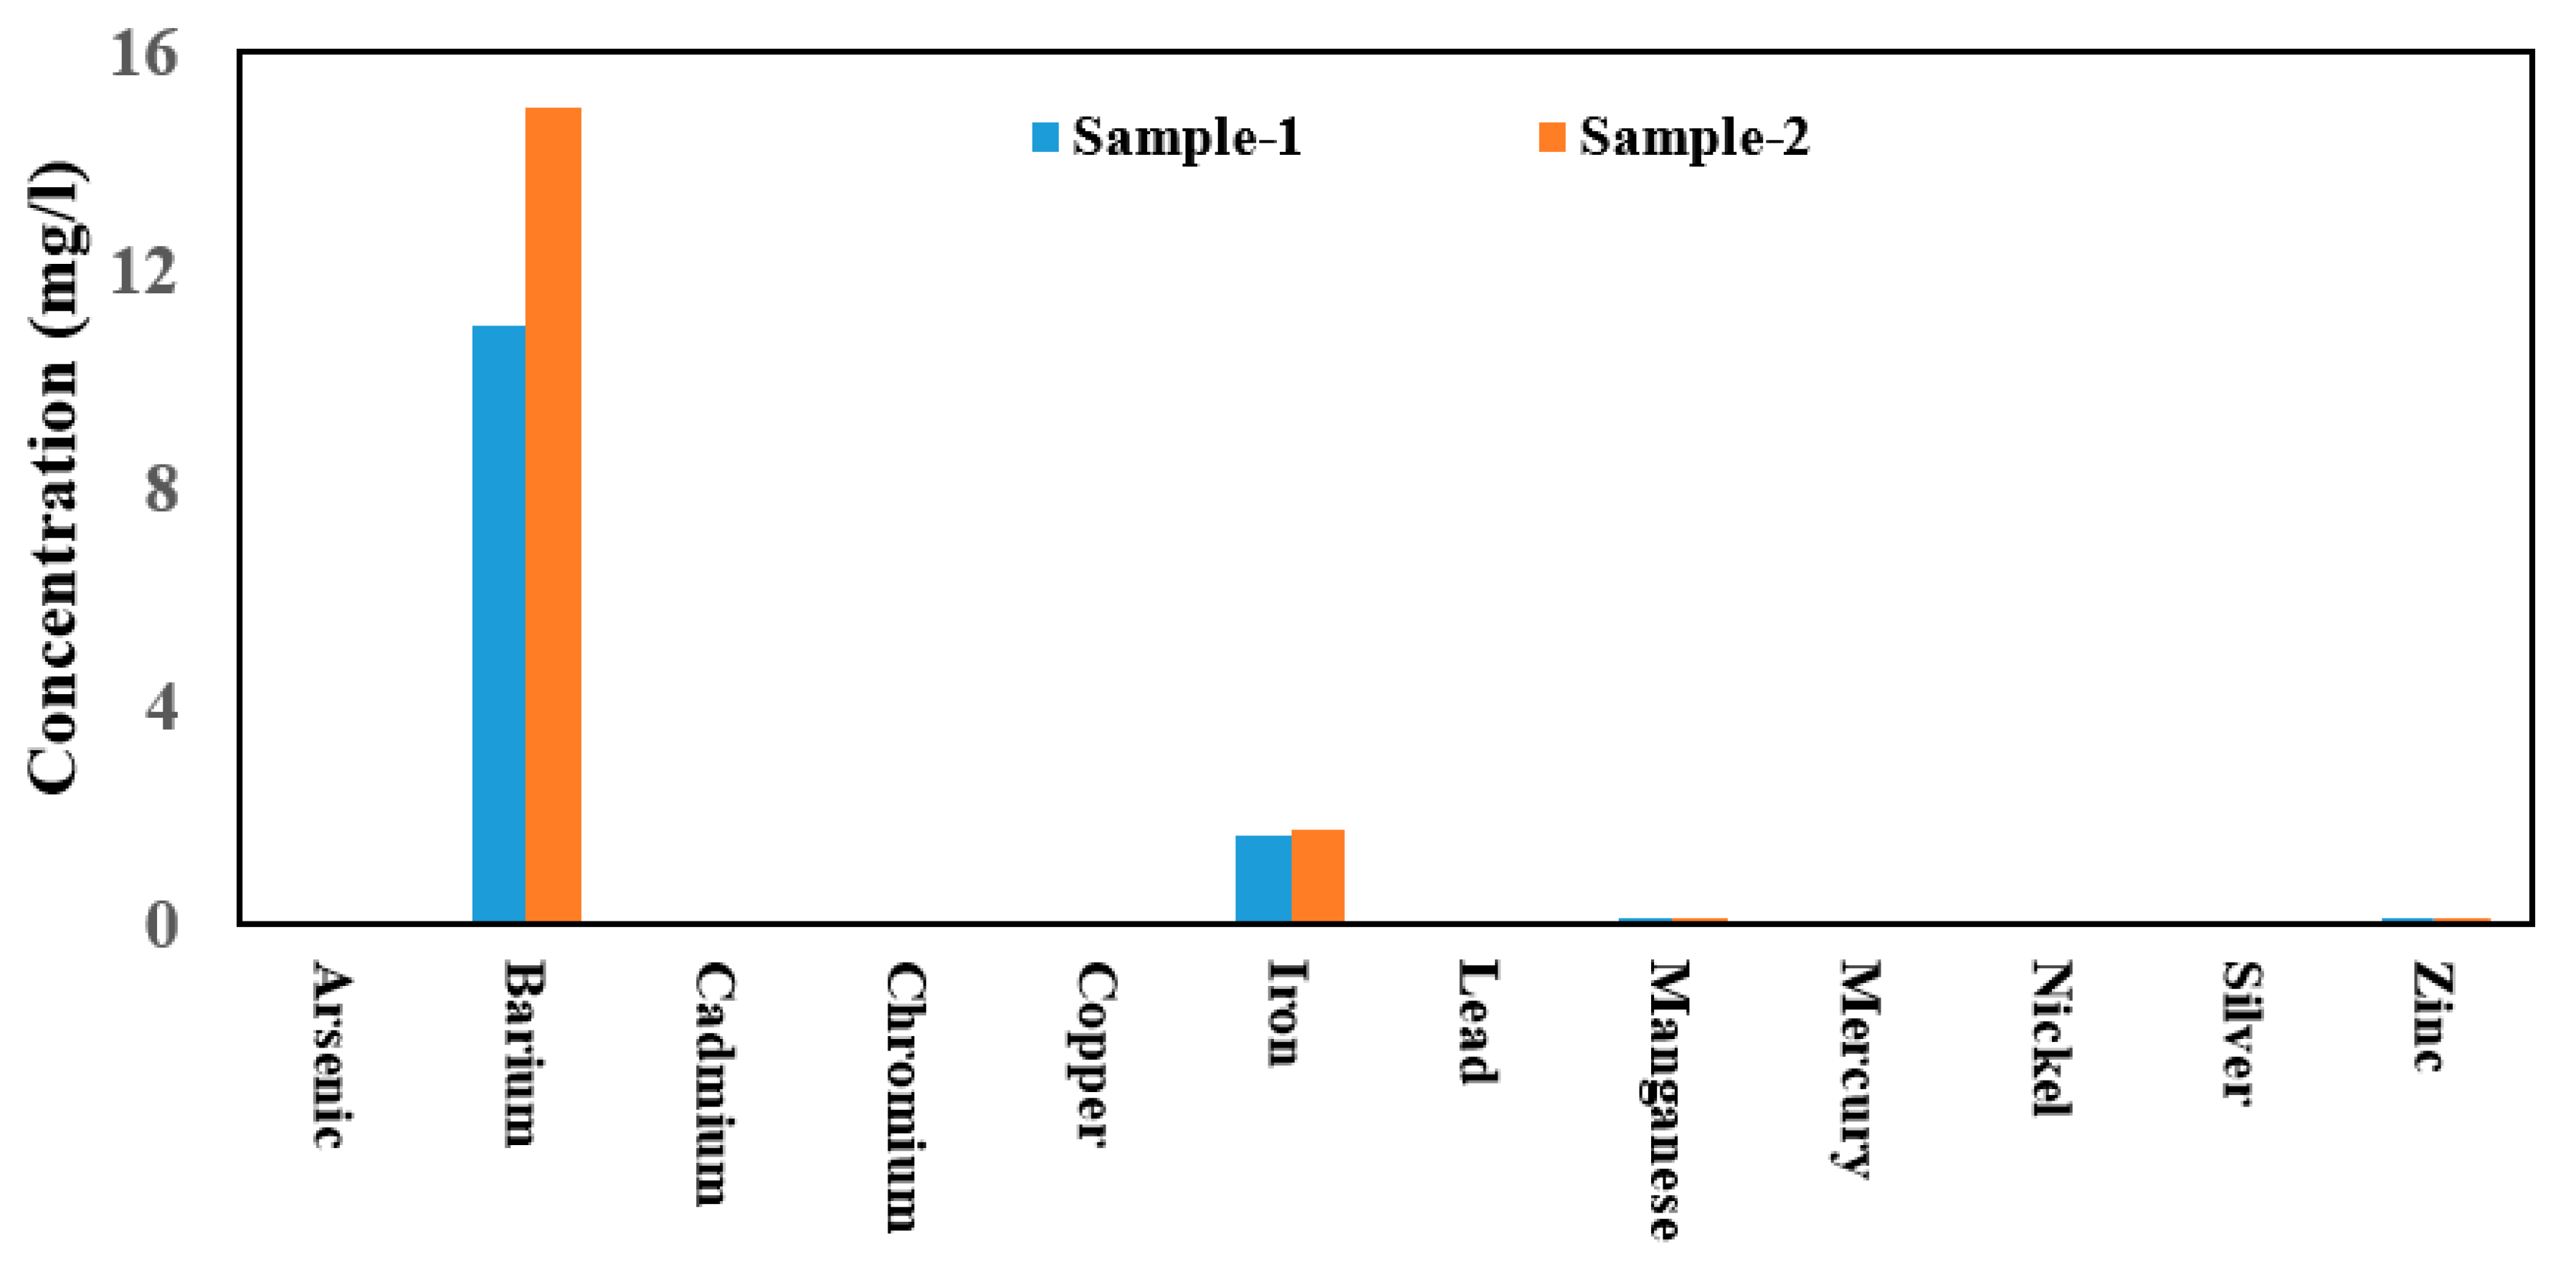
3.1. Analysis of Samples
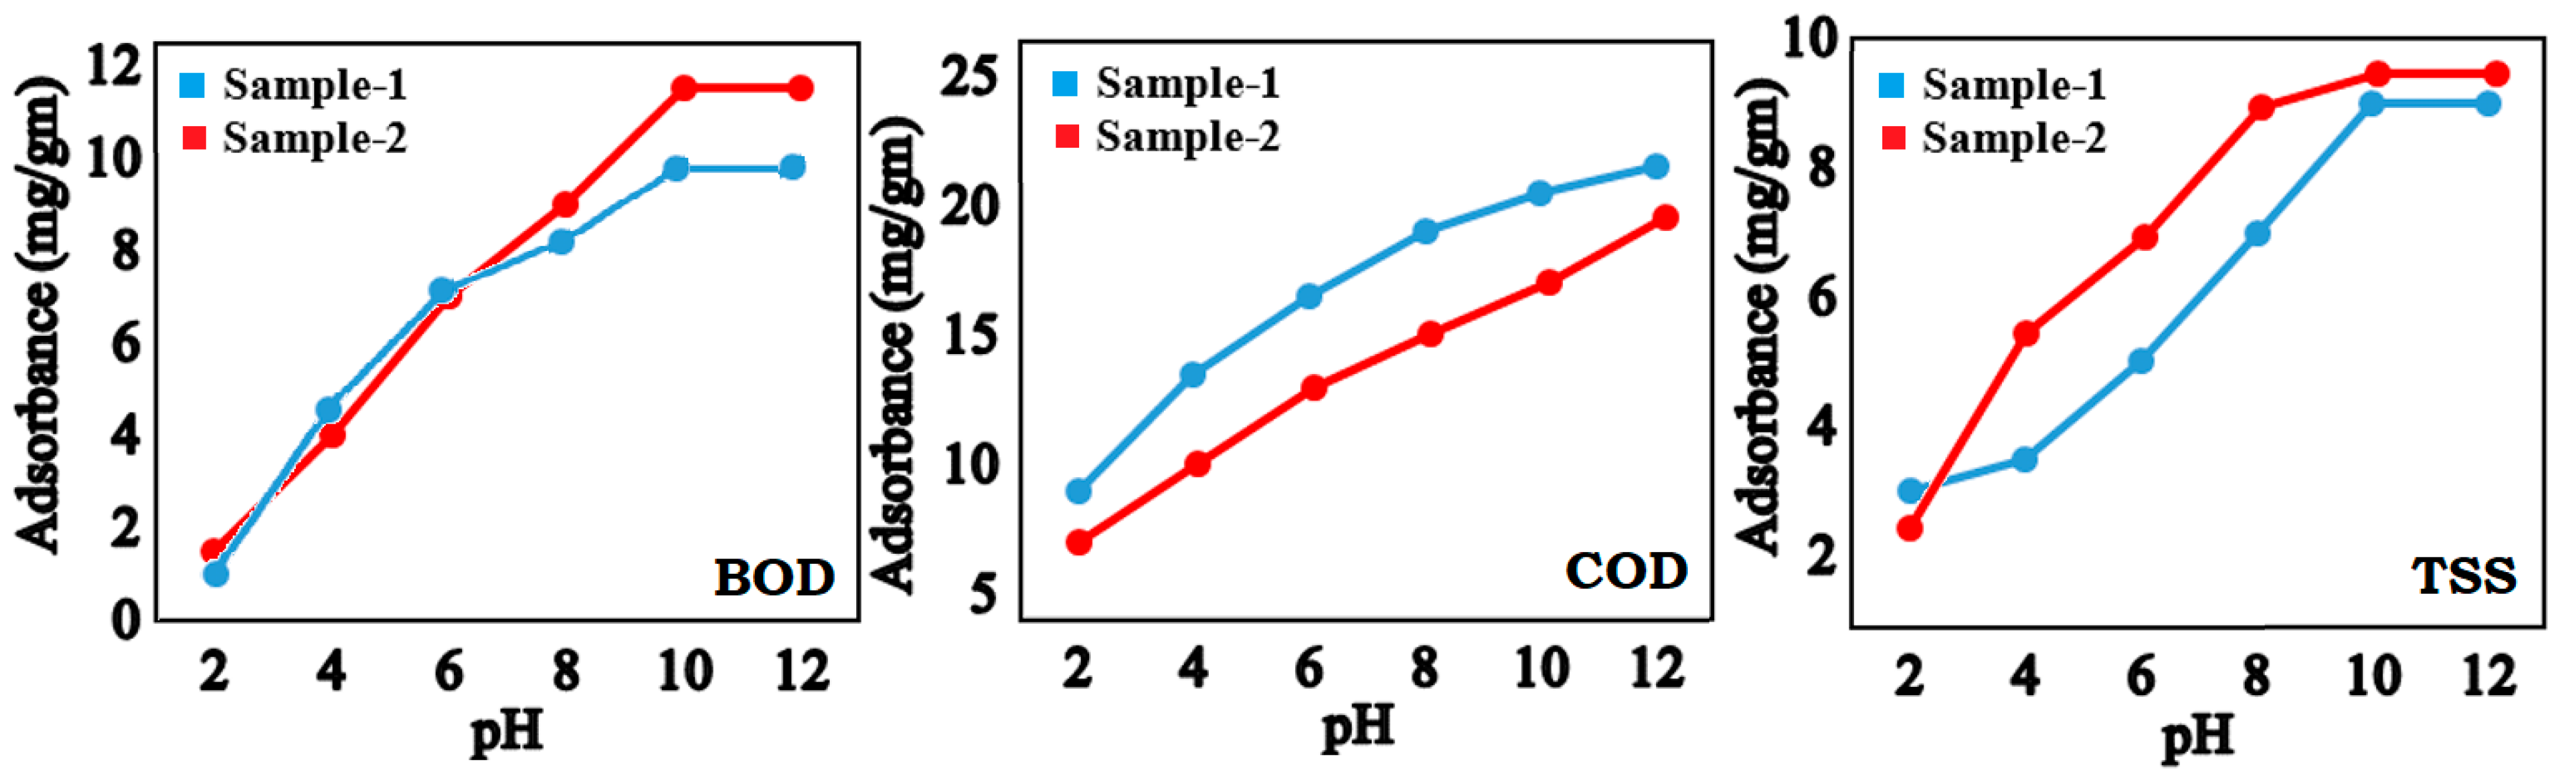
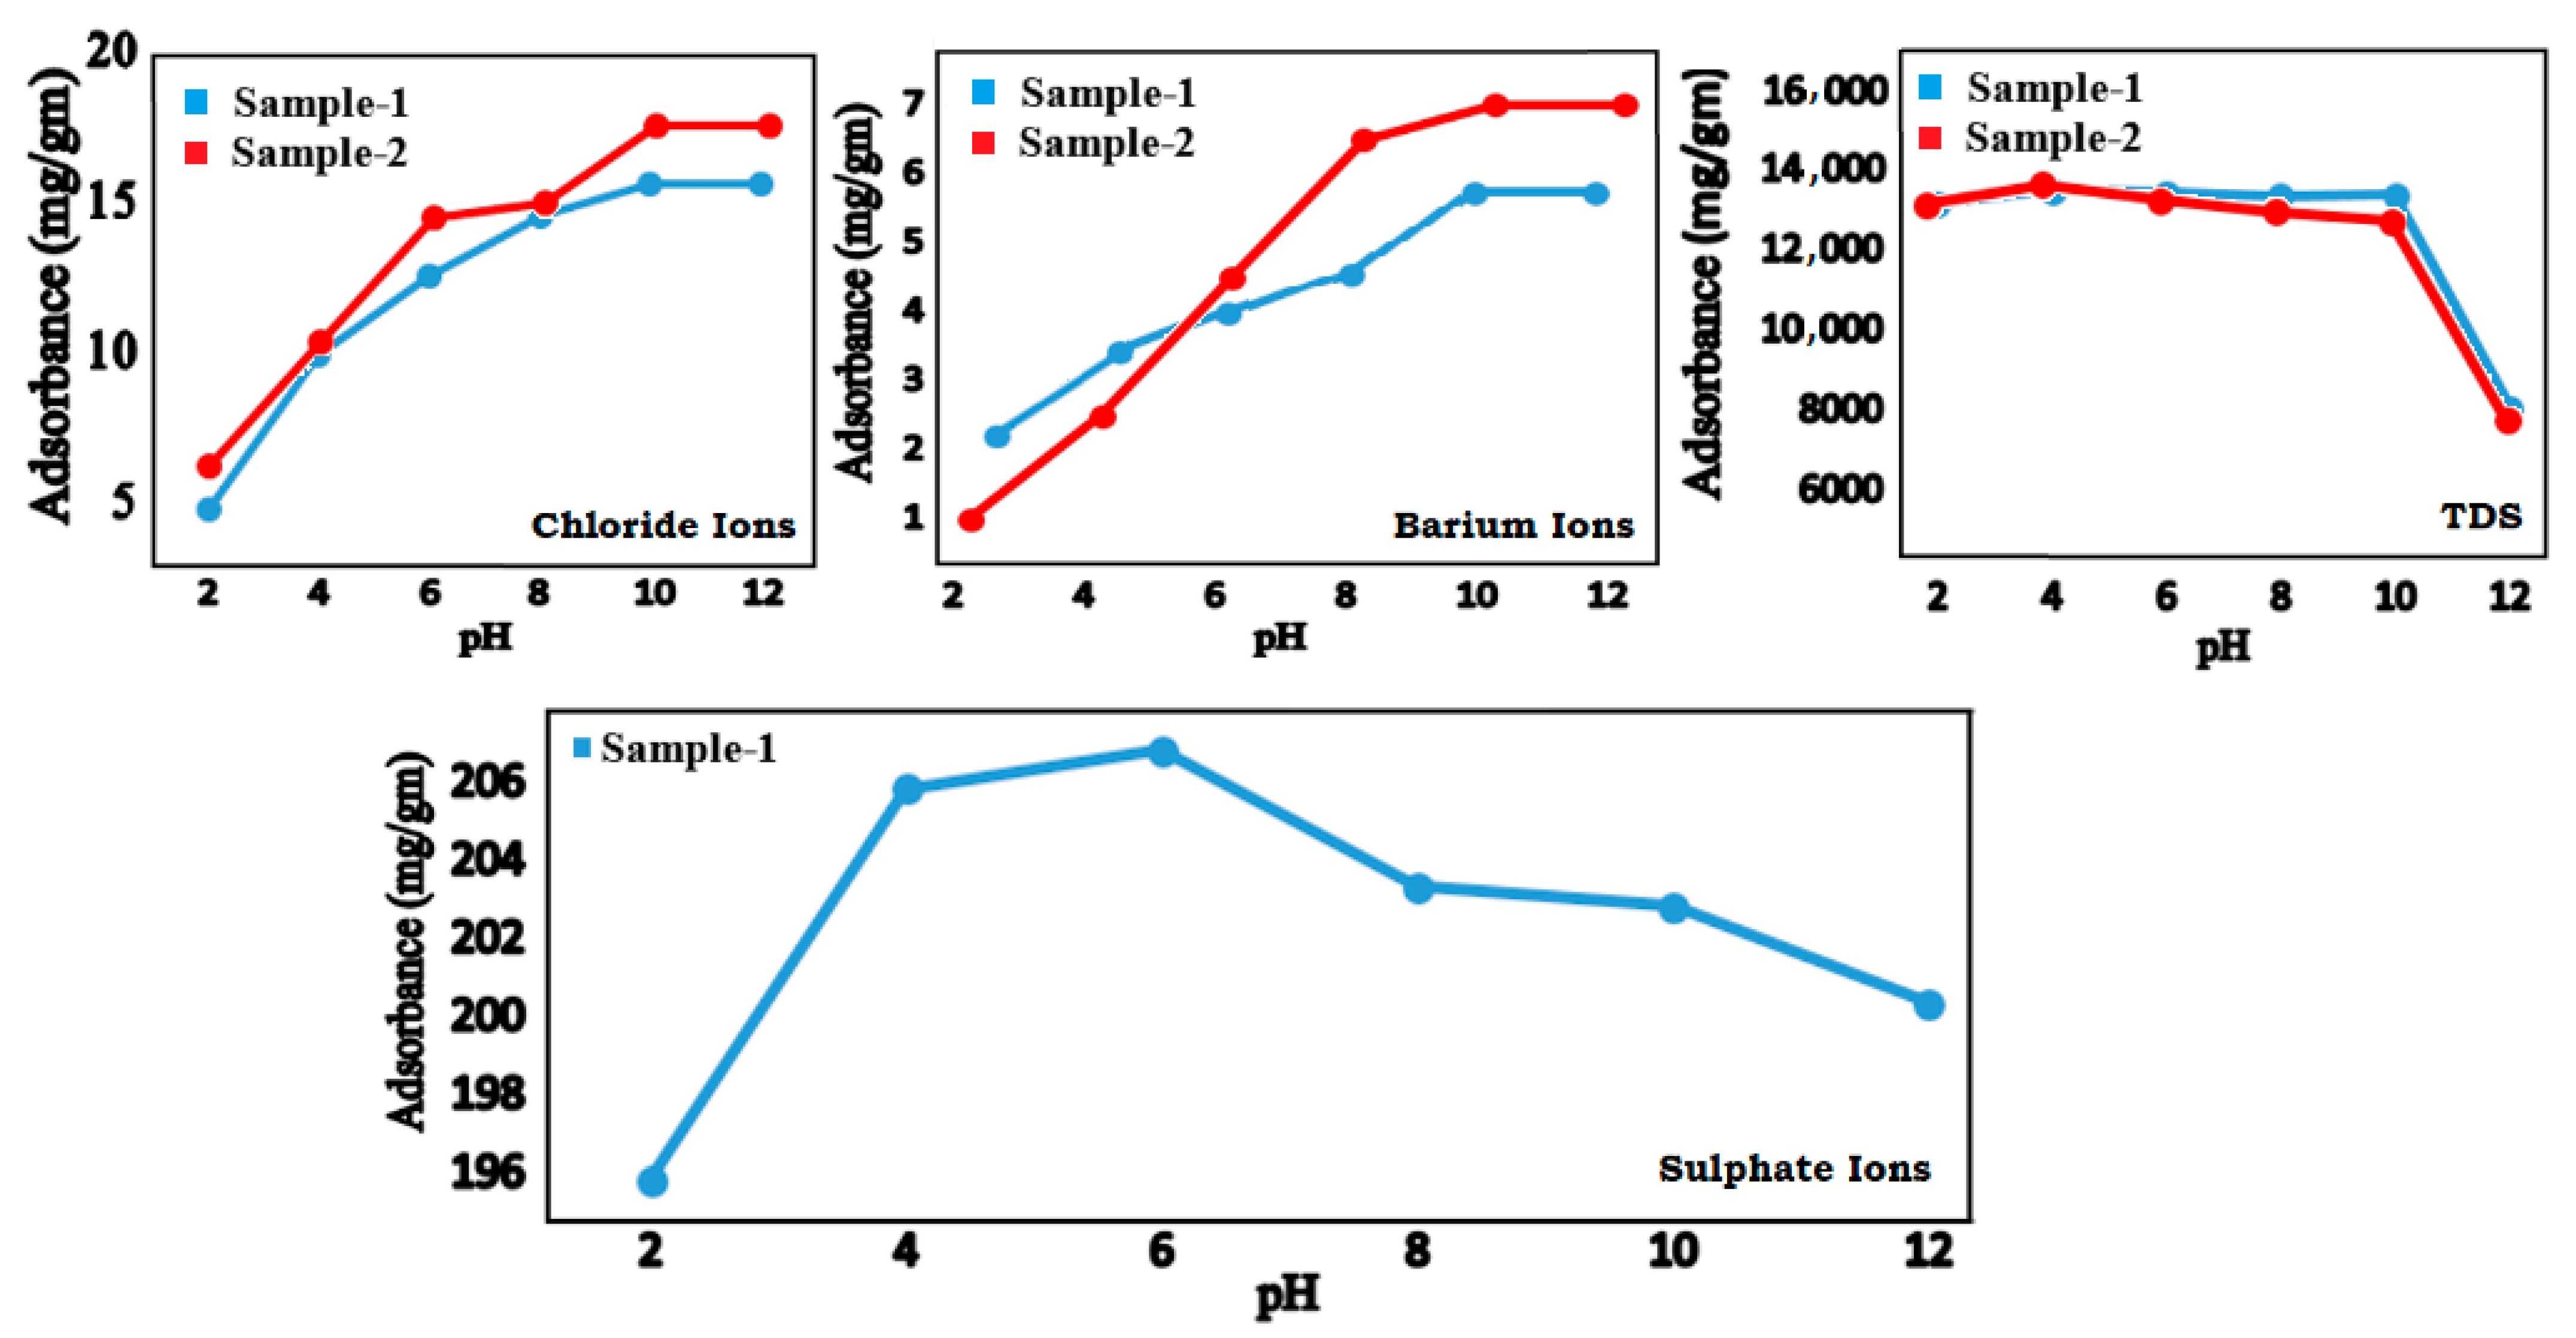
The industrial wastewater samples were analyzed as per the industrial liquid effluent NEQS with respect to the biological oxygen demand (BOD), chemical oxygen demand (COD), total suspended solids (TSS), chloride, sulfate, fluoride, cyanide, sulfide and total dissolved solids (TDS) in both samples and concentrations obtained are shown in Figure 2, Figure 3 and Figure 4 and enlisted in Table 2.
The results showed that the range of BOD, COD, TSS and chlorides in both wastewater sample varied from 74–78, 80–88, 37–47 and 638–709 mg/L, respectively (Table 2). All these values were below the acceptable level of industrial liquid effluent (NEQS). The sulfate concentration was found to be 714 mg/L and 167 mg/L in samples-1 and -2, respectively (Figure 2). The concentration of sulfate in sample 1 was observed to be higher than the permissible value for industrial liquid effluent NEQS (600 mg/L). Sulfate can cause water to have a bitter flavor and also have a laxative effect on humans. Sulfate enters into the water in wastes from industrial sources, such as mining and smelting operations, and paper mills. The high values of sulfate may be the result of untreated waste discharge from industries like textiles, paperboards and tanneries running in the industrial area [26]. The wastewater flowing into the different drains can pollute drinking water and agricultural land through leaching processes and will thus increase the sulfate level in surface and groundwater reservoirs.
The concentration of fluoride, cyanide and sulfide was analyzed in both the samples. The concentration of fluoride was 1.20 mg/L and 1.22 mg/L in both sample 1 and 2, respectively. It was found that sample 1 contained no cyanide or sulfide. However, in sample 2, their concentration was found to be 0.01 mg/L, as shown in Figure 2.
The concentration level of TDS ranged from 33,951 mg/L to 34,620 mg/L in the wastewater samples (Figure 3), which is in excess above from the national standards for drinking water quality (<1000 mg/L) and industrial liquid effluent NEQS (3500 mg/L). The wastewater contained high amounts of TDS because a number of industries discharging their wastewater into outwards drain. The high concentration of TDS in the wastewater samples may be attributed to the discharge of industrial effluent from numerous industries into the outward drains. The wastewater then joins the Chenab river and other water reservoirs in the vicinity of Faisalabad and this may contribute toward the water pollution due to the high concentration of TDS. Consistent records on the possible health effects related to the ingestion of TDS in drinking water do not exist, and no health-based recommendation values are suggested. However, the presence of TDS in high concentrations in drinking water may be objectionable to users [27].
The analysis of different nonmetals, namely, boron, chlorine and selenium was also carried out in this research (Figure 3). Boron and chlorine were absent in both the samples. While selenium was not present in sample 1, but 0.16 mg/L was detected in sample 2, below the permitted limit of industrial liquid effluent NEQS.
Besides the analysis of the above contaminants, the samples were also checked for the concentration of heavy metals and nonmetals, results are given in Table 3. A total 12 metals were analyzed in the wastewater of Faisalabad’s industrial area. The results obtained of the metals ions concentrations are shown in Figure 4. Metalloid, arsenic ions were not present in sample 1 but were found at a concentration of 0.01 mg/L in sample 2. This concentration meets the specification of industrial liquid effluent NEQS for Pakistan. Barium is an abundant, naturally existing metal and is used for different industrial purposes. Barium compounds are used in paints, glass, drilling mud, bricks, rubber, pigments, cosmetic, pharmaceutics and ceramics. Humans are exposed to barium by ingestion and inhalation. Dissolved barium compounds in water may cause harmful health effects, such as difficulty breathing, stomach irritation, increased blood pressure, brain swelling, arrythmia, muscle weakness, and damage to the kidneys, liver, spleen, and heart [28]. The contents of barium ions ranged between 11 mg/L to 15 mg/L (Figure 4). The concentration of barium ions in wastewater exceeded the NSDWQ (0.7 mg/L) and industrial liquid effluent NEQS for Pakistan. The elevated value of barium ion discharge in industrial wastewater may be the result of plastic, rubber and glass industries working in the area. The presence of barium ions in wastewater can produce various diseases in the local population.
Toxic heavy metals ions, i.e., cadmium, copper, lead, mercury, and silver were not present in both wastewater samples. Chromium ions were observed in wastewater at concentrations of 0.05 mg/L and 0.03 mg/L in sample 1 and 2, respectively. These values are less than the tolerable values of industrial effluent NEQS. Iron ion concentrations varied from 1.60 mg/L to 1.75 mg/L in both sample 1 and 2, respectively. These concentrations are below the industrial liquid effluent NEQS. The observed concentration levels (0.08 mg/L–0.09 mg/L) of manganese ions in both samples, were within the permissible level of industrial effluent NEQS. Nickel ion content was found to be 0.02 mg/L in sample 1, below the allowable concentration of industrial effluent NEQS and was absent in sample 2. Zinc ions quantities in the samples fell within the safe range of 0.08 mg/L to 1.11 mg/L as per the industrial effluent NEQS.

3.2. Effect of pH

A pH study was conducted for very low level contaminants, such as fluoride (1.20 and 1.22 mg/L), cyanide and sulfide (0.01 mg/L), arsenic (0.01 mg/L), selenium (0.16 mg/L), chromium (0.03 and 0.05 mg/L), iron (1.60 and 1.75 mg/L), manganese (0.08 L and 0.09 mg/L), nickel (0.02 mg/L), and zinc (0.08 and 1.11 mg/L), present in wastewater samples at room temperature for 12 h. All fluoride, cyanide, arsenic, selenium, chromium, iron, manganese, nickel, and zinc ions were completely removed at the pH values from 2–8. The pH study results of the contaminants such as BOD, COD, and TSS present in wastewater samples at room temperature for 12 h are given in Table 4. These results are graphically presented in Figure 5.
The initial concentration of BOD ions was 74 and 78 mg/L for sample 1 and 2, respectively, whereas the initial concentration for COD was 88 mg/L for sample 1 and 80 mg/L for sample 2 and for TSS was 47 mg/L for sample 1 and 37 mg/L for sample 2. The results of adsorptive removal of these ions at different pH depicted the lowering in concentration of these ions from wastewater during the batch adsorption process. The maximum reduction of BOD by biosorbent occurred at pH 10 from 74 to 55 mg/L for sample 1 wastewater and 78 to 55 mg/L for sample 2 wastewater at room temperature in 12 h (Table 4). The concentration of COD dropped at pH 12 from 88–45 mg/L for sample 1 wastewater and 80 to 41 mg/L (Table 4) for sample 2 wastewater at room temperature in 12 h in adsorption process giving the good activity by biosorbent. The obtained analysis results for TSS revealed that the concentration dropped from 47–29 mg/L for sample 1 wastewater and 37 to 18 mg/L for sample 2 wastewater at room temperature at pH 10 (as enlisted in Table 4) in 12 h in batch adsorbent experiment.
A pH was study carried out for the high level contaminants (chloride, TDS, barium and sulfate ions) detected in wastewater samples at room temperature for 12 h. The results of adsorption with samples-1 and -2 are shown in Figure 6 and quantitative measurements are listed in detail in Table 5. The initial concentrations of chloride ions were 709 and 638 mg/L for sample 1 and 2, respectively and for sulfate ions was 714 mg/L for sample 1. Whereas the initial concentration of TDS was 33,951 mg/L for sample 1 and 34,620 mg/L for sample 2 and for barium ions concentrations of 11 and 15 mg/L were recorded for sample 1 and 2, respectively. The maximum adsorption level of TDS by the biosorbent took place at pH 4. While biosorbent adsorbed mostly barium ions at pH 10–12 brought the barium ions to below permissible limit. Maximum sulfate ions adsorbed by the biosorbent found with pH 6.

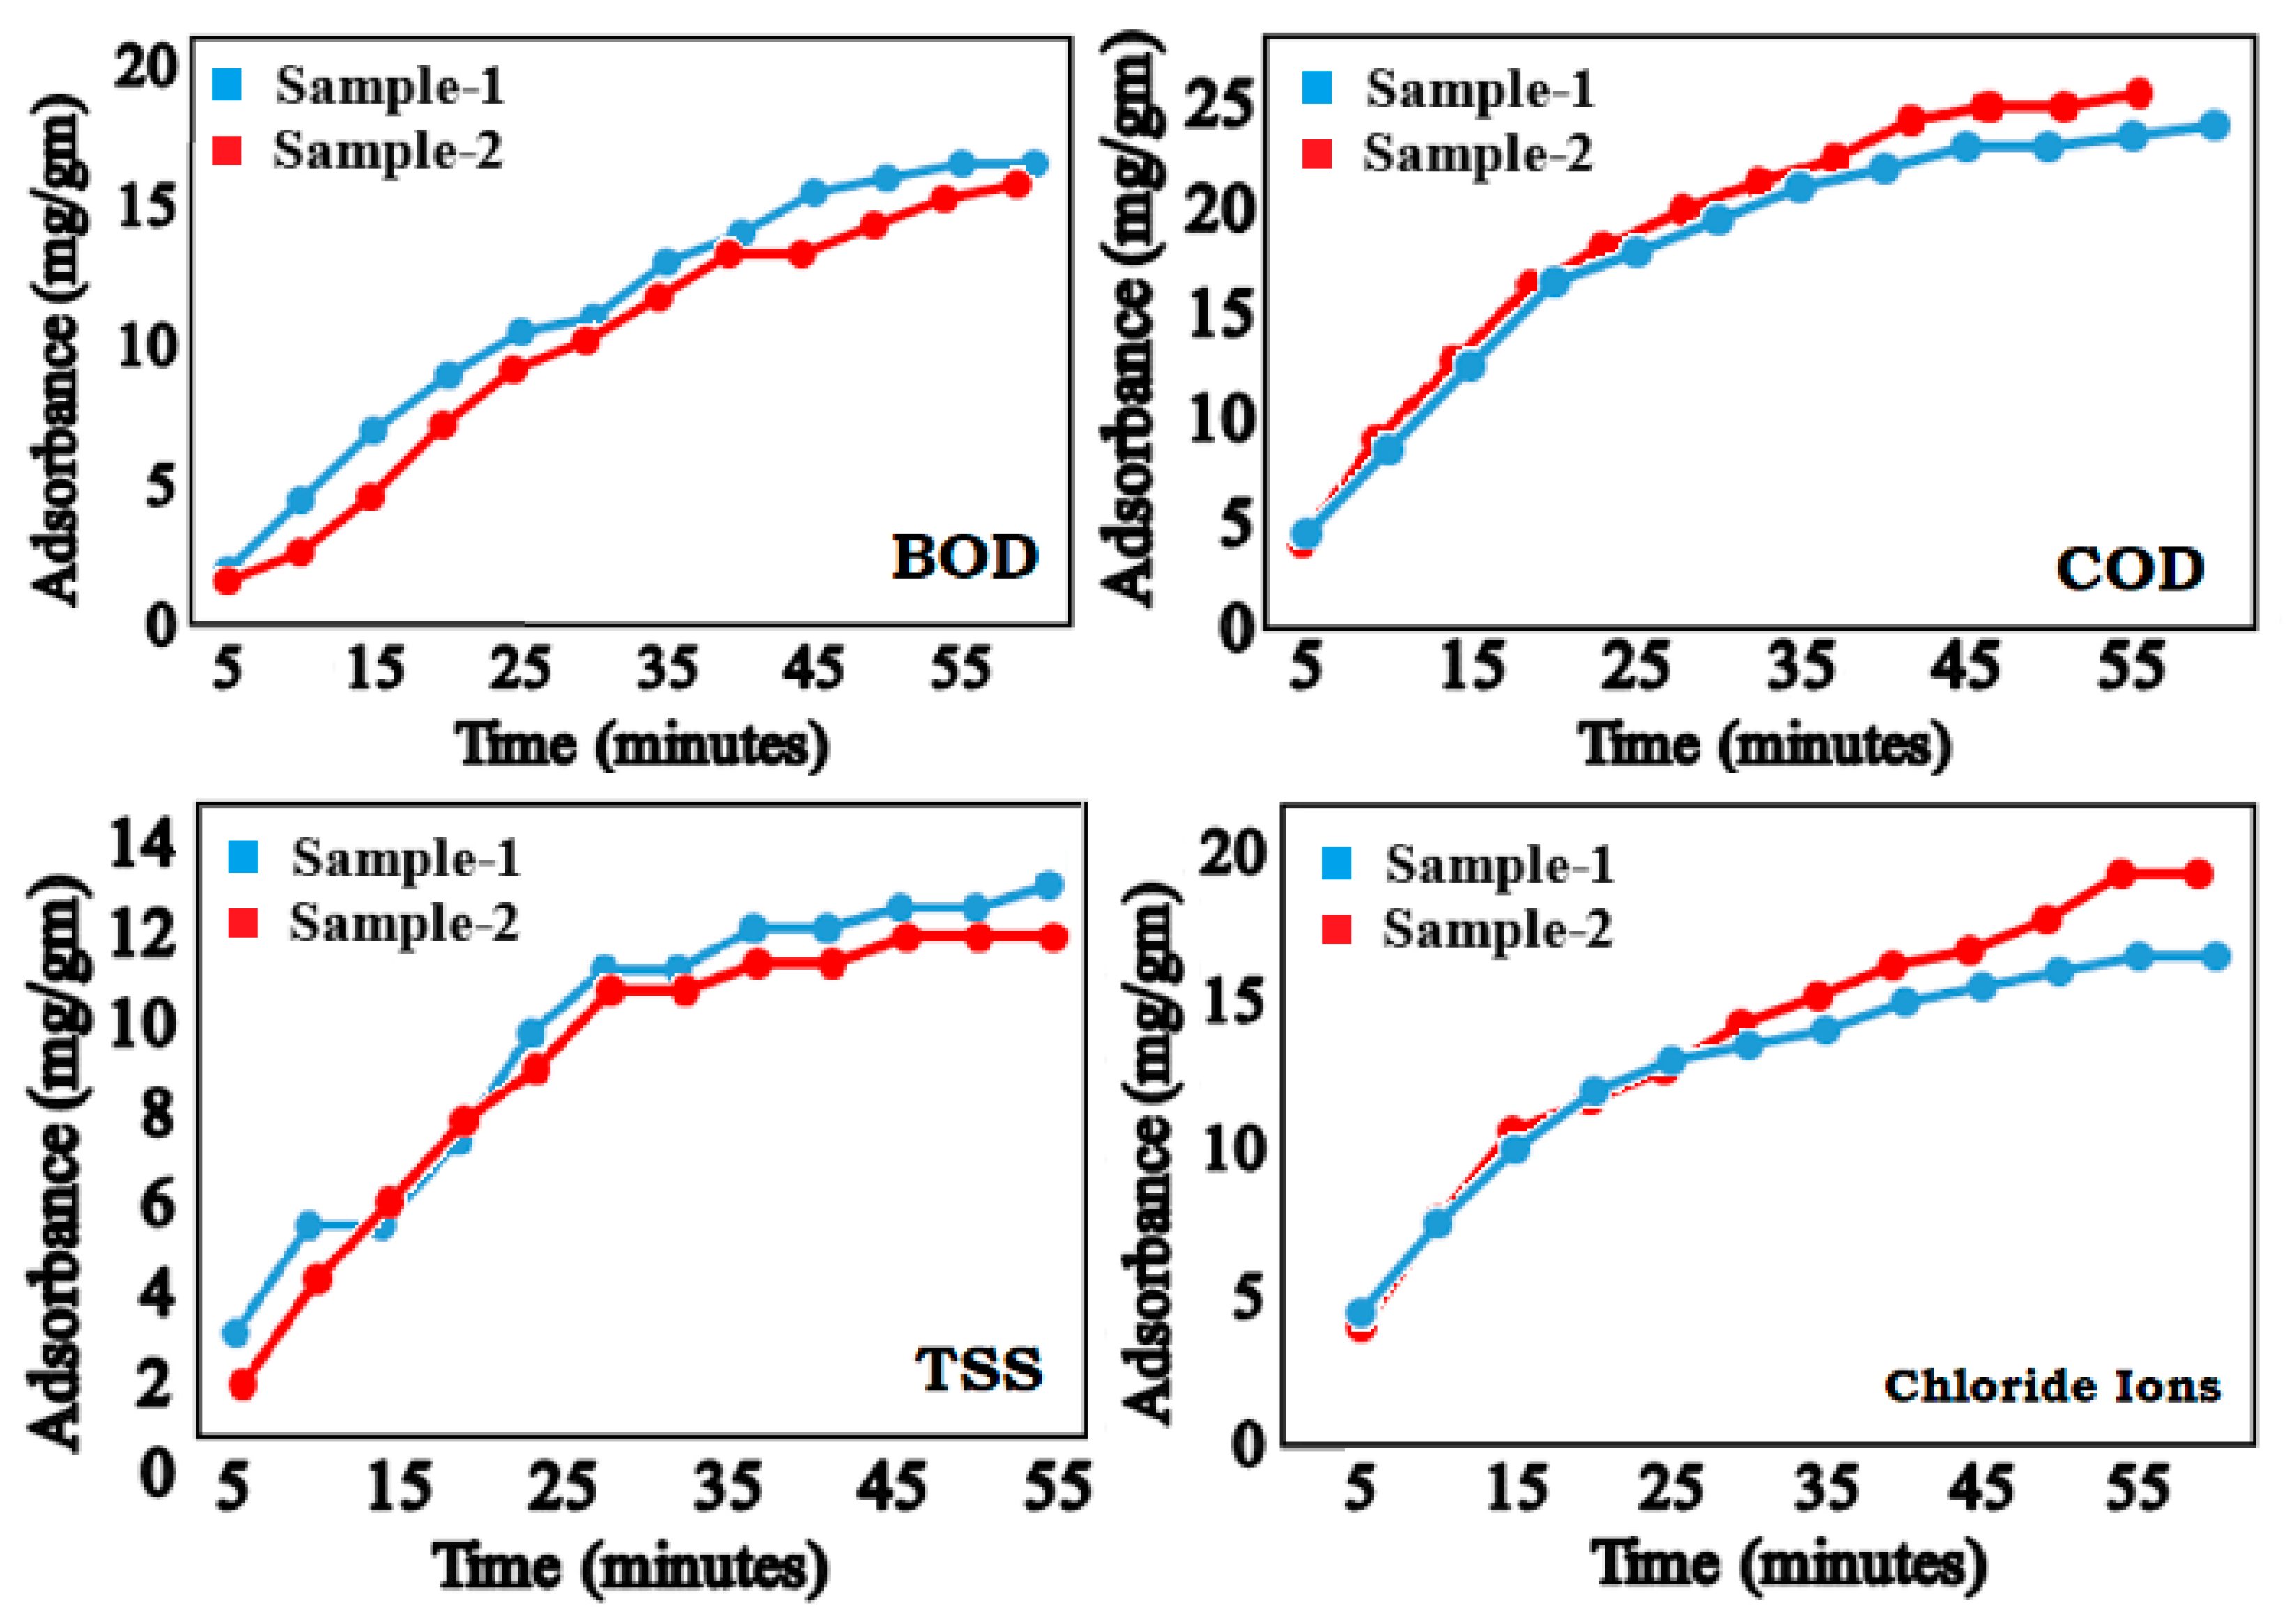
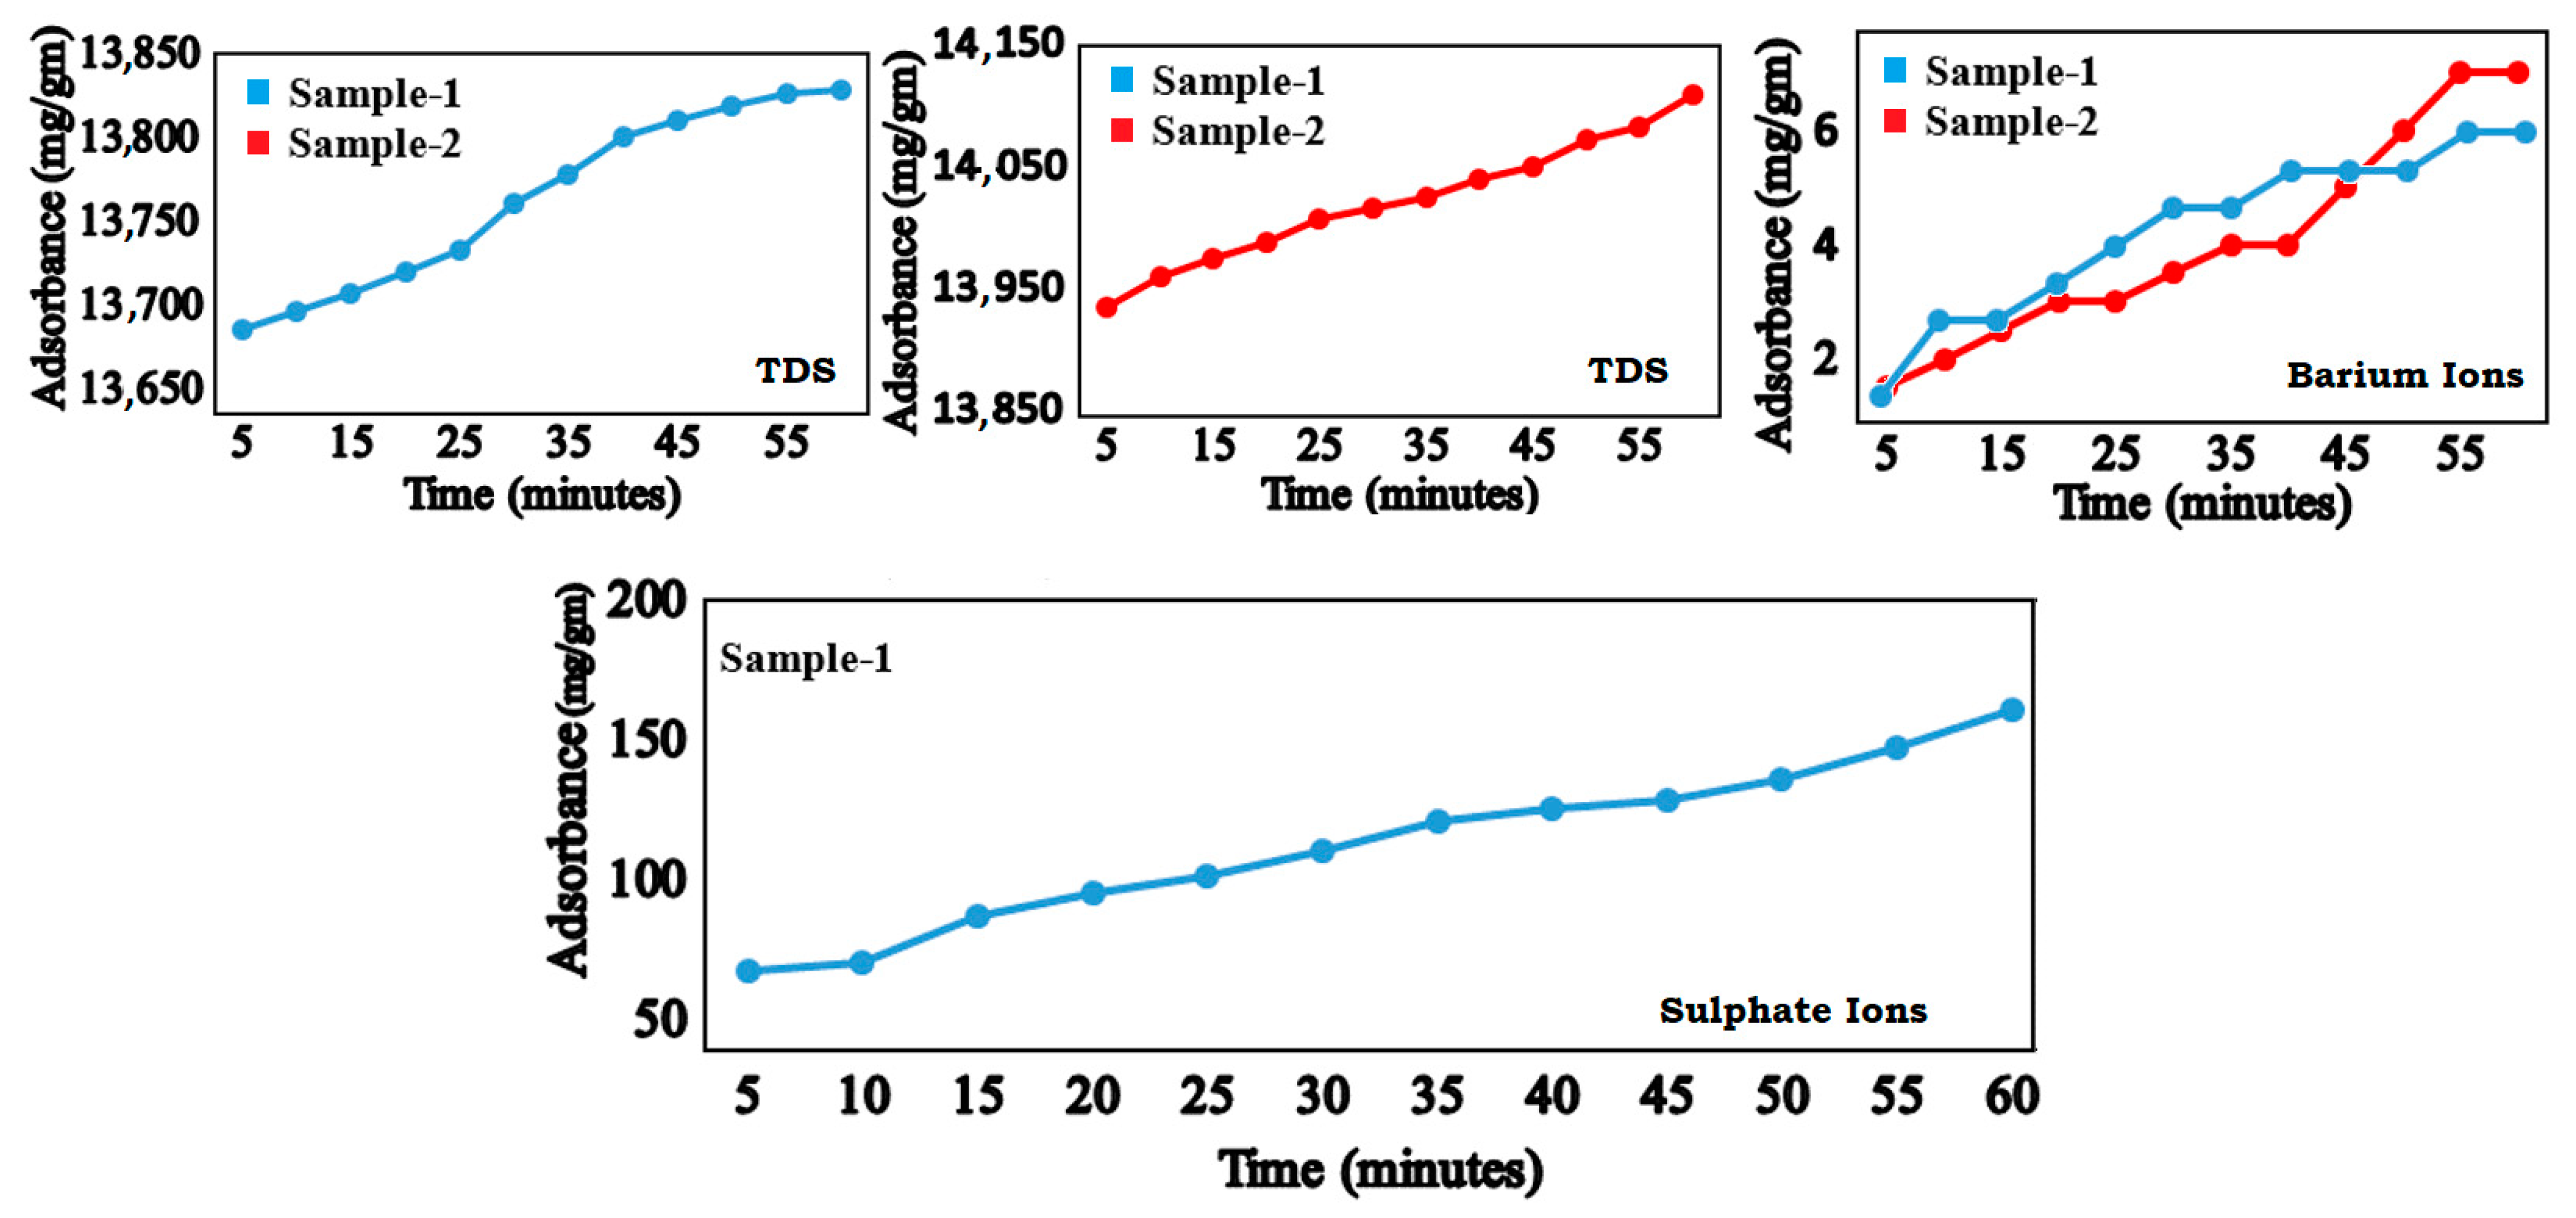
3.3. Effect of Contact Time

The effect of contact time was studied for low level contaminants such as fluoride (1.20–1.22 mg/L), cyanide and sulfide (0.01 mg/L), arsenic (0.01 mg/L), selenium (0.16 mg/L), chromium (0.03–0.05 mg/L), iron (1.60–1.75 mg/L), manganese (0.08 l–0.09 mg/L), nickel (0.02 mg/L), and zinc (0.08–1.11 mg/L), present in the wastewater samples by maintaining the optimum pH at room temperature for 5–60 min. The effect of contact time revealed that all fluoride, cyanide, arsenic, selenium, chromium, iron, manganese, nickel, and zinc ions were completely removed in the optimal pH ranges in first 45 min. The effect of contact time on the contaminants such as BOD (pH-10), COD (pH-12), TSS (pH-10), and chlorides ions (pH-10) present in the wastewater samples at room temperature for 60 min is depicted in Figure 7 and listed in detail in Table 6.
The initial concentration of ions was recorded before adsorptive activity was measured at specific pH. The contact time analysis results obtained from the batch adsorption process at room temperature indicated that the concentration of BOD from wastewater decreased from 74 to 41 mg/L in 55 min and 78 to 47 mg/L in 60 min at optimum pH 10 (Table 6) for sample 1 and sample 2, respectively, whereas for COD the concentration reduced from 88 to 40 mg/L and 80 to 35 mg/L at room temperature in 60 min at optimum pH 12 for sample 1 and sample 2, respectively, as shown in Table 6. Likewise, a decrease in the quantity of TSS by the application of the biosorbent was observed from 41 to 21 mg/L (for sample 1 wastewater) in 60 minutes’ contact time and 37 to 16 mg/L (for sample 2 wastewater) in 50 minutes’ contact time. The adsorption process took place at room temperature by keeping the optimal pH 10 (Table 6).
The content of chlorides ions was reduced by the biosorbent in sample 1 from 709 to 676 mg/L at room temperature at optimum of pH 10 in 55 min. For sample 2 a decrease in chlorides ions by the application of the biosorbent from 638–600 mg/L in 55 min normal temperature at optimum pH 10 (Table 7).
The contact time study was carried out for sulfate ions at pH 6, for TDS at pH 4 and for barium ions at pH 10. The results are given in Table 7. The analysis results obtained point out that the biosorbent gradually removed the sulfate ions, TDS and barium ions (Figure 8) from the industrial wastewater samples over time. The adsorption increased with increasing of time (5–60 min). The maximum adsorption of all the high level contaminants occurred in 60 min. This novel biosorbent brought sulfate and barium ions to levels below the allowable value of the industrial liquid effluent NEQS and removed a substantial quantity of TDS from the industrial wastewater.

4. Conclusions

The study was based on the assessment of the heavy metals and chemicals from the industrial wastewater of Faisalabad city of Pakistan. Being the industrial hub of the city, the water resources have been densely contaminated. The analysis results obtained indicate that most of the contaminants were below the acceptable limit of the industrial effluent NEQS (Pakistan). Only 3 contaminants, i.e., sulfate ions, TDS and barium ions were found in higher concentrations than the allowable levels of the industrial wastewater NEQS. A novel biosorbent synthesized from Monotheca buxifolia seeds was used for the removal of sulfate, barium and TDS from wastewater effluent samples. This biosorbent successfully reduced sulfate ion concentration in wastewater samples from 714 to 420 mg/L at pH 6 in 1 h. Similarly, the concentration of TDS was reduced to 33,951 from 6295 mg/L at pH 4, whereas barium ions decreased from 15 to 1 mg/L at pH 10 in 1 h. The use of the biosorbent obtained from M. buxifolia seeds efficiently reduced the sulfate and barium ions to an acceptable level of the industrial liquid effluent NEQS and removed an abundant quantity of TDS from the industrial wastewater. In light of the results obtained in this study, this biosorbent could be used for the treatment of industrial wastewater that contains high concentrations of sulfate ions, TDS and barium ions before being discharged for irrigation purposes and thus also reduce the toxic effects of these contaminants on local public health.

Author Contributions

Conceptualization, R.U.K. and M.H.; methodology, R.U.K., Z.R. and T.J.; formal analysis, A.A.A., M.H. and S.K.; investigation, R.U.K., Z.R. and T.J.; resources, R.U.K.; writing—original draft preparation, R.U.K. and S.K.; writing—review and editing, M.H., S.K. and A.A.A.; supervision, M.H. and A.A.A. All authors have read and agreed to the published version of the manuscript.

Funding

This research received no external funding.

Data Availability Statement

Not applicable.

Conflicts of Interest

The authors declare no conflict of interest.

References

  1. Henze, M.; Comeau, Y. Wastewater characterization. In Biological Wastewater Treatment: Principles Modelling and Design; IWA Publishing: London, UK, 2008; pp. 33–52. [Google Scholar]
  2. Kaur, A.; Vats, S.; Rekhi, S.; Bhardwaj, A.; Goel, J.; Goel, J.; Tanwar, R.S.; Gaur, K.K. Physico-chemical analysis of the industrial effluents and their impact on the soil microflora. Proc. Environ. Sci. 2010, 2, 595–599. [Google Scholar] [CrossRef] [Green Version]
  3. Zainith, S.; Mishra, S.; Mani, S.; Saxena, G.; Bharagava, R.N. Microbes an ecofriendly tools for the treatment of industrial waste waters. In Microbes and Environmental Management; Studium Press (India) Pvt. Ltd.: New Delhi, India, 2016; pp. 75–100. [Google Scholar]
  4. Siddiqua, A.; Hahladakis, J.N.; Al-Attiya, W.A.K. An overview of the environmental pollution and health effects associated with waste landfilling and open dumping. Environ. Sci. Pollut. Res. 2022, 29, 58514–58536. [Google Scholar] [CrossRef]
  5. Gadipelly, C.; Pérez-González, A.; Yadav, G.D.; Ortiz, I.; Ibáñez, R.; Rathod, V.K.; Marathe, K.V. Pharmaceutical industry wastewater: Review of the technologies for water treatment and reuse. Ind. Eng. Chem. Res. 2014, 53, 11571–11592. [Google Scholar] [CrossRef]
  6. Von Sperling, M. Wastewater Characteristics, Treatment and Disposal; IWA publishing: Minas Gerais, Brazil, 2007. [Google Scholar]
  7. Helmer, R.; Hespanhol, I. Water Pollution Control: A Guide to the Use of Water Quality Management Principles; CRC Press: Boca Raton, FL, USA, 1997. [Google Scholar]
  8. Olajumoke, O.; Oluwagbemiga, O. Effect of industrial waste management on workers health in selected industries in Nigeria. Int. J. Waste Res. 2017, 7, 1–4. [Google Scholar] [CrossRef]
  9. Woodard, F. Industrial Waste Treatment Handbook; Elsevier: Amsterdam, The Netherlands, 2001. [Google Scholar]
  10. Azizullah, A.; Jamil, M.; Richter, P.; Häder, D.-P. Fast bioassessment of wastewater and surface water quality using freshwater flagellate Euglena gracilis-A case study from Pakistan. J. Appl. Phycol. 2014, 26, 421–431. [Google Scholar] [CrossRef]
  11. Farooq, S.; Eqani, S.; Malik, R.N.; Katsoyiannis, A.; Zhang, G.; Zhang, Y.; Li, J.; Xiang, L.; Jones, K.C.; Shinwari, Z.K. Occurrence, finger printing and ecological risk assessment of polycyclic aromatic hydrocarbons (PAHs) in the Chenab River, Pakistan. J. Environ. Monit. 2011, 13, 3207–3215. [Google Scholar] [CrossRef] [PubMed]
  12. Khan, M. Impact of urbanization on water resources of Pakistan: A review. NUST J. Eng. Sci. 2019, 12, 1–8. [Google Scholar] [CrossRef]
  13. Javed, N.; Qureshi, N.N. City profile: Faisalabad, Pakistan. Environ. Urban. ASIA 2019, 10, 233–254. [Google Scholar] [CrossRef]
  14. Rahman, S.U.; Yasin, G.; Nawaz, M.F.; Cheng, H.; Azhar, M.F.; Riaz, L.; Javed, A.; Lu, Y. Evaluation of heavy metal phytoremediation potential of six tree species of Faisalabad city of Pakistan during summer and winter seasons. J. Environ. Manag. 2022, 320, 115801. [Google Scholar] [CrossRef] [PubMed]
  15. Jabeen, F.; Manzoor, M.; Ibrahim, M.; Mahmood, A.; Adrees, M.; Aslam, A.; Kanwal, U.; Vithanage, M.; Yousaf, B. Assessment of health risks associated with the consumption of wastewater-irrigated vegetables in urban areas. Int. J. Environ. Sci. Technol. 2022, 5, 1–10. [Google Scholar] [CrossRef]
  16. Farooqi, Z.U.R.; Ahmad, I.; Qadir, A.A.; Murtaza, G.; Rafiq, S.; Jamal, A.; Zeeshan, N.; Murtaza, B.; Javed, W.; Radicetti, E.; et al. Zeolite-Assisted Immobilization and Health Risks of Potentially Toxic Elements in Wastewater-Irrigated Soil under Brinjal (Solanum melongena) Cultivation. Agronomy 2022, 12, 2433. [Google Scholar] [CrossRef]
  17. Bhatti, M.A.H.; Aleem, A.; Akbar, A. Assessment of Wastewater Characteristics for Irrigation in Faisalabad. Int. J. Sci. Eng. Res. 2019, 10, 350–354. [Google Scholar]
  18. Mathew, B.B.; Jaishankar, M.; Biju, V.G.; Beeregowda, K.N. Role of bioadsorbents in reducing toxic metals. J. Toxicol. 2016, 2016, 4369604. [Google Scholar] [CrossRef] [PubMed] [Green Version]
  19. US Environmental Protection Agency. Methods for Chemical Analysis of Water and Wastes; Office of Research and Development: Washington, DC, USA, 1983.
  20. Rice, E.W.; Baird, R.B.; Eaton, A.D. Standard Methods for the Examination of Water and Wastewater; American Public Health Association: Washington, DC, USA, 2012; Volume 10. [Google Scholar]
  21. Balthis, W.L.; Cooksey, C.; Hyland, J.L.; Fulton, M.H.; Wirth, E. Integrated Assessment of Ecosystem Condition and Stressor Impacts in Submerged Habitats of the Guana Tolomato Matanzas (GTM) National Estuarine Research Reserve (NERR); NOAA Technical Memorandum NOS NCCOS 231: Charleston, SC, USA, 2017. [Google Scholar]
  22. Ciba, J.; Zołotajkin, M.; Kluczka, J.; Loska, K.; Cebula, J. Comparison of methods for leaching heavy metals from composts. Waste Manag. 2003, 23, 897–905. [Google Scholar] [CrossRef]
  23. Snell, F.D.; Snell, C.T.; Snell, C.A. Colorimetric Methods of Analysis. Soil Sci. 1959, 88, 59. [Google Scholar] [CrossRef]
  24. Benalia, M.C.; Youcef, L.; Bouaziz, M.G.; Achour, S.; Menasra, H. Removal of heavy metals from industrial wastewater by chemical precipitation: Mechanisms and sludge characterization. Arab. J. Sci. Eng. 2022, 47, 5587–5599. [Google Scholar] [CrossRef]
  25. Punia, P.; Bharti, M.K.; Dhar, R.; Thakur, P.; Thakur, A. Recent Advances in Detection and Removal of Heavy Metals from Contaminated Water. Chem. Bio. Eng. Rev. 2022, 9, 351–369. [Google Scholar] [CrossRef]
  26. Whelton, A.J.; Dietrich, A.M.; Burlingame, G.A.; Schechs, M.; Duncan, S.E. Minerals in drinking water: Impacts on taste and importance to consumer health. Water Sci. Technol. 2007, 55, 283–291. [Google Scholar] [CrossRef] [PubMed]
  27. Islam, R.; Faysal, M.; Amin, M.R.; Juliana, F.M. Assessment of pH and total dissolved substances (TDS) in the commercially available bottled drinking water. IOSR J. Nurs. Health Sci. 2017, 6, 35–40. [Google Scholar]
  28. Aziz, H.A.; Ghazali, M.F.; Hung, Y.-T.; Wang, L.K. Toxicity, Source, and Control of Barium in the Environment. In Advanced Industrial and Hazardous Wastes Management; CRC Press: Boca Raton, FL, USA, 2017; pp. 463–482. [Google Scholar]
Scheme 1. Flow diagram of the research study design.
Processes 10 02165 sch001
Figure 1. (a) Map of Faisalabad, (names of cities are translated into Urdu, the regional language), (b) Sample collection area taken via Google Maps, (c) collecting site of sample 1 and (d) sample 2.
Processes 10 02165 g001
Figure 2. Concentration (mg/L of BOD, COD, TSS, chlorides, sulfate, fluoride, cyanide and sulfide ions in wastewater samples-1 and -2.
Processes 10 02165 g002
Figure 3. Concentration (mg/L) of TDS, boron, chloride and selenium ions in wastewater samples-1 and -2.
Processes 10 02165 g003
Figure 4. Concentration (mg/L) of metal ions in wastewater samples-1 and -2.
Processes 10 02165 g004
Figure 5. Adsorption concentrations (mg/gm) of BOD, COD and TSS in sample 1 and 2 at different pH.
Processes 10 02165 g005
Figure 6. Adsorption concentrations (mg/gm) of chloride, TDS, barium and sulfate ions in sample 1 and 2 at different pH.
Processes 10 02165 g006
Figure 7. Adsorption concentrations (mg/gm) of BOD (pH-10), COD (pH-12), TSS (pH-10), and chlorides ions (pH-10) in samples-1 and -2 at different time intervals.
Processes 10 02165 g007
Figure 8. Adsorption concentration (mg/gm) of TDS, barium and sulfate ions in sample 1 and 2 at different time intervals.
Processes 10 02165 g008
Table 1. Analytical techniques and instrumental details used in the study to detect different wastewater contaminants and heavy metals.
ContaminantMethodInstrumentRef.
(BOD)5 at 20 °C5210 B. 5-Day BOD testHACH BOD Trak[20]
COD5220 D. Closed reflux, colorimetric methodHACH DR/2500 Laboratory spectrophotometer [20]
TSS8006 Photometric methodHACH DR/2500 Laboratory spectrophotometer[21]
TDS2510 Conductivity factor methodJENWAY 4320 Conductivity meter[20]
Chloride4500 B. ArgentometryTitration[20]
Fluoride8029 SPADNS methodHACH DR/2500 Laboratory spectrophotometer[19]
Cyanide8027 Pyridine-pyrazalone methodHACH DR/2500 Laboratory spectrophotometer[22]
Sulfate4500 E. Turbidimetric methodHACH DR900 Colorimeter[20]
Sulfide8131 Methylene blue methodHACH DR/2500 Laboratory spectrophotometer[19]
Selenium8194 Diaminobenzidine methodDR/2500 Laboratory spectrophotometer[20]
Boron8015 Carmine methodDR/2500 Laboratory spectrophotometer[20]
Chlorine4500 G. DPD colorimetric methodMerck colorimetric with color disk comparator [20]
Arsenic3114 B. A. A. Spectrometric methodGBC-932 Plus atomic absorption spectrometer[20]
Mercury3112 B. Cold-vapor A. A. SpectrometryGBC-932 Plus atomic absorption spectrometer[20]
Barium8014 Turbidimetric methodHACH DR/2500 Laboratory spectrophotometer[23]
Cadmium, Chromium, Copper, Iron, Lead, Manganese, Nickel, Silver and Zinc3111 B. Direct air-acetylene flame methodPerkin-Elmer atomic absorption spectrometer AAS-700[20]
Table 2. Concentration of the physiochemical contaminants in industrial wastewater samples collected from the study areas.
Contaminant (mg/L)Sample 1
(mg/L)
Sample 2 (mg/L)Industrial Liquid Effluent NEQS (mg/L)
Biochemical Oxygen Demand (BOD)5 at 20 °C747880
Chemical Oxygen Demand (COD)8880150
Total Suspended Solid (TSS)4737200
Chloride7096381000
Sulfate714167600
Fluoride1.201.2210
Cyanide0.000.011.0
Sulfide0.000.011.0
Total Dissolved Solid (TDS)33951346203500
Table 3. Concentration of nonmetals and metals in industrial wastewater samples collected from the study area.
Contaminant
(mg/L)
Sample 1
(mg/L)
Sample 2
(mg/L)
Industrial Liquid Effluent NEQS
(mg/L)
Arsenic0.000.011.0
Boron0.000.006.0
Chlorine0.000.001.0
Selenium0.000.160.5
Barium11151.5
Cadmium0.000.000.1
Chromium0.050.031.0
Copper0.000.001.0
Iron1.601.758.0
Lead0.000.000.5
Manganese0.090.081.5
Mercury0.000.000.01
Nickel0.020.001.0
Silver0.000.001.0
Zinc0.110.085.0
Table 4. Adsorption concentrations of BOD, COD and TSS in the industrial wastewater samples at different pH.
Sample
No.
pHBODCODTSS
Concentration
(mg/L)
Adsorption
(mg/gm)
Concentration
(mg/L)
Adsorption
(mg/gm)
Concentration
(mg/L)
Adsorption
(mg/gm)
12.0721.0709.0443.0
4.0654.56113.5403.5
6.0607.05516.5375.0
8.0588.05019.0337.0
10.0559.54720.5299.0
12.0559.54521.5299.0
22.0751.5667.0322.5
4.0704.06010.0265.5
6.0647.05413.0237.0
8.0609.05015.0199.0
10.05511.54617.0189.5
12.05511.54119.5189.5
Table 5. Adsorption concentration of chlorides ions in industrial wastewater samples at different pH.
Sample
No.
pHChlorideSulfateTDSBarium
Conc.
(mg/L)
Adsorption
(mg/gm)
Conc.
(mg/L)
Adsorption
(mg/gm)
Conc.
(mg/L)
Adsorption
(mg/gm)
Conc.
(mg/L)
Adsorption
(mg/gm)
12.07004.5322196770013,125.57.02.0
4.06909.5302206705113,4505.03.0
6.068512.0300207718013,385.54.03.5
8.068114.0307203.5734313,3043.04.0
10.067915.0308203727513,3381.05.0
12.067915.0313200.517,9008025.51.05.0
22.06256.5--741013,605131.0
4.061710.5--640114,109.5102.5
6.060914.5--722513,697.56.04.5
8.060815--781313,403.52.06.5
10.060317.5--826913,175.51.07.0
12.060317.5--18,20082101.07.0
Table 6. Adsorption concentrations (mg/gm) of BOD, COD and TSS from industrial wastewater at different time intervals.
Sample
No.
TimeBODCODTSS
Concentration
(mg/L)
Adsorption
(mg/gm)
Concentration
(mg/L)
Adsorption
(mg/gm)
Concentration
(mg/L)
Adsorption
(mg/gm)
15702.0794.5422.5
10654.5718.5375.0
15607.06312.5375.0
20569.05516.5337.0
255310.55218.0289.5
305211.04919.52511.0
354813.04621.02511.0
404614.04422.02312.0
454315.54223.02312.0
504216.04223.02212.5
554116.54123.52212.5
604116.54024.02113.0
25751.5705.0332.0
10732.5629.0294.0
15694.55612.0265.5
20647.05015.0237.0
25609.04716.5218.0
305810.04418.0189.5
355511.54219.0189.5
405213.04020.01710.0
455213.03721.51710.0
505014.03622.01610.5
554815.03622.01610.5
604715.53522.51610.5
Table 7. Adsorption concentrations (mg/gm) of chloride, sulfate, TDS and barium from industrial wastewater at different time intervals.
Sample
No.
TimeChlorideSulfateTDSBarium
Conc.
(mg/L)
Adsorption
(mg/gm)
Conc.
(mg/L)
Adsorption
(mg/gm)
Conc.
(mg/L)
Adsorption
(mg/gm)
Conc.
(mg/L)
Adsorption
(mg/gm)
157004.558067658013,685.581.5
106947.557370.5656013,695.562.5
1568910.056787653713,70762.5
2068512.055095.5651213,719.553.0
2568313.0538101.5648713,73243.5
3068213.5520110.5643013,760.534.0
3568114.0500120.5639513,77834.0
4067915.0490125.5635013,800.524.5
4567815.5485128633113,81024.5
5067716.0470135.5631513,81824.5
5567616.5447147630013,825.515.0
6067616.5420160.5629513,82815.0
256304.0--675013,935121.5
106237.5--670213,959112.0
1561710.5--667113,974.5102.5
2061511.5--664513,987.593.0
2561312.5--660514,007.593.0
3061014.0--658914,015.583.5
3560815.0--657014,02574.0
4060616.0--653914,040.574.0
4560516.5--652014,05055.0
5060317.5--647514,072.536.0
5560019.0--645514,082.517.0
6060019.0--640014,11017.0
Publisher’s Note: MDPI stays neutral with regard to jurisdictional claims in published maps and institutional affiliations.

