
Structural Analysis and Optimization of Heavy Vehicle Chassis Using Aluminium P100/6061 Al and Al GA 7-230 MMC


Department of Mechanical Engineering, University of South Africa, Science Campus, Private Bag X6, Ekurhuleni 1710, South Africa
*
Author to whom correspondence should be addressed.
Processes 2022, 10(2), 320; https://0-doi-org.brum.beds.ac.uk/10.3390/pr10020320
Submission received: 20 August 2021
/
Revised: 28 September 2021
/
Accepted: 29 September 2021
/
Published: 8 February 2022
(This article belongs to the Special Issue Big Data in Manufacturing, Biology, Healthcare and Life Sciences)
Abstract
:A chassis is one of the vital parts of a heavy motor vehicle, which provides rigidity to the vehicle and improves structural stability and rigidity for accurate handling. The design and material of a chassis structure significantly affects its strength and weight. Optimization techniques can be used in systematic design improvement of chassis to meet industry requirements. The current research is intended to optimize the design of chassis using the Box–Behnken design scheme and the material tested is P100/6061 Al and Al GA 7-230 MMC. Different design points were generated using the design of the experiments. Equivalent stress, deformation and mass were evaluated for each design point. The variable selected for optimization using the Box–Behnken scheme was cross member width. The CAD modelling and FE simulation of the heavy motor vehicle chassis were conducted using ANSYS software. From the optimization conducted on the chassis design, response surface plots of equivalent stress, deformation and mass were generated, which enabled to determine the range of dimensions for which these parameters are maximum or minimum. The sensitivity plots of different variables were generated, which has shown that cross member 2’s width has a maximum effect on equivalent stress and cross member 3’s width has a minimum effect on equivalent stress, whereas for total deformation, cross member 3 shows the maximum sensitivity percentage, which signifies that cross member 3 has the maximum effect on total deformation, and vice versa. The use of the aluminium metal matrix composites P100/6061 Al and Al GA 7-230 MMC aided to reduce the weight of the chassis by 68% and 70%, respectively, without much reduction in the strength of the chassis.
1. Introduction
The automobile chassis or frame is one of the base elements that provides the necessary strength and solidity to the motor vehicle in various loading and unloading conditions. The design structure and used material of the chassis structure significantly affects its strength and weight [1]. Automotive chassis or frames are basically manufactured from steel and holds the entire body and engine part of an automotive vehicle [2]. Chassis provides the initial required strength needed for supporting vehicular components [3]. The continuous demand for the improvement in design analysis of heavy motor vehicle chassis frames, considering a decrease in ‘weight’, has been the major challenge for the automotive industry, where optimization techniques can be used in efficient design improvement of chassis to meet industry requirements. To accomplish a significant weight decrease and quality extension, these optimization approaches should be further stretched out to decide the optimal design [3]. It has been demonstrated that the optimization techniques are very encouraging methods for systematic design development in engineering, especially the automotive sector, which shows the real-life simulation before the actual manufacturing of the component or assembly [4].
The studies conducted by Chiandussi et al. [5], Pedersen [6] and Duddeck [7] are very fascinating in this direction, in which they addressed the optimization of suspensions, layout profiles and body parts. Ketan Gajanan Nalawade et al. [8] conducted structural analysis on TATA 407 truck chassis using ANSYS FEA software. The new material used for analysis was E-glass and compared with structural steel. The findings showed that a 60–68% weight reduction is possibly through the use of E-glass; the deformation is also within acceptable limits, but the stress generated is higher than steel. Abhishek Sharma et al. [9] have conducted a static structural analysis on TATA LPS 2515 EX chassis using ANSYS FEA software. The material used for the analysis were AISI 4130 alloy steel and ASTM A710 STEEL GRADE A (CLASS III) and the cross sections analysed for the chassis were B type, C type and I type. The findings showed that the best material for this application is AISI 4130 steel, which is lighter than other materials. The box channel shape cross section exhibits higher durability and lower deformation; therefore, it is best suited for the chassis design of heavy trucks. Abhishek Singh et al. [10] have conducted FEA analysis on TATA LP 912 chassis using Altair Hyper work software. The material used for analysis was alloy steel and the cross section used was C type, I type, a rectangular box (solid) and a rectangular box (hollow). The findings showed that the rectangular (solid) section is more robust than other type of cross sections. Anurag Singh et al. [11] have designed a truck chassis using the CAD software CREO and had performed static analysis using ANSYS software in order to investigate the various stresses acting on it and their resultant deformation. Since the truck chassis has to carry a large amount of load, its design should be such that it can withstand all the forces acting on it. Here in this paper, after modelling the 3D design of the chassis using CREO, the design was imported into the ANSYS workbench in IGES file format. Selecting HLSA steel as the material used for the chassis, the static analysis was performed to observe the maximum principal stress, maximum shear stress and corresponding Von Mises stress. The maximum deformation observed was 0.0084 mm and the design was found to be safe.
Nikhil Tidke [12] conducted an FEA analysis on Eicher E2 vehicle chassis using ANSYS FEA software. The materials used for the analysis were ASTM A710 steel, ASTM A302 steel and metal alloy 6063-T6, and model was subjected to constant loading. The cross sections used for the analysis were C type and rectangular box. The structural analysis has shown that “Rectangular box section have additional strength than C cross section and the Rectangular box sections have low deflection, lowest stress, and deformation” [12]. Mostly, the chassis cross-members placed at different locations are made of steel [13,14]. Dabade et al. [15] have presented a review on the application of the Taguchi method in optimizing the design of various automobile components. The author has emphasized the usage of the Taguchi method in experimental designing and development of robust products. Hsua et al. [16] has worked on optimization of the body cage using a FEM-based Taguchi method. The effect of various factors, such as thickness and other dimensions, on the strength and safety factor was evaluated. The individual contribution of each optimization variable was also presented by the researcher. Aluminium alloy and alloy steel are the ideal materials for a rigid and lightweight structure, such as automotive chassis, but they are not economically feasible [17].
Although steel is the primary choice of the manufacturers because of its low cost, considerable relative strength and ductileness, there are a number of composite materials [18] that offer a proper strength and modulus better than any conventional metallic metals [2,19,20,21].
A lot of new materials have been developed which have the same load carrying capacity as those of the existing materials yet weigh significantly less than their current opponents [22]. Composite materials [18], with their distinctive combination of high stiffness and low CTE, offer the essential physical attributes towards lightweight and durable structures [18]. Generous advancement in the improvement of light metal matrix composites has been accomplished in the last few years, with the goal that they could be brought into the main applications. Particularly in the automotive business, MMCs have been utilized in fibre-reinforced pistons and Al crank cases with fortified chamber surfaces [23].
These materials have a good number of properties, including a high Young’s modulus, high compression and tensile strength, mechanical compatibility, high compression and tensile strength and economic efficiency, etc. [23]. Such a combination of properties of composite materials can be valuable in the automotive quality and manufacturing sector where vibration, toughness and increasing fuel prices are serious concerns, along with other technical requirements [24].
The principal objective of this paper is to reduce the weight of chassis by considering the lightweight “Unidirectional Metal-Matrix Composite Aluminium P100/6061 Al MMC” [18] and “Discontinuously Reinforced Aluminum-Matrix Composites Aluminium Graphite Al GA 7-230” [18,25] materials along with optimizing the design of chassis using the Box–Behnken design scheme of the response surface method. The key considerations of a structure design are density and Young´s modulus, moment of inertia, mass and torsional stiffness [17].
The findings presented here, are part of a detailed research study and the present research work is different from the literature with respect to the modelling, design and optimization analysis of heavy vehicle chassis for numerous effects of stress distribution with different materials. The appropriate data of an existing heavy duty truck chassis of TATA company’s, model number 1612 (St52 E = 2.10 × 10⁵ N/mm2), as a simply supported beam with overhang ladder frame, were taken for design and analysis, with the side bar of the chassis made from ‘C’ Channels having dimensions of 116 mm × 25 mm × 5 mm [26]. Total load acting on the chassis is 257022 N [26]. The CAD modelling and FE simulation is conducted using ANSYS software. A detailed static structural analysis is conducted in heavy motor vehicle chassis enabled to determine critical regions of high stresses and deformation. The suggestions are produced among the currently used conventional steel and suggested metal matrix composite(s). The variable selected for optimization is cross member width and the scheme of optimization is the Box–Behnken design [27]. In the automotive industry, presently, no work has been done in improving the design of existing chassis using the advanced optimization techniques used in this work.
2. Materials and Methods
The methodology involves Finite Element Analysis of chassis followed by design. The methodology involves Finite Element Analysis of chassis followed by design optimization using the Box–Behnken design scheme of the response surface method. The pre-processing stage in the simulation involves CAD modelling, meshing and applying loads and boundary conditions [28]. The solution stage involves element matrix formulations, assemblage of global stiffness elements followed by inversions and multiplications. The final stage is post-processing, which involves viewing and editing of the results, where the chassis specifications were obtained from [26].
Simulation Environment and Modelling
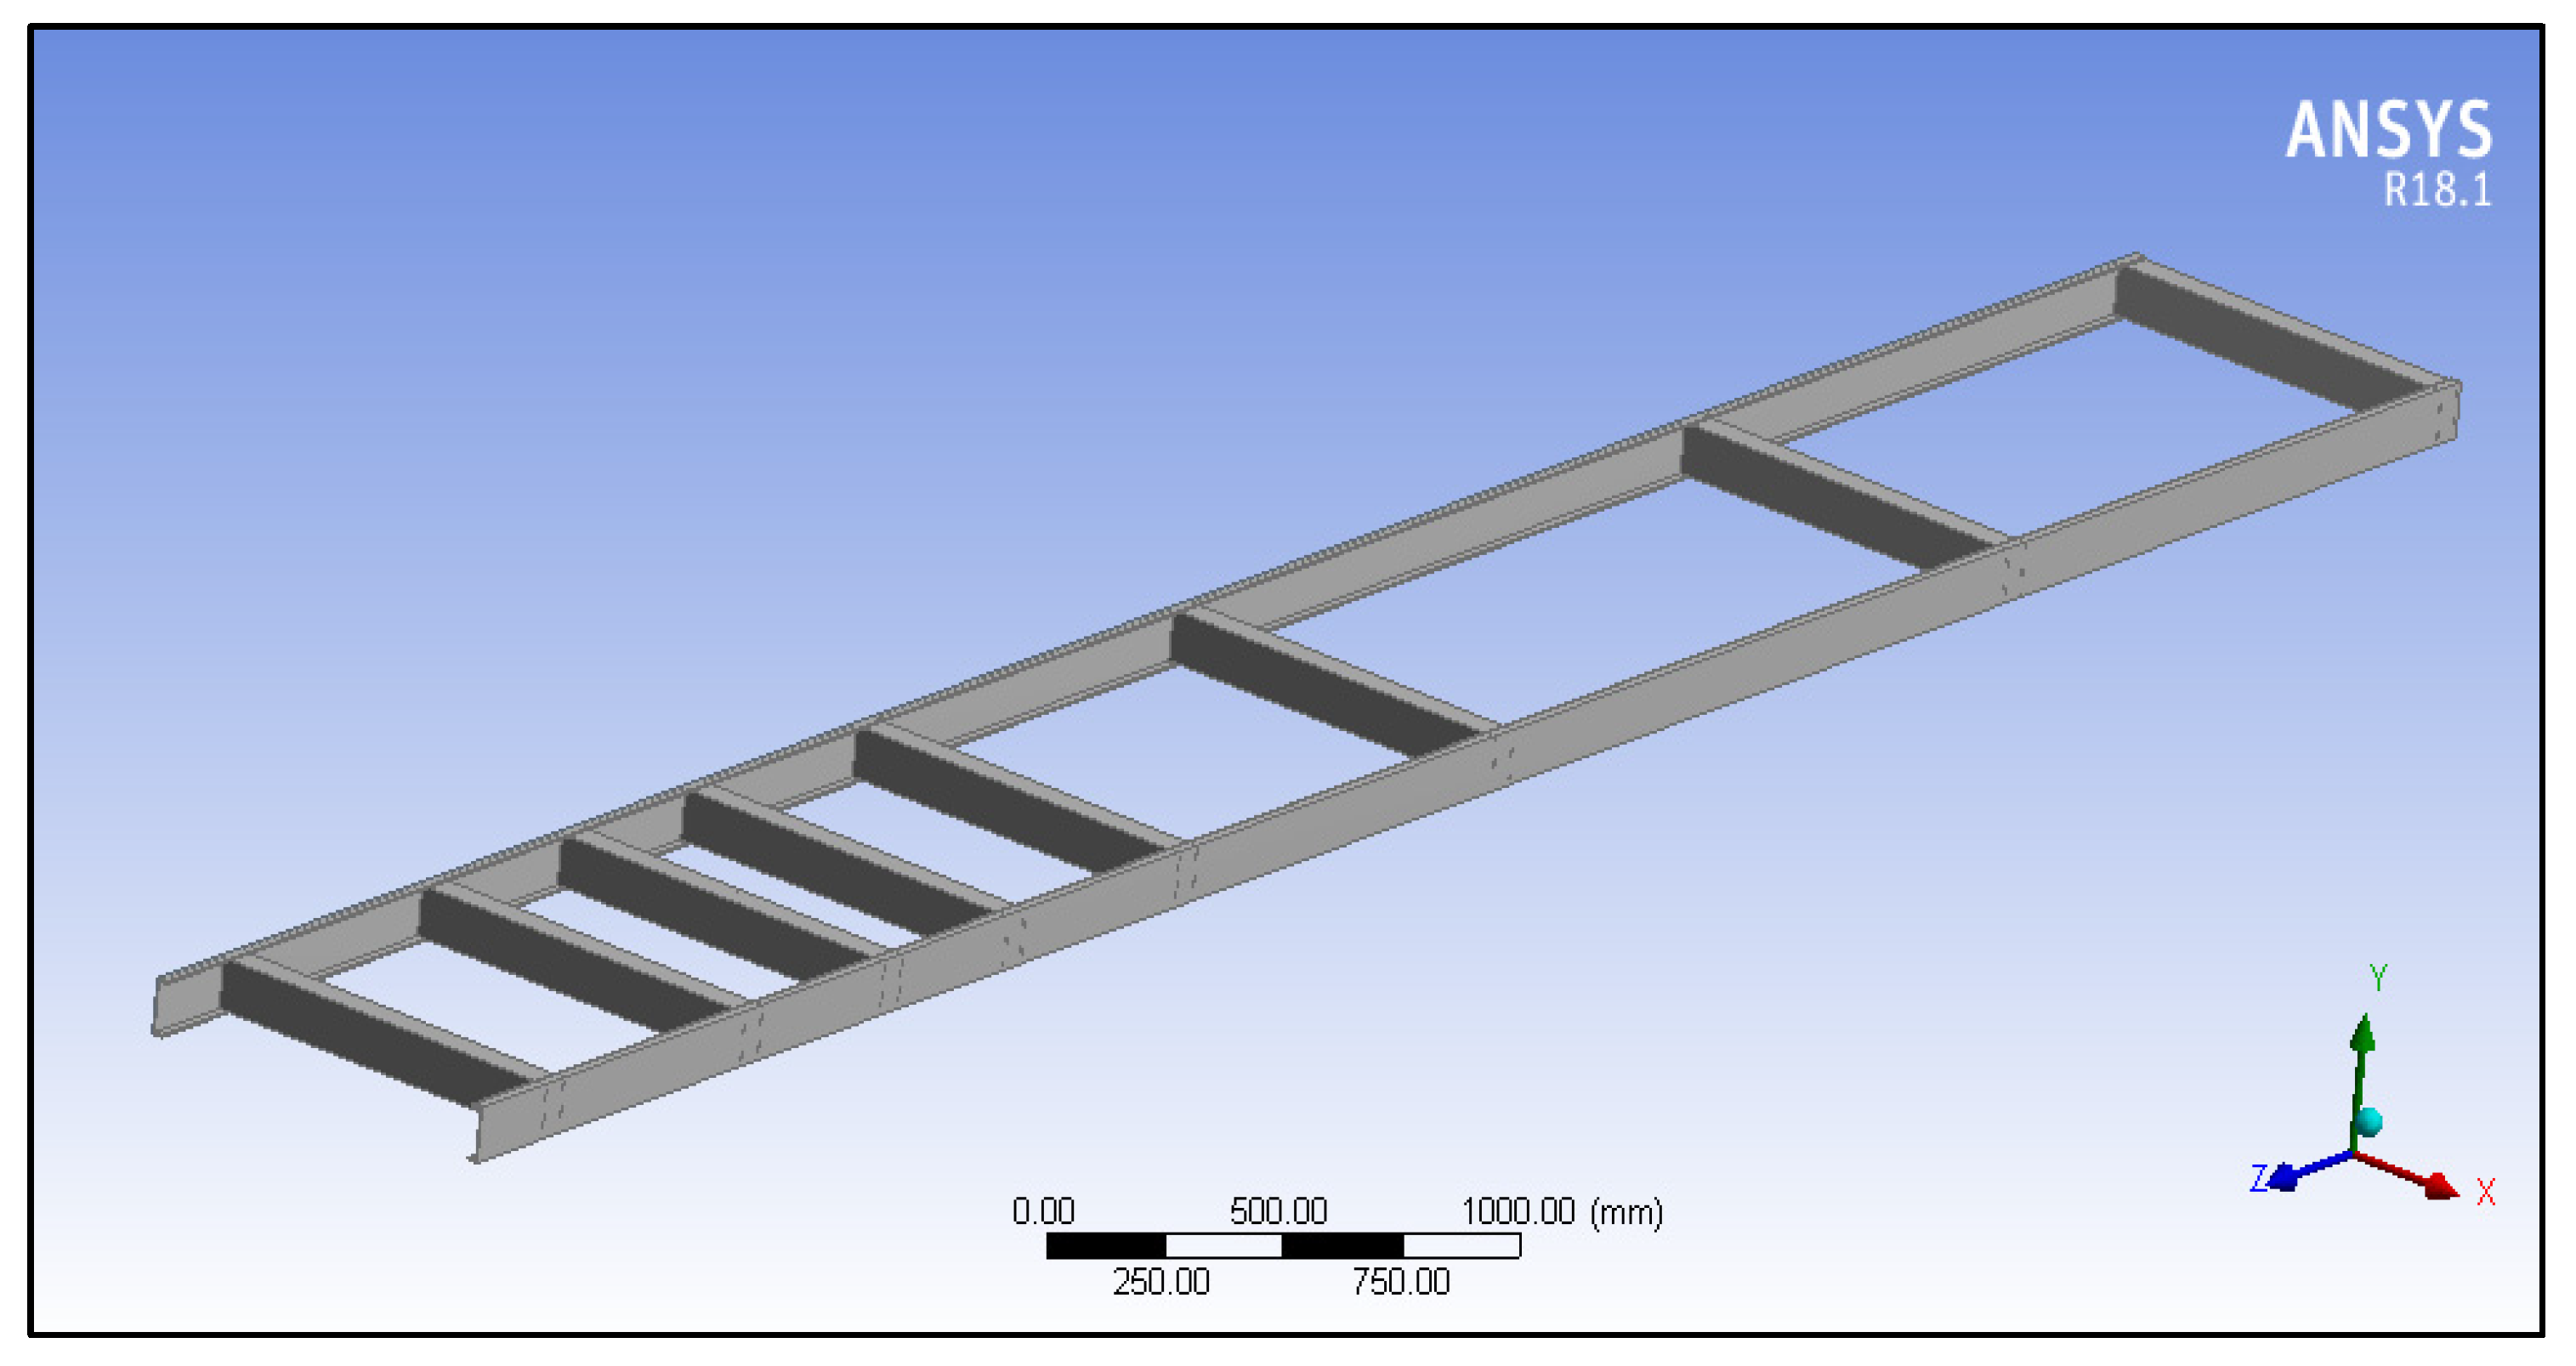
The kind of simulation used in this research is the static structural type. The version of the 120-simulation package is ANSYS V18.1. The interaction with the software was through graphical user 121 interface (GUI). However, the inbuilt language of the software is C++. The CAD model of the chassis was developed in ANSYS design modeler. The developed CAD model is shown in Figure 1 below.
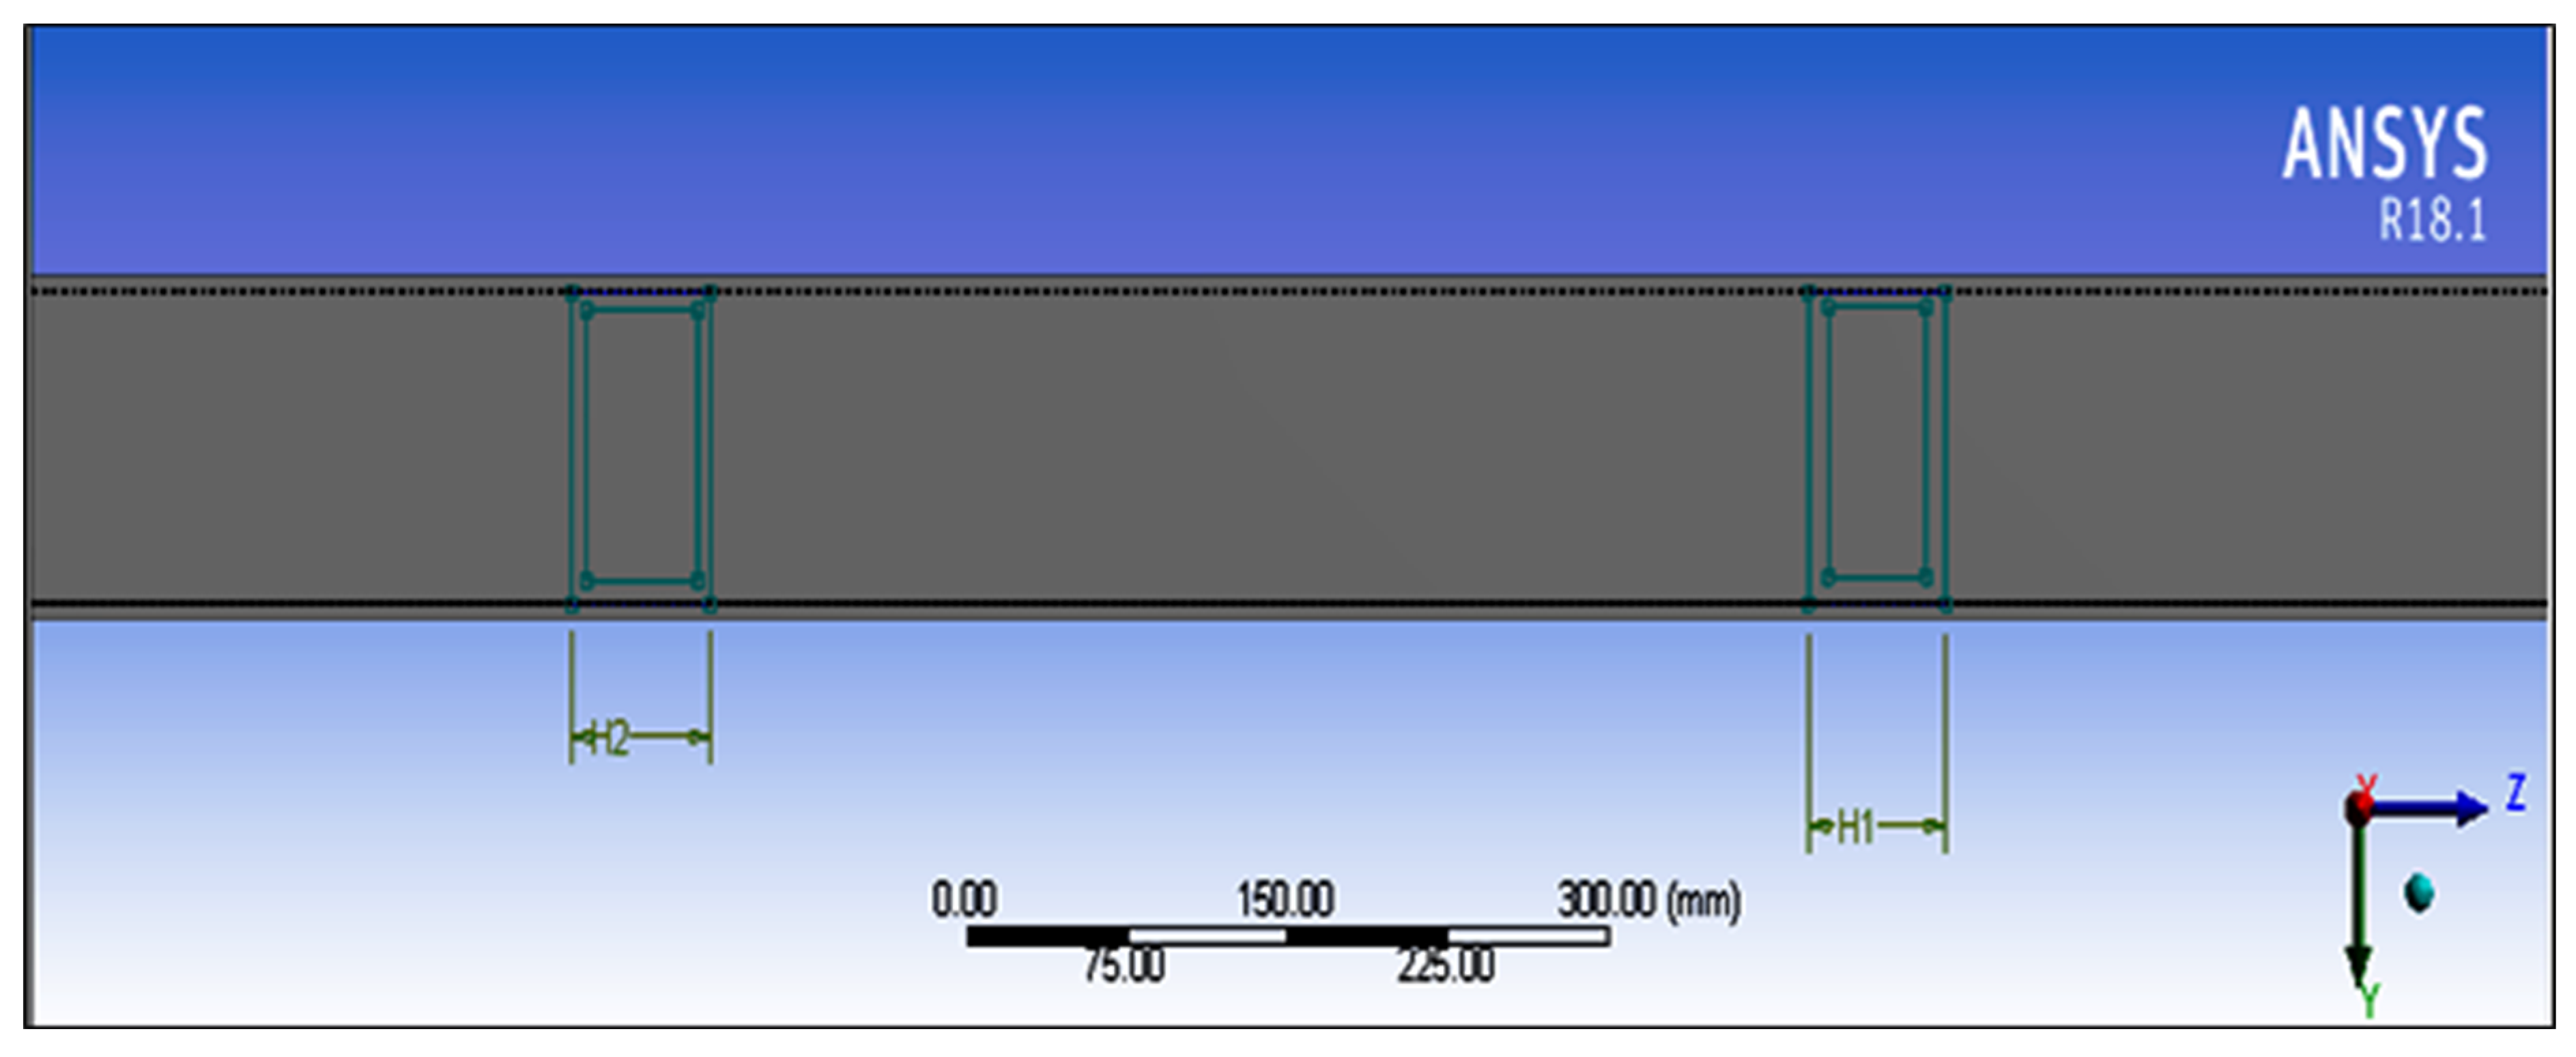
Subsequent process involves defining the optimization variables, i.e., cross member 1, cross member 2 and cross member 3 as shown in Figure 2.
All the three dimensions selected for optimization are of the linear type and each having a length of 65 mm, as shown in Table 1.
St52E is ductile material that possesses isotropic behaviour. Al GA 7-230 is an isotropic MMC with specific mechanical properties [12,17]. P100/6061 Al is a continuous-fibre-reinforced MMC that is a non-isotropic material and possesses different elasticity along different directions. However, we have provided the input data of the transverse direction. The Graphite AlGA 7-230 has a density 2.45 gm/cm3, Young’s modulus (x) (GPa) of 88.7, thermal conductivity of 190 (W/m-K) (x-y) [18,25]; P100/6061 Al composites has 2.5 gm/cm3, 342.5 (GPa) and 320.0 W/m-K, respectively [29]. The composite material is defined in the material property cell of the static structural module in the ANSYS workbench. The structural properties defined is the modulus of elasticity, Poisson’s ratio and density. The material properties are also indicated in Table 2 below.
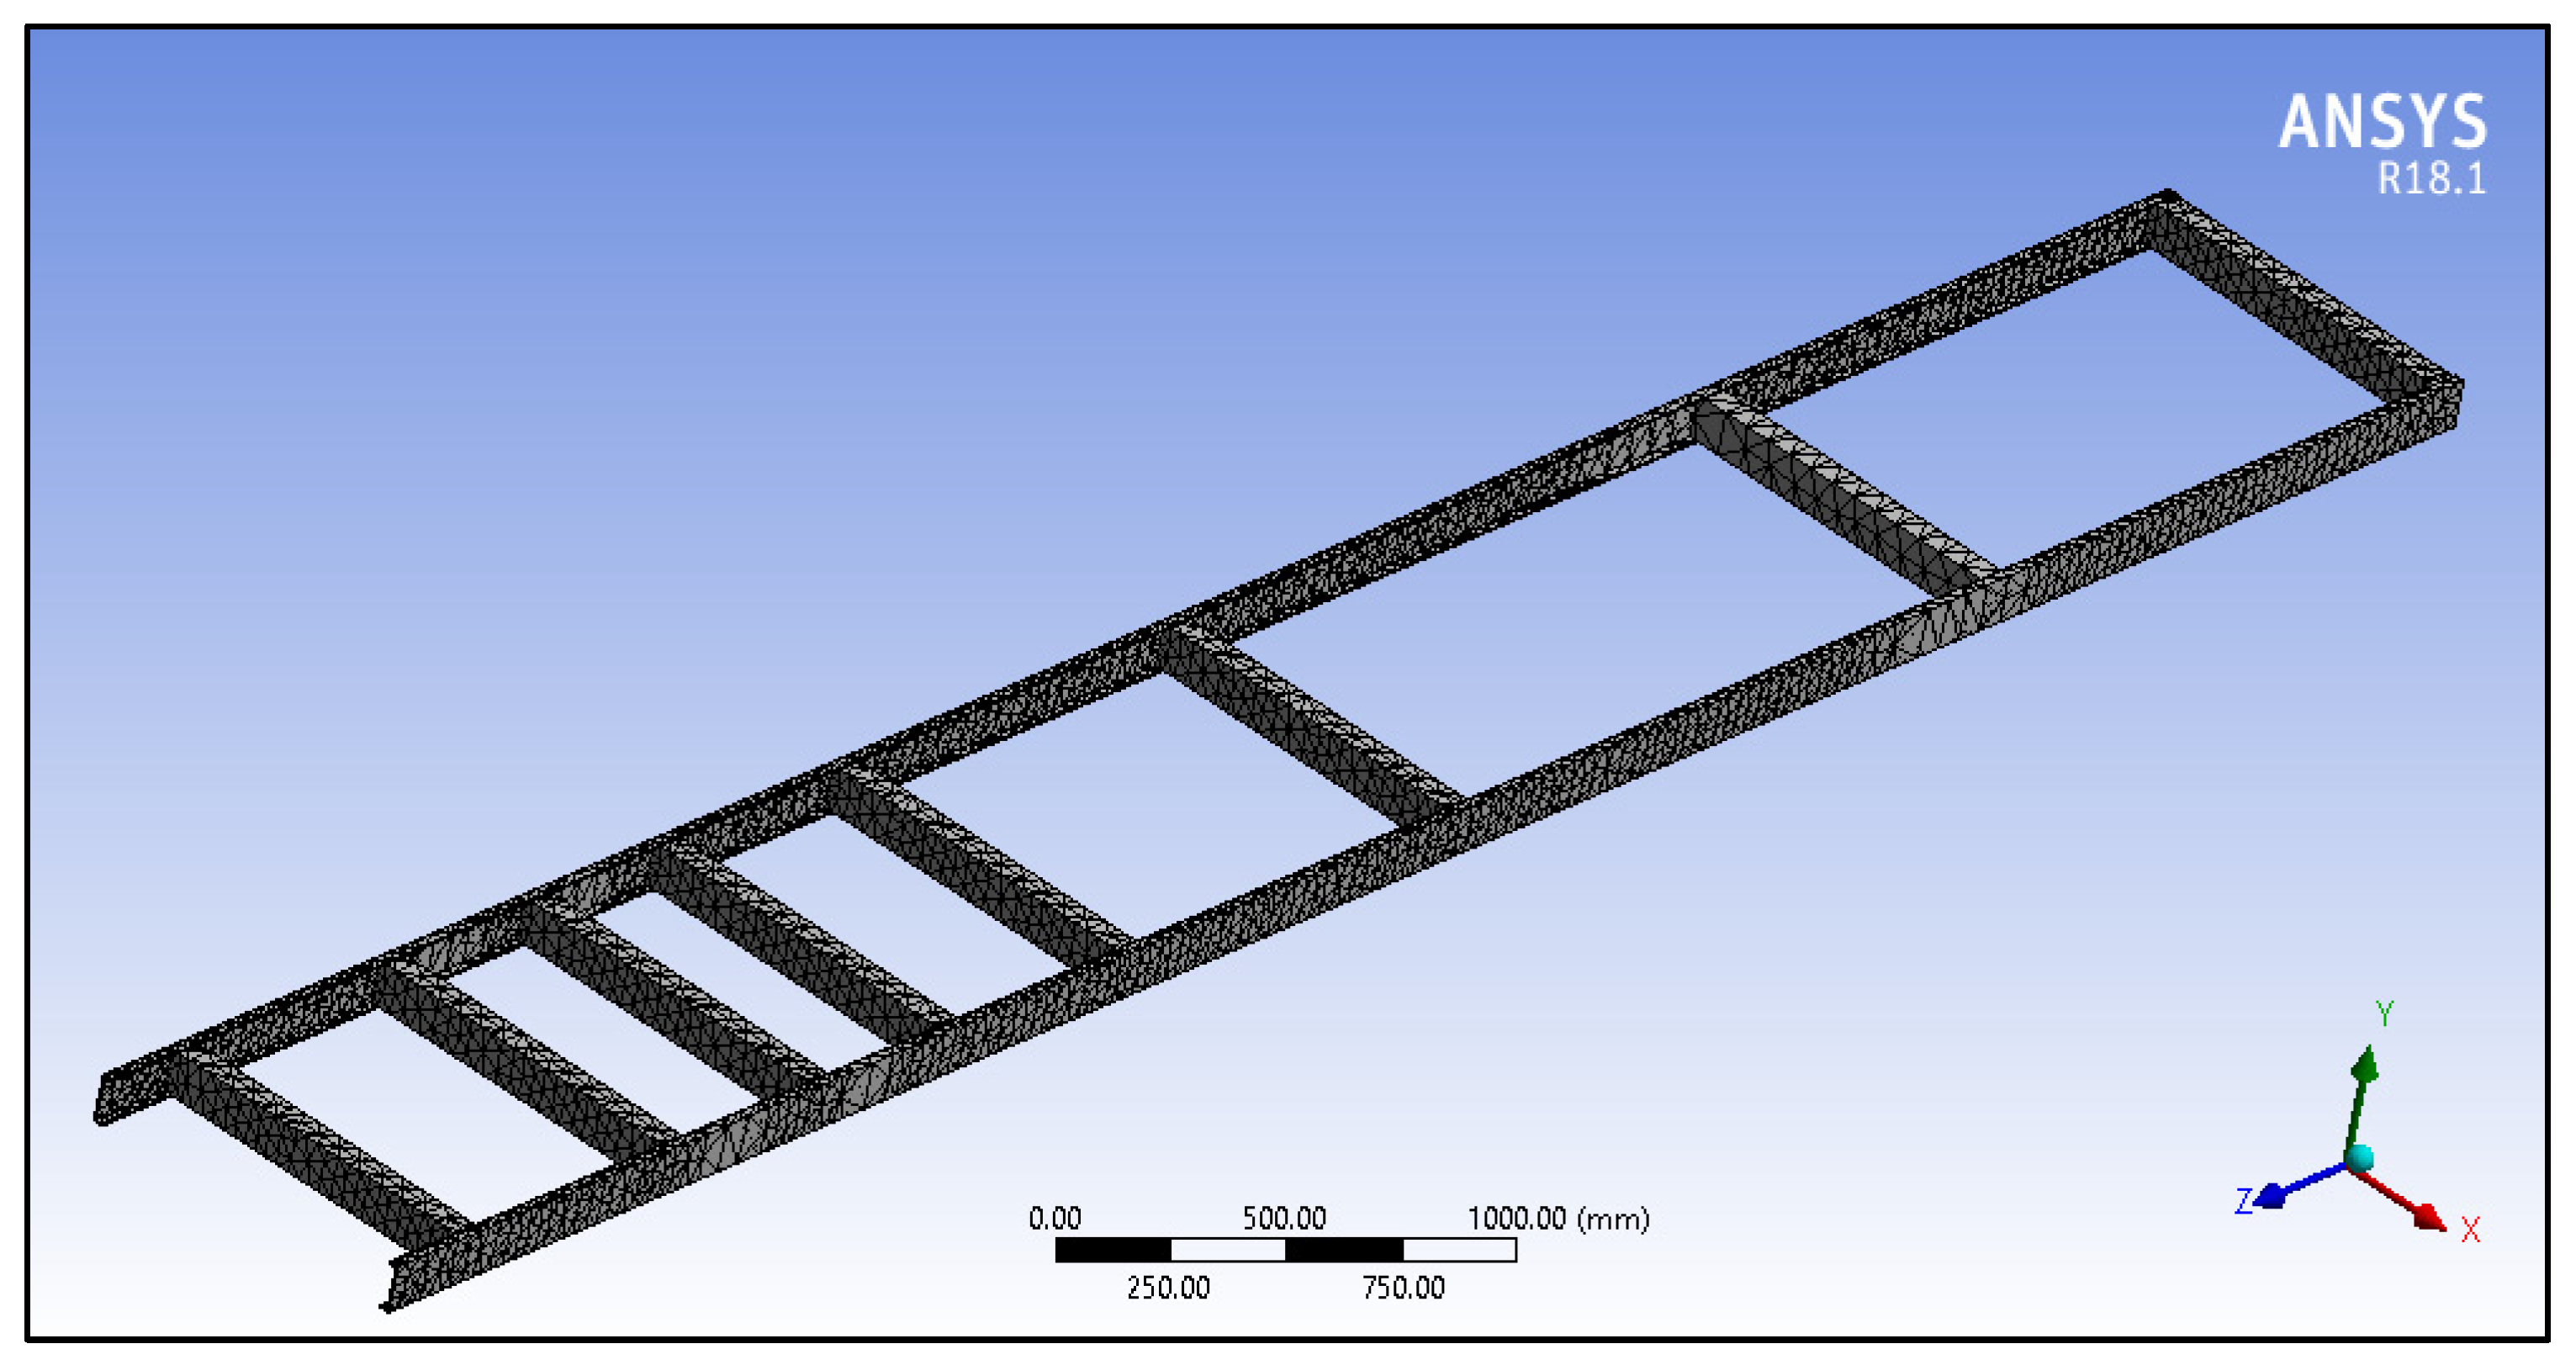
Although hexahedral elements give a higher accuracy, the condition of the hexahedral meshing is not fulfilled by the geometry of the chassis. The design to be meshed should have topological consistency, which is not present in our design objective. The chassis design has sharp edges and curvatures and the tetrahedral element is suited for such complex geometries. The meshed model of the HMV chassis in shown in Figure 3.
The chassis design was discretized using tetrahedral elements with a growth rate set to 1.2, inflation set to normal and number of layers set to 5. The number of elements generated was 20,080 and the number of nodes generated was 42,840. The next step involves applying loads and boundary conditions.
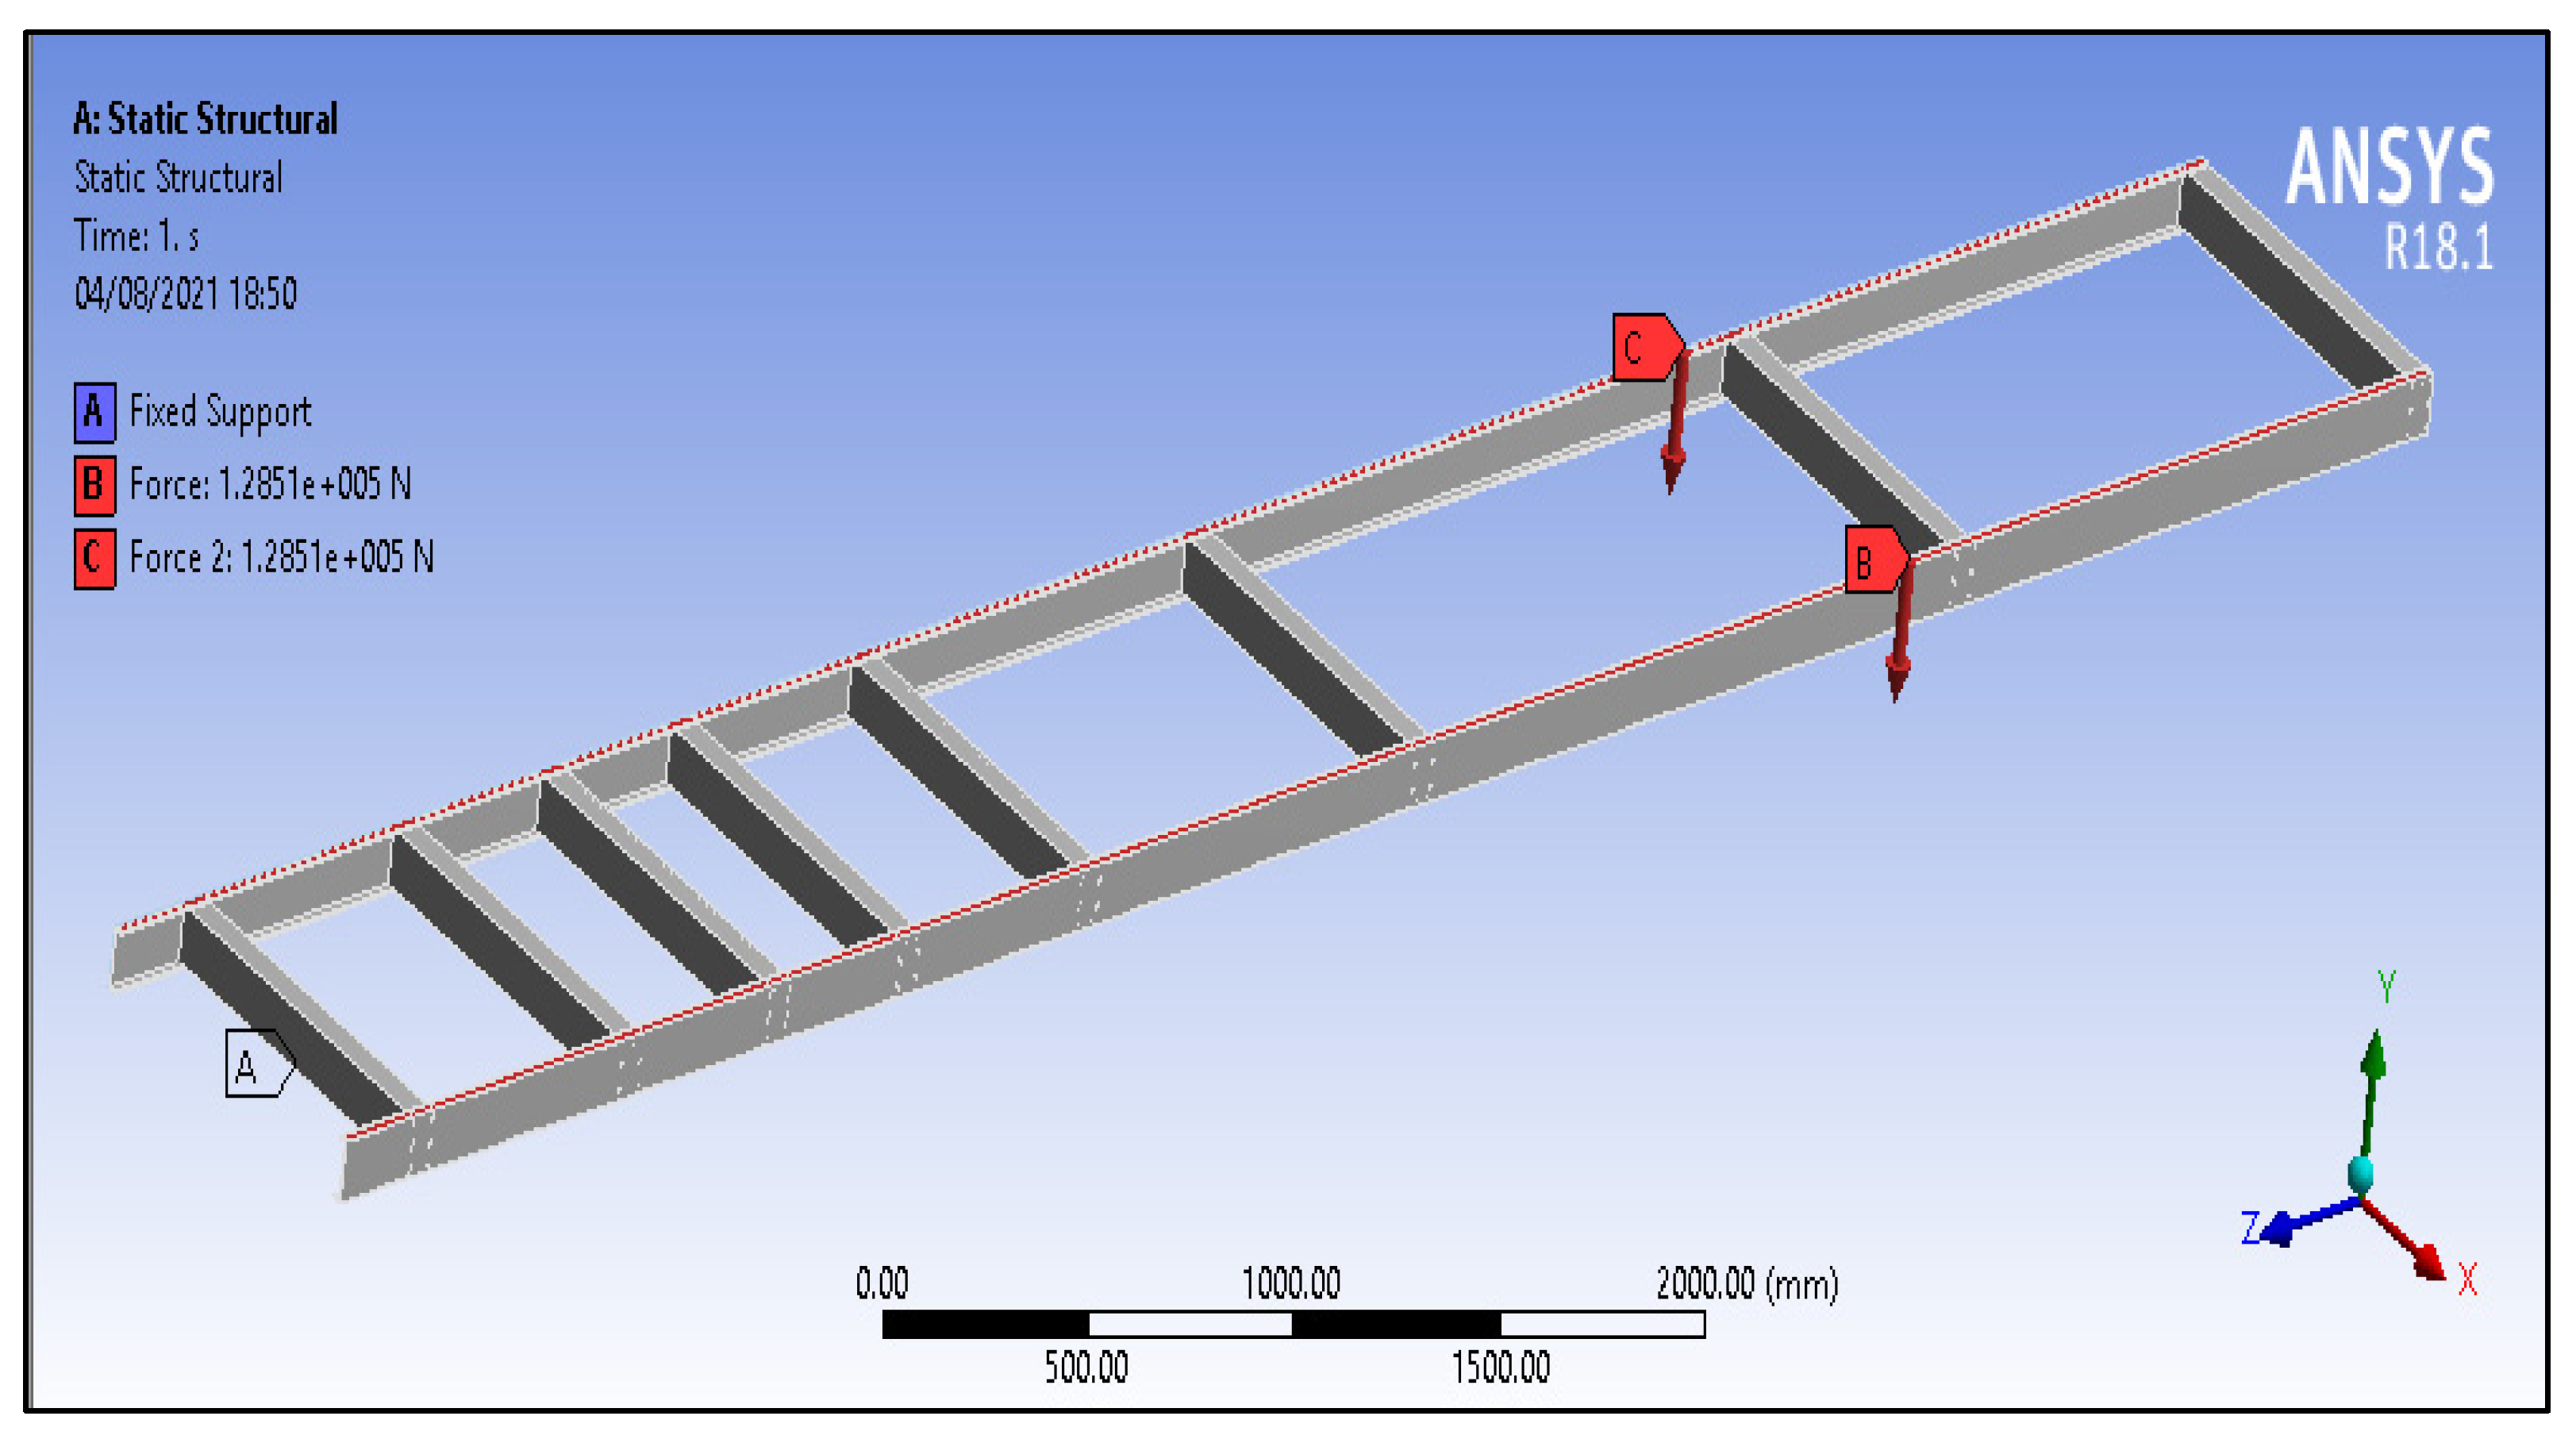
The boundary conditions were determined on the basis of available literature as well as analytical calculations that represent the actual, physical conditions acting on the HMV chassis. The FEA simulation conditions are the same as the experimental testing conditions. Downward direction force was applied on both longitudinal members and fixed support was applied on the first and last transverse member, as shown in Figure 4.
After applying the loads and boundary conditions, the solver was run using the sparse matrix solver. The solution process involves generation of stiffness matrices associated with each element, assemblage of a global stiffness matrix followed by matrix inversions and multiplication.
3. Result and Discussion
3.1. Equivalent Stress
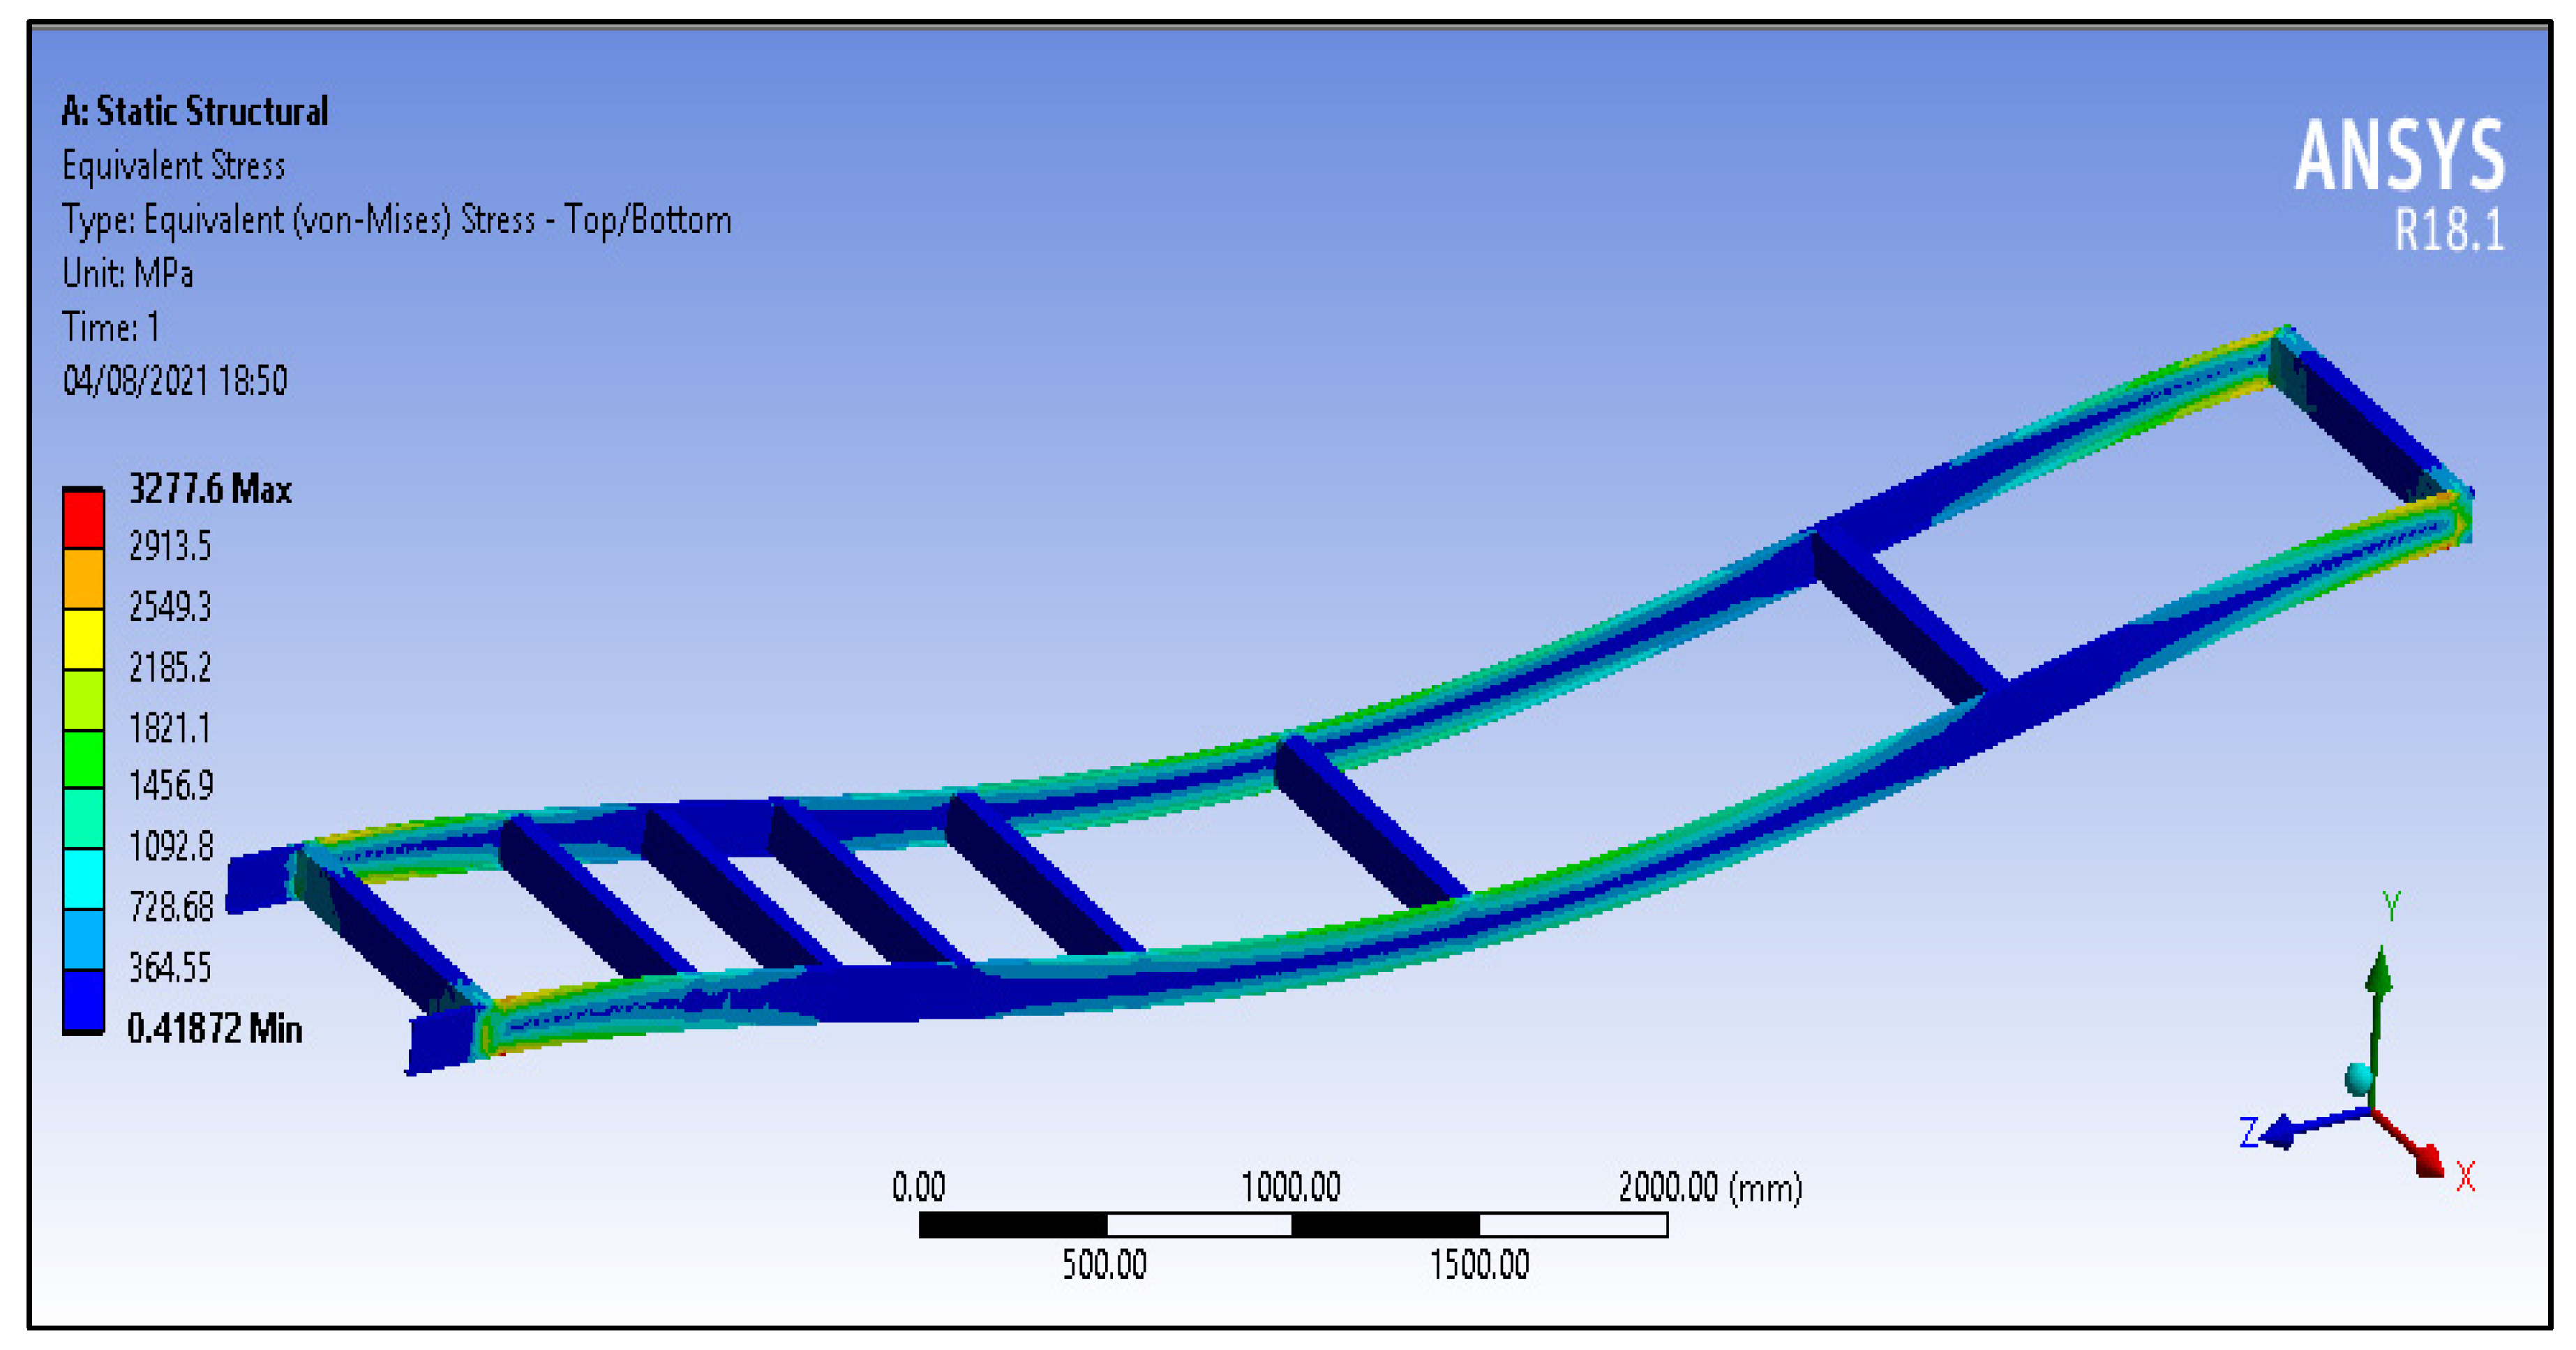
FE simulation was conducted on chassis to determine the stresses and deformation. The equivalent stress plot is shown in Figure 5 below. The stresses near the support are higher and is minimum at other zones. The maximum stress is generated on longitudinal members and is observed to be minimum for lateral members.
3.2. Total Deformation
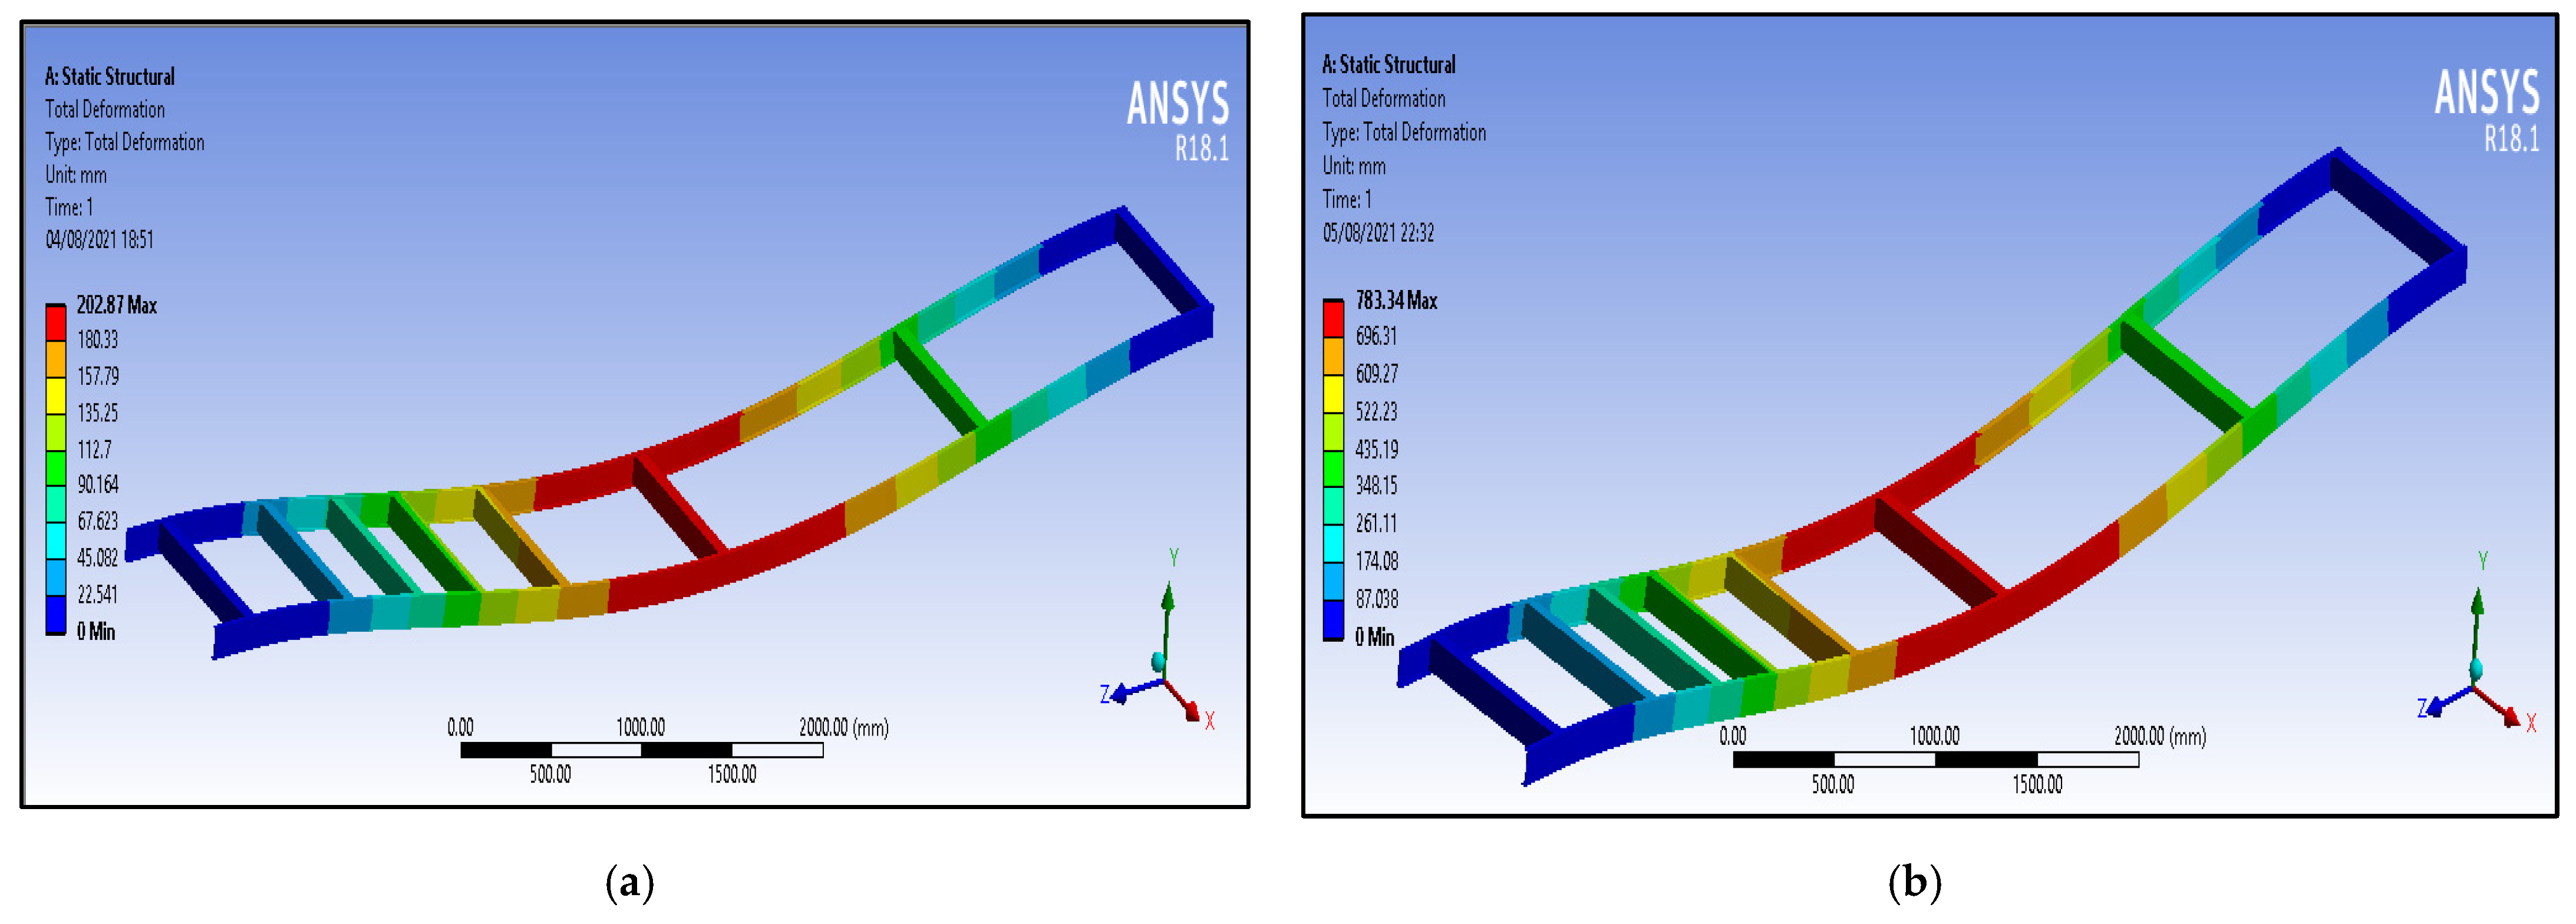
The deformations obtained from the analysis are shown in Figure 6a,b, respectively, in both cases. The maximum deformation is observed at the center of the chassis, and it reduces on moving towards the fixed support of the chassis ends.
The maximum deformation observed at the center of the chassis is 202.8 mm, as shown in Figure 6a, when using the P100/6061 Al MMC. The maximum deformation observed at the center of the chassis is 783.34 mm, as shown in Figure 6b, when using Al GA 7-230 MMC. The design of the chassis is then optimized using the optimal space-filling design scheme. The design points were generated using the Box–Behnken design scheme. Different combinations of the dimensions of cross member 1, cross member 2 and cross member 3 were generated on the basis of the Box–Behnken scheme. The equivalent stress, deformation and solid mass were generated for each design point. The maximum and minimum values of these output parameters are shown in Table 3 and Table 4 respectively.
Table 5 shows the maximum and minimum values, where the maximum equivalent stress obtained from the optimization is 3517 MPa and the minimum equivalent stress obtained from the optimization is 3270.5 MPa. The deformation and solid mass output show less variation between the maximum and minimum values. The mass of the chassis with structural steel is 214.64 kg [26] whereas the mass of the chassis using P100/6061 Al is 66.967 Kg.
Table 6 shows that the maximum equivalent stress obtained from the optimization is 3531.8 MPa and minimum equivalent stress obtained from the optimization is 3207.3 MPa. The deformation and solid mass output show less variation between the maximum and minimum values. The mass of the chassis with structural steel is 214.64 kg [26] whereas the mass of the chassis using Graphite Al GA 7-230 is 62.564 Kg.
3.3. Surface Response
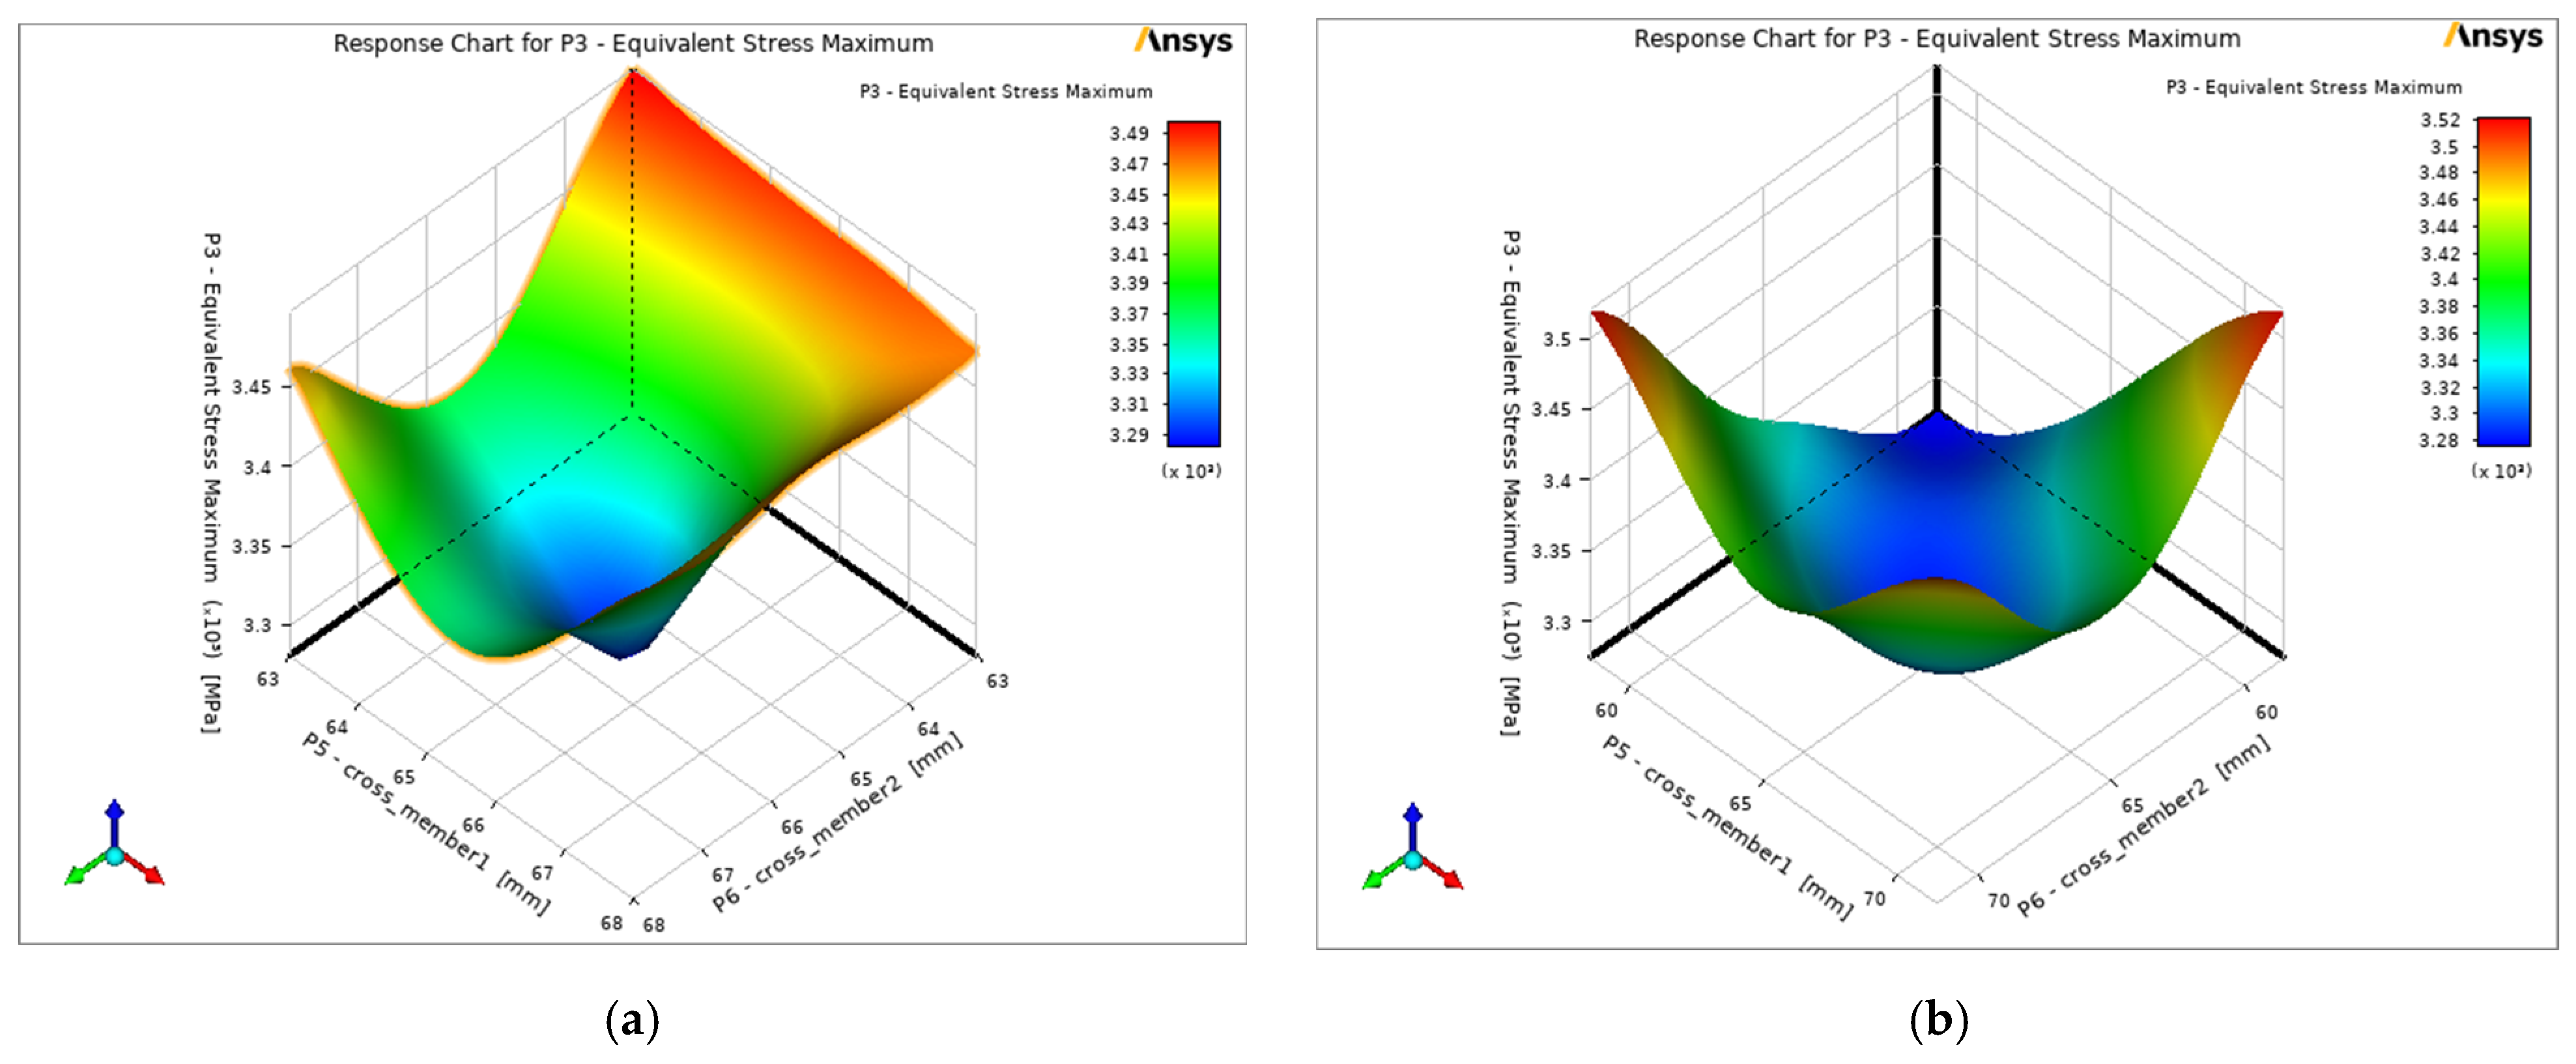
The response surface plot of equivalent stress in Figure 7a,b shows two peaks as represented in the red-coloured region. In Figure 7a, the maximum equivalent stress is obtained for cross member 2, ranging from 63 mm to 64 mm, and cross member 1, ranging from 63 mm to 68 mm; while, in Figure 7b, the maximum equivalent stress is obtained for cross member 2, ranging from 58.5 mm to 60 mm, and cross member 1, ranging from 59 mm to 61 mm. The equivalent stress is observed to be minimum for regions represented in a dark blue colour.
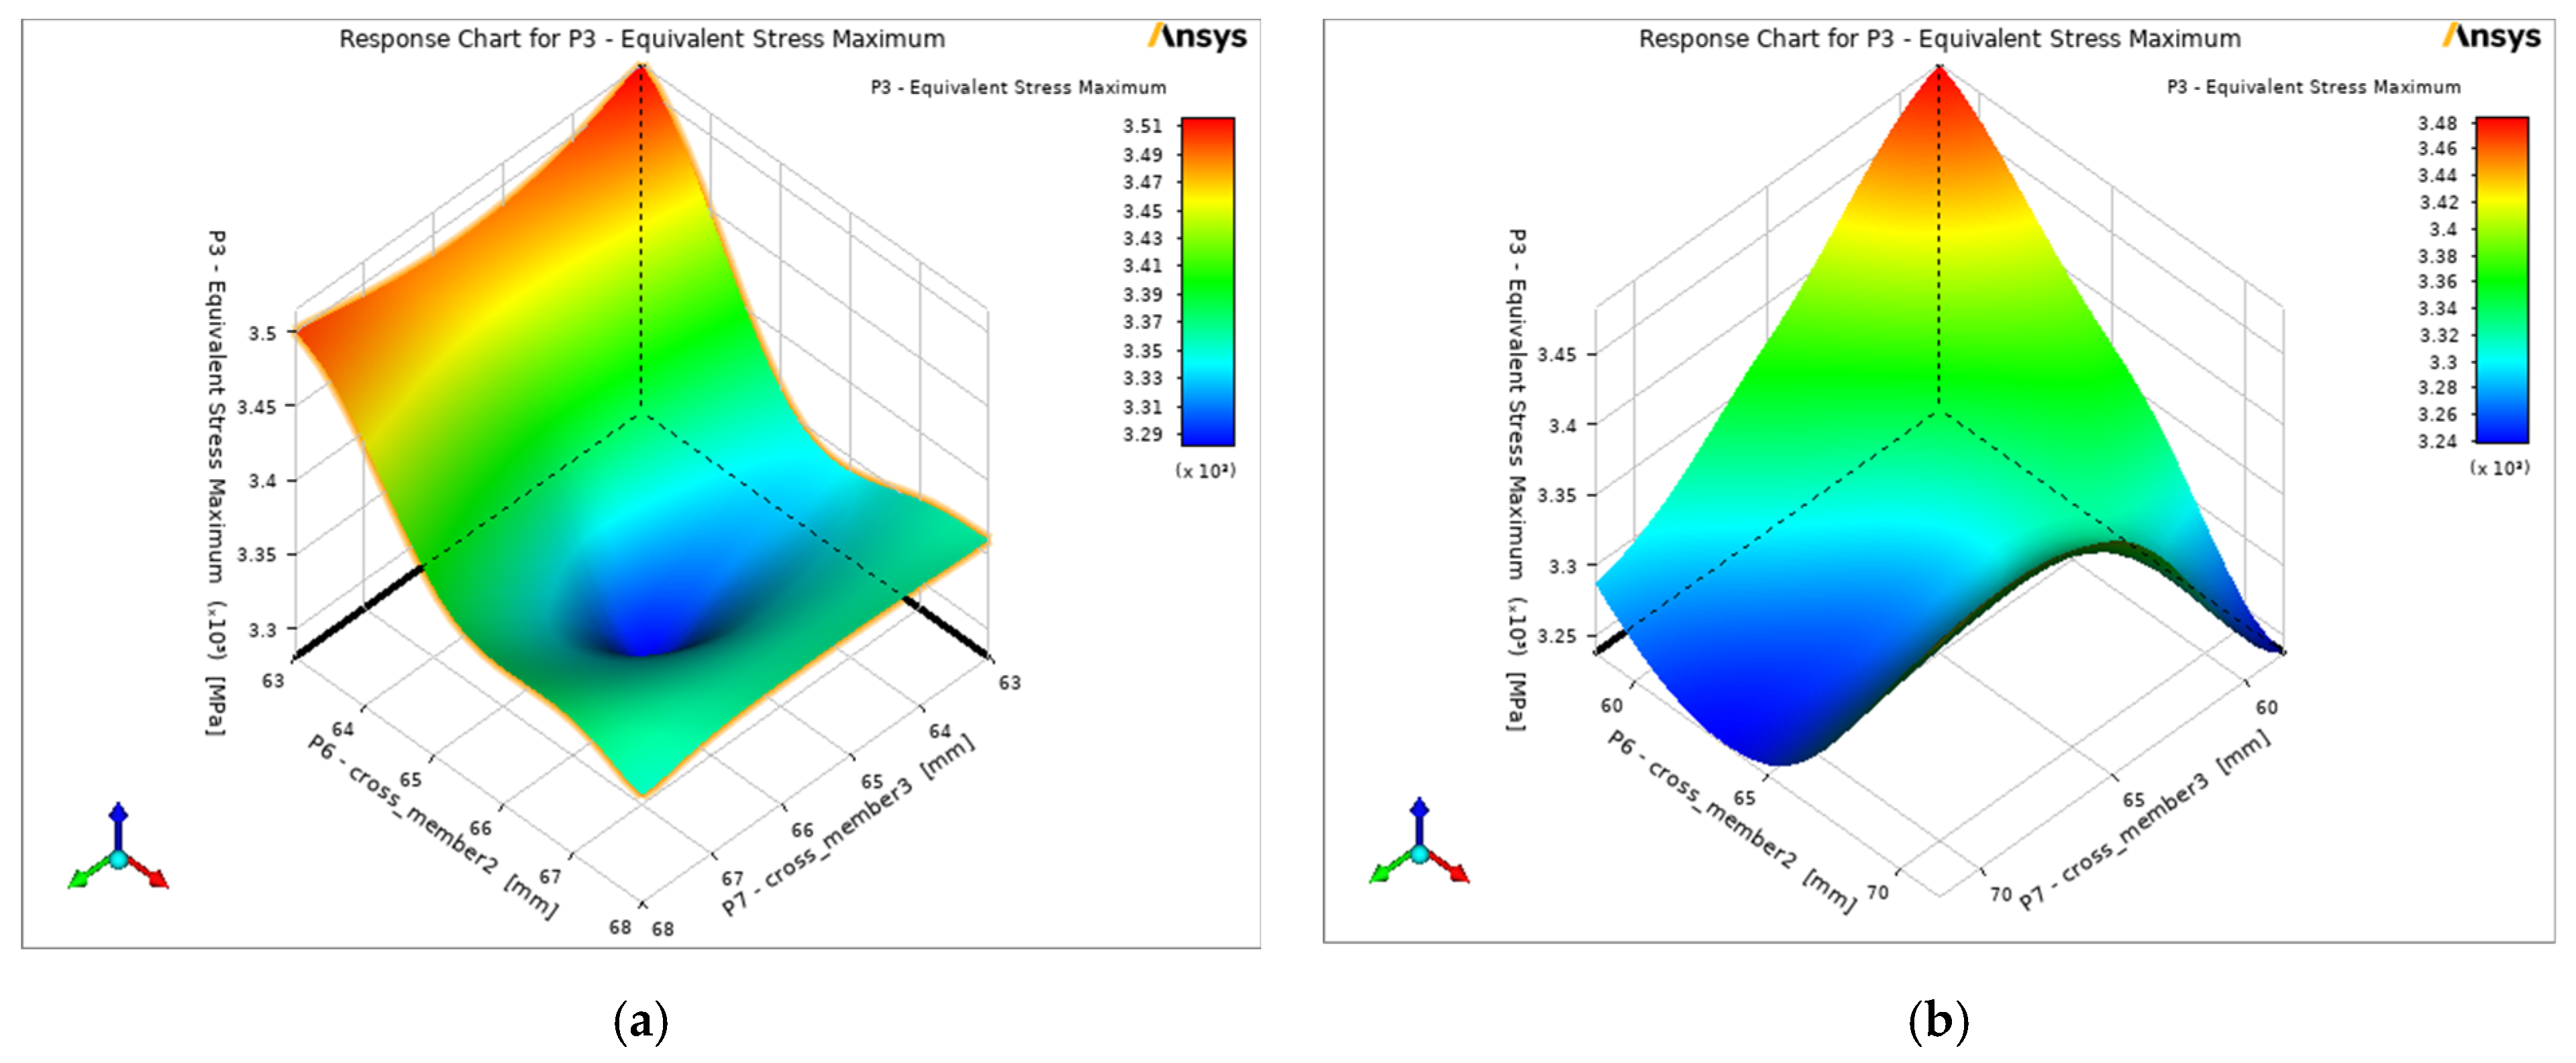
The response surface plot of equivalent stress vs. cross member 2 and cross member 3 is shown in Figure 8a,b. The plot in Figure 8a shows the maximum equivalent stress in the region represented by the red colour, for which the cross member 2 dimension ranges from 63 mm to 63.5 mm whereas cross member 3 ranges from 63 mm to 68 mm; in turn, as per Figure 8b, the cross member 2 dimension ranges from 59 mm to 61 mm whereas cross member 3 ranges from 59 mm to 62 mm. The equivalent stress is minimum for the region represented in the dark blue colour.
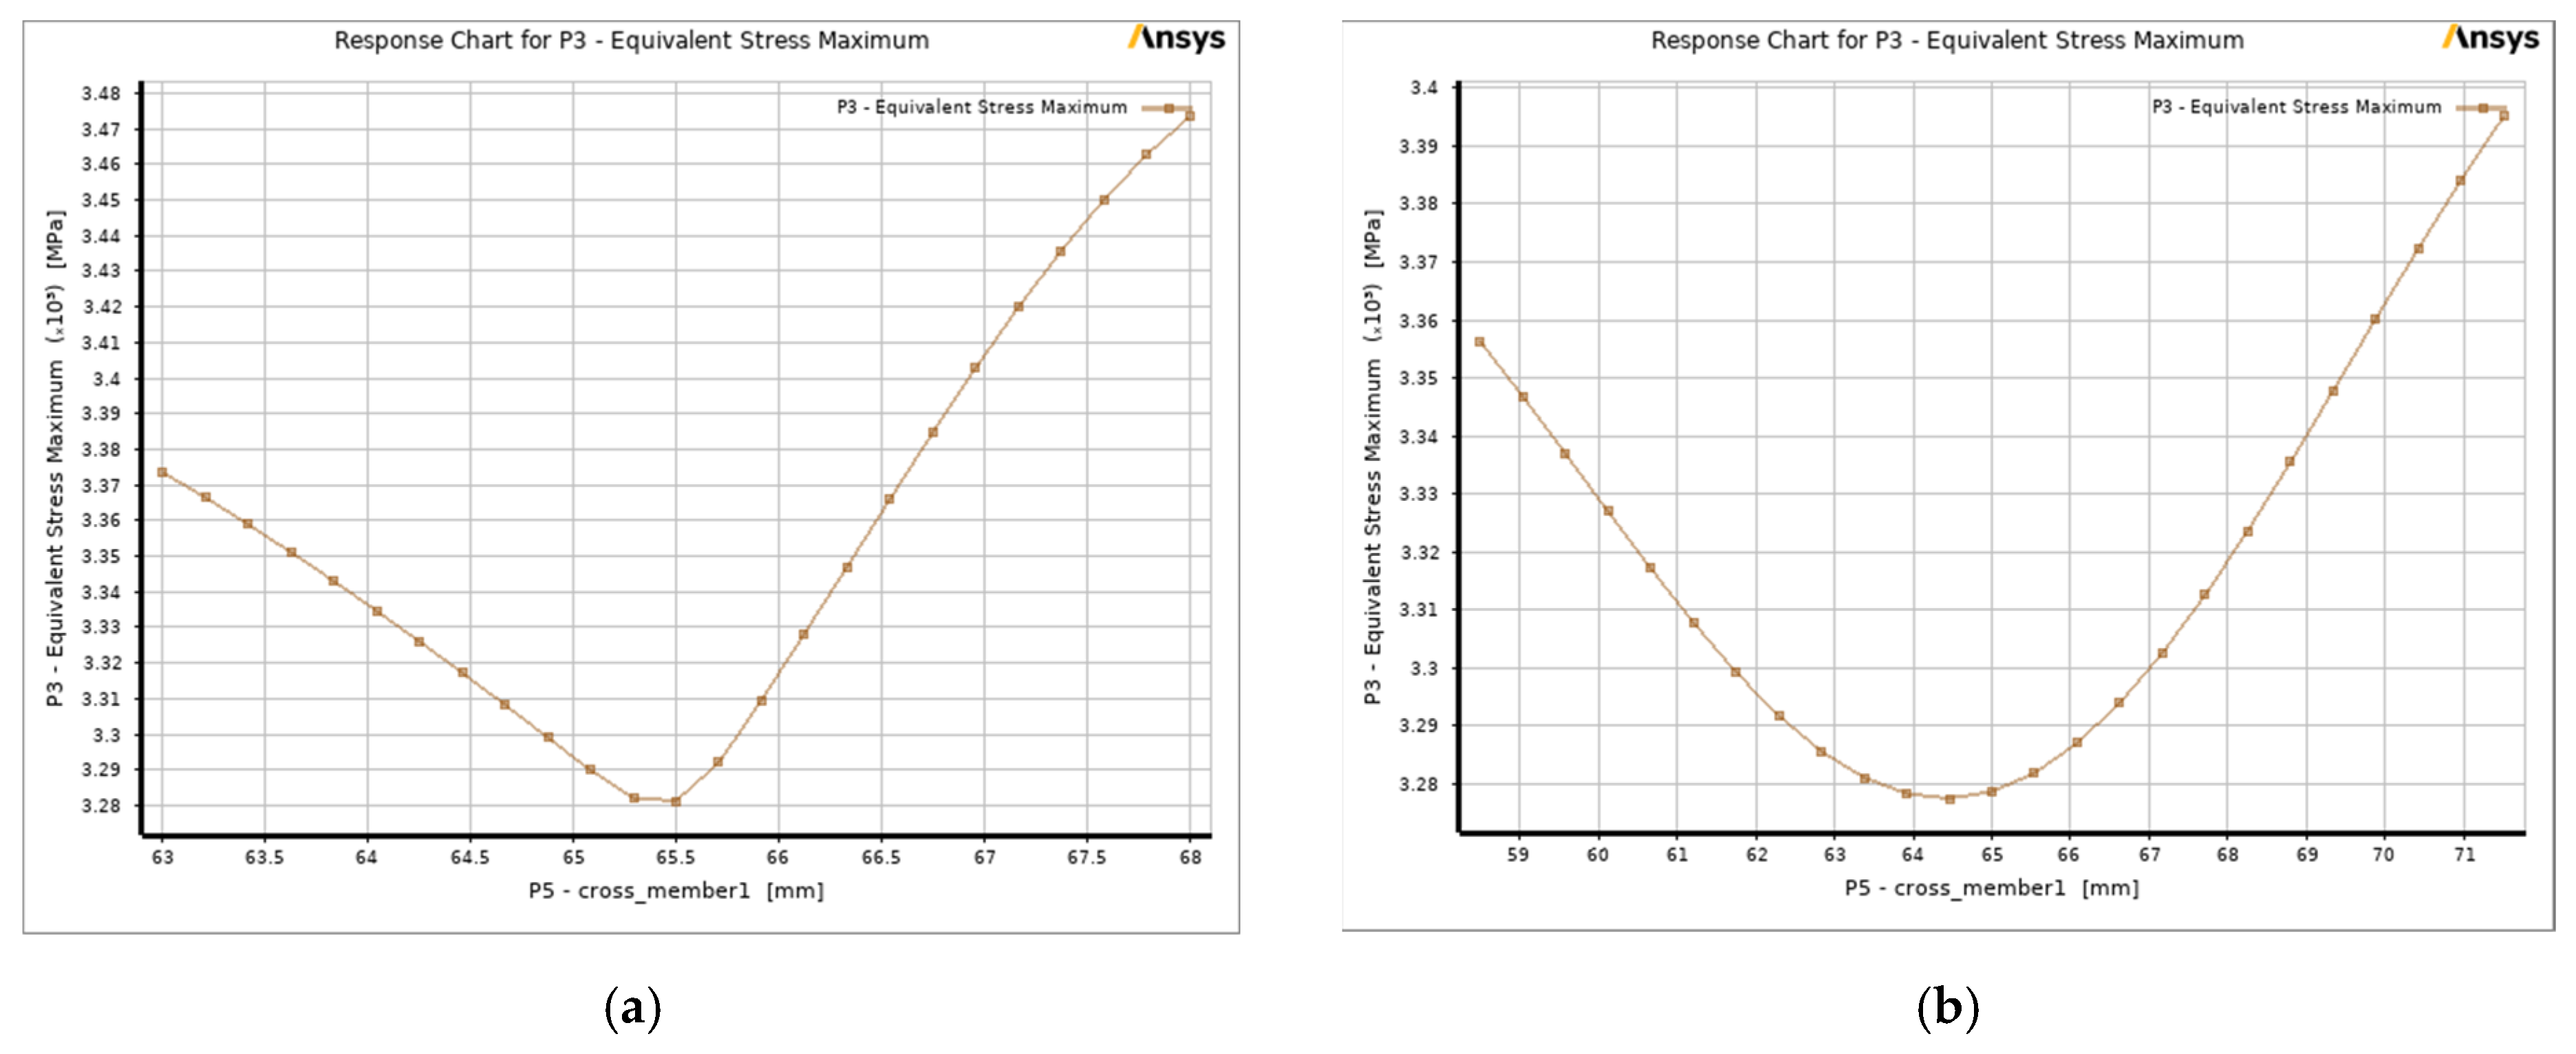
The variation in equivalent stress vs. cross_member1 is shown in Figure 9, where Figure 9a represented that equivalent stress initially decreases and reaches a minimum value at a cross member 1 dimension of 65.5 mm and then increases linearly and reaches the maximum value at the cross member 1 dimension of 68 mm; while, in Figure 9b, the equivalent stress initially decreases and reaches its minimum value at a cross member 1 dimension of 64.5 mm and then increases linearly and reaches its maximum value at a cross member 1 dimension of 71.5 mm.
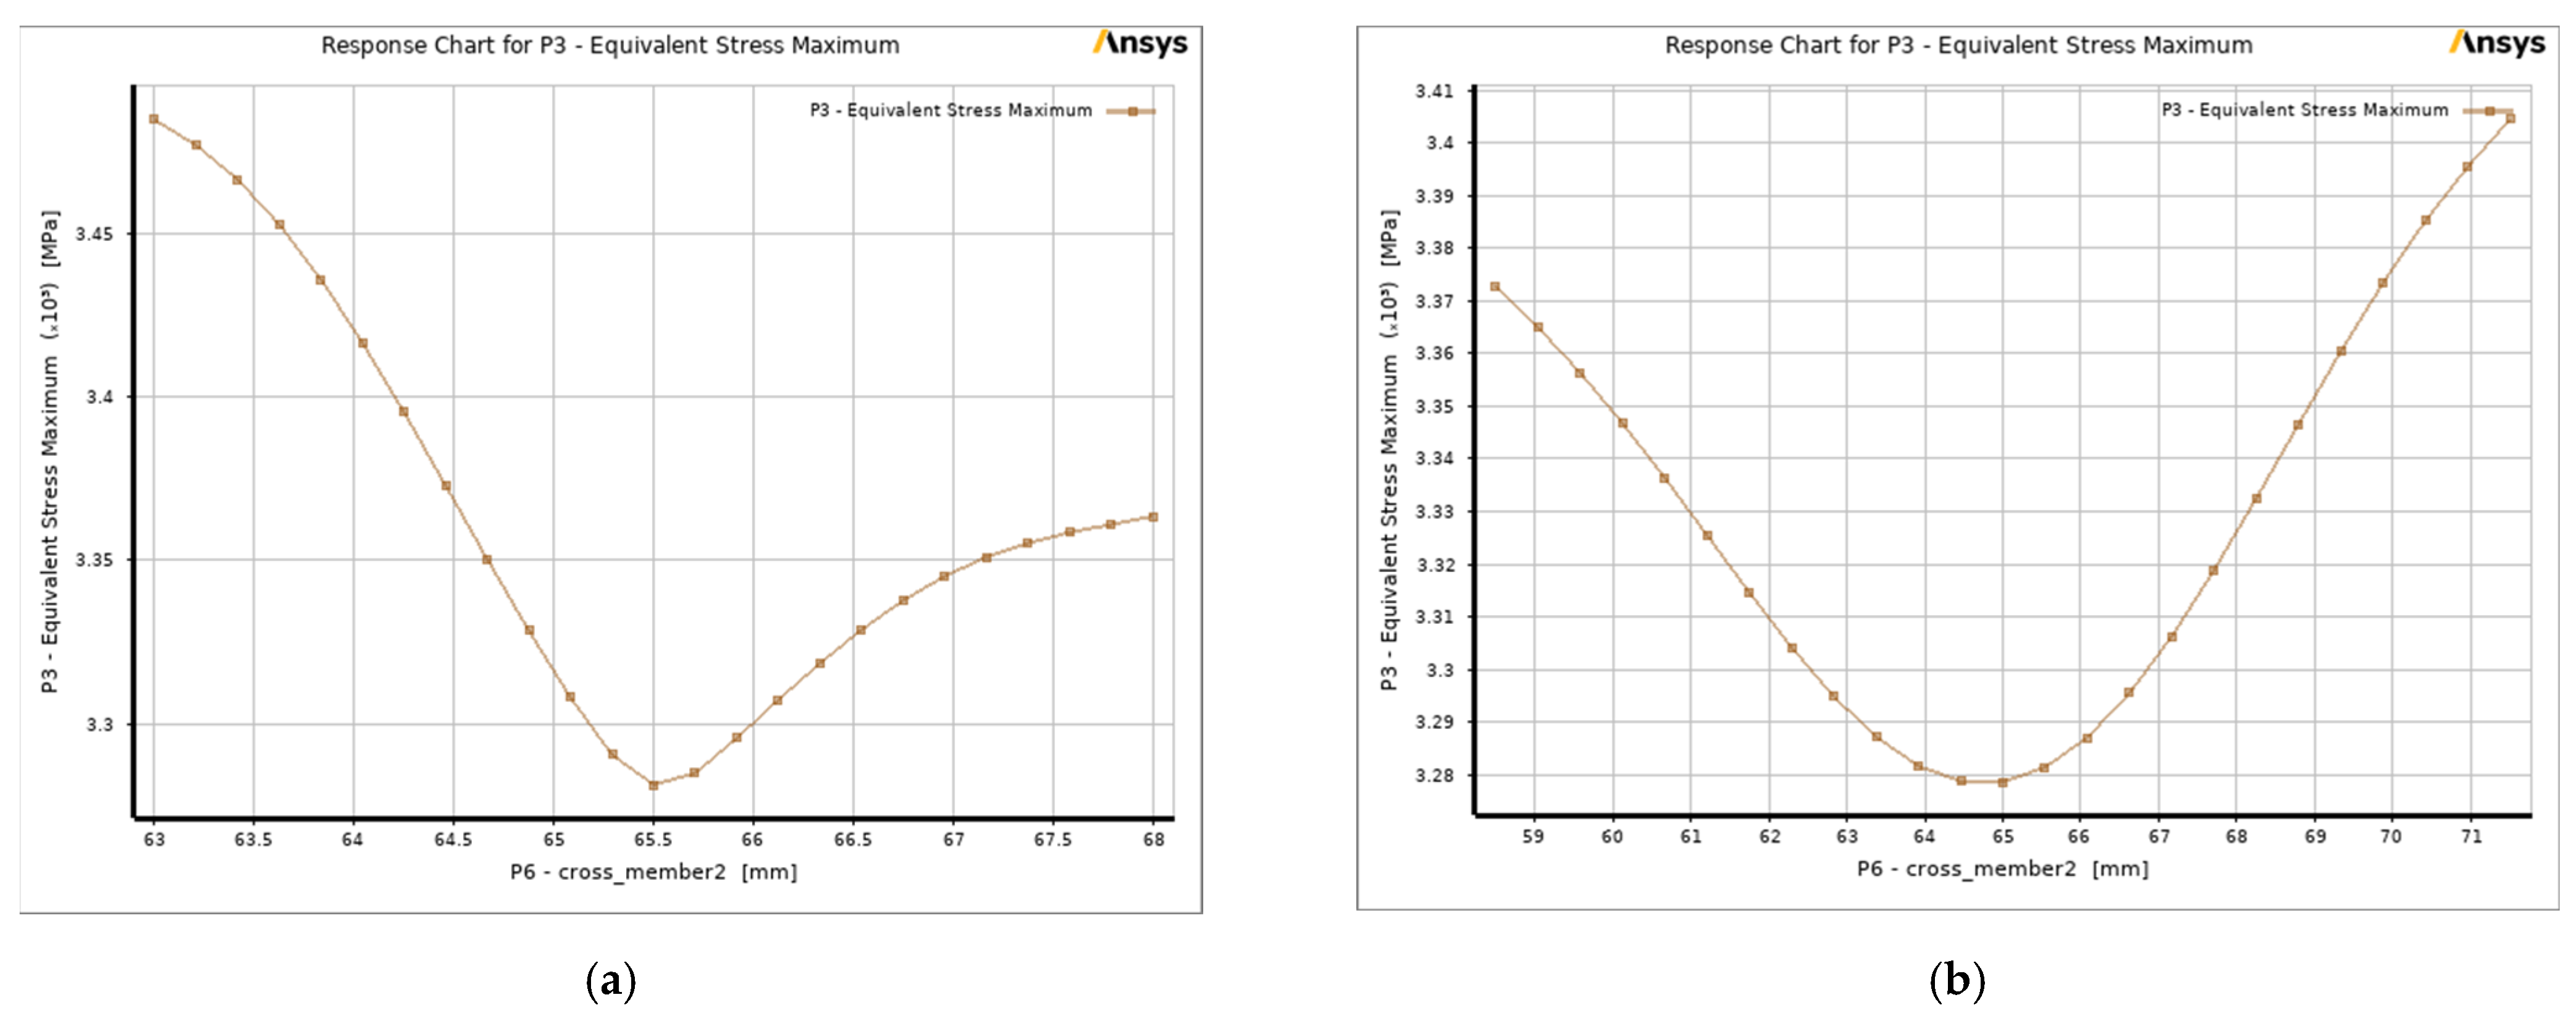
The variation of equivalent stress vs. cross member 2 is shown in Figure 10, where in Figure 10a, the equivalent stress initially decreases up to 65.5 mm and then increases parabolically and reaches a maximum at cross member 2 dimension of 68 mm in case of Al GA 7-230 MMC. Figure 10b shows that the equivalent stress initially decreases up to 65 mm and then increases parabolically and reaches a maximum at a cross member 2 dimension of 71.5 mm in case of Al GA 7-230 MMC.
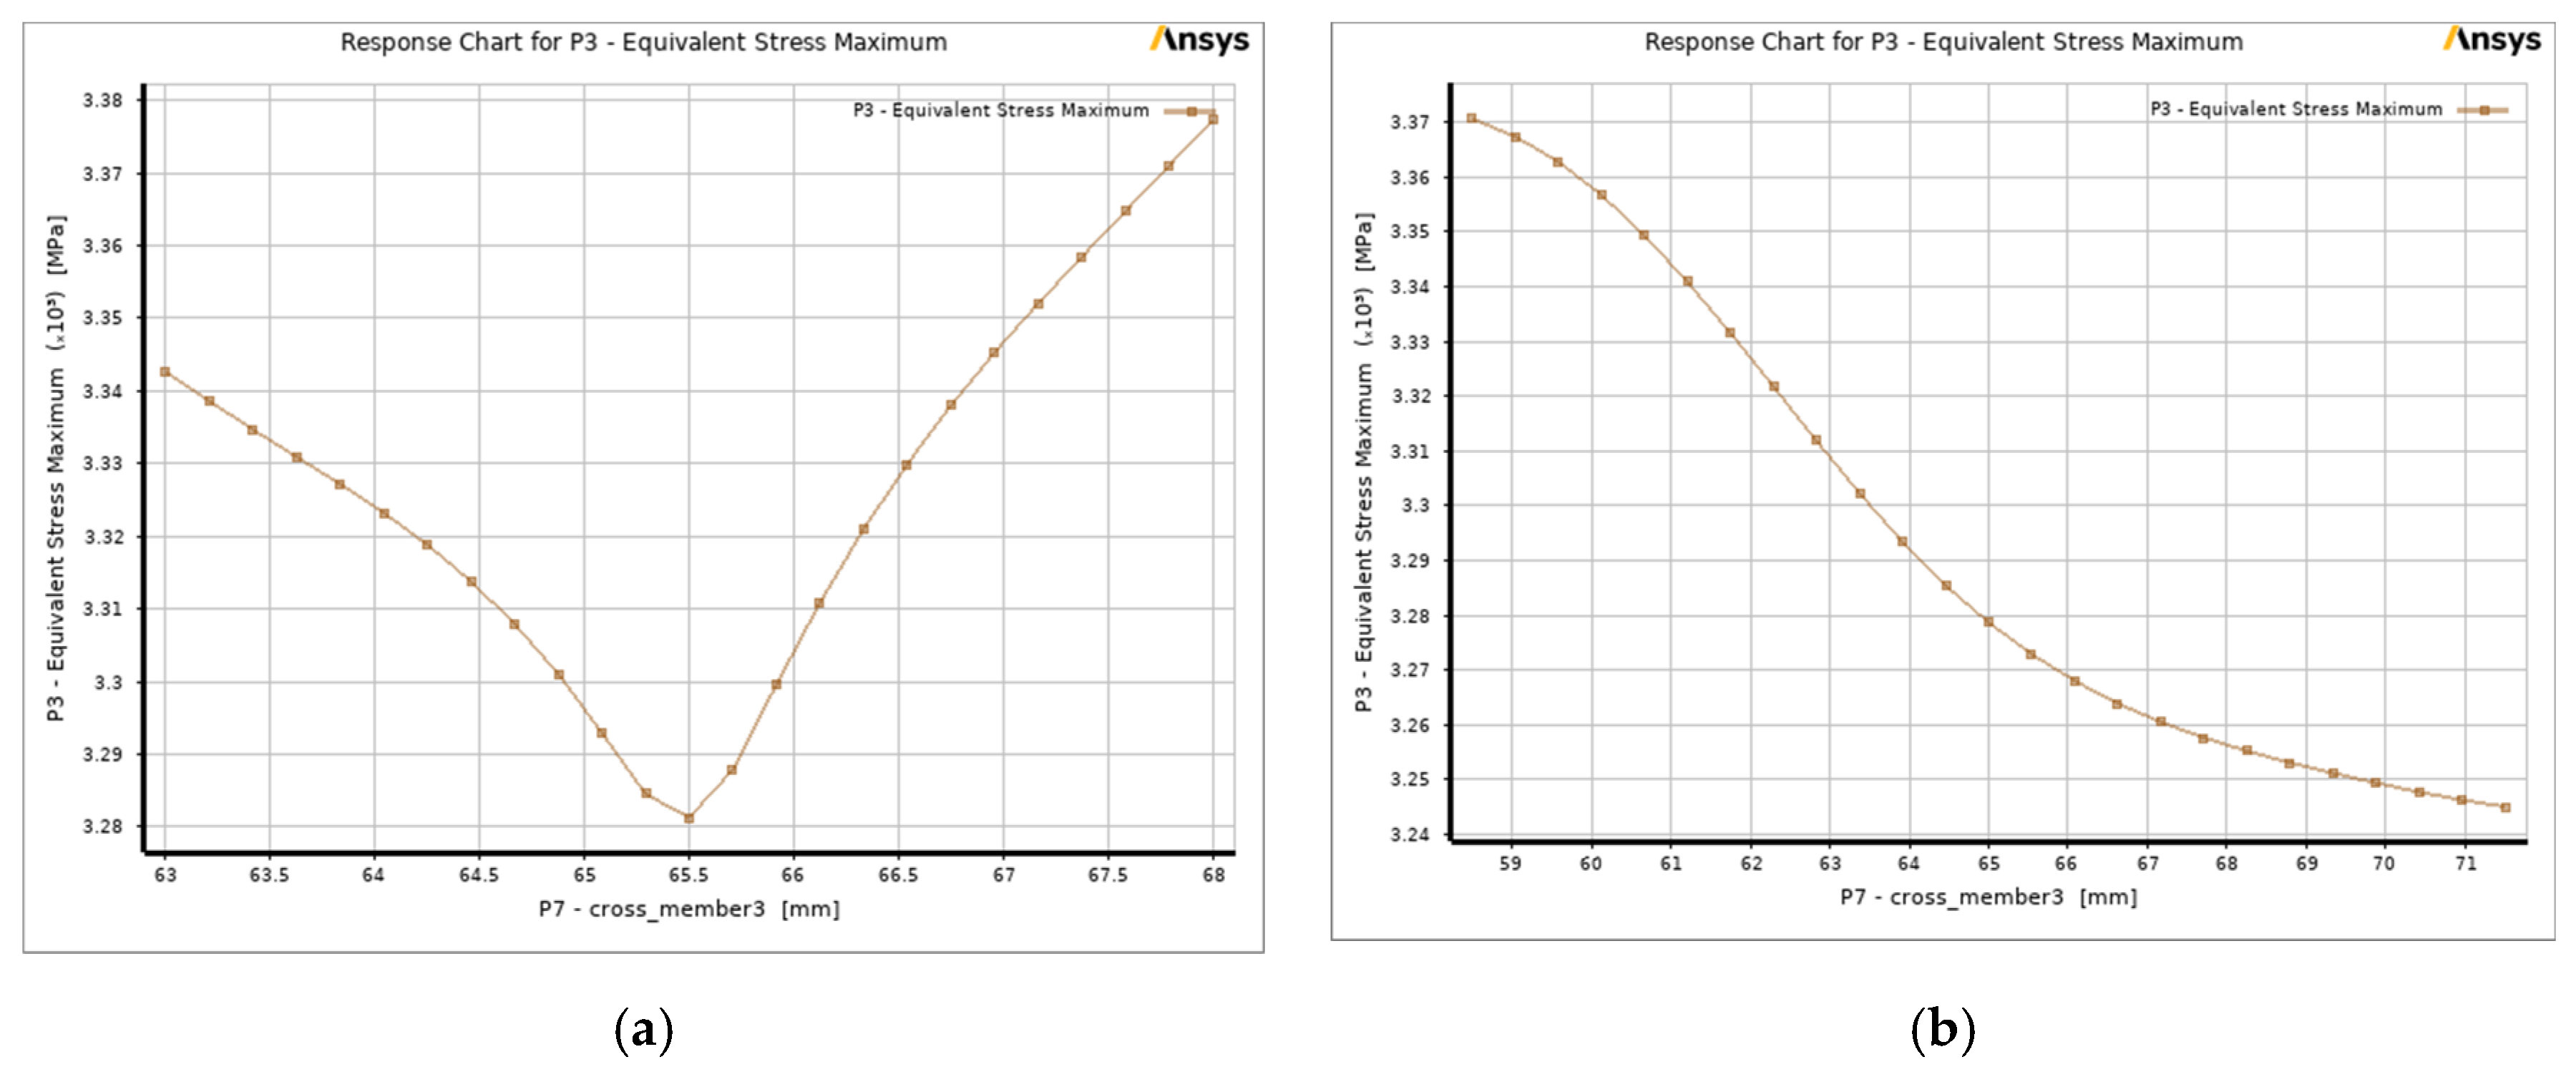
The variation of equivalent stress vs. cross member 3 is shown in Figure 11a,b. The equivalent stress, which is high initially, decreases and reaches its minimum value at a cross member 3 dimension of 65.5 mm. The equivalent stress increases linearly thereafter to reach its maximum value at a cross member 3 dimension of 68 mm, as per Figure 11a, while reaching its minimum value at a cross member 3 dimension of 71.5 mm in the second case, as per Figure 11b.
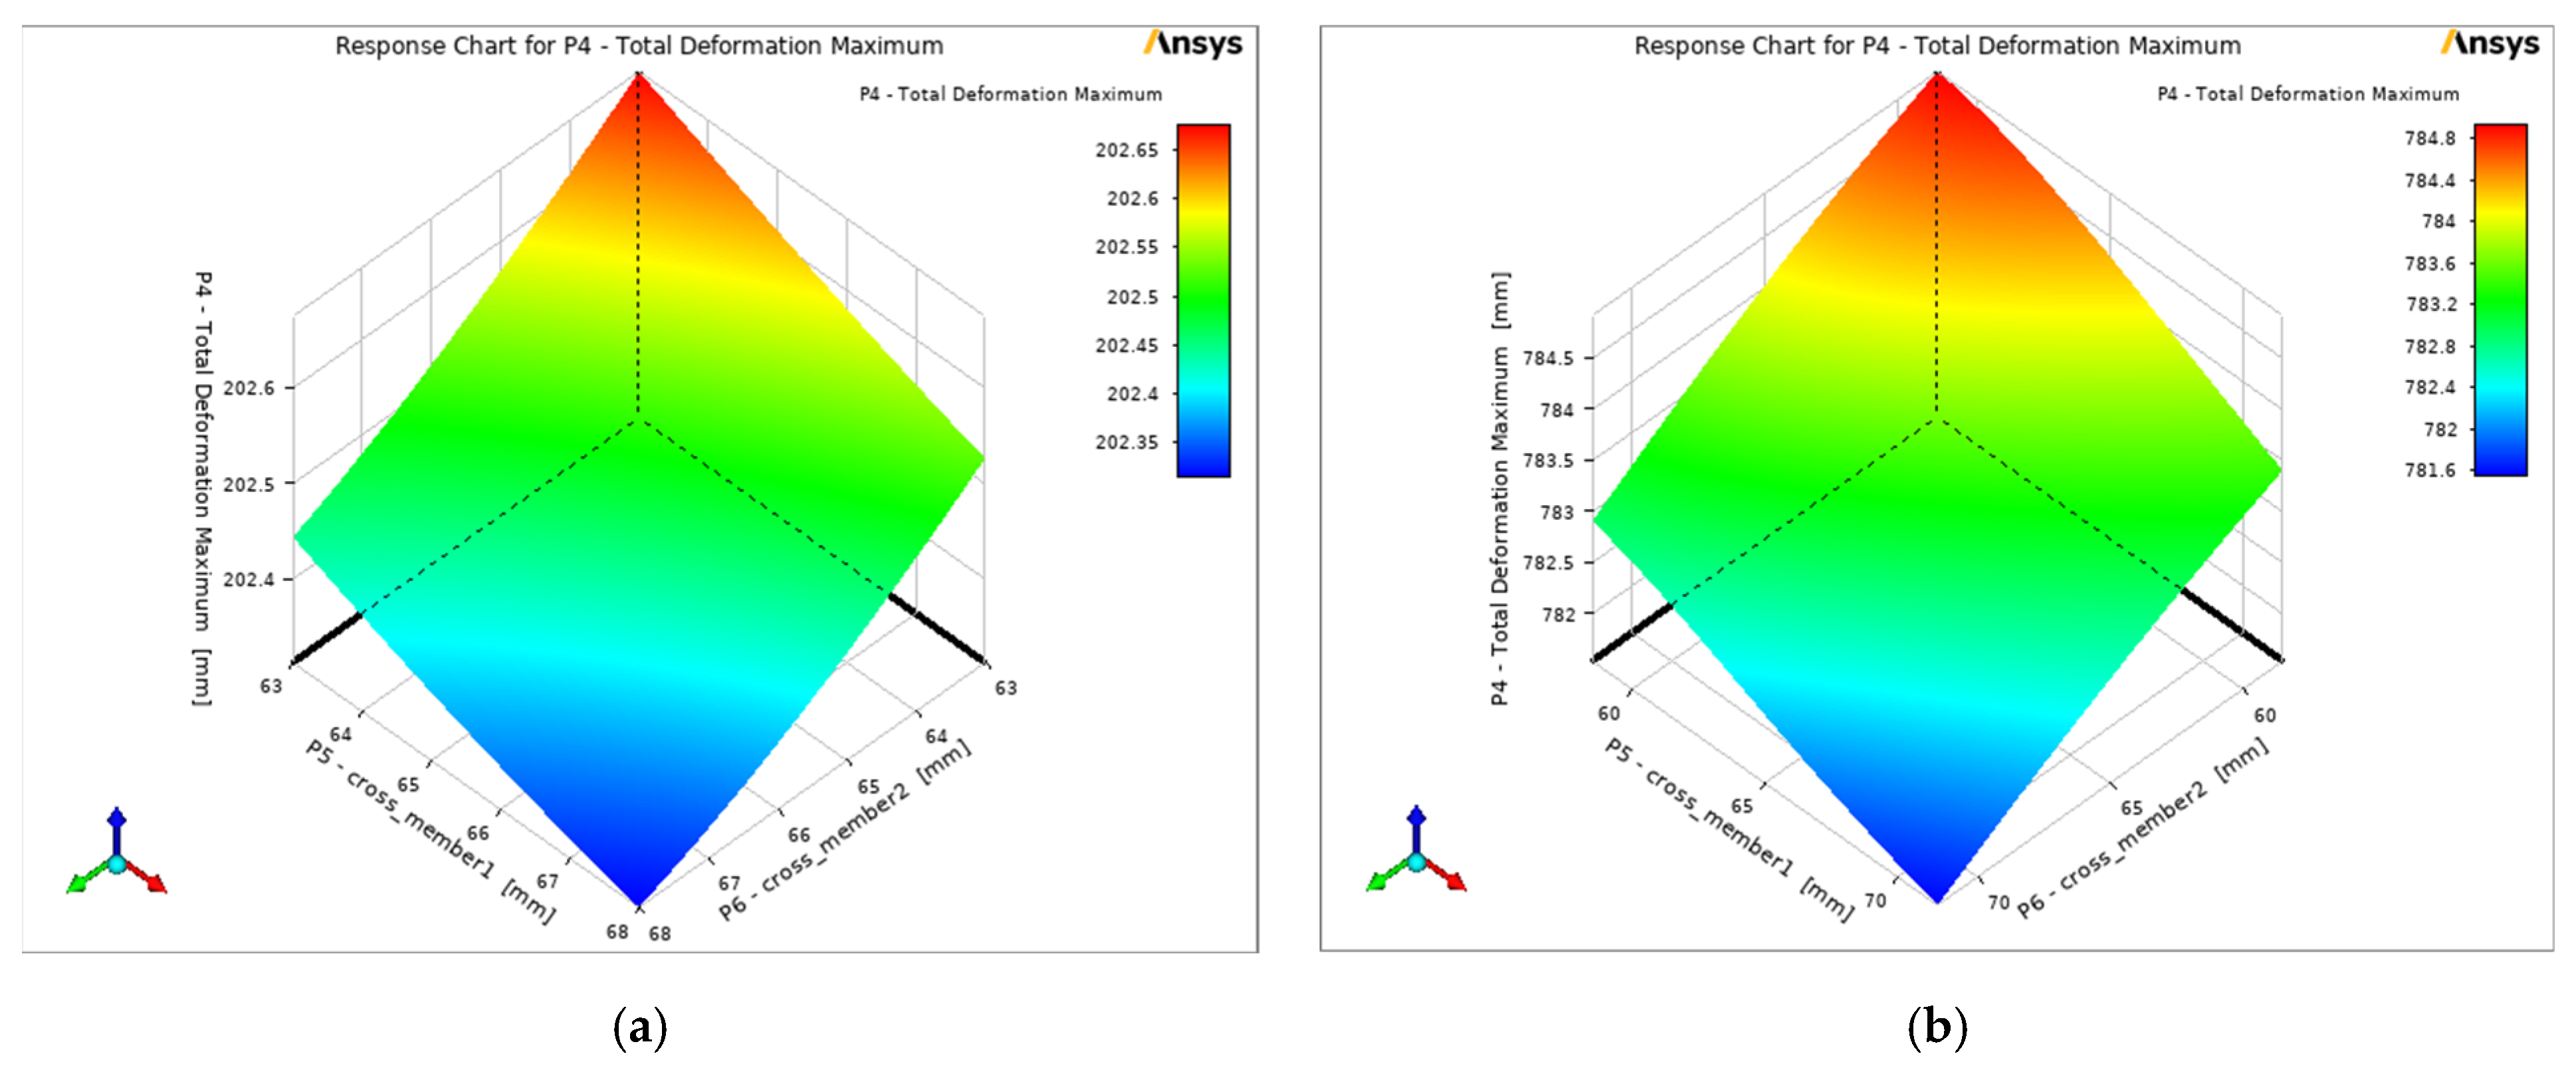
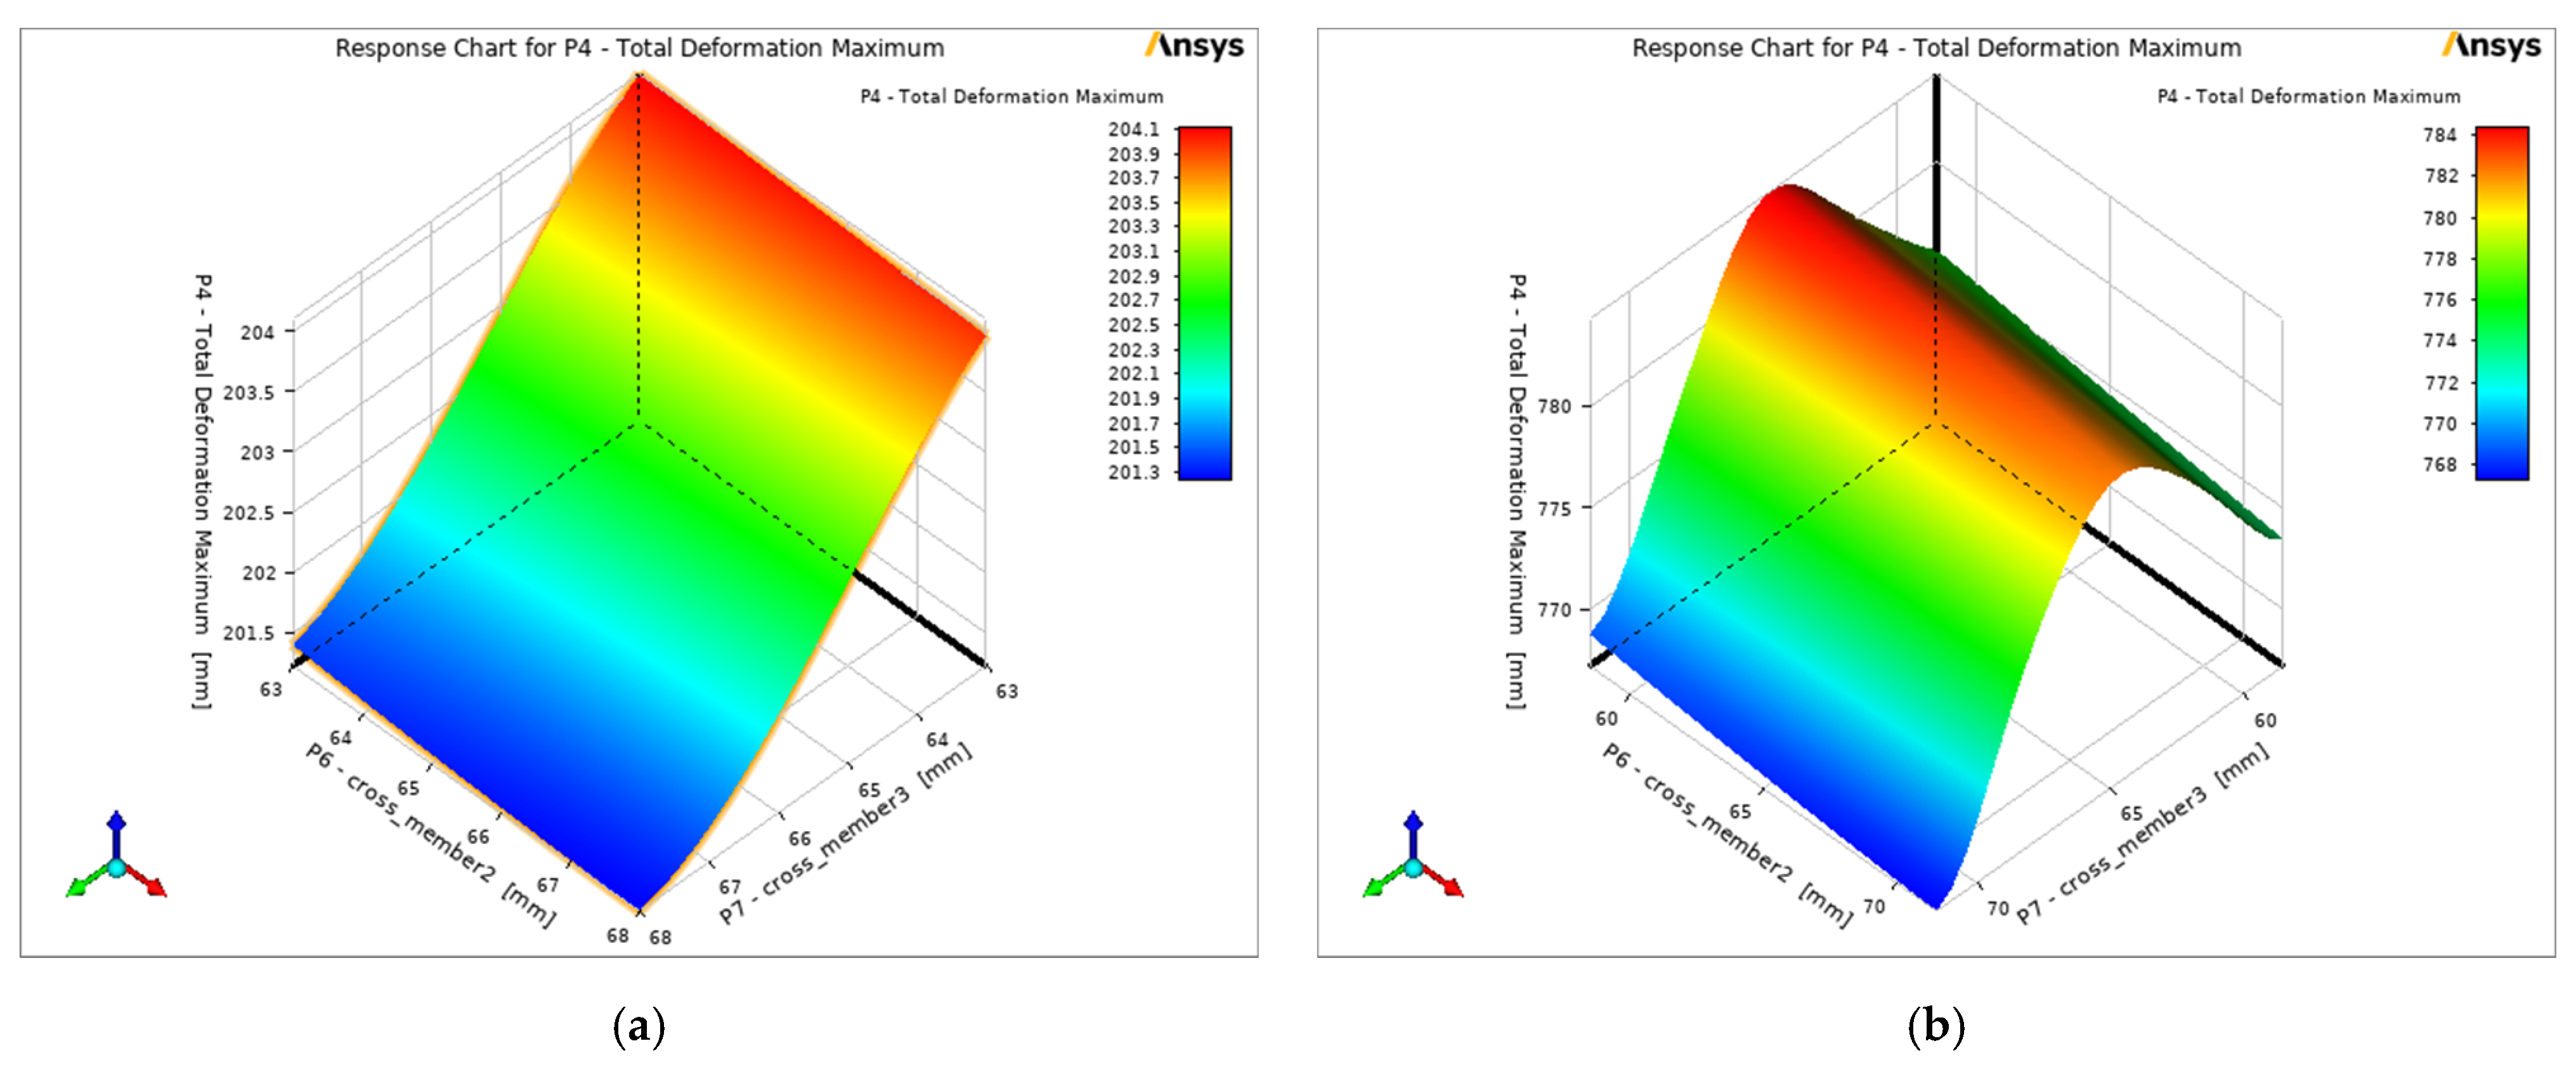
The response surface plot of deformation cross member 1 and cross member 2 is shown in Figure 12a,b. The plot in Figure 12a shows the maximum deformation for the cross member 2 dimension, ranging from 63 mm to 63.5 mm, and the cross member 1 dimension, ranging from 63 mm to 63.5 mm; in turn, in Figure 12b, the maximum deformation for the cross member 2 dimension ranges from 59 mm to 64 mm and for the cross member 1 dimension from 59 mm to 66 mm. For other dimensions, the deformation shows minimum values, as represented by blue-coloured zone.
The variation in deformation vs. cross member 2 and cross member 3 is shown in Figure 13a,b. The deformation is observed to be maximum for the cross member 3 dimension, ranging from 63 mm to 64 mm, and the cross member 2 dimension, ranging from 63 mm to 68 mm, in Figure 13b; in turn, the deformation is observed to be maximum for the cross member 3 dimension, ranging from 62 mm to 66 mm, and the cross member 2 dimension, ranging from 59 mm to 71 mm.
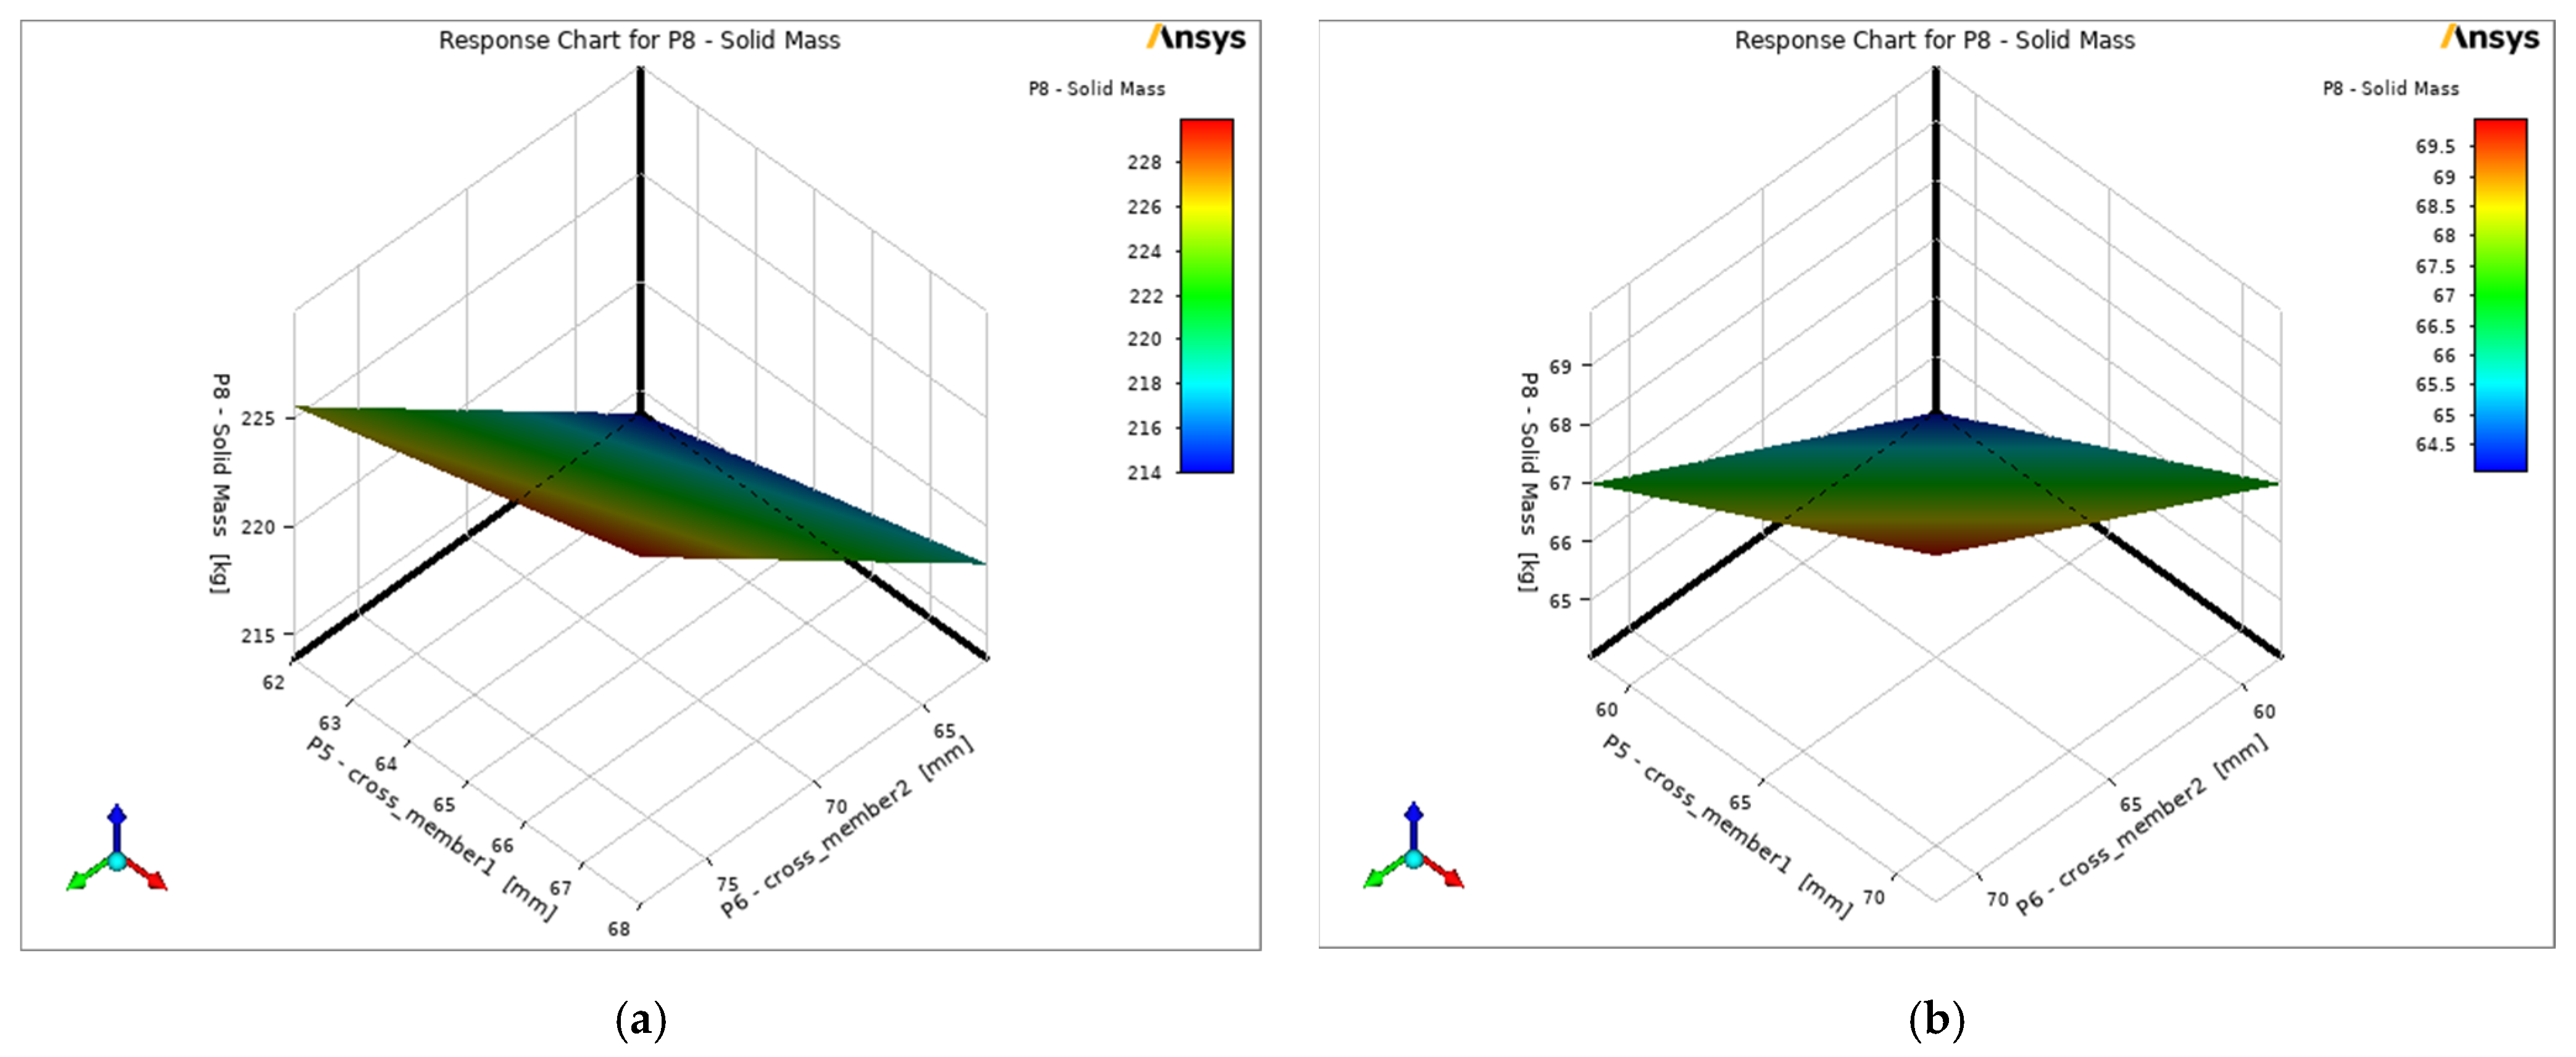
The variation in mass vs. cross member 1 and cross member 2 is shown in Figure 14a,b. The plot in Figure 14a shows the maximum solid mass for the cross member 1 dimension, ranging from 67 mm to 68 mm, and the cross member 2 dimension, ranging from 67 mm and 68 mm. The mass is minimum for the cross member 1 and cross member 2 dimension, ranging from 63 mm to 64 mm. The plot in Figure 14b shows the maximum solid mass for the cross member 1 dimension, ranging from 67 mm to 71 mm, and cross member 2 dimension, ranging from 66 mm to 71 mm. The mass is minimum for the cross member 1 and cross member 2 dimension, ranging from 59 mm to 64 mm.
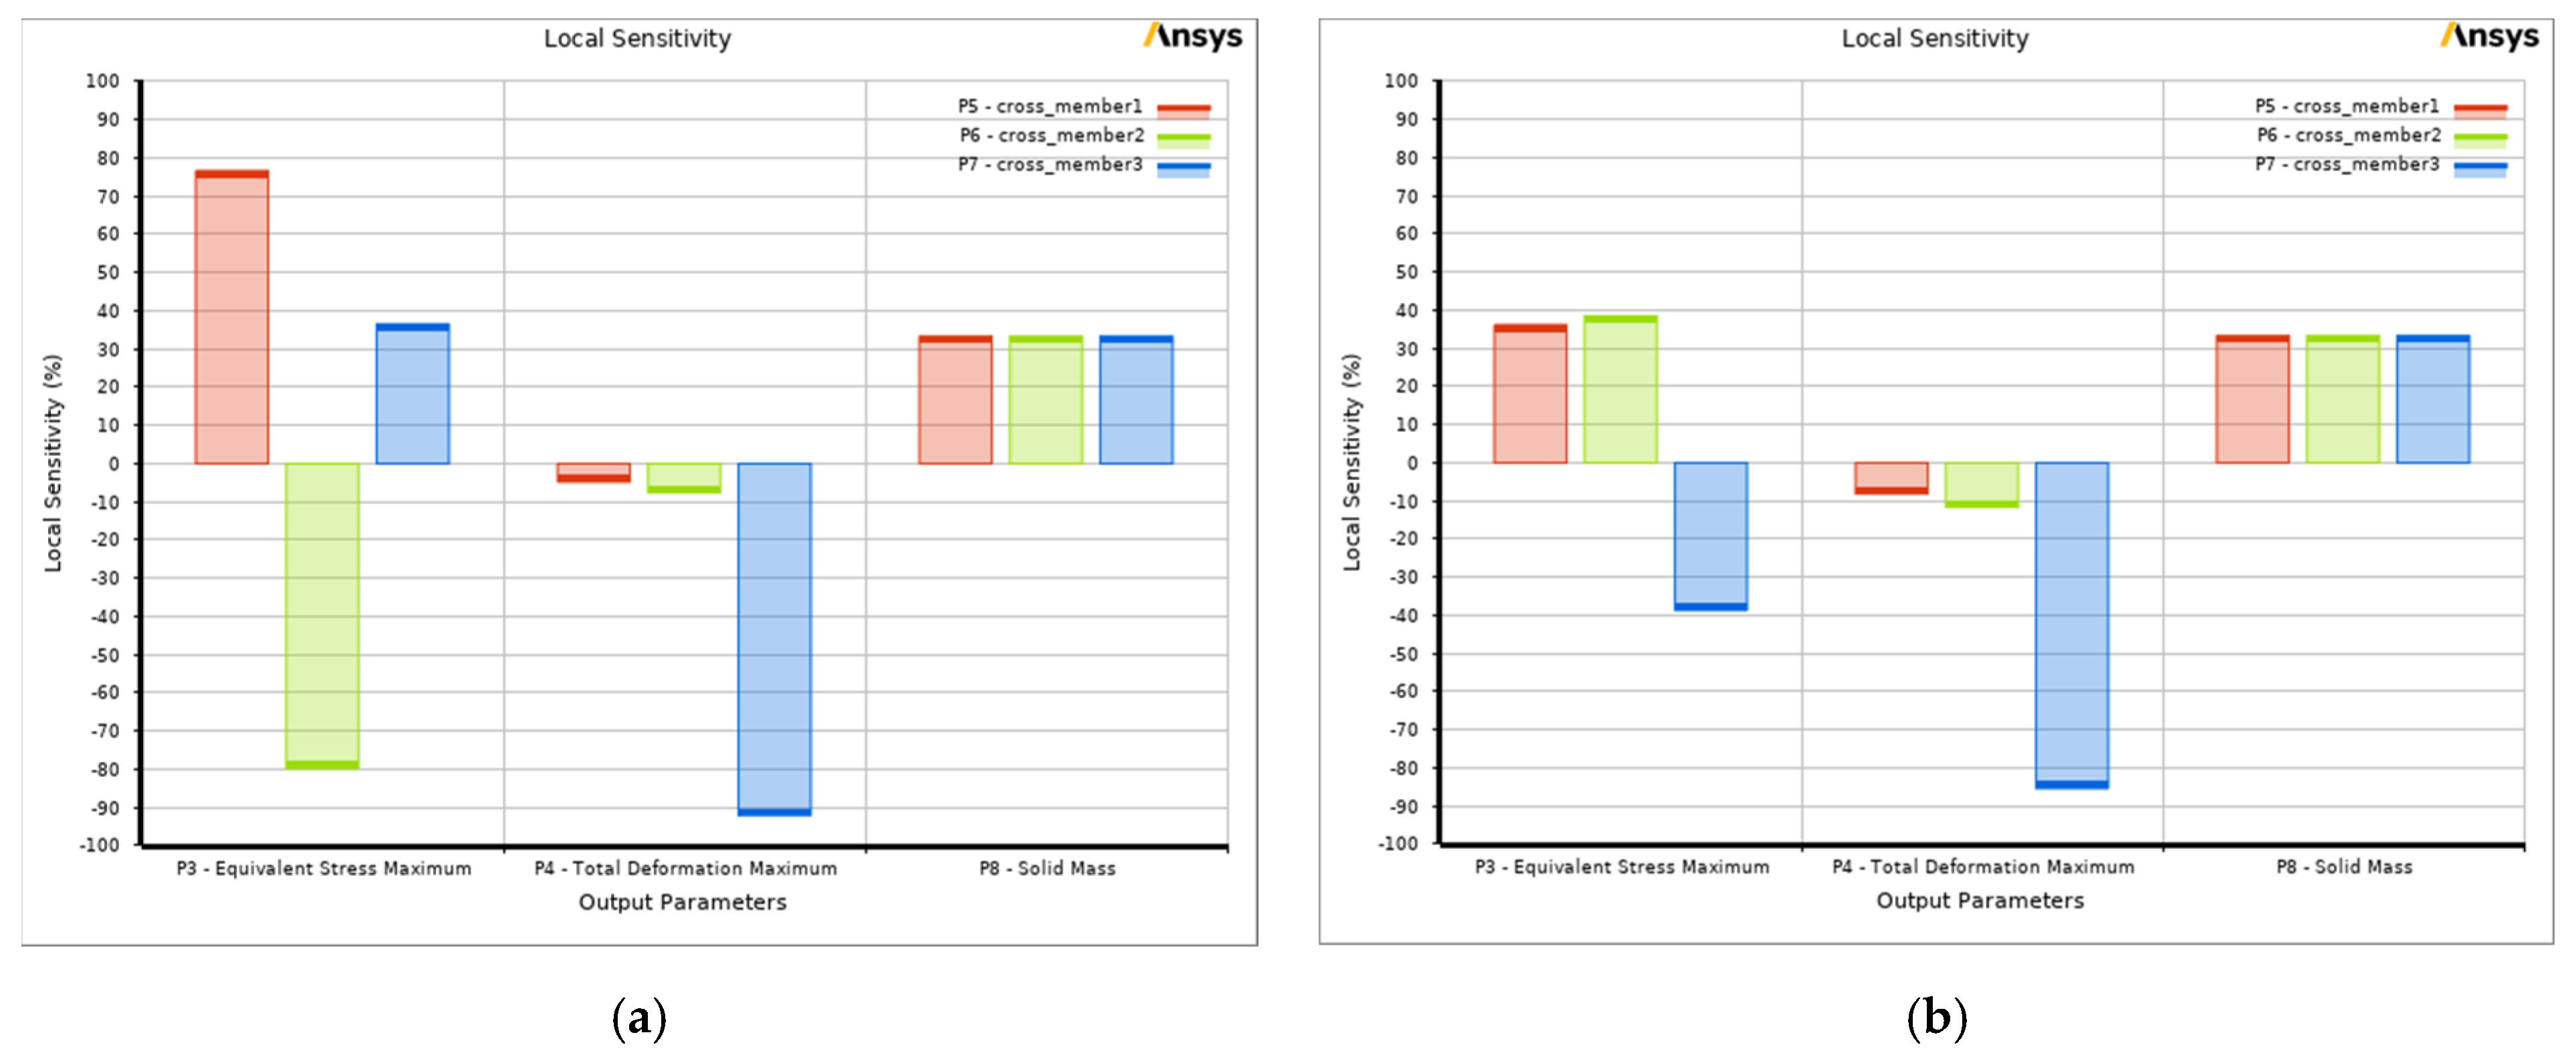
A sensitivity plot was generated for all three output parameters, namely, equivalent stress, deformation and solid mass, as shown in Figure 15a,b. As per Figure 15a, for equivalent stress, cross member 2 shows the maximum sensitivity percentage, which signifies that cross member 2 has the maximum effect on equivalent stress; cross member 3 has the minimum effect on equivalent stress.
As per Figure 15b, for equivalent stress, cross member 3 shows the maximum sensitivity percentage, which signifies that cross member 3 has the maximum effect on equivalent stress; cross member 1 has the minimum effect on equivalent stress. For total deformation, cross member 3 shows the maximum sensitivity percentage, which signifies that cross member 3 has the maximum effect on total deformation. For solid mass, all three optimization variables have the same effect on the mass of the chassis.
4. Conclusions
The static structural analysis conducted for heavy motor vehicle chassis enabled us to determine the critical regions of high stresses and deformation. The new optimized design of a chassis structure is presented using the Box–Behnken optimization scheme. The response surface plots of the different variables were generated, which enabled to determine the range of values (of variables) for which the equivalent stress deformation and mass is minimum or maximum. The weight of the chassis is affected by the width of the cross members, which was established by sensitivity plots generated using the Box–Behnken design optimization scheme.
MMCs can be a viable option for automotive components and the applicability of MMCs in a chassis structure was investigated in the current research using numerical techniques. The use of MMCs for chassis structures aided to reduce the weight of the chassis without compromising on its strength.
The most significant findings of the optimization results in case of the P100/6061 Al MMC is that cross member 2’s width has the maximum effect on equivalent stress and cross member 3’s width has the minimum effect on equivalent stress. The weight of the chassis can be reduced by nearly 68% using the aluminium P100/6061 Al MMC material. In turn, cross member 3’s width has the maximum effect on equivalent stress and cross member 1’s width has the minimum effect on equivalent stress, resulting in the weight to be reduced by nearly 70% using the aluminium Al GA 7-230 MMC. In the automotive industry, presently, no work has been done on improving the design of existing chassis using the advanced optimization techniques used in this work.
Further research can be conducted on chassis using other new materials and optimization techniques, which could provide us with better information on the effect of other design variables on equivalent stress generated on chassis under heavy loading conditions.
Author Contributions
Conceptualization, A.A. and L.M.; methodology, A.A.; software, A.A.; validation, A.A. and L.M.; formal analysis, A.A.; investigation, A.A.; resources, A.A. and L.M.; data curation, A.A. and L.M.; writing—original draft preparation, A.A.; writing—review and editing, A.A. and L.M.; visualization, A.A.; supervision, L.M.; project administration, A.A. and L.M.; funding acquisition, L.M. All authors have read and agreed to the published version of the manuscript.
Funding
This research and the APC was funded by the University of South Africa.
Institutional Review Board Statement
Not applicable.
Informed Consent Statement
Not applicable.
Data Availability Statement
Not applicable.
Conflicts of Interest
The authors declare no conflict of interest. The funders had no role in the design of the study; in the collection, analyses, or interpretation of data; in the writing of the manuscript, or in the decision to publish the results.
References
- Chandra, M.R.; Sreenivasulu, S.; Hussain, S.A. Modeling and structural analysis of heavy vehicle chassis made of polymeric composite material by three different cross sections. Int. J. Mod. Eng. Res. 2012, 2, 2594–2600. [Google Scholar]
- Kang, M.; Park, J.; Sohn, S.S.; Ahn, D.H.; Kim, H.S.; Cho, W.T.; Chin, K.G.; Lee, S. Dynamic tensile behavior of twinning-induced plasticity/low-carbon (TWIP/LC) steel clad sheets bonded by hot rolling. Mater. Sci. Eng. A 2017, 700, 387–396. [Google Scholar] [CrossRef]
- Vijayan, S.N.; Sendhilkumar, S.; Kiran Babu, K.M. Design and analysis of automotive chassis considering cross design and analysis of automotive chassis considering cross-section and material. Int. J. Curr. Res. 2015, 7, 15697–15701. [Google Scholar]
- Cavazzuti, M.; Splendi, L. Structural optimization of automotive chassis: Theory, set up, design. In Proceedings of the Problemes inverses, Controle et Optimisation de Formes, Pairs, France, 2–4 April 2012. [Google Scholar]
- Chiandussi, G.; Gaviglio, I.; Ibba, A. Topology optimisation of an automotive component without final volume constraint specification. Adv. Eng. Softw. 2004, 35, 609–617. [Google Scholar] [CrossRef]
- Pedersen, C. Crashworthiness design of transient frame structures using topology optimization. Comput. Methods Appl. Mech. Eng. 2004, 193, 653–678. [Google Scholar] [CrossRef]
- Duddeck, F. Multidisciplinary optimization of car bodies. Struct. Multidiscip. Optim. 2008, 35, 375–389. [Google Scholar] [CrossRef]
- Nalawade, K.G.; Sabu, A.; Baskar, P. Dynamic (Vibrational) and static structural analysis of ladder frame. Int. J. Eng. Trends Technol. 2014, 11, 93–98. [Google Scholar] [CrossRef]
- Sharma, A.; Kumar, P.; Jabbar, A.; Khan, M.M. Structural analysis of a heavy vehicle chassis made of different alloys by different cross sections. Int. J. Eng. Res. Technol. 2014, 3, 1778–1785. [Google Scholar]
- Singh, A.; Soni, V.; Singh, A. Structural Analysis of Ladder Chassis for Higher Strength. Available online: https://citeseerx.ist.psu.edu/viewdoc/download?doi=10.1.1.433.2230&rep=rep1&type=pdf (accessed on 28 September 2021).
- Singh, A.; Tripathi, A.; Tiwari, A.; Upadhyay, N.; Lal, S. Design and analysis of chassis frame. Int. J. Res. Eng. 2016, 3, 31–34. [Google Scholar]
- Tidke, N.; Burande, D.H. Analysis of HCV Chassis using FEA. Int. Eng. Res. J. 2017, 1–5, Special Edition PGCON-MECH-2017. Available online: http://www.ierjournal.org/pupload/mechpgcon2017/Analysis%20of%20HCV%20Chassis%20using%20FEA.pdf (accessed on 28 September 2021).
- Haag, M.G.; Haag, L.C. Chapter 7—The shooting of motor vehicles. In Shooting Incident Reconstruction, 3rd ed.; Haag, M.G., Haag, L.C., Eds.; Academic Press: San Diego, CA, USA, 2021; pp. 137–153. ISBN 978-0-12-819397-6. [Google Scholar]
- Sharma, P.K.; Parekh, N.J.; Nayak, D. Optimization and stress analysis of chassis in TATA turbo truck SE1613. Int. J. Eng. Adv. Technol. 2014, 3, 182–187. [Google Scholar]
- Dabade, U.A.; Bhedasgaonkar, R.C. Casting defect analysis using design of experiments (DoE) and computer aided casting simulation technique. Procedia CIRP 2013, 7, 616–621. [Google Scholar] [CrossRef] [Green Version]
- Hsu, W.H.; Chao, C.K.; Hsu, H.C.; Lin, J.; Hsu, C.C. Parametric study on the interface pullout strength of the vertebral body replacement cage using FEM-based Taguchi methods. Med. Eng. Phys. 2009, 31, 287–294. [Google Scholar] [CrossRef]
- De Oliveira, F.C.G.; Borges, J.A.F. Design and optimization of a space frame chassis. SAE Tech. Pap. 2008. [Google Scholar] [CrossRef]
- Rawal, S. Metal-matrix composites for space applications. Jom 2001, 53, 14–17. [Google Scholar] [CrossRef]
- Jamaati, R.; Toroghinejad, M.R.; Edris, H.; Salmani, M.R. Comparison of microparticles and nanoparticles effects on the microstructure and mechanical properties of steel-based composite and nanocomposite fabricated via accumulative roll bonding process. Mater. Des. 2014, 56, 359–367. [Google Scholar] [CrossRef]
- Wang, W.; Xu, R.; Hao, Y.; Wang, Q.; Yu, L.; Che, Q.; Cai, J.; Wang, K.; Ma, Z. Corrosion fatigue behavior of friction stir processed interstitial free steel. J. Mater. Sci. Technol. 2018, 34, 148–156. [Google Scholar] [CrossRef]
- Gao, X.; Jiang, Z.; Wei, D.; Jiao, S.; Chen, D.; Xu, J.; Zhang, X.; Gong, D. Effects of temperature and strain rate on microstructure and mechanical properties of high chromium cast iron/low carbon steel bimetal prepared by hot diffusion-compression bonding. Mater. Des. 2014, 63, 650–657. [Google Scholar] [CrossRef] [Green Version]
- Sinha, N.; Kumar, K. Optimization of volumetric composition and cross-section of carbon reinforced epoxy based polymeric composite tubes in spaceframe chassis. Mater. Today Proc. 2019, 18, 3812–3820. [Google Scholar] [CrossRef]
- Karl, U.; Kainer, U. Metal Matrix Composites: Custom-Made Materials for Automotive and Aerospace Engineering; Wiley-VCH Verlag GmbH: Weinheim, Germany, 2006; ISBN 9783527313600. [Google Scholar]
- Rohatgi, P.K.; Xiang, C.; Gupta, N. 4.11 Aqueous Corrosion of Metal Matrix Composites. In Comprehensive Composite Materials II; Beaumont, P.W.R., Zweben, C.H., Eds.; Elsevier: Oxford, UK, 2018; pp. 287–312. ISBN 978-0-08-100534-7. [Google Scholar]
- Reddy, A.C. Metal Matrix Composites—Their Properties and Applications. Available online: https://jntuhceh.ac.in/web/tutorials/faculty/1674_composites.pdf (accessed on 28 September 2021).
- Monika, S. Finite element analysis of truck chassis frame. Int. Res. J. Eng. Technol. 2015, 02, 1949–1956. [Google Scholar]
- Ait-Amir, B.; Pougnet, P.; El Hami, A. 6-Meta-Model Development. Available online: https://0-www-elsevier-com.brum.beds.ac.uk/books/embedded-mechatronic-systems-2/el-hami/978-1-78548-190-1 (accessed on 28 September 2021).
- Agarwal, A.; Molwane, O.B.; Marumo, R. Design Optimization of Knuckle Stub Using Response Surface Optimization. In Advances in Lightweight Materials and Structures; Praveen Kumar, A., Dirgantara, T., Krishna, P.V., Eds.; Springer: Singapore, 2020; pp. 155–164. ISBN 978-981-15-7827-4. [Google Scholar]
- Nardone, V.C.; Strife, J.R. Mechanical behaviour of [0, ±60]s P100/6061 Al composites. J. Mater. Sci. 1988, 23, 194–200. [Google Scholar] [CrossRef]
Figure 1.
CAD modelling of the HMV chassis.

Figure 2.
Variable assignment.

Figure 3.
Meshed model of the chassis.

Figure 4.
Assigned loads and boundary conditions.

Figure 5.
Equivalent stress generated.

Figure 6.
Total deformation plots: (a) P100/6061 Al MMC; (b) Al GA 7-230 MMC.

Figure 7.
Response surface plot of equivalent stress vs. cross member 1 and cross member 2: (a) P100/6061 Al MMC; (b) Al GA 7-230 MMC.
Figure 7.
Response surface plot of equivalent stress vs. cross member 1 and cross member 2: (a) P100/6061 Al MMC; (b) Al GA 7-230 MMC.

Figure 8.
Response surface plot of equivalent stress vs. cross member 2 and cross member 3: (a) P100/6061 Al MMC; (b) Al GA 7-230 MMC.
Figure 8.
Response surface plot of equivalent stress vs. cross member 2 and cross member 3: (a) P100/6061 Al MMC; (b) Al GA 7-230 MMC.

Figure 9.
Equivalent stress vs. cross member 1: (a) P100/6061 Al MMC; (b) Al GA 7-230 MMC.

Figure 10.
Equivalent stress vs cross_member2 (a): in case of P100/6061 Al MMC (b): in case of Al GA 7-230 MMC.
Figure 10.
Equivalent stress vs cross_member2 (a): in case of P100/6061 Al MMC (b): in case of Al GA 7-230 MMC.

Figure 11.
Equivalent stress vs. cross member 3: (a) P100/6061 Al MMC; (b) Al GA 7-230 MMC.

Figure 12.
Response surface plot of total deformation vs. cross member 1 and cross member 2: (a) P100/6061 Al MMC; (b) Al GA 7-230 MMC.
Figure 12.
Response surface plot of total deformation vs. cross member 1 and cross member 2: (a) P100/6061 Al MMC; (b) Al GA 7-230 MMC.

Figure 13.
Response surface plot of total deformation vs. cross member 2 and cross member 3: (a) P100/6061 Al MMC; (b) Al GA 7-230 MMC.
Figure 13.
Response surface plot of total deformation vs. cross member 2 and cross member 3: (a) P100/6061 Al MMC; (b) Al GA 7-230 MMC.

Figure 14.
Response surface plot of mass vs. cross member 1 and cross member 2: (a) P100/6061 Al MMC; (b) Al GA 7-230 MMC.
Figure 14.
Response surface plot of mass vs. cross member 1 and cross member 2: (a) P100/6061 Al MMC; (b) Al GA 7-230 MMC.

Figure 15.
Sensitivity plots: (a) P100/6061 Al MMC; (b) Al GA 7-230 MMC.


Table 1.
Variable definition and naming.
| Name | Value |
|---|---|
| Cross_member1 | 65 mm |
| Cross_member2 | 65 mm |
| Cross_member3 | 65 mm |
Table 2.
Material properties.
| Material Name | Density (gm/cm3) | Young’s Modulus (GPa) | Thermal Conductivity (W/m-k) |
|---|---|---|---|
| St52E | 7.8 | 200 | 60.5 |
| Al GA 7-230 [20,25] | 2.45 | 88.7 | 190 |
| P100/6061 Al [29] | 2.5 | 320 | 320 |
Table 3.
DOE table using the Box–Behnken design scheme in case of P100/6061 Al MMC.
| A | B | C | D | E | F | G |
|---|---|---|---|---|---|---|
| Name | P5—Cross-Member 1 (mm) | P6—Cross-Member 2 (mm) | P7—Cross-Member 3 (mm) | P3—Equivalent Stress Maximum (MPa) | P4—Total Deformation Max. (mm) | P8—Solid Mass (kg) |
| P5 | P6 | P7 | P3 | P4 | P8 | |
| 1 | 65.5 | 65.5 | 65.5 | 3270.478 | 202.466738 | 68.7045384 |
| 2 | 63 | 63 | 65.5 | 3499.406 | 202.67538 | 67.5464884 |
| 3 | 68 | 63 | 65.5 | 3472.204 | 202.526488 | 68.7045384 |
| 4 | 63 | 68 | 65.5 | 3464.303 | 202.444037 | 68.7045384 |
| 5 | 68 | 68 | 65.5 | 3473.26 | 202.312705 | 69.8625884 |
| 6 | 63 | 65.5 | 63 | 3275.898 | 204.139412 | 67.5464884 |
| 7 | 68 | 65.5 | 63 | 3490.198 | 203.892985 | 68.7045384 |
| 8 | 63 | 65.5 | 68 | 3451.131 | 201.360615 | 68.7045384 |
| 9 | 68 | 65.5 | 68 | 3512.722 | 201.283343 | 69.8625884 |
| 10 | 65.5 | 63 | 63 | 3517.039 | 204.106203 | 67.5464884 |
| 11 | 65.5 | 68 | 63 | 3359.961 | 203.972406 | 68.7045384 |
| 12 | 65.5 | 63 | 68 | 3502.709 | 201.402274 | 68.7045384 |
| 13 | 65.5 | 68 | 68 | 3353.099 | 201.228573 | 69.8625884 |
Table 4.
DOE table using the Box–Behnken design scheme in case of Al GA 7-230 MMC.
| Name | P5—Cross-Member 1 (mm) | P6—Cross-Member 2 (mm) | P7—Cross-Member 3 (mm) | P3—Equivalent Stress Maximum (MPa) | P4—Total Deformation Max. (mm) | P8—Solid Mass (kg) |
|---|---|---|---|---|---|---|
| P5 | P6 | P7 | P3 | P4 | P8 | |
| 1 | 65 | 65 | 65 | 3277.613 | 783.3441 | 66.98998 |
| 2 | 58.5 | 58.5 | 65 | 3274.815 | 784.9496 | 64.03927 |
| 3 | 71.5 | 58.5 | 65 | 3519.975 | 783.1232 | 66.98998 |
| 4 | 58.5 | 71.5 | 65 | 3521.078 | 783.1772 | 66.98998 |
| 5 | 71.5 | 71.5 | 65 | 3505.584 | 781.5273 | 69.94069 |
| 6 | 58.5 | 65 | 58.5 | 3499.14 | 773.6743 | 64.03927 |
| 7 | 71.5 | 65 | 58.5 | 3454.272 | 780.4577 | 66.98998 |
| 8 | 58.5 | 65 | 71.5 | 3220.407 | 769.2351 | 66.98998 |
| 9 | 71.5 | 65 | 71.5 | 3224.268 | 767.5724 | 69.94069 |
| 10 | 65 | 58.5 | 58.5 | 3483.746 | 775.6358 | 64.03927 |
| 11 | 65 | 71.5 | 58.5 | 3236.77 | 773.3496 | 66.98998 |
| 12 | 65 | 58.5 | 71.5 | 3288.515 | 768.7441 | 66.98998 |
| 13 | 65 | 71.5 | 71.5 | 3417.045 | 767.1379 | 69.94069 |
Table 5.
Maximum and minimum values in case of P100/6061 Al MMC.
| A | B | C | |
|---|---|---|---|
| 1 | Name | Calculated Min. | Calculated Max. |
| 2 | P3—Equivalent Stress Maximum (MPa) | 3270.5 | 3517 |
| 3 | P4—Total Deformation Maximum (mm) | 201.22 | 204.21 |
| 4 | P8—Sold Mass (Kg) | 66.967 | 70.442 |
Table 6.
Maximum and minimum values in case of Al GA 7-230 MMC.
| A | B | C | |
|---|---|---|---|
| 1 | Name | Calculated Min. | Calculated Max. |
| 2 | P3—Equivalent Stress Maximum (MPa) | 3207.3 | 3531.8 |
| 3 | P4—Total Deformation Maximum (mm) | 766.85 | 784.97 |
| 4 | P8—Sold Mass (Kg) | 62.564 | 71.416 |
Publisher’s Note: MDPI stays neutral with regard to jurisdictional claims in published maps and institutional affiliations. |
© 2022 by the authors. Licensee MDPI, Basel, Switzerland. This article is an open access article distributed under the terms and conditions of the Creative Commons Attribution (CC BY) license (https://creativecommons.org/licenses/by/4.0/).
Share and Cite
MDPI and ACS Style
Agarwal, A.; Mthembu, L. Structural Analysis and Optimization of Heavy Vehicle Chassis Using Aluminium P100/6061 Al and Al GA 7-230 MMC. Processes 2022, 10, 320. https://0-doi-org.brum.beds.ac.uk/10.3390/pr10020320
AMA Style
Agarwal A, Mthembu L. Structural Analysis and Optimization of Heavy Vehicle Chassis Using Aluminium P100/6061 Al and Al GA 7-230 MMC. Processes. 2022; 10(2):320. https://0-doi-org.brum.beds.ac.uk/10.3390/pr10020320
Chicago/Turabian StyleAgarwal, Abhishek, and Linda Mthembu. 2022. "Structural Analysis and Optimization of Heavy Vehicle Chassis Using Aluminium P100/6061 Al and Al GA 7-230 MMC" Processes 10, no. 2: 320. https://0-doi-org.brum.beds.ac.uk/10.3390/pr10020320
Note that from the first issue of 2016, this journal uses article numbers instead of page numbers. See further details here.