Article

Scaling up the Process of Catalytic Decomposition of Chlorinated Hydrocarbons with the Formation of Carbon Nanostructures

by
Chen Wang
,
Yury I. Bauman
,
Ilya V. Mishakov
,
Vladimir O. Stoyanovskii
,
Ekaterina V. Shelepova
and
Aleksey A. Vedyagin
*
Department of Materials Science and Functional Materials, Boreskov Institute of Catalysis SB RAS, 630090 Novosibirsk, Russia
*
Author to whom correspondence should be addressed.
Submission received: 23 January 2022 / Revised: 26 February 2022 / Accepted: 1 March 2022 / Published: 3 March 2022

Abstract

:
Catalytic processing of organochlorine wastes is considered an eco-friendly technology. Moreover, it allows us to obtain a value-added product—nanostructured carbon materials. However, the realization of this process is complicated by the aggressiveness of the reaction medium due to the presence of active chlorine species. The present research is focused on the characteristics of the carbon product obtained over the Ni-Pd catalyst containing 5 wt% of palladium in various quartz reactors: from a lab-scale reactor equipped with McBain balance to scaled-up reactors producing hundreds of grams. 1,2-dichloroethane was used as a model chlorine-substituted organic compound. The characterization of the materials was performed using scanning and transmission electron microscopies, Raman spectroscopy, and low-temperature nitrogen adsorption. Depending on the reactor type, the carbon yield varied from 14.0 to 24.2 g/g(cat). The resulting carbon nanofibers possess a segmented structure with disordered packaging of the graphene layers. It is shown that the carbon deposits are also different in density, structure, and morphology, depending on the type of reactor. Thus, the specific surface area changed from 405 to 262 and 286 m2/g for the products from reactor #1, #2, and #3, correspondingly. The main condition providing the growth of a fluffy carbon product is found to be its ability to grow in any direction. If the reactor walls limit the carbon growing process, the carbon product is represented by very dense fibers that can finally crack the reactor.

1. Introduction

Due to a growing world production volume of such chlorine-substituted hydrocarbons as dichloroethane, vinylidene chloride, vinyl chloride, etc., the utilization of harmful organochlorine wastes is of great importance [1]. Most of these wastes come from the production of vinyl chloride [2], which is a starting monomer for the manufacturing of polyvinyl chloride—a highly demanded material in the modern polymer industry. Thus, the production of one ton of vinyl chloride is accompanied by the appearance of nearly 50 kg of organochlorine wastes, represented by a complex mixture of chlorinated derivatives of ethane and ethylene. All these substances are xenobiotics, i.e., they are foreign to the body or to an ecological system and therefore exert highly toxic effects on living forms, including humans [3,4,5].
Most conventional utilization approaches are not applicable for chlorine-containing wastes. For instance, the open burning of chlorinated substances leads to the formation of even more hazardous compounds [6,7]. The landfill of such wastes also causes ecological disasters [8]. Therefore, the catalytic processing of chlorine-substituted organics seems to be the most prospective. In this case, two scenarios can be considered: hydrogen-assisted dechlorination with the formation of corresponding unsubstituted hydrocarbons and complete decomposition with the formation of a solid carbon product [9]. The present research deals with the second scenario. As is known, the catalytic decomposition of hydrocarbons, including chlorine-substituted ones, proceeds over iron subgroup metals via the so-called carbide cycle mechanism [10]. Among these metals, nickel possesses higher resistance to chlorination, since the formation of metal chlorides completely deactivates the catalyst. The addition of odd hydrogen into the reaction mixture allows cleaning the nickel surface from the chemisorbed chlorine species, thus stipulating the pulse regime of the catalytic process. The solid carbon product of this process is represented by carbon nanofibers (CNF) with a unique segmented structure [11,12]. It should be noted that the potential of the practical application of CNFs intensively grows every year [13,14]. In recent years, such materials have been notably attractive for application in various electrochemical processes [15,16,17,18,19,20].
Despite the high resistance of Ni to the chlorine action, pure nickel catalysts undergo deactivation caused by the formation of amorphous carbon blocking the active surface of nickel particles. Doping nickel with other metals (Cr, Co, Cu, Mo, W, Pd, Pt) results in the enhanced activity and elongated stability of Ni-based catalysts [11,21,22]. It should be emphasized that both bulk alloys and specially prepared porous alloy systems can serve as precursors of self-organizing catalysts [11,23]. In this case, the initial alloy samples undergo rapid disintegration under the action of an aggressive chlorine-containing medium. This phenomenon is well-known in the literature under the name of metal dusting (MD) [24,25]. In industry, the MD process is negatively associated with the destruction of metal reactors and pipelines [26,27,28,29]. However, in recent decades, this phenomenon has been more often considered an alternative method of catalyst preparation for CNF production [30,31]. At the same time, the chemical aggressiveness of the reaction gas mixture restricts the application of metal reactors for the target decomposition of organochlorine wastes. Therefore, all heated elements of the installations used for this purpose are usually made of quartz.
Until now, the pilot-scale utilization of chlorine-containing compounds deals with their incineration or catalytic oxidation [32,33,34,35,36]. At the same time, their gas-phase conversion into nanostructured carbon is mainly utilized at the fundamental level. Therefore, the present work aims to scale up the process of catalytic decomposition of chlorinated hydrocarbons with the formation of the nanostructured carbon product. In general, the upscaling of any process proceeds through several stages, including the detailed analysis of kinetics and thermodynamics [37,38,39]. In materials science, when the target product is obtained using the chemical vapor deposition technique, the main challenge to be solved in upscaling is to maintain the uniformity and quality of the material [40].
In the present work, 1,2-dichloroethane (DCE) was used as a representative of the mentioned class of organochlorine compounds. The Ni-Pd alloy with palladium content of 5 wt% was chosen as a catalyst providing high enough efficiency [23,41]. Three different reactor types were examined. Attention was mainly paid to the characteristics of the solid carbon product being produced. The carbon deposits were studied by scanning and transmission electron microscopies, low-temperature adsorption of nitrogen, and Raman spectroscopy.

2. Materials and Methods

2.1. Synthesis of the Ni-Pd Catalyst

An Ni-Pd alloy containing 5 wt% of palladium was synthesized by a co-precipitation technique as described elsewhere [42]. Precursor salts (K2PdCl4 and Ni(NO3)2·6H2O) were taken in a certain ratio and dissolved in deionized water (100 mL). The obtained joint solution was mixed dropwise with an aqueous solution of NaHCO3 (0.1 M) at a temperature of 70 °C and was vigorously stirred. The pH was kept within a range of 7.0–9.0 by adding the precipitator (NaHCO3). The sediment was centrifuged, washed with distilled water, and dried at 105 °C for 12 h. After the drying, the sample was treated in a hydrogen flow at 800 °C for 30 min and cooled down in a helium flow.

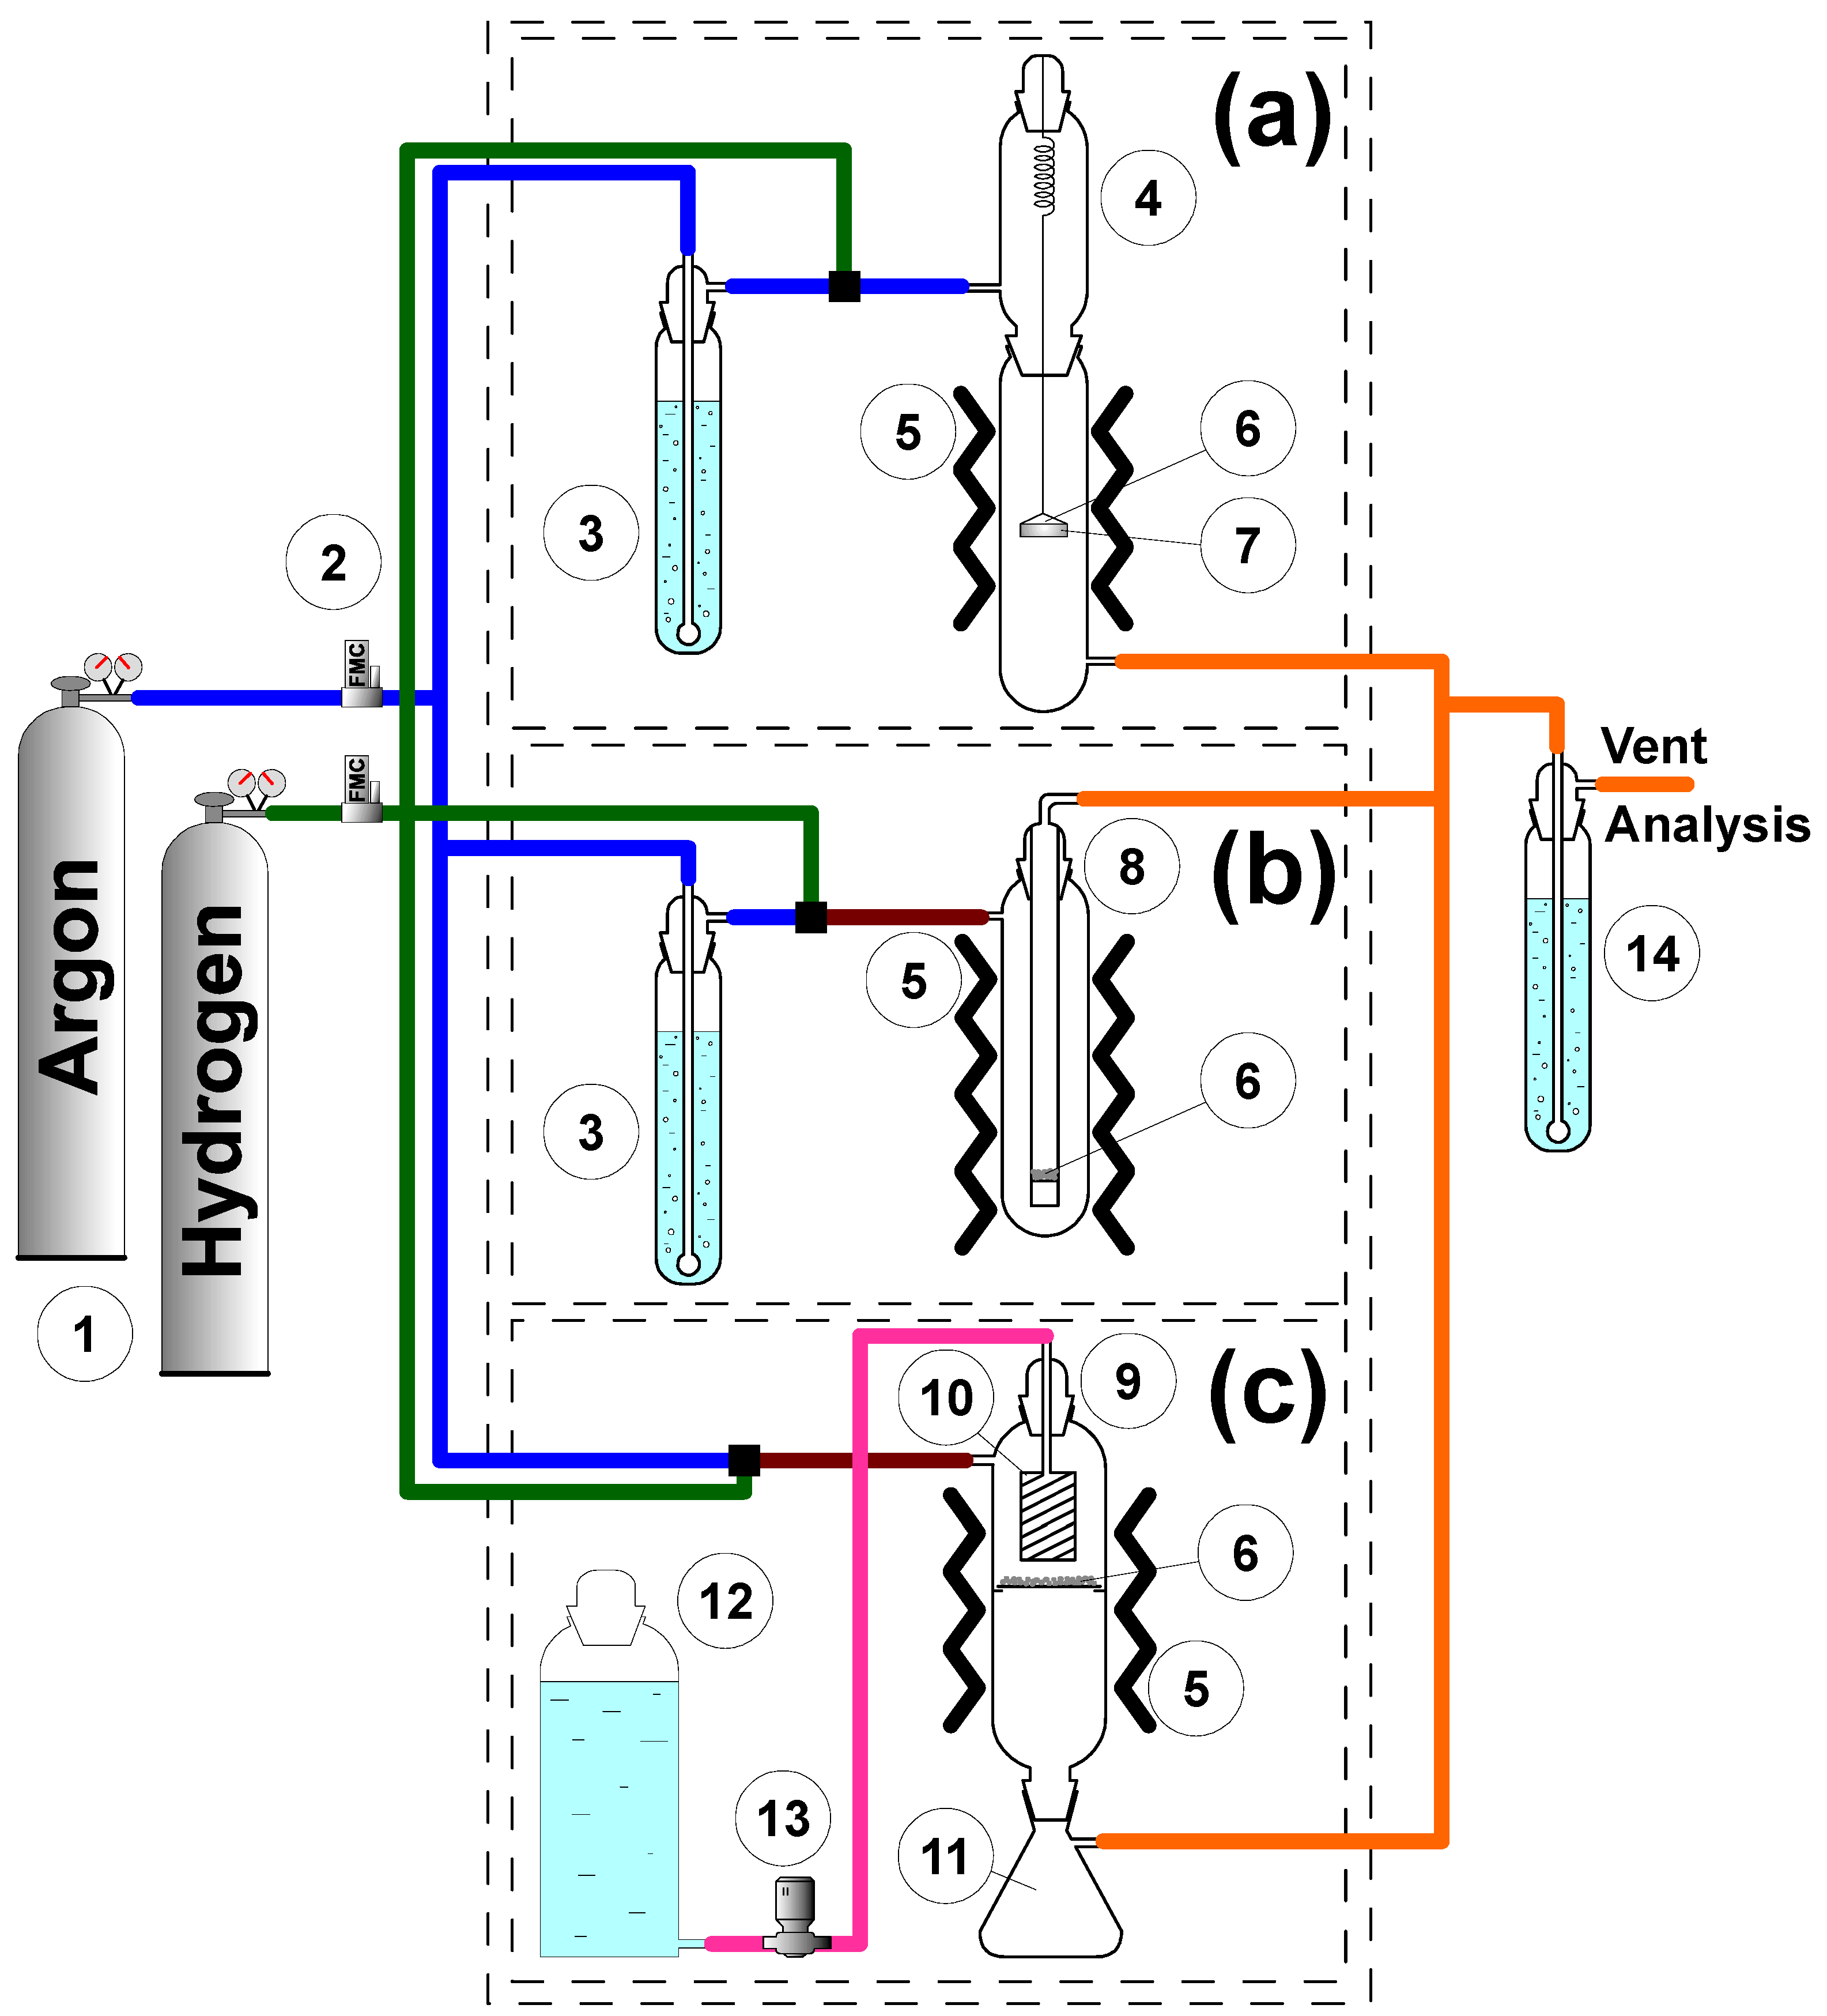
2.2. Scaling up the Catalytic Decomposition Process

The catalytic experiments were performed using 1,2-dichloroethane (DCE) as a model organochlorine compound. Three reactor types were used to study the scaling up of the DCE decomposition process. The principal schemes of the experimental installations are shown in Figure 1. In all three cases, the temperature of the process was 600 °C, and the duration was 2 h. The inlet gas flows (argon and hydrogen) were regulated using digital flow mass controllers (Figure 1, position 2). The outlet reaction mixture containing aggressive HCl vapors was passed through an alkali trap (Figure 1, position 14).
The first reactor type was a tubular quartz reactor equipped with McBain balance (Figure 1a). This lab-scale reactor allowed us to measure the weight of the sample during the experiment, thus following the kinetics of the carbon deposition process. In this case, the specimen (2 mg) of NiPd alloy was placed inside a basket made of foamed quartz (Figure 1, position 7). The basket with the sample was fixed inside the reactor within the heating zone using quartz spring and quartz thread. The coefficient of a stretch of the spring was 12.68 mm/g. The stretching of the spring was monitored using a cathetometer with an accuracy of 0.01 mm. Before the experiment, the reactor was heated to 600 °C with a ramping rate of 10 °C/min in a flow of pure argon (9 L/h). Then, the reactor was fed with hydrogen (6 L/h) to reduce the surface oxide layer. After these pretreatment procedures, an argon flow (9 L/h) was passed through the saturator with DCE (Figure 1, position 3), mixed with a hydrogen flow (6 L/h), and directed to the reactor. The obtained composition of the reaction mixture was 7.5 vol% DCE, 37.5 vol% H2, and 55 vol% Ar. Note that the reaction flow direction was downward. The sample weight was controlled every 2 min, and the time dependence of the weight gain was plotted. After 2 h, the experiment was stopped, and the reactor was cooled down to room temperature in an argon flow.
The second reactor type was a quartz tube with a quartz filter (Figure 1b). The tube was inserted into a quartz vessel with external heating elements. A specimen (100 mg) of NiPd alloy was located on the quartz filter of the reactor. All the pretreatment procedures and reaction conditions were similar to those in the previous case. In this case, the reaction flow direction was upward.
The third reactor type was an enlarged quartz tubular reactor (Figure 1c). The specimen (1 g) of NiPd alloy was placed on the quartz plate located below the evaporator. All the pretreatment procedures and reaction conditions were similar to those in the first case. The only exception was that DCE was fed into the reactor in a liquid state by the pump (Figure 1, position 13). Passing the evaporator (Figure 1, position 10), DCE vapors were mixed with argon and hydrogen flows, providing a reaction mixture composition of 7.5 vol% DCE, 37.5 vol% H2, and 55 vol% Ar. In this case, the reaction flow direction was downward. The accumulated carbon product was unloaded via a collector (Figure 1, position 11) installed at the bottom of the reactor. The unloading of the carbon product from the plate occurred spontaneously when the plate was overfilled with the deposited carbon.
In all cases, the unloaded carbon product was weighted. The carbon yield (YC) was calculated as:
Y C = m C m c a t m c a t
where mC is the carbon product weight (g), and mcat is the catalyst’s specimen (g). The bulk density was estimated as:
ϱ = V C m C
where VC is the carbon product volume (cm3).

2.3. Characterization of the Carbon Product

The secondary structure of the carbon product was investigated by scanning electron microscopy (SEM) using a JSM-6460 microscope (JEOL Ltd., Tokyo, Japan). The microscope gives magnifications in a range from ×8 to ×300,000.
The studies of the primary structure and morphology of the carbon nanomaterials were performed by transmission electron microscopy using a JEM-2010 microscope (JEOL Ltd., Tokyo, Japan), working at an accelerating voltage of 200 kV and possessing a lattice resolution of 0.14 nm. The samples were ultrasonically dispersed and deposited on the carbon support over the copper grids.
The pore volume (Vpore) and specific surface area (SSA) of the carbon product were measured by means of low-temperature nitrogen adsorption. The adsorption/desorption isotherms were obtained at 77 K using an ASAP-2400 instrument (Micromeritics, Norcross, GA, USA).
The Raman spectra were recorded using a Horiba Jobin Yvon HR800 spectrometer (Horiba Ltd., Kyoto, Japan). An Nd:YAG laser line at 532 nm was used for excitation.

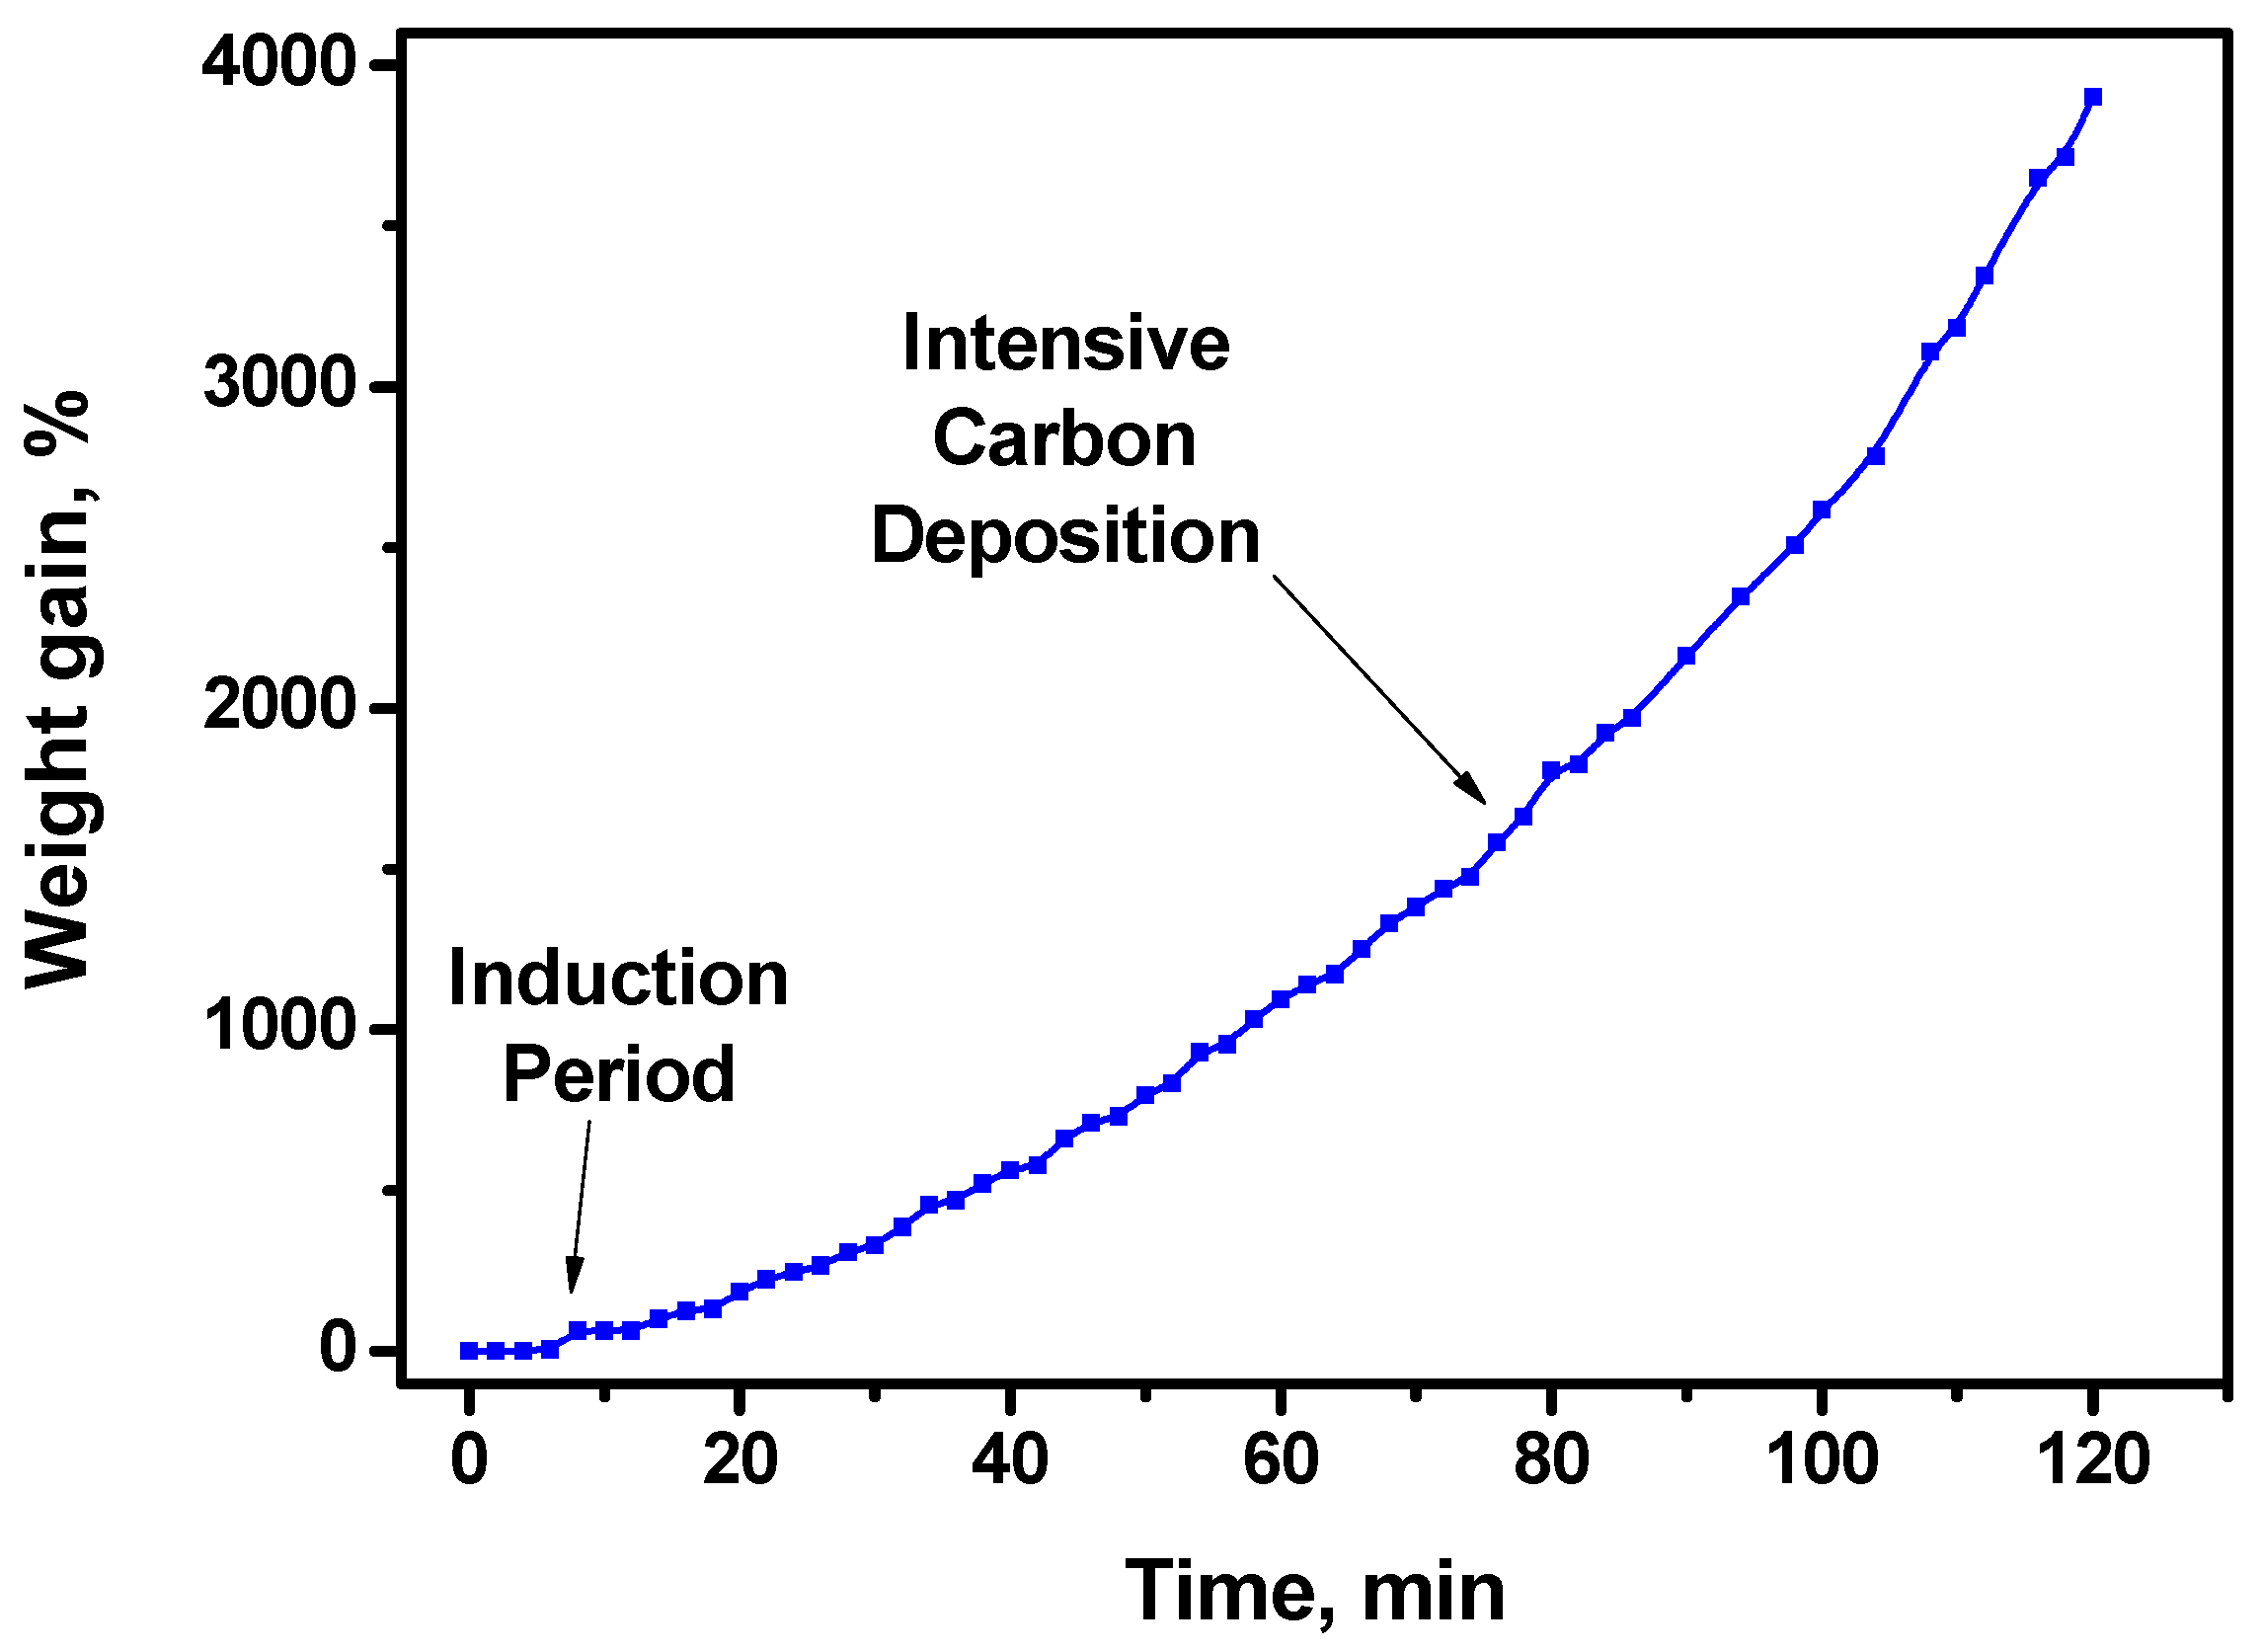
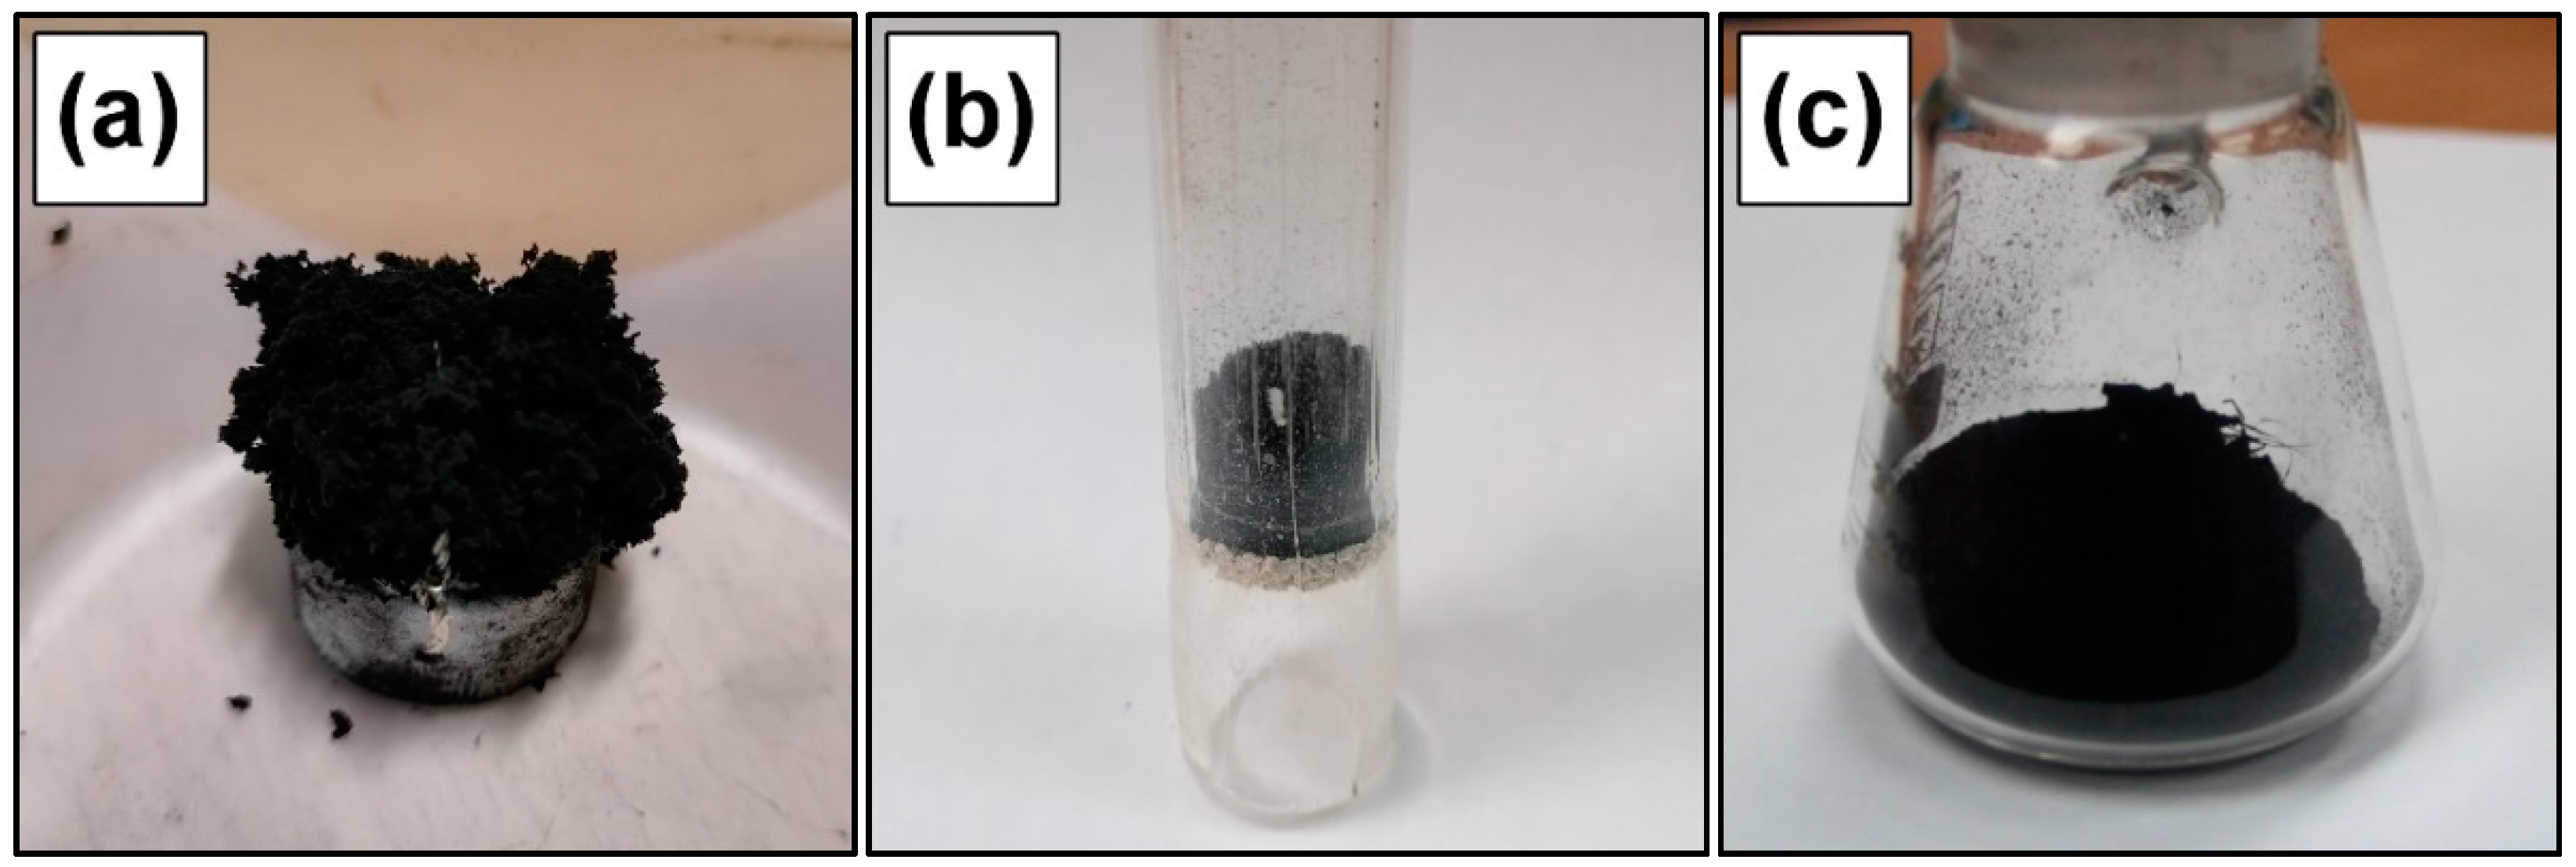
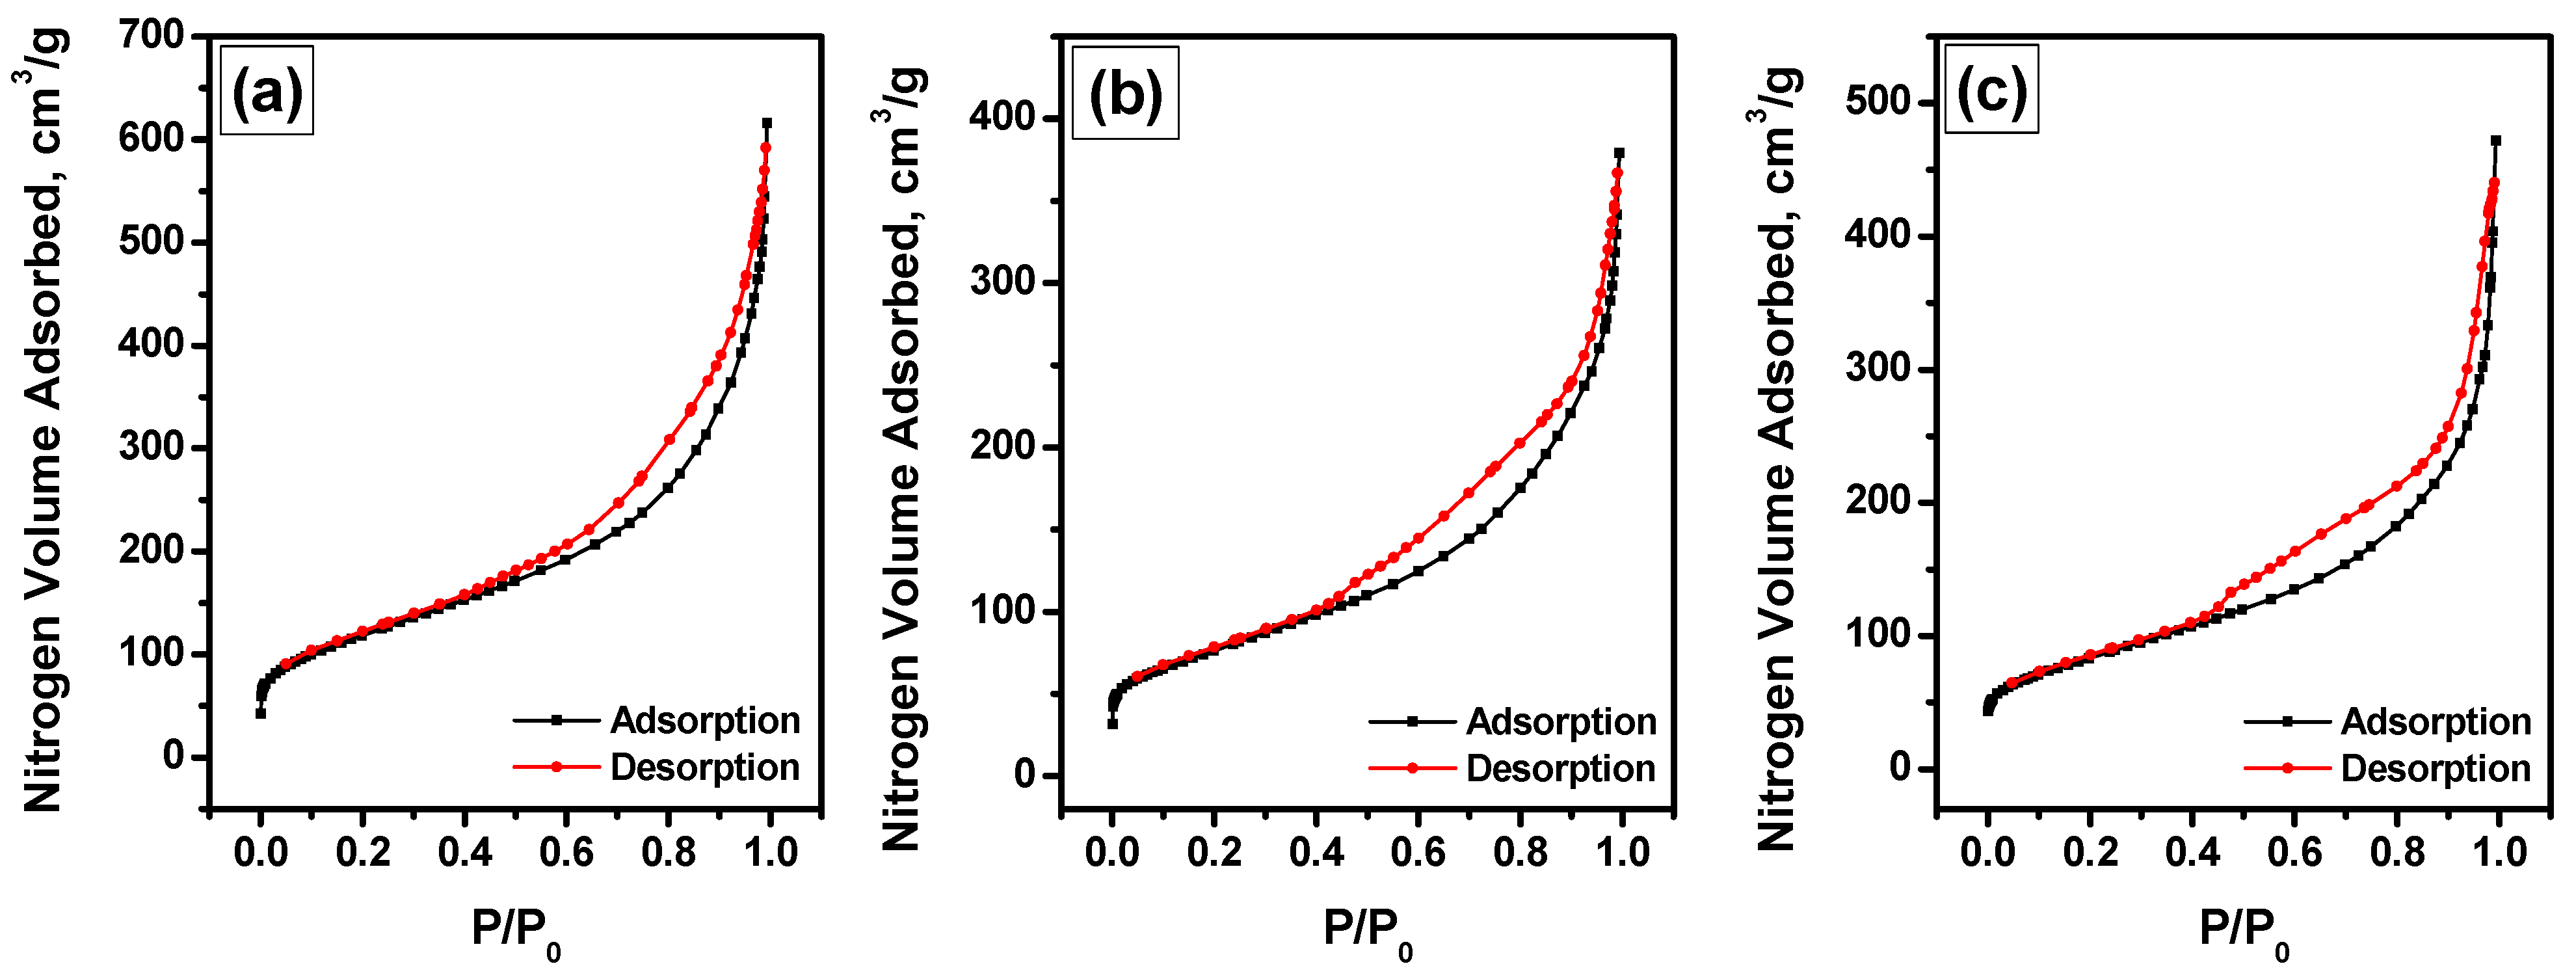
3. Results and Discussion

1,2-dichloroethane (also known as ethylene dichloride) is a colorless liquid with a boiling point of 84 °C. Therefore, in order to feed the reactor with DCE, the saturation of carrier gas with DCE vapors or direct feeding with subsequent evaporation of liquid DCE can be used.
It should also be noted that all catalytic experiments were performed at a temperature of 600 °C. Generally speaking, the reaction conditions, including the temperature, significantly affect the efficiency of the process [9,43]. At temperatures below 450 °C, the process is prevented due to the formation of nickel chloride phase on the surface of nickel particles [9]. On the contrary, at relatively high temperatures, the catalyst’s surface can be blocked by the deposition of amorphous carbon. The optimal reaction temperature was found to be 600 °C, which corresponds to the highest yield of carbon product [42].
The first reaction scheme (Figure 1a) is suitable for fundamental studies of the DCE decomposition process. The use of McBain balances installed inside the reactor allows one to monitor the sample weight during the process, thus following the kinetics of carbon deposition. In this case, DCE was fed into the reactor through the saturation route. This scheme was utilized in a number of recently published papers [9,11,21,22,23]. The main disadvantages of this scheme should be noted. First of all, only a limited amount of the catalyst (a few mg) that can be loaded inside the basket. Secondly, the experiment has a limited duration since the carbon product overfills the basket at higher carbon yield values. Finally, the efficiency of the reaction gas contact with the catalyst is estimated not to exceed 10–15%. The other part of the reaction gas flows along the reactor walls without contact with the sample inside the basket.
Figure 2 demonstrates the carbon accumulation curve recorded using reactor #1 with McBain balance. Typically, the process is characterized by the presence of an induction period when no noticeable changes in the sample weight are seen. During this period, the carbon corrosion of the metal surface, the formation of microsized domains, and the appearance of the active particles catalyzing the growth of carbon fibers take place [23,44]. In the case of chlorine-containing medium, the induction period is significantly shortened if compared with other carburizing atmospheres [24,31] and does not exceed tens of minutes. After the induction period, the stage of intensive carbon deposition goes on (Figure 2). As one can notice from the graph, the experiment was stopped after 2 h from the beginning. The quartz basket with the accumulated carbon product is shown in Figure 3a. The basket is almost overfilled with the product. The unloaded carbon sample was weighted, and the carbon yield was estimated to be 19.3 g/g (cat) (see Table 1). The bulk density of this sample was found to be 0.038 cm3/g.
In the second reactor scheme (Figure 1b), the quartz tube reactor with a quartz filter was used. The DCE-containing reaction mixture was also formed via the saturation route. The reaction gas flow goes upward through the filter and interacts with the uploaded sample. The efficiency of gas contact with the alloy particles was close to 100%, which is one of the advantages of this scheme. The second advantage is the more efficient preheating of the reaction mixture before its entrance into the reaction zone. Moreover, a large amount of the catalyst can be uploaded into the reactor, which is also a positive feature. On the other hand, the reaction volume is limited by the reactor walls. As is known, the growth of filamentous carbon proceeds in all directions. Therefore, at low gas flow rates, the carbon product growing in both the axial and radial directions halts the reactor near the filter. The gas flow rates used in the presented experiments were optimized in order to achieve the fluidized bed regime. In this case, each catalytic particle with growing carbon filaments is in motion. Such process parameters allow filling about 80% of the reactor volume. Herein, the process duration was also 2 h. Figure 3b demonstrates the reactor with the accumulated product. Despite the more efficient contact of the gas phase with the catalyst, the carbon yield was just 14.0 g/g(cat). Another feature of the obtained material is the highest bulk density—0.057 cm3/g (Table 1). Such a low carbon yield can be explained by the observed compaction of the carbon product due to the realization of the fluidized bed regime. The formation of the dense carbon agglomerates complicates the diffusion of the reaction gas to the active metal particles.
The third reactor scheme is the next step in scaling up the process. Herein, DCE in a liquid state was fed into the evaporator installed directly inside the reactor above the main reaction zone. Note that the close location of the evaporator to the plate with the catalyst also provides nearly 100% efficiency of their contact. The reaction mixture flows in the downward direction. The use of the quartz plate to hold the sample eliminates the limitation effects of the reactor walls. The carbon product overfilling the plate falls down to the collector at the bottom of the reactor. The collector with the carbon product is shown in Figure 3c. The carbon yield after 2 h of the experiment reaches the highest value of 24.2 g/g (cat), whereas the density is lowest (Table 1).
Table 1 also presents the low-temperature nitrogen adsorption data for all the accumulated carbon products. The product from reactor #1 possesses the highest values of SSA and pore volume. In the case of reactor #2, the SSA value diminishes by more than 1.5 times, from 405 to 262 m2/g. The pore volume also decreases by 1.6 times. These measurements correlate well with the observed changes in the bulk density. The carbon product accumulated in reactor #3 stands in the middle position between these samples, despite having the lowest density. As one can note, the textural characteristics of the nanostructured carbon product are affected by the reactor type. At the same time, Figure 4 indicates that the low-temperature nitrogen adsorption/desorption isotherms for all three carbon products are very similar to each other. In accordance with the International Union of Pure and Applied Chemistry (IUPAC) classification [45], all isotherms belong to Type IV with the H3 hysteresis loop.
The precise characterization of the three obtained carbon samples was performed by means of electron microscopy and Raman spectrometry. SEM images of the carbon products from different reactors are shown in Figure 5. In general, all the samples are represented by bunches of carbon filaments. However, at a close examination, the secondary structures of the samples are different. The CNF#1 sample (from reactor #1) looks very fluffy and is composed of thin carbon filaments (Figure 5a). The metal particles catalyzing their growth can be seen. As shown in Figure 5b, the fibers have a regular segmented structure. One active metal particle can catalyze the simultaneous growth of a few fibers in various directions. On the contrary, the CNF#2 sample consists of dense lumps composed of carbon filaments (Figure 5c). The fibers are compact and well-shaped (Figure 5d). No segmented structuring is observed in this case. The third carbon product (sample CNF#3) is represented by the thinned bundles of carbon fibers (Figure 5e). Each filament possesses a segmented structure, which is not as regular as in the case of sample CNF#1 (Figure 5f). Such irregularity in the structure can be connected to a pulse character of DCE evaporation. It is important to note that, in all cases, the diameters of the representative filaments are very close to each other—about 0.8 µm.
The primary structure of the carbon filaments was examined by TEM. The corresponding images are shown in Figure 6. For sample CNF#1 (Figure 6(a1–a4)), the feather-like morphology of the filaments is easily seen. The fibers can be different in size, but they are similar in the primary structure. In the case of sample CNF#2, dense and highly ordered filaments along with areas of amorphous carbon are observed (Figure 6(b1,b2)). At the same time, some non-uniformity in the density of filaments can be supposed (Figure 6(b3,b4)). The filaments of the CNF#3 sample belong to two types (Figure 6(c1–c4)). The first type is relatively large fibers with an irregular defected structure. They partly echo the fibers of the sample CNF#1. The second type is much thinner fibers with a discrete structure. Their presence explains the lower SSA value for this sample if compared with the sample CNF#1 (Table 1).
As opposed to microscopy techniques, Raman spectrometry gives average information regarding the bulk structure of carbon materials [46]. The Raman spectra for the accumulated carbon products are compared in Figure 7a–c. All the spectra exhibit the D band at ~1340 cm−1 and the G band at ~1590 cm−1. The first band is connected with a breathing mode A1g [47,48], whereas the second band corresponds to the allowed vibrations E2g of the hexagonal lattice of graphite [49].
The D2 bands at ~1614 cm−1 are close to the bands at 1620 cm−1, corresponding to the disordered graphitic lattice (surface graphene layers, E2g symmetry) [50]. The bands D3 at ~1520 cm−1 and D4 at ~1200 cm−1 are observed for all samples. These bands can be assigned to amorphous carbon and disordered graphitic lattice (A1g symmetry) or polyenes, which are typical for soot and related carbonaceous materials [51]. Their average relative intensities are ID3/G ~ 0.3 and ID4/G ~ 0.2. For the curve fitting of the second-order bands, the standard set of the bands 2D, D + D2, 2D2, and G* ~ D4+D was used. Along with this, two sets of the bands 2D and D + D2 with significantly different half-width were used for the approximation of the experimental spectra. All this can correlate with the inhomogeneity of the carbon fibers or characterize the process of their growth. The typical sizes of the cluster diameter (in-plane correlation length) La calculated in accordance with the equation ID/IG = C’ (λ)·La2 proposed by Ferrari and Robertson [48] lie in a range of 16–18 Å. The intensity ratios ID/IG and La parameters for the samples are presented in Table 1. Although the changes in this parameter are not so crucial, the samples can be ranked in the following order with regard to the defectiveness of the bulk structure: CNF#3 < CNF#2 < CNF#1. As one can see in Figure 7d, along with the changes in the ID/IG ratio, the portion of amorphous carbon in the samples (ID3/IG) is influenced by the reactor type as well.
The main process parameters are summarized in Table 2. In order to obtain the numerical data, the Reynolds numbers and the residence time values were calculated. The Reynolds number is the main parameter defining the fluid dynamic properties of the gas flow. It was calculated using the following equation:
R e = u · d v
where u is a linear velocity (m·s−1), d is a linear dimension defining the flow changes in the system (m), and v is a kinematic viscosity (m2·s−1). The value of the kinematic viscosity of argon at 600 °C of 8.7 × 10⁻⁵ m2·s−1 was used for the calculations. The tube diameter was used as the linear dimension d.
As is known, the flow regime is laminar when the Reynolds number is below the critical value. For the case of a gas flow in a cylindrical tube, the critical value is equal to 2000 [52]. Therefore, for all three cases, the flow regime is laminar.
The residence time was calculated as a ratio of the catalyst volume to the volume flow rate. The volume of the used Ni-Pd catalyst was estimated for the catalyst density ρ = 1.5 g·cm−3. The upscaling of the process increases this parameter by 50 and 500 times for reactor #2 and reactor #3, correspondingly.

4. Conclusions

Chlorinated plastics are the third-most widely produced polymer materials. Besides their direct impact on the environment, the huge amounts of organochlorine wastes from their production are accumulated in depositories without appropriate processing. The use of conventional industrial equipment for the utilization of such wastes is restricted due to their high aggressiveness. The present research aimed to make a step forward in solving this problem by scaling up the process of catalytic decomposition of chlorinated organic compounds from the current fundamental level to the semi-pilot scale. All parts of the used reactor installations were made of quartz. 1,2-dichloroethane, used as a model chlorine-containing compound, was converted into nanostructured carbon materials, which are considered a value-added product. It was demonstrated that scaling up the process noticeably affects the characteristics of the deposited carbon. An increase in the bulk density of the filamentous carbon is accompanied by a drop in the specific surface area and pore volume of the materials. The variation of the reactor scheme with the reaction volume limited by the reactor walls gives the product with worst characteristics. Contrastingly, the scheme with a quartz plate used to hold the catalyst along with the liquid feeding of DCE into the reaction zone through the evaporator gives the product close in characteristics to the carbon nanostructures produced in a lab-scale reactor. It is important to note that the pump feeding of the liquid organochlorine substrate has an additional advantage. The real organochlorine wastes are represented by a complex mixture of various chlorine-substituted compounds. The use of the saturation approach is restricted due to the difference in boiling points of these chemicals. Therefore, the gas flow will be enriched with lighter components, and the gas phase composition will vary in time. In the case of pump feeding, all the components come to the reactor simultaneously at a constant concentration. The performed research has demonstrated that the process of DCE decomposition can be scaled up, thus producing a 500-times higher amount of carbon product with appropriate structural properties.

Author Contributions

Conceptualization, A.A.V.; methodology, A.A.V., I.V.M. and Y.I.B.; investigation, C.W., Y.I.B. and V.O.S.; formal analysis, E.V.S.; writing—original draft preparation, A.A.V.; writing—review and editing, A.A.V.; funding acquisition, I.V.M. All authors have read and agreed to the published version of the manuscript.

Funding

This research was funded by the Russian Ministry of Science and Higher Education (project number AAAA-A21-121011390054-1).

Institutional Review Board Statement

Not applicable.

Informed Consent Statement

Not applicable.

Data Availability Statement

The data presented in this study are available on request from the corresponding author.

Acknowledgments

Characterization of the samples was performed using the equipment of the Center of Collective Use “National Center of Catalysts Research”.

Conflicts of Interest

The authors declare no conflict of interest. The funders had no role in the design of the study; in the collection, analyses, or interpretation of data; in the writing of the manuscript, or in the decision to publish the results.

References

  1. Treger:, Y.; Flid, M. State of the Art and Problems of Organochlorine Synthesis. In Chemistry beyond Chlorine; Springer International Publishing AG: Cham, Switzerland, 2016; pp. 533–555. [Google Scholar] [CrossRef]
  2. Garside, M. Global Production Capacity of Vinyl Chloride Monomer 2018 & 2023. Available online: https://0-www-statista-com.brum.beds.ac.uk/statistics/1063677/global-vinyl-chloride-monomer-production-capacity/ (accessed on 21 January 2022).
  3. LeBaron, M.J.; Hotchkiss, J.A.; Zhang, F.; Koehler, M.W.; Boverhof, D.R. Investigation of potential early key events and mode of action for 1,2-dichloroethane-induced mammary tumors in female rats. J. Appl. Toxicol. 2021, 41, 362–374. [Google Scholar] [CrossRef] [PubMed]
  4. Doan, T.Q.; Berntsen, H.F.; Verhaegen, S.; Ropstad, E.; Connolly, L.; Igout, A.; Muller, M.; Scippo, M.L. A mixture of persistent organic pollutants relevant for human exposure inhibits the transactivation activity of the aryl hydrocarbon receptor in vitro. Environ. Pollut. 2019, 254, 113098. [Google Scholar] [CrossRef] [PubMed] [Green Version]
  5. Nunes, L.M. Organochlorine Compounds in Beached Plastics and Marine Organisms. Front. Environ. Sci. 2022, 9, 784317. [Google Scholar] [CrossRef]
  6. Zhang, M.; Buekens, A.; Li, X. Open burning as a source of dioxins. Crit. Rev. Environ. Sci. Technol. 2017, 47, 543–620. [Google Scholar] [CrossRef]
  7. Estrellan, C.R.; Iino, F. Toxic emissions from open burning. Chemosphere 2010, 80, 193–207. [Google Scholar] [CrossRef]
  8. Li, J.; Xu, L.; Zhou, Y.; Yin, G.; Wu, Y.; Yuan, G.-L.; Du, X. Short-chain chlorinated paraffins in soils indicate landfills as local sources in the Tibetan Plateau. Chemosphere 2021, 263, 128341. [Google Scholar] [CrossRef]
  9. Mishakov, I.V.; Vedyagin, A.A.; Bauman, Y.I.; Potylitsyna, A.R.; Kadtsyna, A.S.; Chesnokov, V.V.; Nalivaiko, A.Y.; Gromov, A.A.; Buyanov, R.A. Two Scenarios of Dechlorination of the Chlorinated Hydrocarbons over Nickel-Alumina Catalyst. Catalysts 2020, 10, 1446. [Google Scholar] [CrossRef]
  10. Mishakov, I.V.; Buyanov, R.A.; Zaikovskii, V.I.; Strel’tsov, I.A.; Vedyagin, A.A. Catalytic synthesis of nanosized feathery carbon structures via the carbide cycle mechanism. Kinet. Catal. 2008, 49, 868–872. [Google Scholar] [CrossRef]
  11. Bauman, Y.I.; Rudneva, Y.V.; Mishakov, I.V.; Plyusnin, P.E.; Shubin, Y.V.; Korneev, D.V.; Stoyanovskii, V.O.; Vedyagin, A.A.; Buyanov, R.A. Effect of Mo on the catalytic activity of Ni-based self-organizing catalysts for processing of dichloroethane into segmented carbon nanomaterials. Heliyon 2019, 5, e02428. [Google Scholar] [CrossRef] [Green Version]
  12. Bauman, Y.I.; Mishakov, I.V.; Rudneva, Y.V.; Popov, A.A.; Rieder, D.; Korneev, D.V.; Serkova, A.N.; Shubin, Y.V.; Vedyagin, A.A. Catalytic synthesis of segmented carbon filaments via decomposition of chlorinated hydrocarbons on Ni-Pt alloys. Catal. Today 2020, 348, 102–110. [Google Scholar] [CrossRef]
  13. Gopinath, K.P.; Vo, D.-V.N.; Gnana Prakash, D.; Adithya Joseph, A.; Viswanathan, S.; Arun, J. Environmental applications of carbon-based materials: A review. Environ. Chem. Lett. 2020, 19, 557–582. [Google Scholar] [CrossRef]
  14. Bauman, Y.I.; Netskina, O.V.; Mukha, S.A.; Mishakov, I.V.; Shubin, Y.V.; Stoyanovskii, V.O.; Nalivaiko, A.Y.; Vedyagin, A.A.; Gromov, A.A. Adsorption of 1,2-Dichlorobenzene on a Carbon Nanomaterial Prepared by Decomposition of 1,2-Dichloroethane on Nickel Alloys. Russ. J. Appl. Chem. 2021, 93, 1873–1882. [Google Scholar] [CrossRef]
  15. Kamedulski, P.; Lukaszewicz, J.P.; Witczak, L.; Szroeder, P.; Ziolkowski, P. The Importance of Structural Factors for the Electrochemical Performance of Graphene/Carbon Nanotube/Melamine Powders towards the Catalytic Activity of Oxygen Reduction Reaction. Materials 2021, 14, 2448. [Google Scholar] [CrossRef] [PubMed]
  16. Barhoum, A.; Favre, T.; Sayegh, S.; Tanos, F.; Coy, E.; Iatsunskyi, I.; Razzouk, A.; Cretin, M.; Bechelany, M. 3D Self-Supported Nitrogen-Doped Carbon Nanofiber Electrodes Incorporated Co/CoOx Nanoparticles: Application to Dyes Degradation by Electro-Fenton-Based Process. Nanomaterials 2021, 11, 2686. [Google Scholar] [CrossRef]
  17. Sun, J.; Ge, Q.; Guo, L.; Yang, Z. Nitrogen doped carbon fibers derived from carbonization of electrospun polyacrylonitrile as efficient metal-free HER electrocatalyst. Int. J. Hydrogy Energy 2020, 45, 4035–4042. [Google Scholar] [CrossRef]
  18. Filik, H.; Avan, A.A. Review on applications of carbon nanomaterials for simultaneous electrochemical sensing of environmental contaminant dihydroxybenzene isomers. Arab. J. Chem. 2020, 13, 6092–6105. [Google Scholar] [CrossRef]
  19. Liu, J.; Ji, Y.-G.; Qiao, B.; Zhao, F.; Gao, H.; Chen, P.; An, Z.; Chen, X.; Chen, Y. N,S Co-Doped Carbon Nanofibers Derived from Bacterial Cellulose/Poly(Methylene blue) Hybrids: Efficient Electrocatalyst for Oxygen Reduction Reaction. Catalysts 2018, 8, 269. [Google Scholar] [CrossRef] [Green Version]
  20. Buan, M.E.M.; Muthuswamy, N.; Walmsley, J.C.; Chen, D.; Rønning, M. Nitrogen-doped carbon nanofibers on expanded graphite as oxygen reduction electrocatalysts. Carbon 2016, 101, 191–202. [Google Scholar] [CrossRef]
  21. Veselov, G.B.; Karnaukhov, T.M.; Bauman, Y.I.; Mishakov, I.V.; Vedyagin, A.A. Sol-Gel-Prepared Ni-Mo-Mg-O System for Catalytic Transformation of Chlorinated Organic Wastes into Nanostructured Carbon. Materials 2020, 13, 4404. [Google Scholar] [CrossRef]
  22. Bauman, Y.I.; Mishakov, I.V.; Vedyagin, A.A.; Rudnev, A.V.; Plyusnin, P.E.; Shubin, Y.V.; Buyanov, R.A. Promoting Effect of Co, Cu, Cr and Fe on Activity of Ni-Based Alloys in Catalytic Processing of Chlorinated Hydrocarbons. Top. Catal. 2016, 60, 171–177. [Google Scholar] [CrossRef]
  23. Bauman, Y.I.; Mishakov, I.V.; Rudneva, Y.V.; Plyusnin, P.E.; Shubin, Y.V.; Korneev, D.V.; Vedyagin, A.A. Formation of Active Sites of Carbon Nanofibers Growth in Self-Organizing Ni–Pd Catalyst during Hydrogen-Assisted Decomposition of 1,2-Dichloroethane. Ind. Eng. Chem. Res. 2019, 58, 685–694. [Google Scholar] [CrossRef]
  24. Wu, Q.; Zhang, J.; Young, D.J. Metal dusting behaviour of several nickel- and cobalt-base alloys in CO-H2-H2O atmosphere. Mater. Corros. 2011, 62, 521–530. [Google Scholar] [CrossRef]
  25. Grabke, H.J. Metal dusting. Mater. Corros. 2003, 54, 736–746. [Google Scholar] [CrossRef]
  26. Al-Meshari, A.; van Zyl, G.; Al-Musharraf, M. Metal Dusting of Process Gas Heater Convection Tubes. J. Fail. Anal. Preven. 2017, 17, 363–369. [Google Scholar] [CrossRef]
  27. Guo, X.; Vullum, P.E.; Venvik, H.J. Inhibition of metal dusting corrosion on Fe-based alloy by combined near surface severe plastic deformation (NS-SPD) and thermochemical treatment. Corros. Sci. 2021, 190, 109702. [Google Scholar] [CrossRef]
  28. Mathieu, S.; Le Pivaingt, L.; Ferry, O.; Vilasi, M.; Stuppfler, A.; Guichard, J.L.; Vande Put, A.; Monceau, D. Investigation of the metal dusting attack on the temperature range 500−700 °C using X-ray tomography. Corros. Sci. 2021, 192, 109863. [Google Scholar] [CrossRef]
  29. Bentria, E.T.; Akande, S.O.; Ramesh, A.; Laycock, N.; Hamer, W.; Normand, M.; Becquart, C.; Bouhali, O.; El-Mellouhi, F. Insights on the effect of water content in carburizing gas mixtures on the metal dusting corrosion of iron. Appl. Surf. Sci. 2022, 579, 152138. [Google Scholar] [CrossRef]
  30. Sridhar, D.; Omanovic, S.; Meunier, J.-L. Direct growth of carbon nanofiber forest on nickel foam without any external catalyst. Diam. Relat. Mater. 2018, 81, 70–76. [Google Scholar] [CrossRef]
  31. Romero, P.; Oro, R.; Campos, M.; Torralba, J.M.; Guzman de Villoria, R. Simultaneous synthesis of vertically aligned carbon nanotubes and amorphous carbon thin films on stainless steel. Carbon 2015, 82, 31–38. [Google Scholar] [CrossRef]
  32. Corella, J.; Toledo, J.M. Testing total oxidation catalysts for gas cleanup in waste incineration at pilot scale. Ind. Eng. Chem. Res. 2002, 41, 1171–1181. [Google Scholar] [CrossRef]
  33. Yim, S.D.; Koh, D.J.; Nam, I.S. A pilot plant study for catalytic decomposition of PCDDs/PCDFs over supported chromium oxide catalysts. Catal. Today 2002, 75, 269–276. [Google Scholar] [CrossRef]
  34. Everaert, K.; Baeyens, J. Catalytic combustion of volatile organic compounds. J. Hazard. Mater. 2004, 109, 113–139. [Google Scholar] [CrossRef] [PubMed]
  35. Yang, Y.; Yu, G.; Deng, S.B.; Wang, S.W.; Xu, Z.Z.; Huang, J.; Wang, B. Catalytic oxidation of hexachlorobenzene in simulated gas on V2O5-WO3/TiO2 catalyst. Chem. Eng. J. 2012, 192, 284–291. [Google Scholar] [CrossRef]
  36. Kajiwara, N.; Noma, Y.; Matsukami, H.; Tamiya, M.; Koyama, T.; Terai, T.; Koiwa, M.; Sakai, S. Environmentally sound destruction of hexachlorobutadiene during waste incineration in commercial- and pilot-scale rotary kilns. J. Environ. Chem. Eng. 2019, 7, 103464. [Google Scholar] [CrossRef]
  37. Rostrup-Nielsen, J. Reaction kinetics and scale-up of catalytic processes. J. Mol. Catal. A-Chem. 2000, 163, 157–162. [Google Scholar] [CrossRef]
  38. Rönnholm, M.R.; Warna, J.; Salmi, T. Scale-up of catalytic three-phase reactors from first principles. In European Symposium on Computer-Aided Process Engineering-14, 37th European Symposium of the Working Party on Computer-Aided Process Engineering; Elsevier: Amsterdam, The Netherlands, 2004; pp. 277–282. [Google Scholar]
  39. Piccinno, F.; Hischier, R.; Seeger, S.; Som, C. From laboratory to industrial scale: A scale-up framework for chemical processes in life cycle assessment studies. J. Clean. Product. 2016, 135, 1085–1097. [Google Scholar] [CrossRef]
  40. Van der Werf, C.H.M.; Hardeman, A.J.; van Veenendaal, P.A.T.T.; van Veen, M.K.; Rath, J.K.; Schropp, R.E.I. Investigation of scaling-up issues in hot-wire CVD of polycrystalline silicon. Thin Solid Film. 2003, 427, 41–45. [Google Scholar] [CrossRef]
  41. Rudneva, Y.V.; Shubin, Y.V.; Plyusnin, P.E.; Bauman, Y.I.; Mishakov, I.V.; Korenev, S.V.; Vedyagin, A.A. Preparation of highly dispersed Ni1-xPdx alloys for the decomposition of chlorinated hydrocarbons. J. Alloys Compd. 2019, 782, 716–722. [Google Scholar] [CrossRef]
  42. Bauman, Y.I.; Shorstkaya, Y.V.; Mishakov, I.V.; Plyusnin, P.E.; Shubin, Y.V.; Korneev, D.V.; Stoyanovskii, V.O.; Vedyagin, A.A. Catalytic conversion of 1,2-dichloroethane over Ni-Pd system into filamentous carbon material. Catal. Today 2017, 293, 23–32. [Google Scholar] [CrossRef]
  43. Wang, C.; Bauman, Y.; Mishakov, I.; Vedyagin, A.A. Features of the Carbon Nanofibers Growth over Ni-Pd Catalyst Depending on the Reaction Conditions. Mater. Sci. Forum 2019, 950, 144–148. [Google Scholar] [CrossRef]
  44. Mishakov, I.V.; Bauman, Y.I.; Korneev, D.V.; Vedyagin, A.A. Metal Dusting as a Route to Produce Active Catalyst for Processing Chlorinated Hydrocarbons into Carbon Nanomaterials. Top. Catal. 2013, 56, 1026–1032. [Google Scholar] [CrossRef]
  45. Sing, K.S.W. Reporting physisorption data for gas/solid systems with special reference to the determination of surface area and porosity (Recommendations 1984). Pure Appl. Chem. 1985, 57, 603–619. [Google Scholar] [CrossRef]
  46. Dresselhaus, M.S.; Dresselhaus, G.; Saito, R.; Jorio, A. Raman spectroscopy of carbon nanotubes. Phys. Rep. 2005, 409, 47–99. [Google Scholar] [CrossRef]
  47. Tuinstra, F.; Koenig, J.L. Raman Spectrum of Graphite. J. Chem. Phys. 1970, 53, 1126–1130. [Google Scholar] [CrossRef] [Green Version]
  48. Ferrari, A.C.; Robertson, J. Interpretation of Raman spectra of disordered and amorphous carbon. Phys. Rev. B 2000, 61, 14095–14107. [Google Scholar] [CrossRef] [Green Version]
  49. Nemanich, R.J.; Solin, S.A. First- and second-order Raman scattering from finite-size crystals of graphite. Phys. Rev. B 1979, 20, 392–401. [Google Scholar] [CrossRef]
  50. Wang, Y.; Alsmeyer, D.C.; McCreery, R.L. Raman spectroscopy of carbon materials: Structural basis of observed spectra. Chem. Mater. 1990, 2, 557–563. [Google Scholar] [CrossRef]
  51. Sadezky, A.; Muckenhuber, H.; Grothe, H.; Niessner, R.; Pöschl, U. Raman microspectroscopy of soot and related carbonaceous materials: Spectral analysis and structural information. Carbon 2005, 43, 1731–1742. [Google Scholar] [CrossRef]
  52. Salmi, T.O.; Mikkola, J.-P.; Warna, J.P. Chemical Reaction Engineering and Reaction Technology; CRC Press: Boca Raton, FL, USA, 2008; p. 615. [Google Scholar]
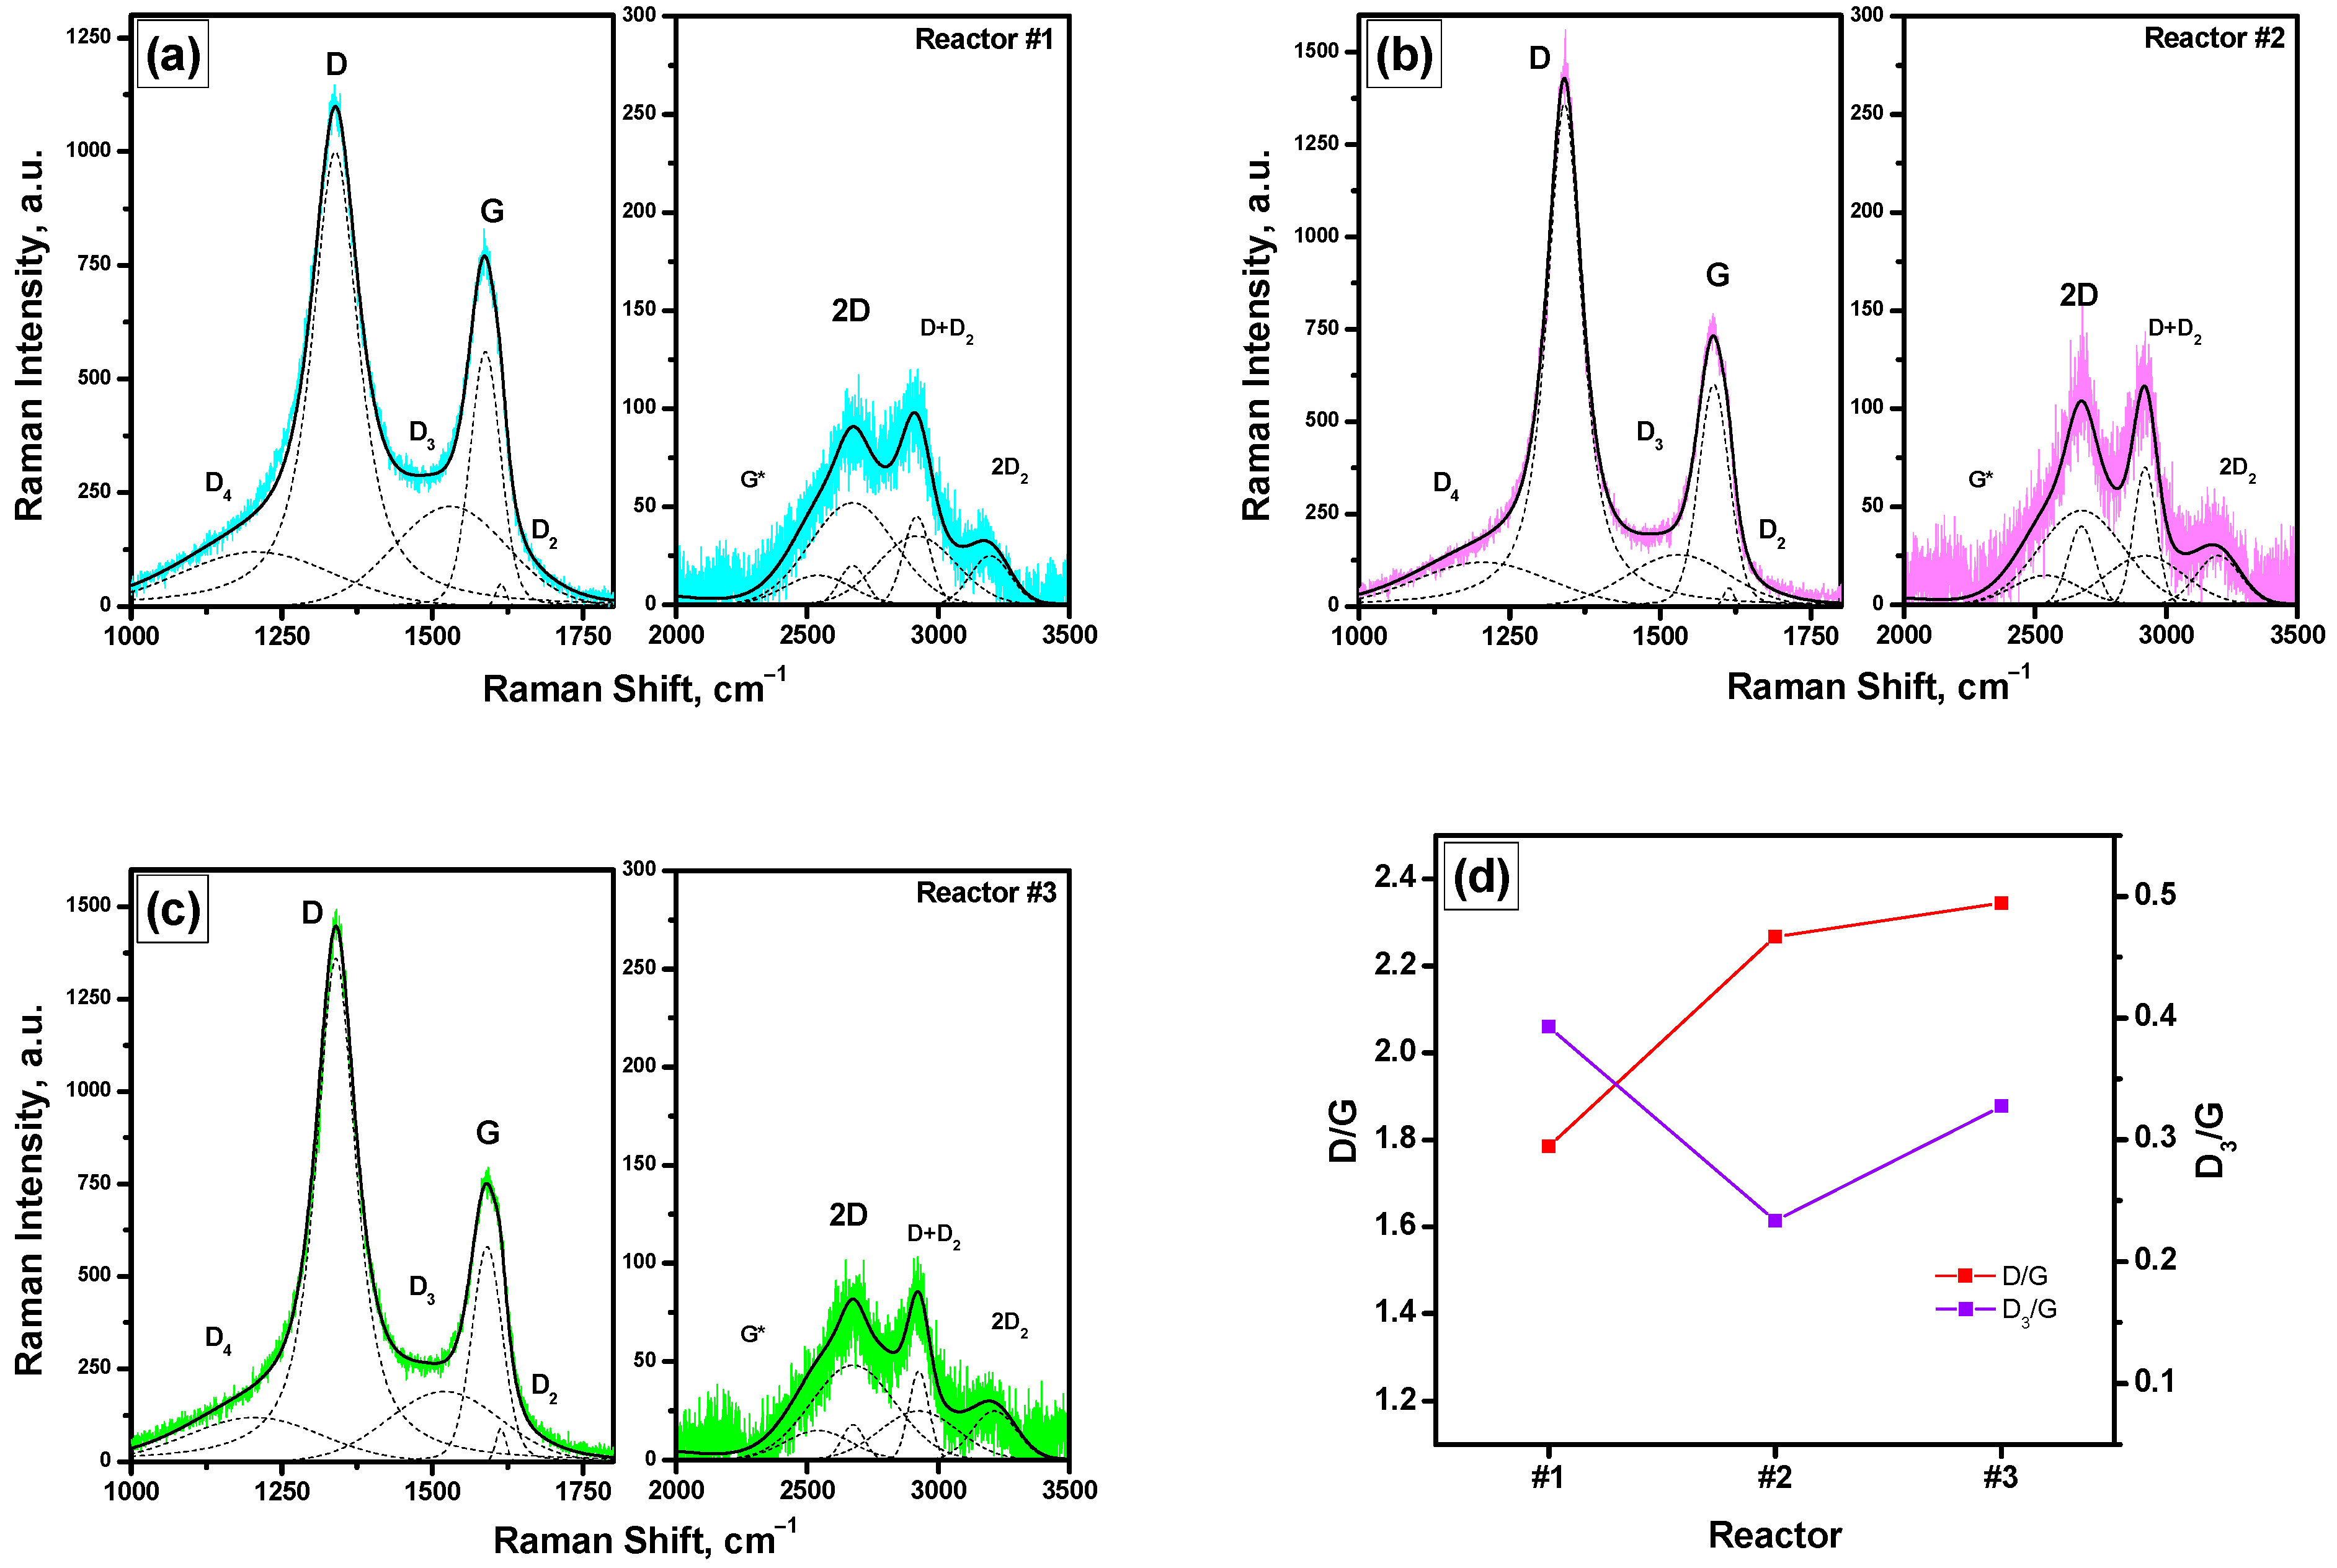
Figure 1. Principal schemes of the experimental installations equipped with reactor #1 (a), reactor #2 (b), and reactor #3 (c) and used for scaling up the process of catalytic decomposition of chlorinated hydrocarbons: 1—gas cylinders; 2—flow mass controllers; 3—saturator with DCE; 4—quartz reactor with McBain balance; 5—heating zone; 6—catalyst’s sample; 7—foamed quartz basket; 8—lab flow-through quartz reactor; 9—scaled-up quartz reactor; 10—evaporator; 11—carbon collector; 12—vessel with DCE; 13—pump; 14—alkali trap.
Processes 10 00506 g001
Figure 2. Kinetics of the carbon deposition over Ni-Pd catalyst at 600 °C for 2 h (reactor #1).
Processes 10 00506 g002
Figure 3. Photographs of the carbon products accumulated using various reactors: (a) reactor #1; (b) reactor #2; (c) reactor #3.
Processes 10 00506 g003
Figure 4. Low-temperature nitrogen adsorption/desorption isotherms of the carbon product obtained in different reactors: (a) reactor #1; (b) reactor #2; (c) reactor #3.
Processes 10 00506 g004
Figure 5. SEM images of the carbon nanostructures produced in different reactors: (a,b) reactor #1; (c,d) reactor #2; (e,f) reactor #3.
Processes 10 00506 g005
Figure 6. TEM images of the carbon nanostructures produced in different reactors: (a1a4) reactor #1; (b1b4) reactor #2; (c1c4) reactor #3.
Processes 10 00506 g006
Figure 7. Raman spectra of the carbon nanostructures produced in different reactors: (a) reactor #1; (b) reactor #2; (c) reactor #3. Comparison of the D/G and D3/G ratios for the studied samples (d).
Processes 10 00506 g007
Table 1. Characteristics of the carbon products accumulated over Ni-Pd catalyst at 600 °C for 2 h.
ReactorCarbon Yield, g/g (Cat)Density, g/cm3SSA, m2/gVpore, cm3/gID/IGLa, Å
#119.30.0384050.871.7915.9
#214.00.0572620.542.2717.9
#324.20.0362860.672.3418.2
Table 2. Process parameters for the considered reactor types.
ParameterReactor #1Reactor #2Reactor #3
Flow directiondownwardupwarddownward
Specimen, mg21001000
Residence time, s0.00030.0160.16
Reynolds number2.96.94.0
Flow regimelaminarlaminarlaminar
Publisher’s Note: MDPI stays neutral with regard to jurisdictional claims in published maps and institutional affiliations.

