1. Introduction
Despite many concerns about the potential impact of genetically modified (GM) crops on the environment, many varieties have been developed. There are many transgenic crops, including insect-resistant, herbicide-resistant, and nutrition crops such as
Bacillus thuringiensis (BT) cotton, herbicide-tolerant (HT) soybean, and a golden rice [
1]. The total agricultural area planted with GM crops has also increased more than 100-fold during a 19-year period from 1.7 million hectares in 1996 to 181.5 million hectares in 2014 [
1]. These GM crops offer us benefits such as higher effective yields, enhanced nutritional values, and sizeable income gains [
2]. Despite these advantages, concerns exist regarding the potential risks and disadvantages associated with long-term use of GM crops. Thus, many researches are underway investigating the environmental impact of GM crops in many countries.
One of the major concerns is the release of transgenes and by-products from GM crops, which may cause the spread of artificially-introduced genes in the environment and may have adverse effects on soil microbial community structures [
3].
In addition, the released transgenes can persist in soil for a long-time [
4]. In recent studies, although differences in soil microbial communities between soils with GM and non-GM plants were observed during the plant growing period [
5,
6,
7], there were no significant differences in microbial communities between soils with GM and non-GM plants [
8,
9].
This study aimed to assess the impacts of GM soybean and hot pepper containing glufosinate-resistance gene (bar) on soil microbial communities and monitor the persistence of transgenes in the rhizosphere soil during experimental periods. This study was conducted for two consecutive years. The changes in microbial density and the variations in the microbial community structure were analyzed by a culture-dependent plating method and molecular methods such as DGGE profiles and amplicon-based community profiling using Illumina MiSeq platform. The quantitative real-time PCR procedure was used for monitoring the persistence of the bar gene in the rhizosphere soil.
The
bar (or
pat) gene used in this study was originally derived from bacteria. The
bar gene synthesizes the phosphinothricin acetyltransferase that inhibits the glufosinate. This
bar gene has been introduced into plants to confer herbicide-resistance [
10] and is used as a selectable marker in plant engineering [
11].
2. Materials and Methods
2.1. Experimental Design
This study was conducted in the environmental risk assessment experimental field at farm of Seoul National University located in Suwon, Korea (37°16′13.2″ N 126°59′18.7″ E). The width of the field was 20 m and the length of the field was 10 m. The field consisted of four plots and the size of the plot was 80 cm × 20 m.
The soybean (Glycine max L.) and hot pepper (Capsicum annuum L.) containing bar gene were provided from Crop Molecular Physiology & Weed Science Laboratory in Seoul National University and Nongwoobio Co., Ltd. (Yeoju-si, Korea), respectively.
Four varieties (GM soybean, non-GM soybean, GM hot pepper, and non-GM hot pepper) were planted in July and grown for 111 and 112 days in 2015 and 2016, respectively. More than 100 seedings were planted in each plot. Same type of plants was grown in the same plots over two years. No crops were cultivated for about 2 years before the start of the experiment.
The changes in microbial density and the variations in microbial community structure caused by GM crops were analyzed by culture-dependent and molecular methods. In culture-dependent method, soil bacterial density was assessed by the enumeration of cultured total bacteria, fungi, and actinomycetes after inoculation of soil samples in respective selective media. Additionally, density of free-living nitrogen-fixing bacteria and Rhizobium communities were estimated. In molecular methods, the variations in microbial community structure were analyzed through DGGE analysis and the amplicon-based community profiles.
In addition, the persistence of bar gene in the rhizosphere soil was monitored by quantitative real-time PCR procedure.
2.2. Soil Sample Collection
Soil samples were randomly collected 10 times from each plot with an interval of about 12 days during the experiment. For rhizosphere sampling, plant was dug out and the roots with attached soils were gently shaken to remove loose soil. The attached soil was collected as the rhizosphere soil. Soil samples from the plot were sieved through a 2 mm mesh and kept at 4 °C prior to use.
2.3. Colongy Forming Units (CFUs) in Soils
The number of microorganisms was calculated by counting the number of colonies using the colony forming unit (CFU/g soil). To determine CFU counts of bacteria, fungi, actinomycetes, free-living N2-fixing bacteria, and rhizobium, serial dilutions of soil samples were plated on various media.
The culture medium used for bacterial growth was Peptone–Tryptone–Yeast extract–Glucose (PTYG) agar. PTYG agar contained 0.25 g of peptone, 0.25 g of tryptone, 0.5 g of yeast extract, 0.5 g of glucose, 15 g of agar, 0.03 g of MgSO4, 0.003 g of CaCl2, and 0.2 g of cycloheximide per liter. After culturing at 28 °C for 96 h, the colonies on the plate were counted.
The culture medium for growth of fungi contained 20 g of malt extract and 0.2 g of chloramphenicol per liter and adjusted to pH 7.0. After incubation at 28 °C for 96 h, the colonies on the plate were counted [
12].
The culture medium for growth of actinomycetes contained 0.2 g of sodium caseinate, 0.5 g of KH
2PO
4, 0.2 g of MgSO
4·7H
2O, 15 g of agar, and 0.5 g of FeCl
3·6H
2O per liter and adjusted to pH 6.5–6.7. Before cultivation, samples were heated in a 45 °C water bath for 16 h. After cultivation at 28 °C for 5–7 d, the colonies on the plate were counted [
13].
The culture medium for growth of free-living N
2-fixing bacteria was nitrogen-free JMV agar [
14]. JMV agar contained 5 g of mannitol, 0.6 g of KH
2PO
4, 1.8 g of K
2HPO
4, 0.1 g of NaCl, 0.08 g of CaCl
2·2H
2O, 0.2 g of MgSO
4·7H
2O, 2 mL of bromomethyl blue, 4 mL of FeEDTA, 2 mL of micronutrient solution, 1 mL of vitamin solution, 25 g of agar per liter, and adjusted to pH 5.0–5.4. After cultivation at 28 °C for 48 h, the colonies on the plate were counted.
The culture medium for growth of rhizobium was yeast mannitol antibiotic (YMA) agar medium [
15]. YMA medium contained 5 g of mannitol, 5 g of lactose, 0.5 g of K
2HPO
4, 0.2 g of NaCl, 0.2 g of CaCl
2·2H
2O, 0.1 g of MgSO
4·7H
2O, 0.1 g of FeCl
3·6H
2O 0.1 g, 0.5 g of yeast extract, and 20 g of agar per liter and adjusted to pH 7.0. After sterilizing, 0.2 g of cycloheximide, 0.1 g of pentachlorobenzene, 25 mg of sodium benzyl penicillin, 10 mg of chloramphenicol, 25 mg of sulfathiazole, and 2.5 mg of neomycin were added. After cultivation at 28 °C for 48 h, the colonies on the plate were counted.
A 1 g soil sample was homogenized with 9.5 mL of sterilized 0.85% saline solution by shaking at 200 rpm on a rotary shaker (Vision Co., Bucheon, Korea). This diluted soil suspension was serially diluted tenfold and 100 μL of each dilution was spread over the surface of each agar-containing culture medium.
2.4. PCR Amplification of Soil Bacterial 16S rDNA and nifH Gene
Soil bacterial community DNA was extracted using a FastDNA
® Spin Kit (MP Biomedicals, Solon, OH, USA). The concentration of all total soil DNA was equalized to 20 ng/μL. PCR amplification of 16S rDNA and
nifH was performed with the 352TA-515r and polF-polR primer pairs. The primer pair, 352TA (5′-CGCCCGCCGCGCGCGGGCGGGGCGGGGGCACGGGGGGACTCCTACGGGAGGC-3′) and 515r (5′-ACCGCGGCTGCTGGCAC-3′), for amplifying the soil bacterial 16S rDNA targets the highly variable V3 region [
16].
A primer pair of polF (5′-CGCCCGCCGCGCCCCGCGCCCGGCCCGCCGCCCCCGCCCCTGCGAYCCSAATGCBGACTC-3′) and polR (5′-ATSGCCATCATYTCRCCGGA-3′) was used for amplifying the
nifH encoding the iron protein subunit of nitrogenase [
17,
18,
19].
PCR amplification was conducted using the LightCycler® 480 Real-Time PCR system (Roche, Swiss). The PCR product contains GC clamps added to 352TA and polF, respectively. PCR amplification was performed in 50 μL reaction mixture containing 10× PCR buffer (TaKaRa Bio Inc., Shiga, Japan), 1 μL of DNA template, 20 pmol of each primer, 2.5 mM of each dNTP (TaKaRa Bio Inc., Shiga, Japan), 10 mg/mL bovine serum albumin, 0.5× SYBR Green I, 2.5 U of Taq polymerase (TaKaRa Bio Inc., Shiga, Japan). The PCR amplification was performed at 94 °C for 5 min initially, then 94 °C for 1 min, 51 °C for 1 min, and 72 °C for 1 min, and final extension at 72 °C for 30 min. The amplification cycles of 16S rDNA and nifH genes were 24, 30, respectively. After PCR amplification, the PCR products were purified with MiniElute® PCR purification kit (Qiagen, Hilden, Germany) and checked by electrophoresis on horizontal 1% agarose gels.
2.5. Denaturing Gradient Gel Electrophoresis (DGGE) Analysis
The experimental method to determine the total soil microbial community using the real-time PCR-DGGE method was described [
16]. DGGE was performed on a Dcode mutation detection system (BioRad, Hercules, CA, USA). The amplified PCR products were mixed with 2× gel loading dye (2% bromophenol blue, 2% xylene cyanol, 100% glycerol) and separated on acrylamide–bisacrylamide (37.5:1) gels with a 43–63% denaturing gradient. The 100% denaturant contains 7 M urea and 40% (
vol/
vol) formamide. The gels were electrophoresed in 0.5× TAE buffer for 25 h at 60 °C and a voltage of 60 V. DGGE marker II (Wako Pure Chemical Industries, Osaka, Japan) was used with the samples. After electrophoresis, the gels were stained with SYBR Green I (Lonza, Rockland, ME, USA) for 20 min, and then destained with 0.5× TAE buffer for 15 min. The gels were photographed with UV transillumination (302 nm). The DGGE gel bands were analyzed with Bionumerics
® software (Applied Maths, St-Martens-Latem, Belgium).
For comparison between each lane, DGGE bands were normalized. DGGE bands were counted according to the presence and absence of bands and quantified at each position. The similarities of DGGE gel band patterns between samples were shown as dendrograms that were constructed by the unweighted pair group method of arithmetic averages (UPGMA) and the Dice coefficient [
20].
2.6. Quantification of bar Gene for Analysis of Persistence in Soil
The quantity of
bar gene in soil was determined using a quantitative PCR. In order to detect the copies of
bar gene in the rhizosphere soil, standard curve was constructed by using
E. coli transformed with
bar gene as previously described method [
21]. The transformants were serially diluted into 20 g soil, ranging from 10
1 to 10
8 copies/g soil. After that, diluted
bar gene was extracted from each standard soil sample using FastDNA
® Spin Kit (MP Biomedicals, Solon, OH, USA). Quantification of
bar gene was conducted using the LightCycler
® 480 Real-Time PCR system (Roche). Threshold cycle was calculated by real-time PCR analysis. The linear correlation between Ct value and
bar gene concentration was analyzed to determine the standard. Real-time PCR was carried out in 0.2 μL forward primer (20 pmol), 0.2 μL reverse primer (20 pmol), 10 μL SYBR Premix Ex Taq II (Takara Bio Inc.), 2 μL template DNA, and ddH
2O in a final volume of 20 μL. A two-step experimental run protocol was used: denaturation program at 95 °C for 5 min, amplification and quantification program repeated 40 times at 95 °C for 10 s, 60 °C for 30 s with a single fluorescence measurement, melting curve program at 95 °C for 5 s, 65 °C 1 min, 97 °C with a continuous fluorescence measurement, and finally a cooling step to 40 °C.
2.7. Illumina MiSeq Sequencing
The sequencing of PCR amplicons from Illumina MiSeq was performed at Macrogen (Seoul, Korea). All reads were checked, trimmed, and filtered using CD-HIT-OUT [
22]. The error-free reads were picked. After initial filtering, operational taxonomic units (OTUs) with 97% similarity cut-off were clustered using MOTHUR [
23]. The selected sequences were aligned using the Basic Local Alignment Search Tool (BLAST). Raw sequencing data (FASTQ files) were processed including de-multiplexing, quality filtering, taxonomic assignment, and phylogenetic reconstruction using QIIME (Quantitative Insights Into Microbial Ecology) pipeline [
24]. Alpha diversity was analyzed by QIIME. The rarefaction analysis based on species richness was conducted to determine the diversity indices, including the Chao1, Shannon, and Simpson diversity indices.
3. Results
3.1. Changes in Total Microbial Populations
To measure the changes in microbial density over time between soils from plots with GM and non-GM plants, the total viable count of bacteria, actinomycetes, fungi, free-living nitrogen-fixing bacteria, and Rhizobium in the rhizosphere soil of the soybean and hot pepper field were estimated in years 2015 and 2016.
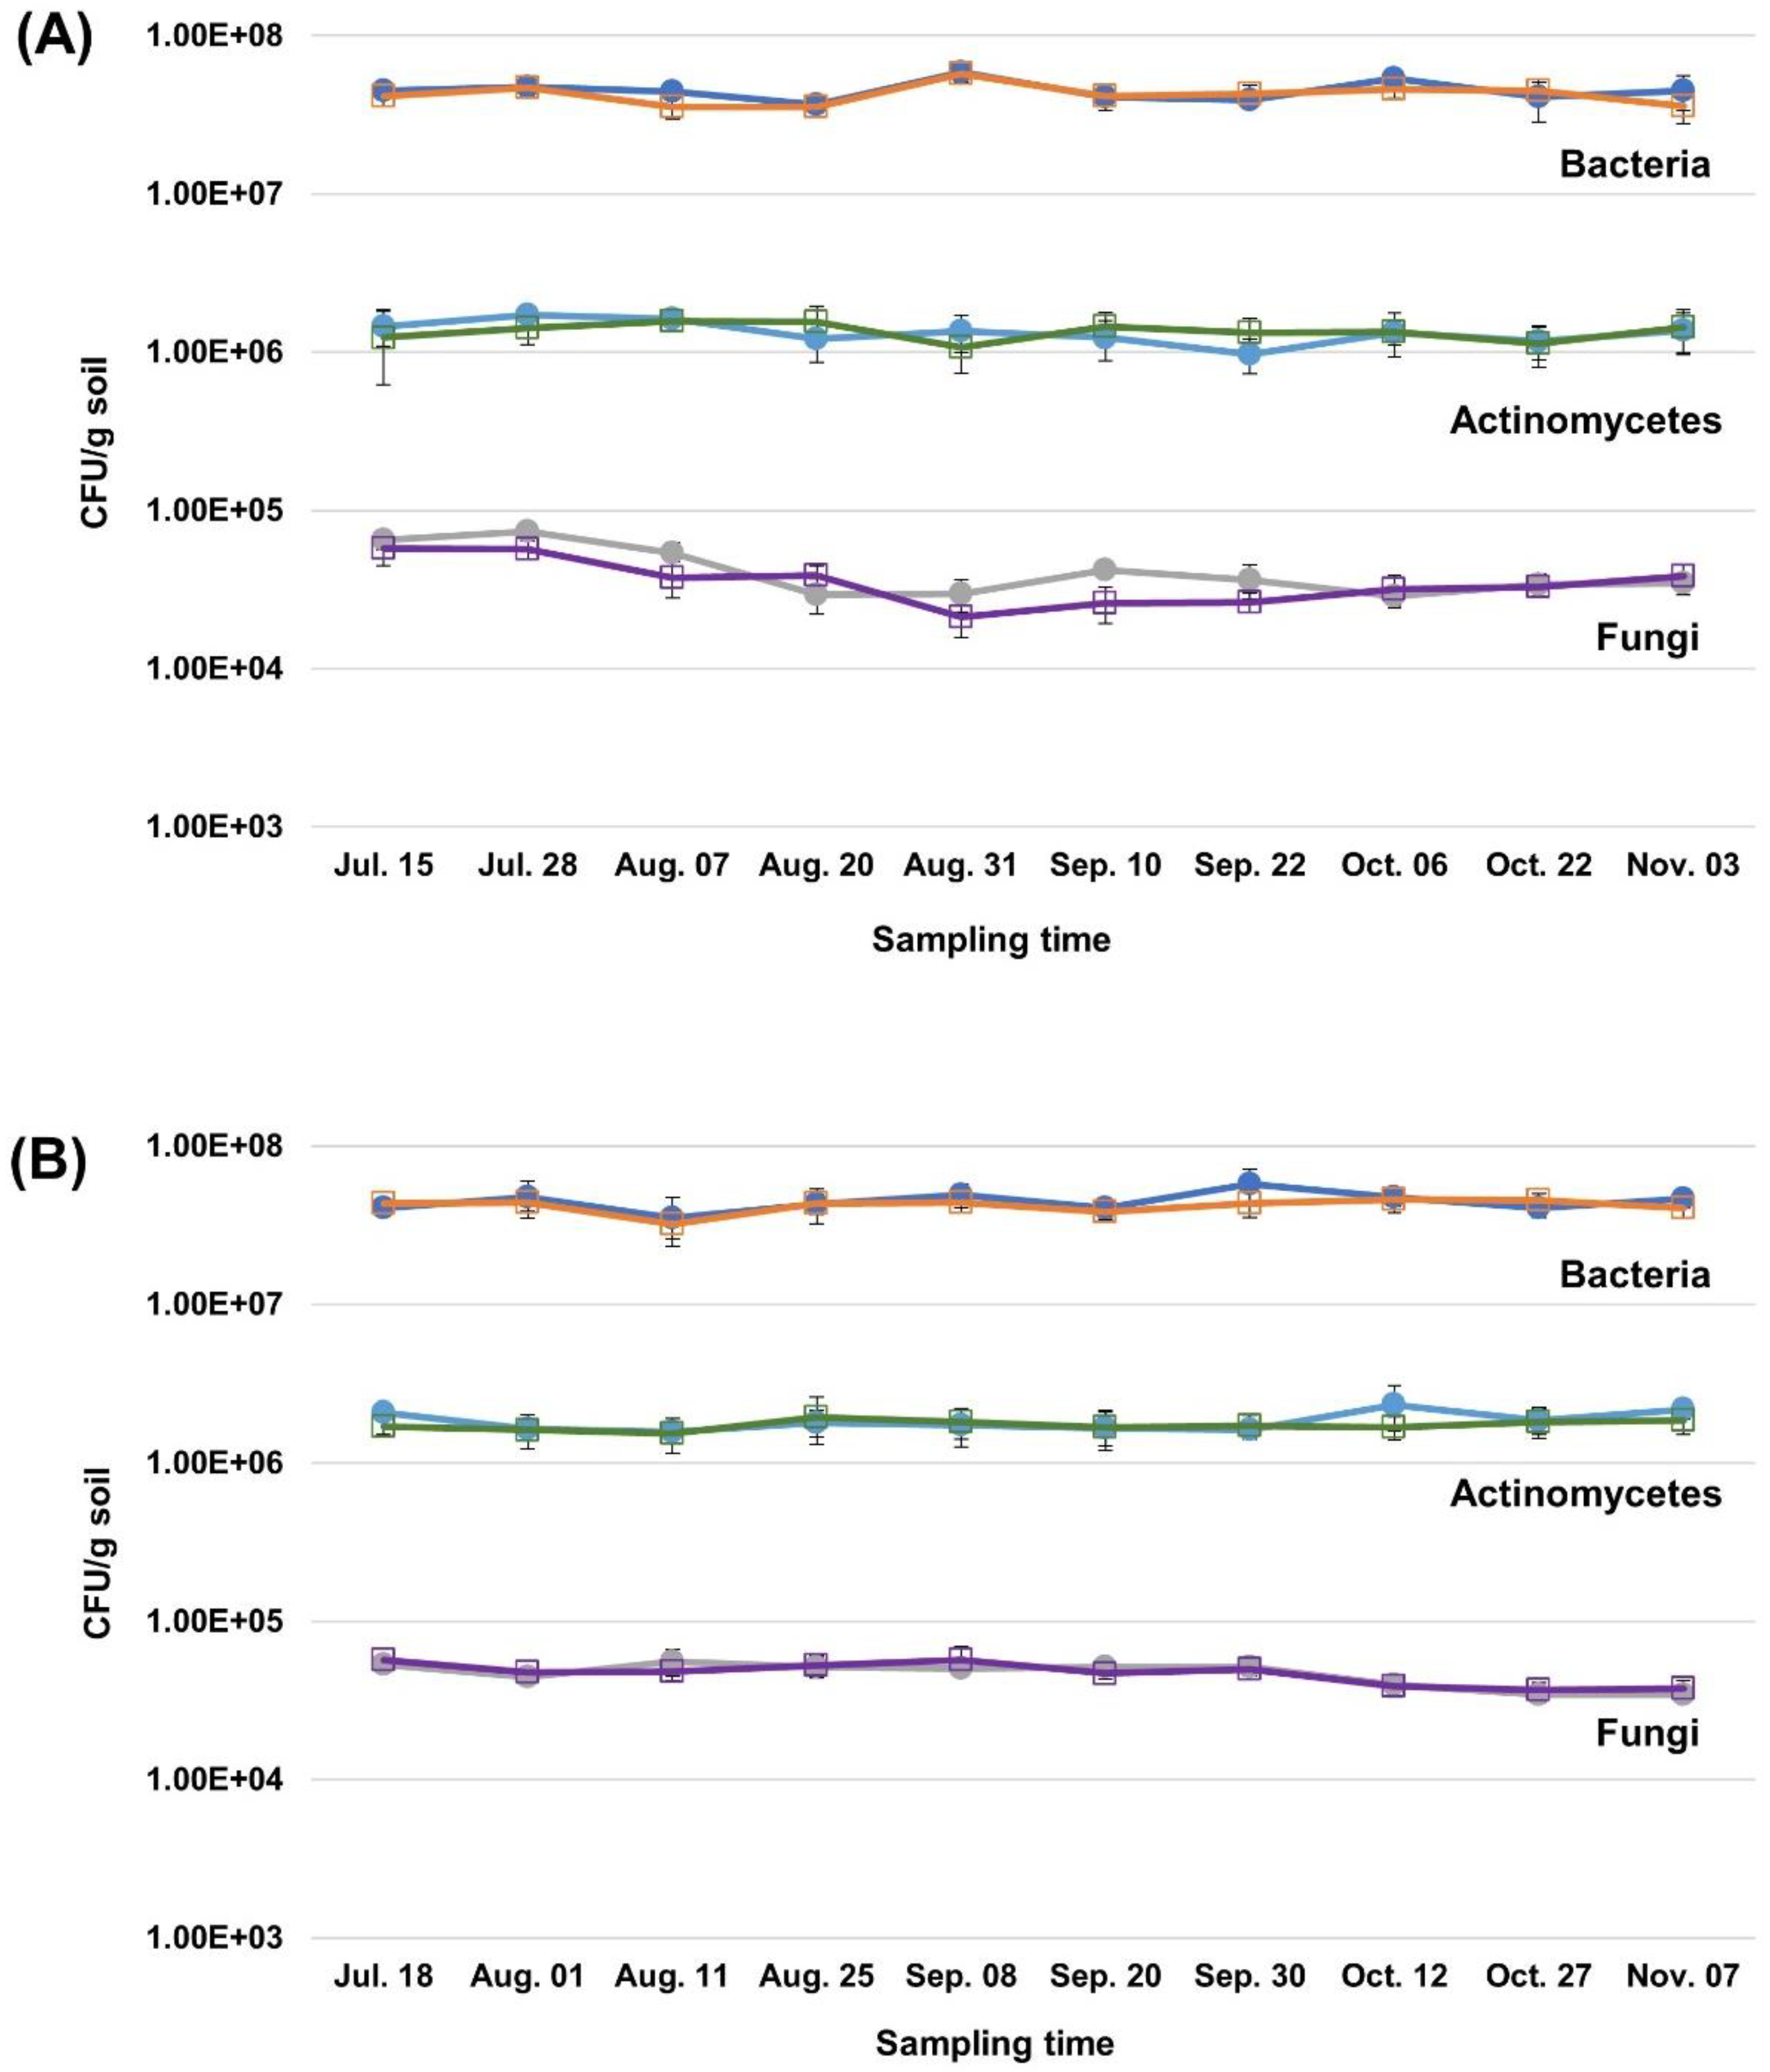
The changes in microbial densities in the soybean rhizosphere soil are shown in
Figure 1. The total bacterial cell densities in the GM and non-GM soybean-cultivated soil were in the ranges of 3.57 × 10
7–4.47 × 10
7 cfu/g soil in 2015 and 3.20 × 10
7–5.76 × 10
7 cfu/g soil in 2016. The actinomycetes’ population densities in the GM and non-GM soybean-cultivated soil were in the range of 1.23 × 10
6–1.45 × 10
6 cfu/g soil in 2015 and 1.53 × 10
6–2.32 × 10
6 cfu/g soil in 2016. The fungal population densities in the GM and non-GM soybean-cultivated soil were in the range of 2.11 × 10
4–7.36 × 10
4 cfu/g soil in 2015 and 3.43 × 10
4–5.72 × 10
4 cfu/g soil in 2016.
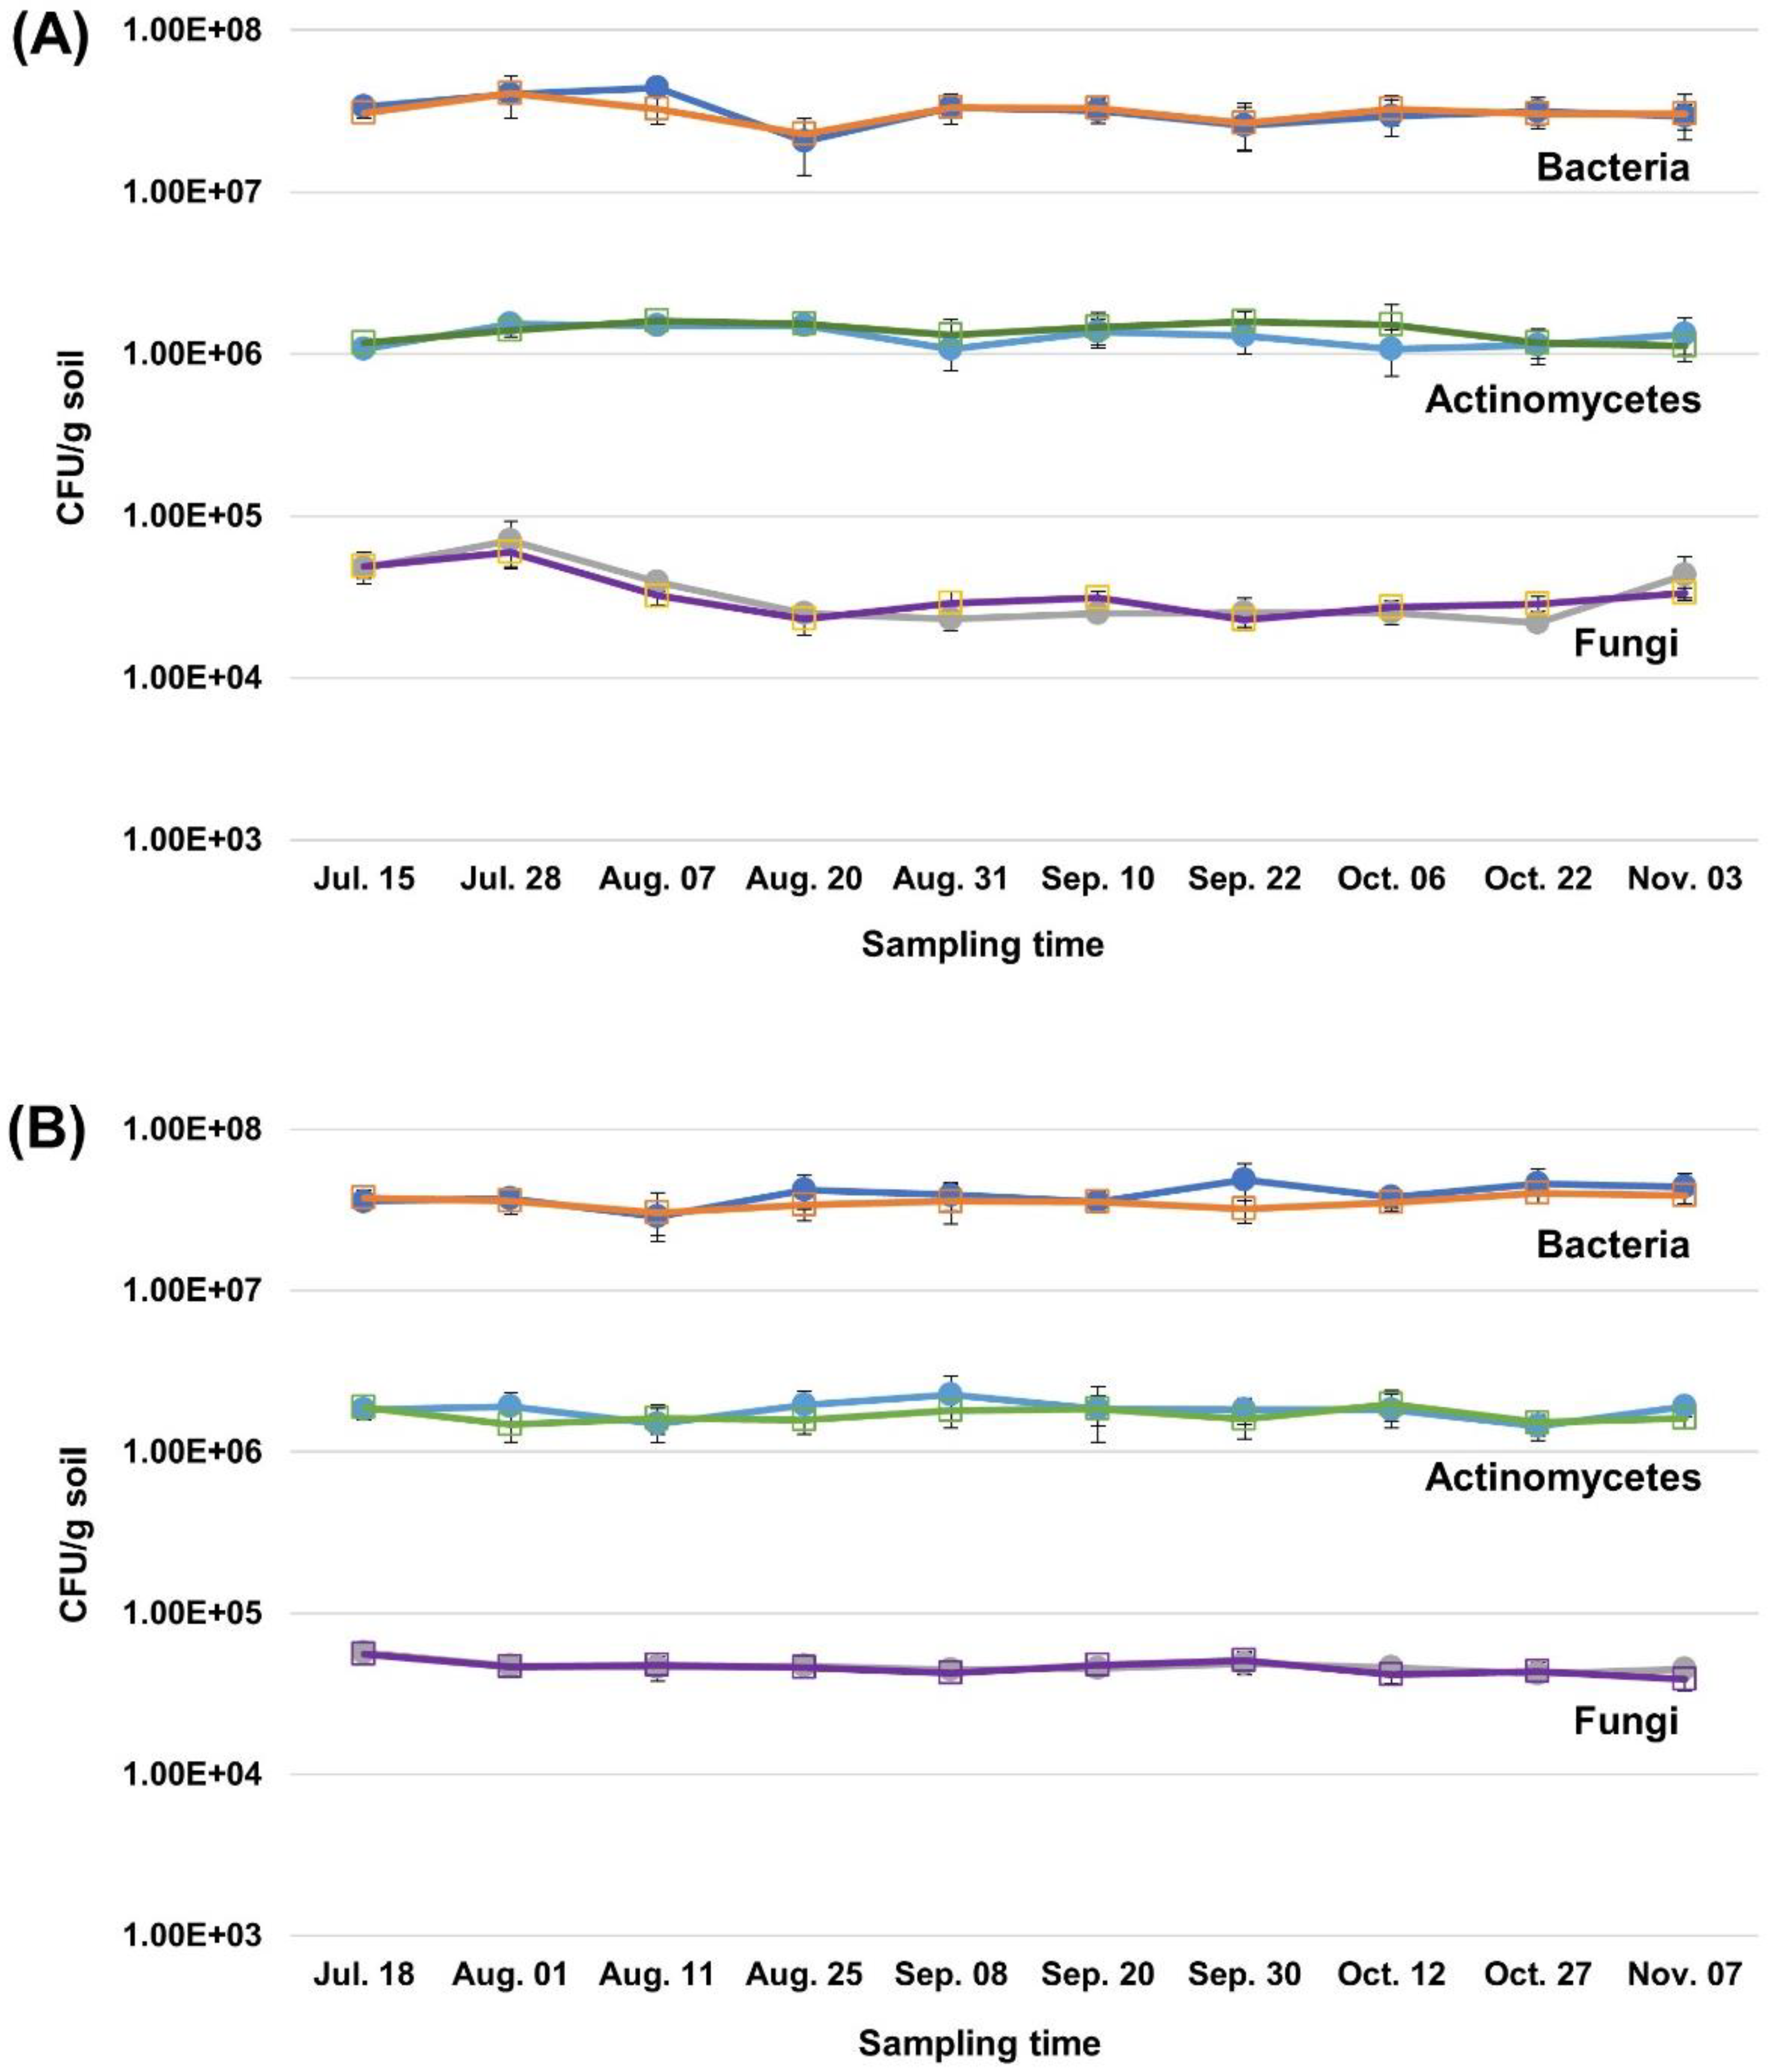
The changes in microbial densities in hot pepper-cultivated soil are shown in
Figure 2. The total bacterial cell densities in the GM and non-GM hot pepper-cultivated soil were in the ranges of 2.93 × 10
7–3.37 × 10
7 cfu/g soil in 2015 and 2.87 × 10
7–4.86 × 10
7 cfu/g soil in 2016. The actinomycetes population densities in the GM and non-GM hot pepper-cultivated soil were in the ranges of 1.07 × 10
6–1.32 × 10
6 cfu/g soil in 2015 and 1.43 × 10
6–2.26 × 10
6 cfu/g soil in 2016. The fungal population densities in the GM and non-GM hot pepper-cultivated soil were in the ranges of 2.19 × 10
4–7.06 × 10
4 cfu/g soil in 2015 and 3.88 × 10
4–5.72 × 10
4 cfu/g soil in 2016.
One-way analysis of variance (ANOVA) was used to evaluate the statistical significance between soils from the plots with GM and non-GM crops with the bacterial, actinomycetal, and fungal cell densities at 10 sampling points. The result of ANOVA showed that no significant differences were observed between the GM and non-GM soils in the microbial populations (p > 0.05).
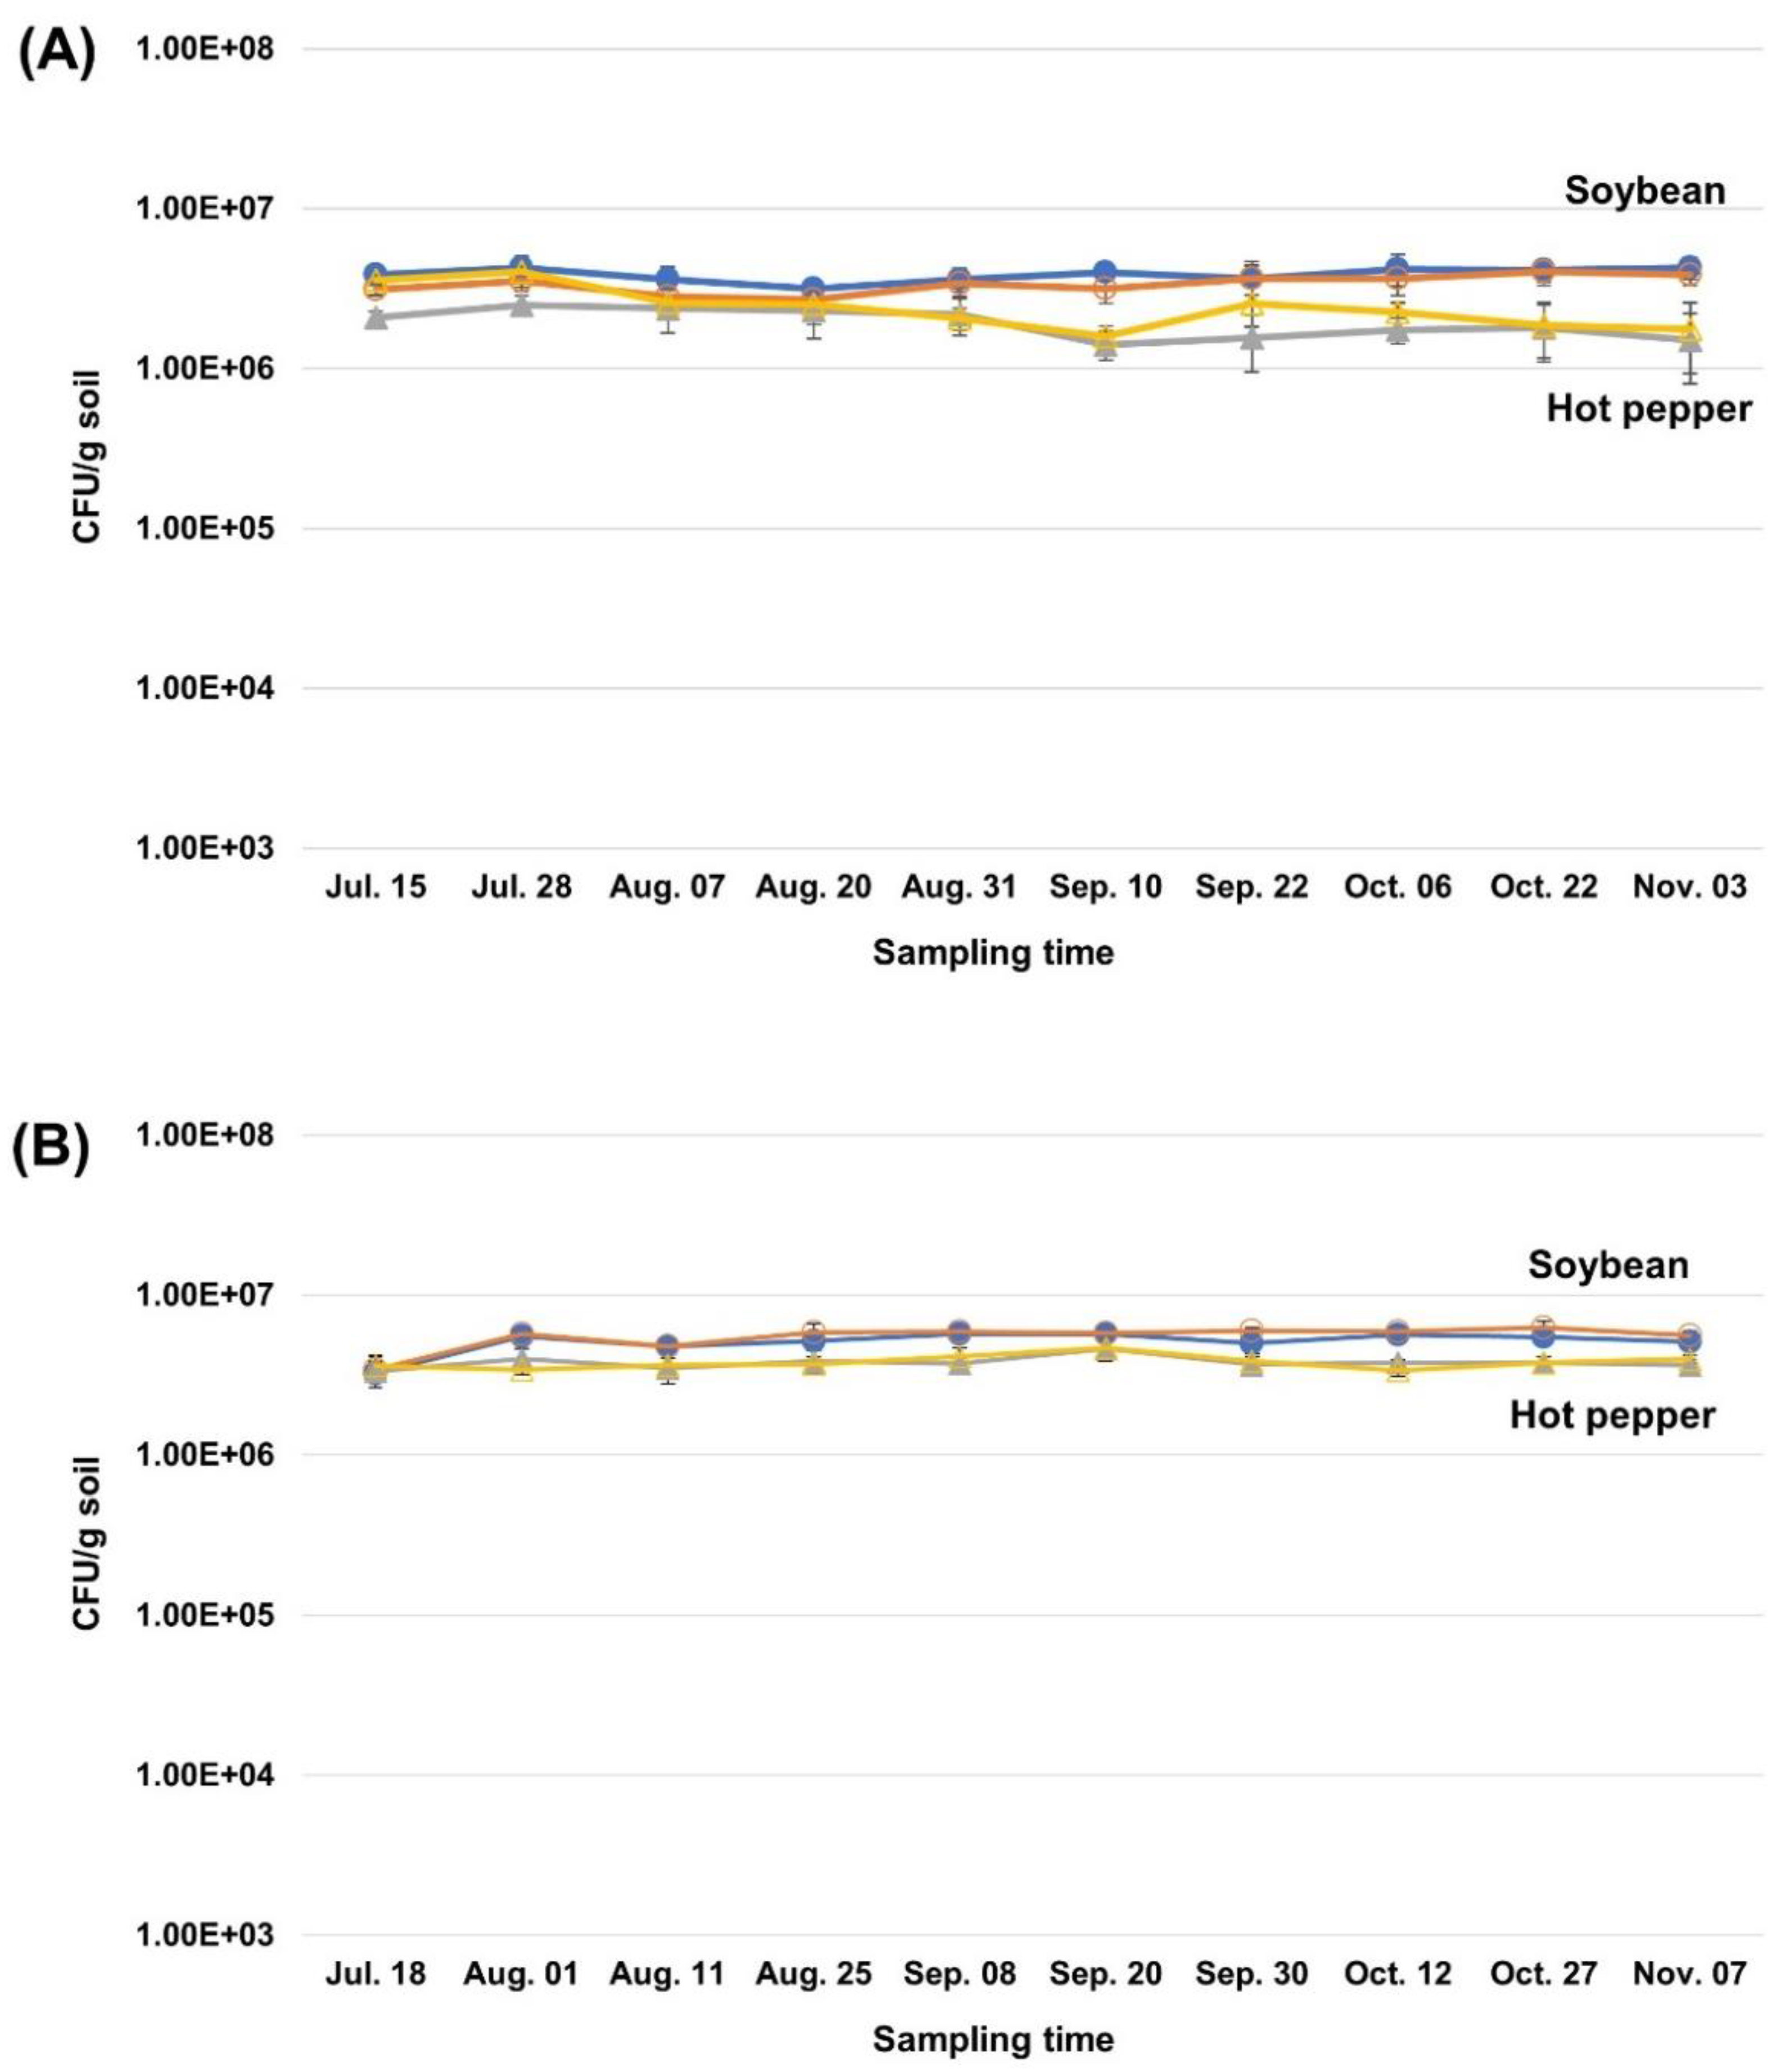
In addition to bacteria, actinomycetes, and fungi, the cell densities of the nitrogen-fixing bacteria (free-living nitrogen-fixing bacteria, rhizobium) were measured. The changes in free-living nitrogen-fixing bacteria densities in the soybean and hot pepper soils are shown in
Figure 3. The total free-living nitrogen-fixing bacteria cell densities in the GM and non-GM soybean-cultivated soil were in the range of 2.69 × 10
6–4.28 × 10
6 cfu/g soil in 2015 and 3.22 × 10
6–6.27 × 10
6 cfu/g soil in 2016. The total free-living nitrogen-fixing bacteria cell densities in the GM and non-GM hot pepper-cultivated soil were 1.56 × 10
6–4.03 × 10
6 cfu/g soil in 2015 and 3.34 × 10
6–4.68 × 10
6 cfu/g soil in 2016. These density ranges showed that there were no significant differences between GM and non-GM field soils.
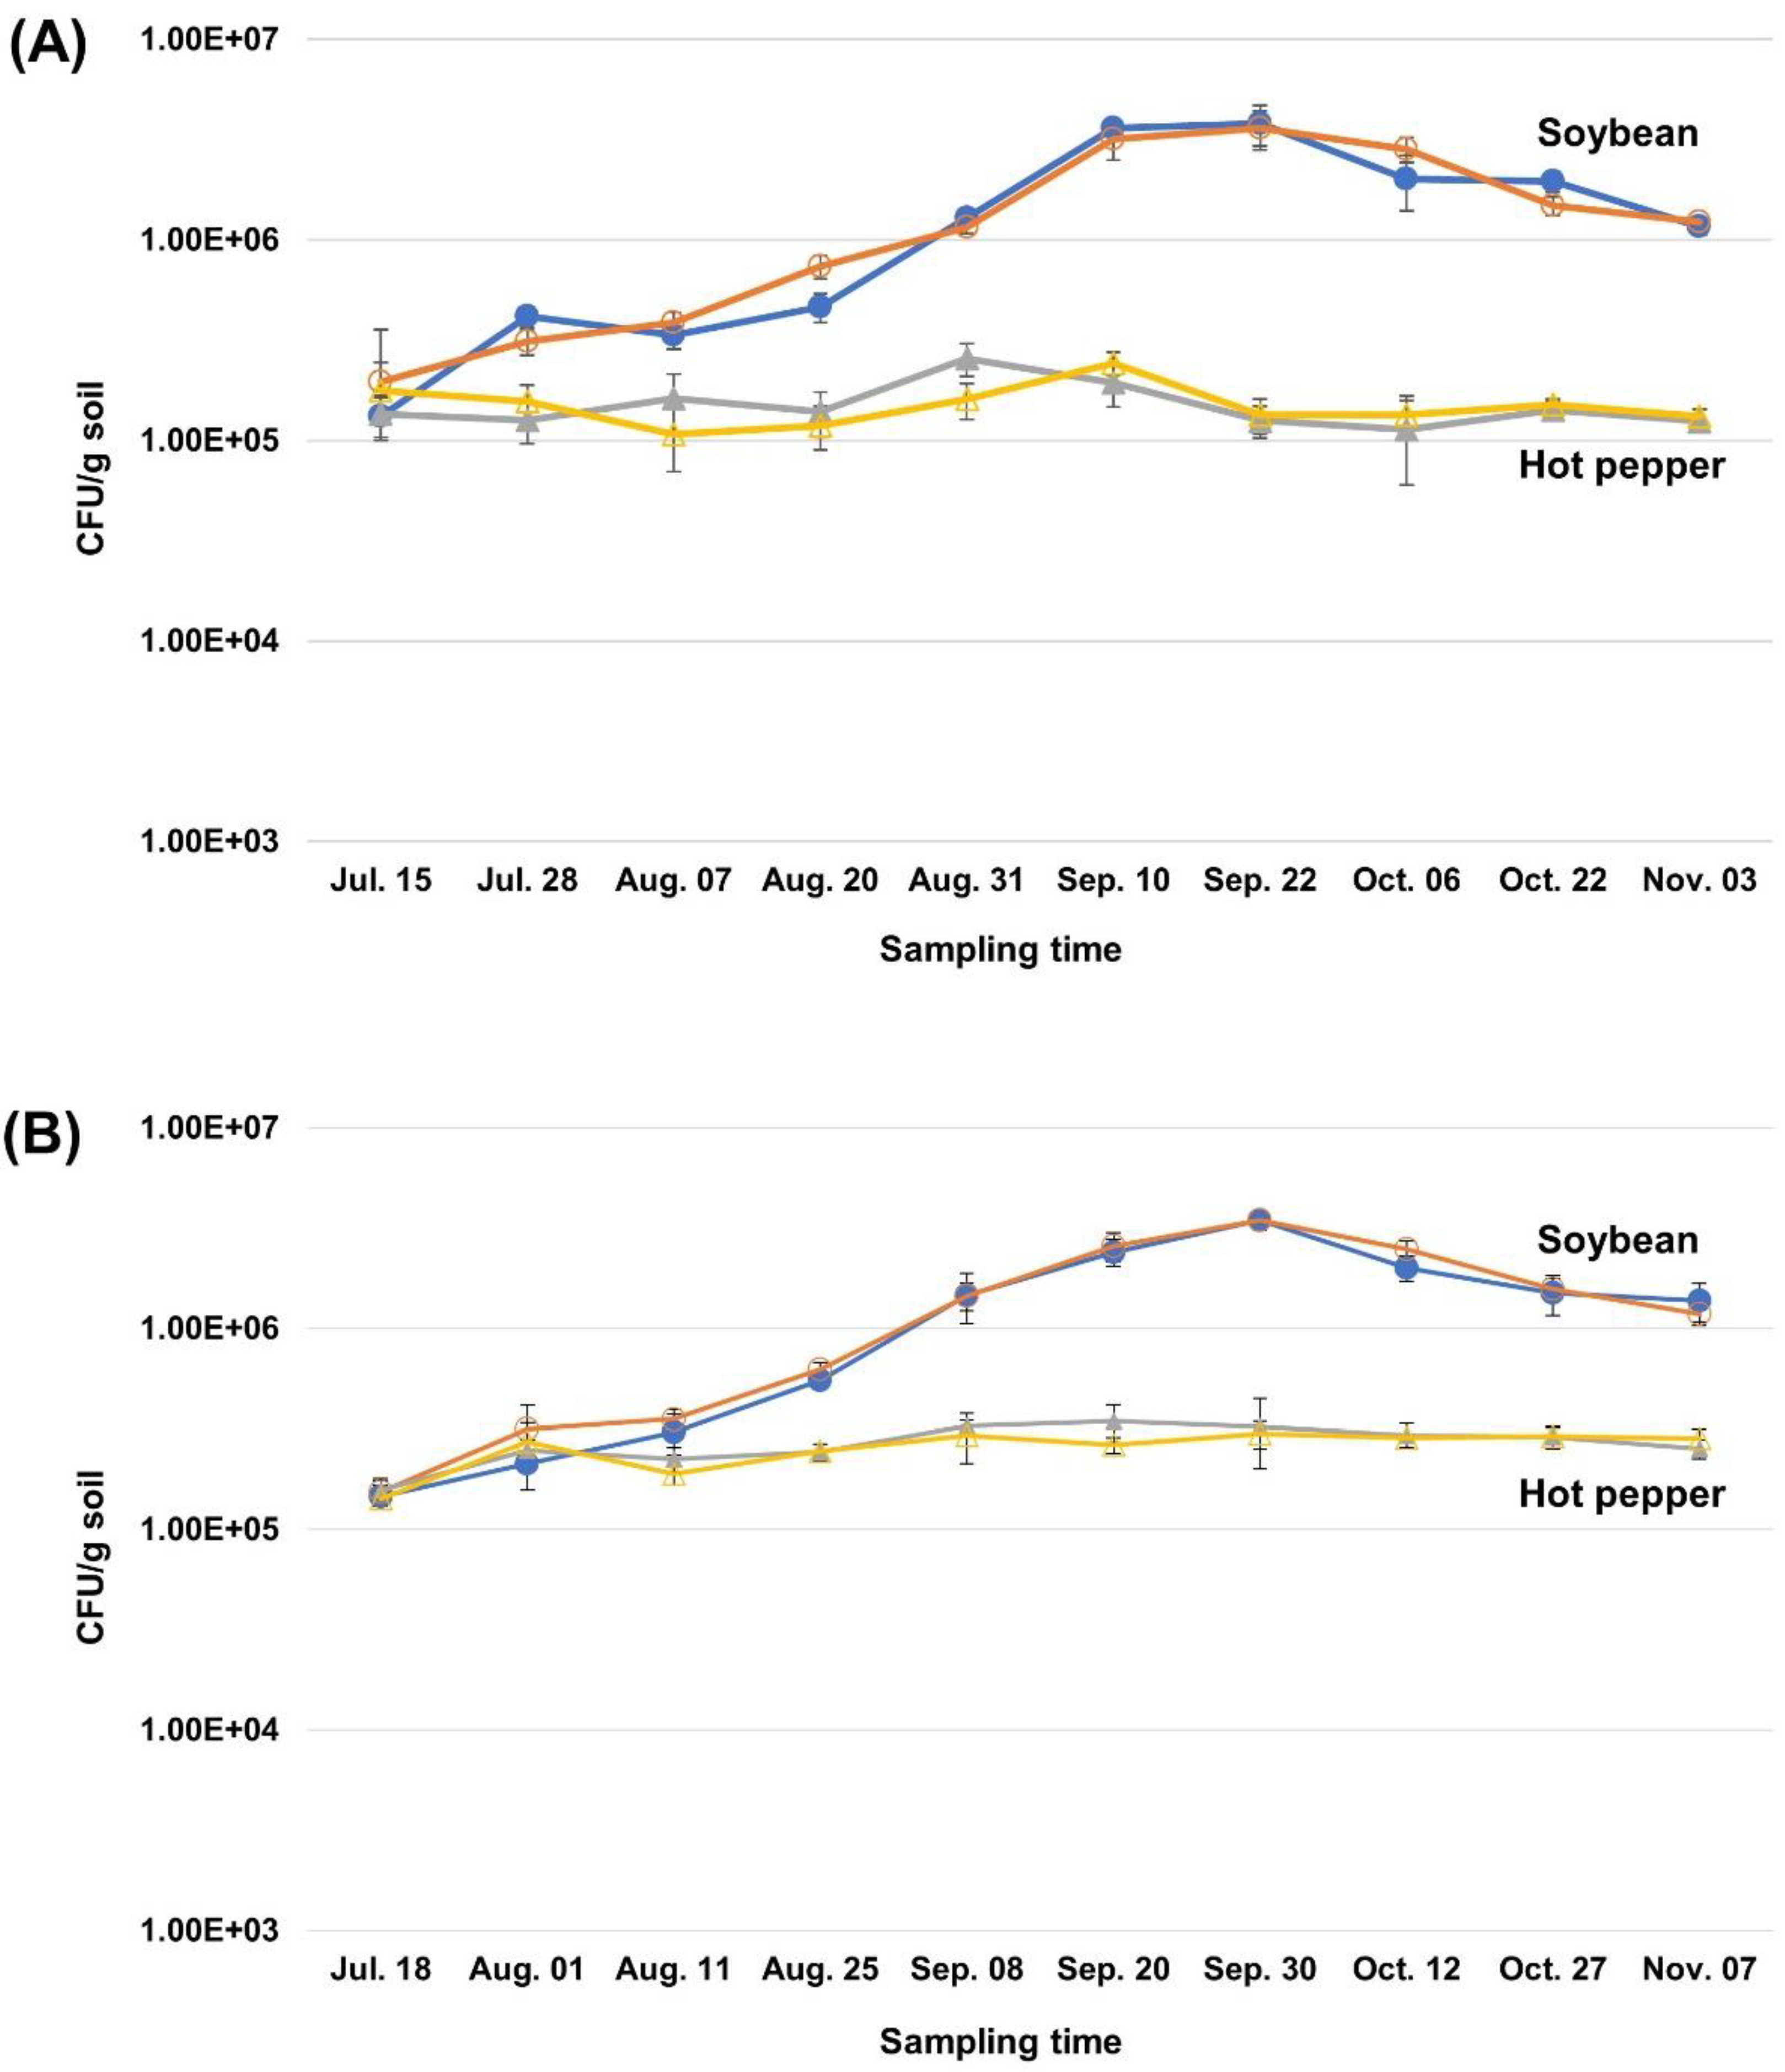
The changes in
Rhizobium densities in soybean and hot pepper soils are shown in
Figure 4. The
Rhizobium cell densities in the GM and non-GM soybean-cultivated soil were in the range of 1.32 × 10
5–3.80 × 10
6 cfu/g soil in 2015 and 1.46 × 10
5–3.48 × 10
6 cfu/g soil in 2016. The
Rhizobium cell densities were 10
5 CFU levels at the beginning of the culture, and then as the soybeans grew, the cell densities increased approximately 10-fold to the level of 10
6 CFU. This result suggests that
Rhizobium formed a symbiotic relationship with legume plants and the cell density was increased. On the other hand, the
Rhizobium cell densities in the GM and non-GM hot pepper-cultivated soils were consistently in the range of 1.08 × 10
5–2.43 × 10
5 cfu/g soil in 2015 and 1.42 × 10
5–3.45 × 10
5 cfu/g soil in 2016.
One-way analysis of variance (ANOVA) was used to evaluate the statistical significance between the soils from plots with GM and non-GM crops with the cell densities of free-living nitrogen-fixing bacteria and Rhizobium at 10 sampling points. The results of ANOVA showed that no significant differences were observed between GM and non-GM soils in the free-living nitrogen-fixing bacteria and Rhizobium populations, respectively (p > 0.05). When all these results were combined, the microbial population dynamics were not significantly different between the soils with GM and non-GM crops during the experimental period.
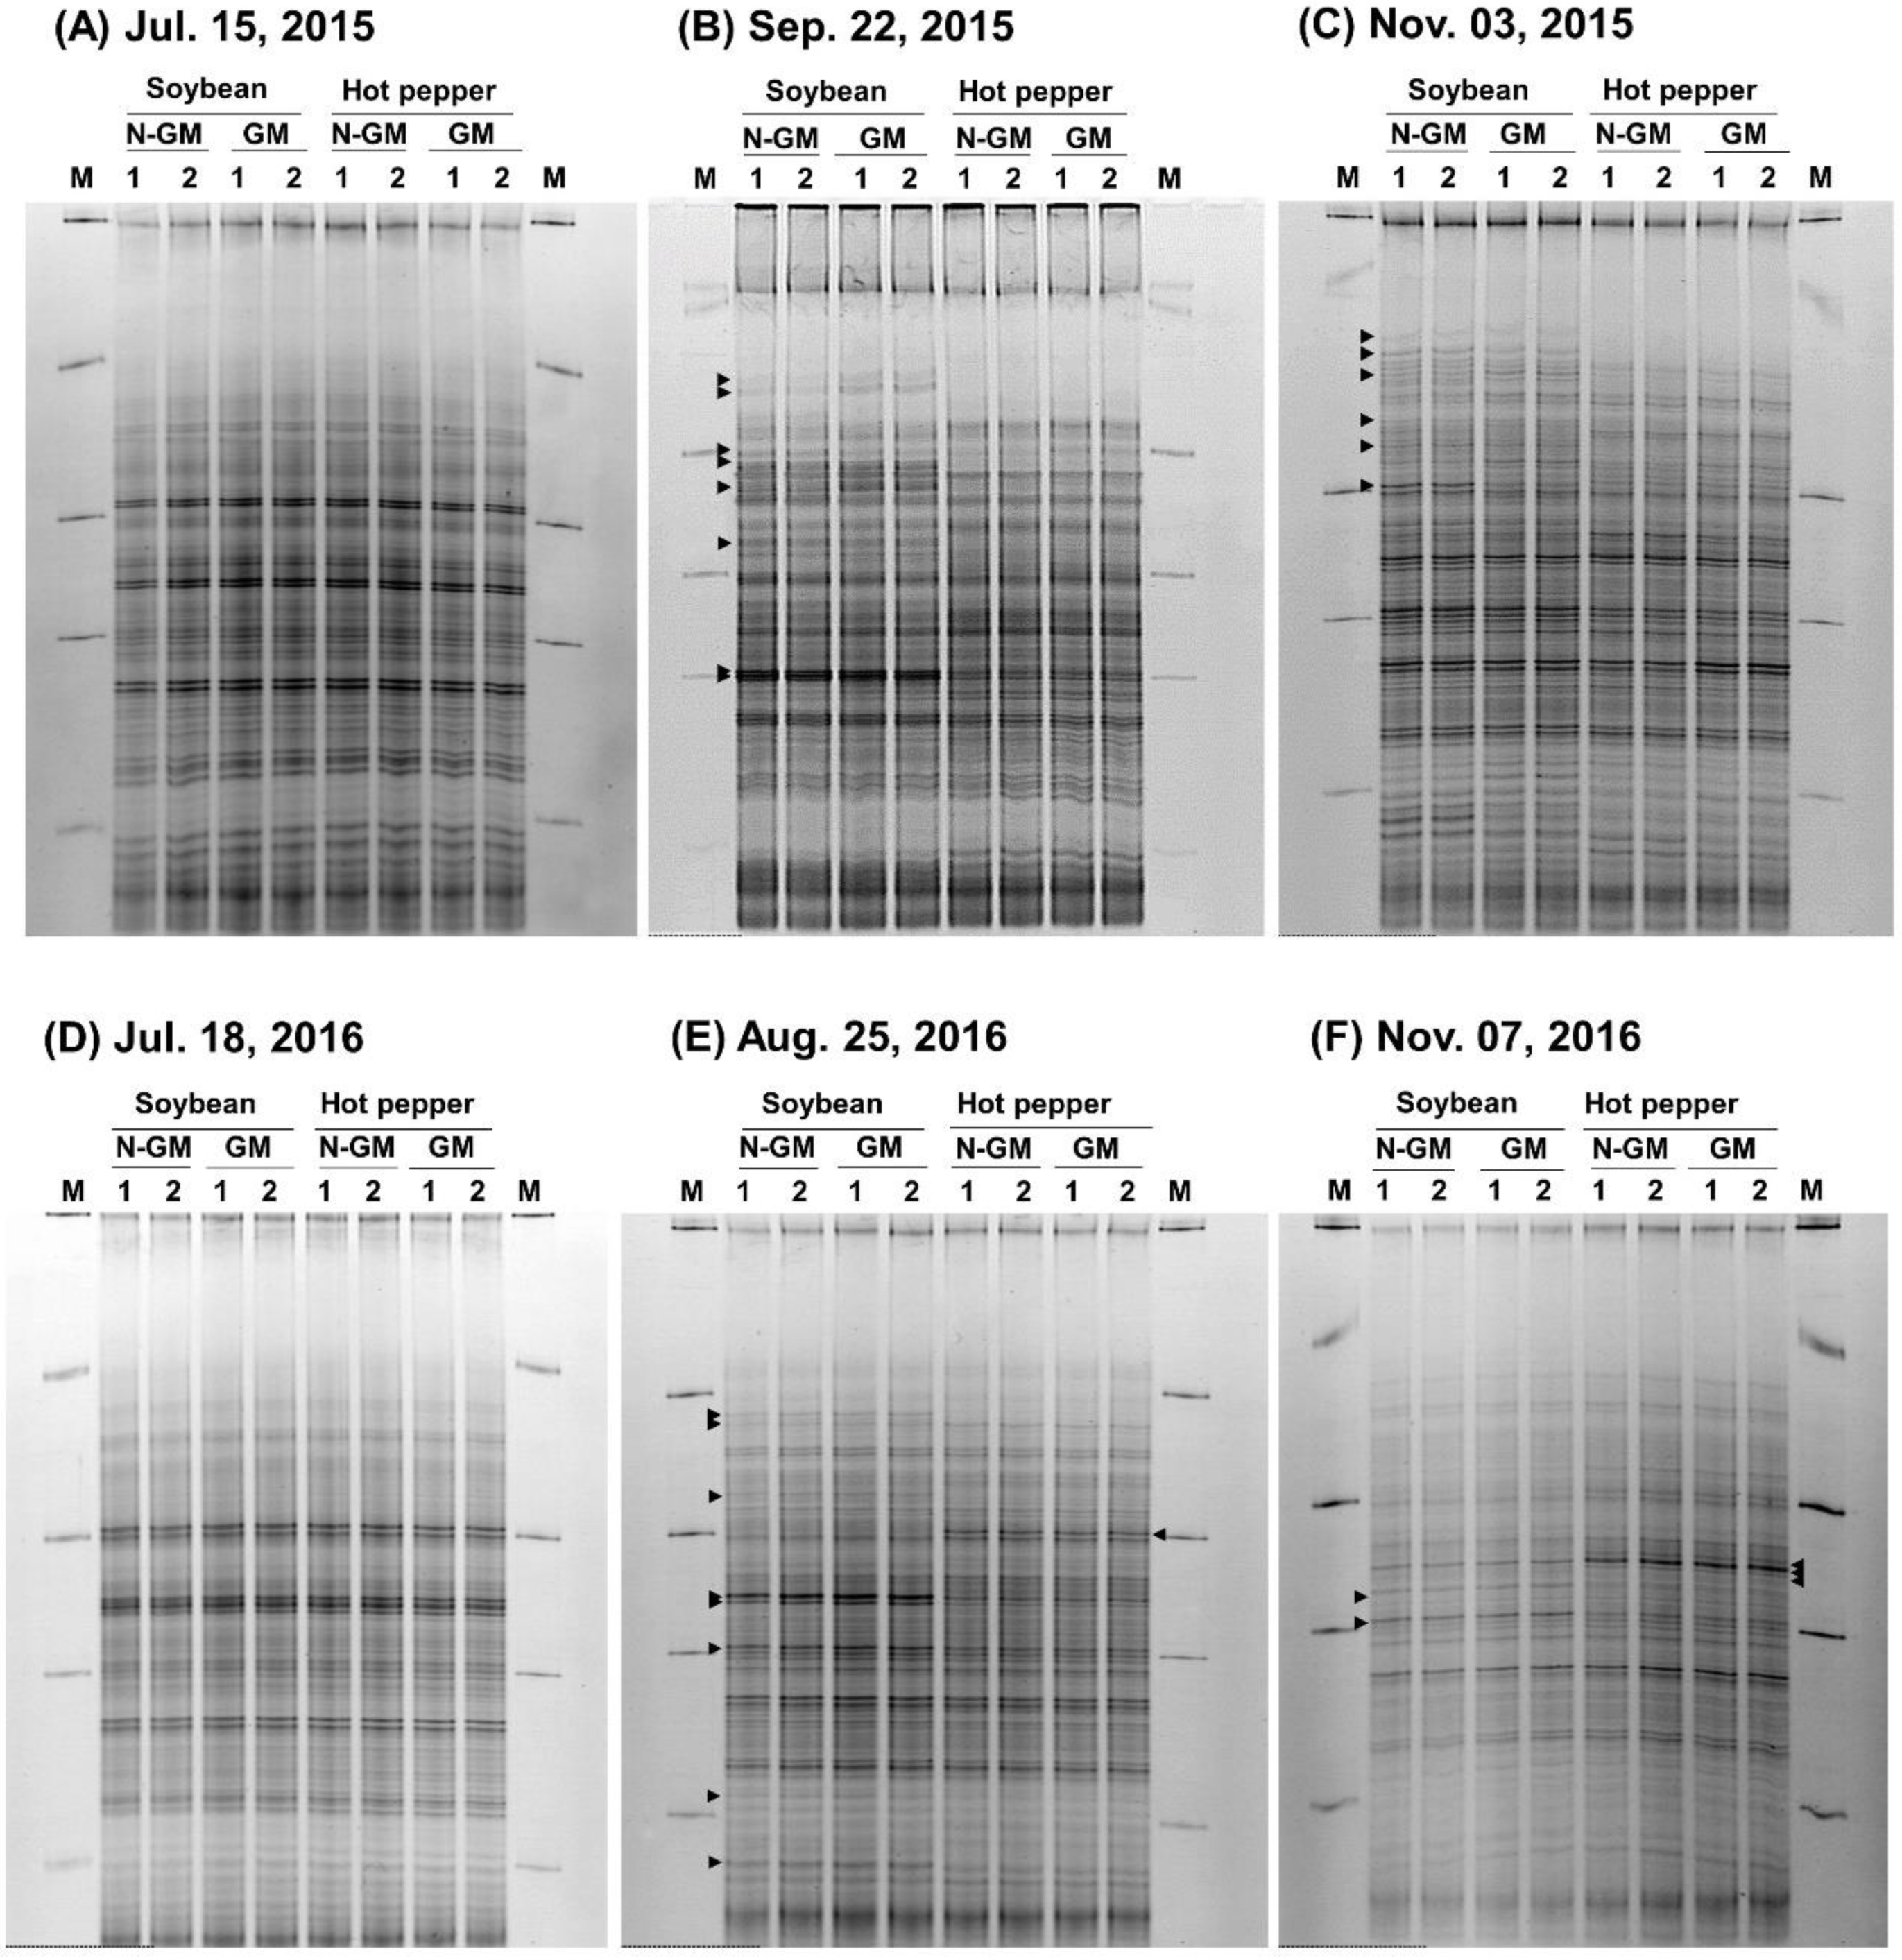
3.2. Real-Time PCR-DGGE Analysis
To assess the impacts of GM soybean and hot pepper on microbial community structures, real-time PCR-DGGE analysis was carried out. DNA from experimental soil was extracted and amplified with the variable V3 region of 16S rRNA gene and the
nifH.
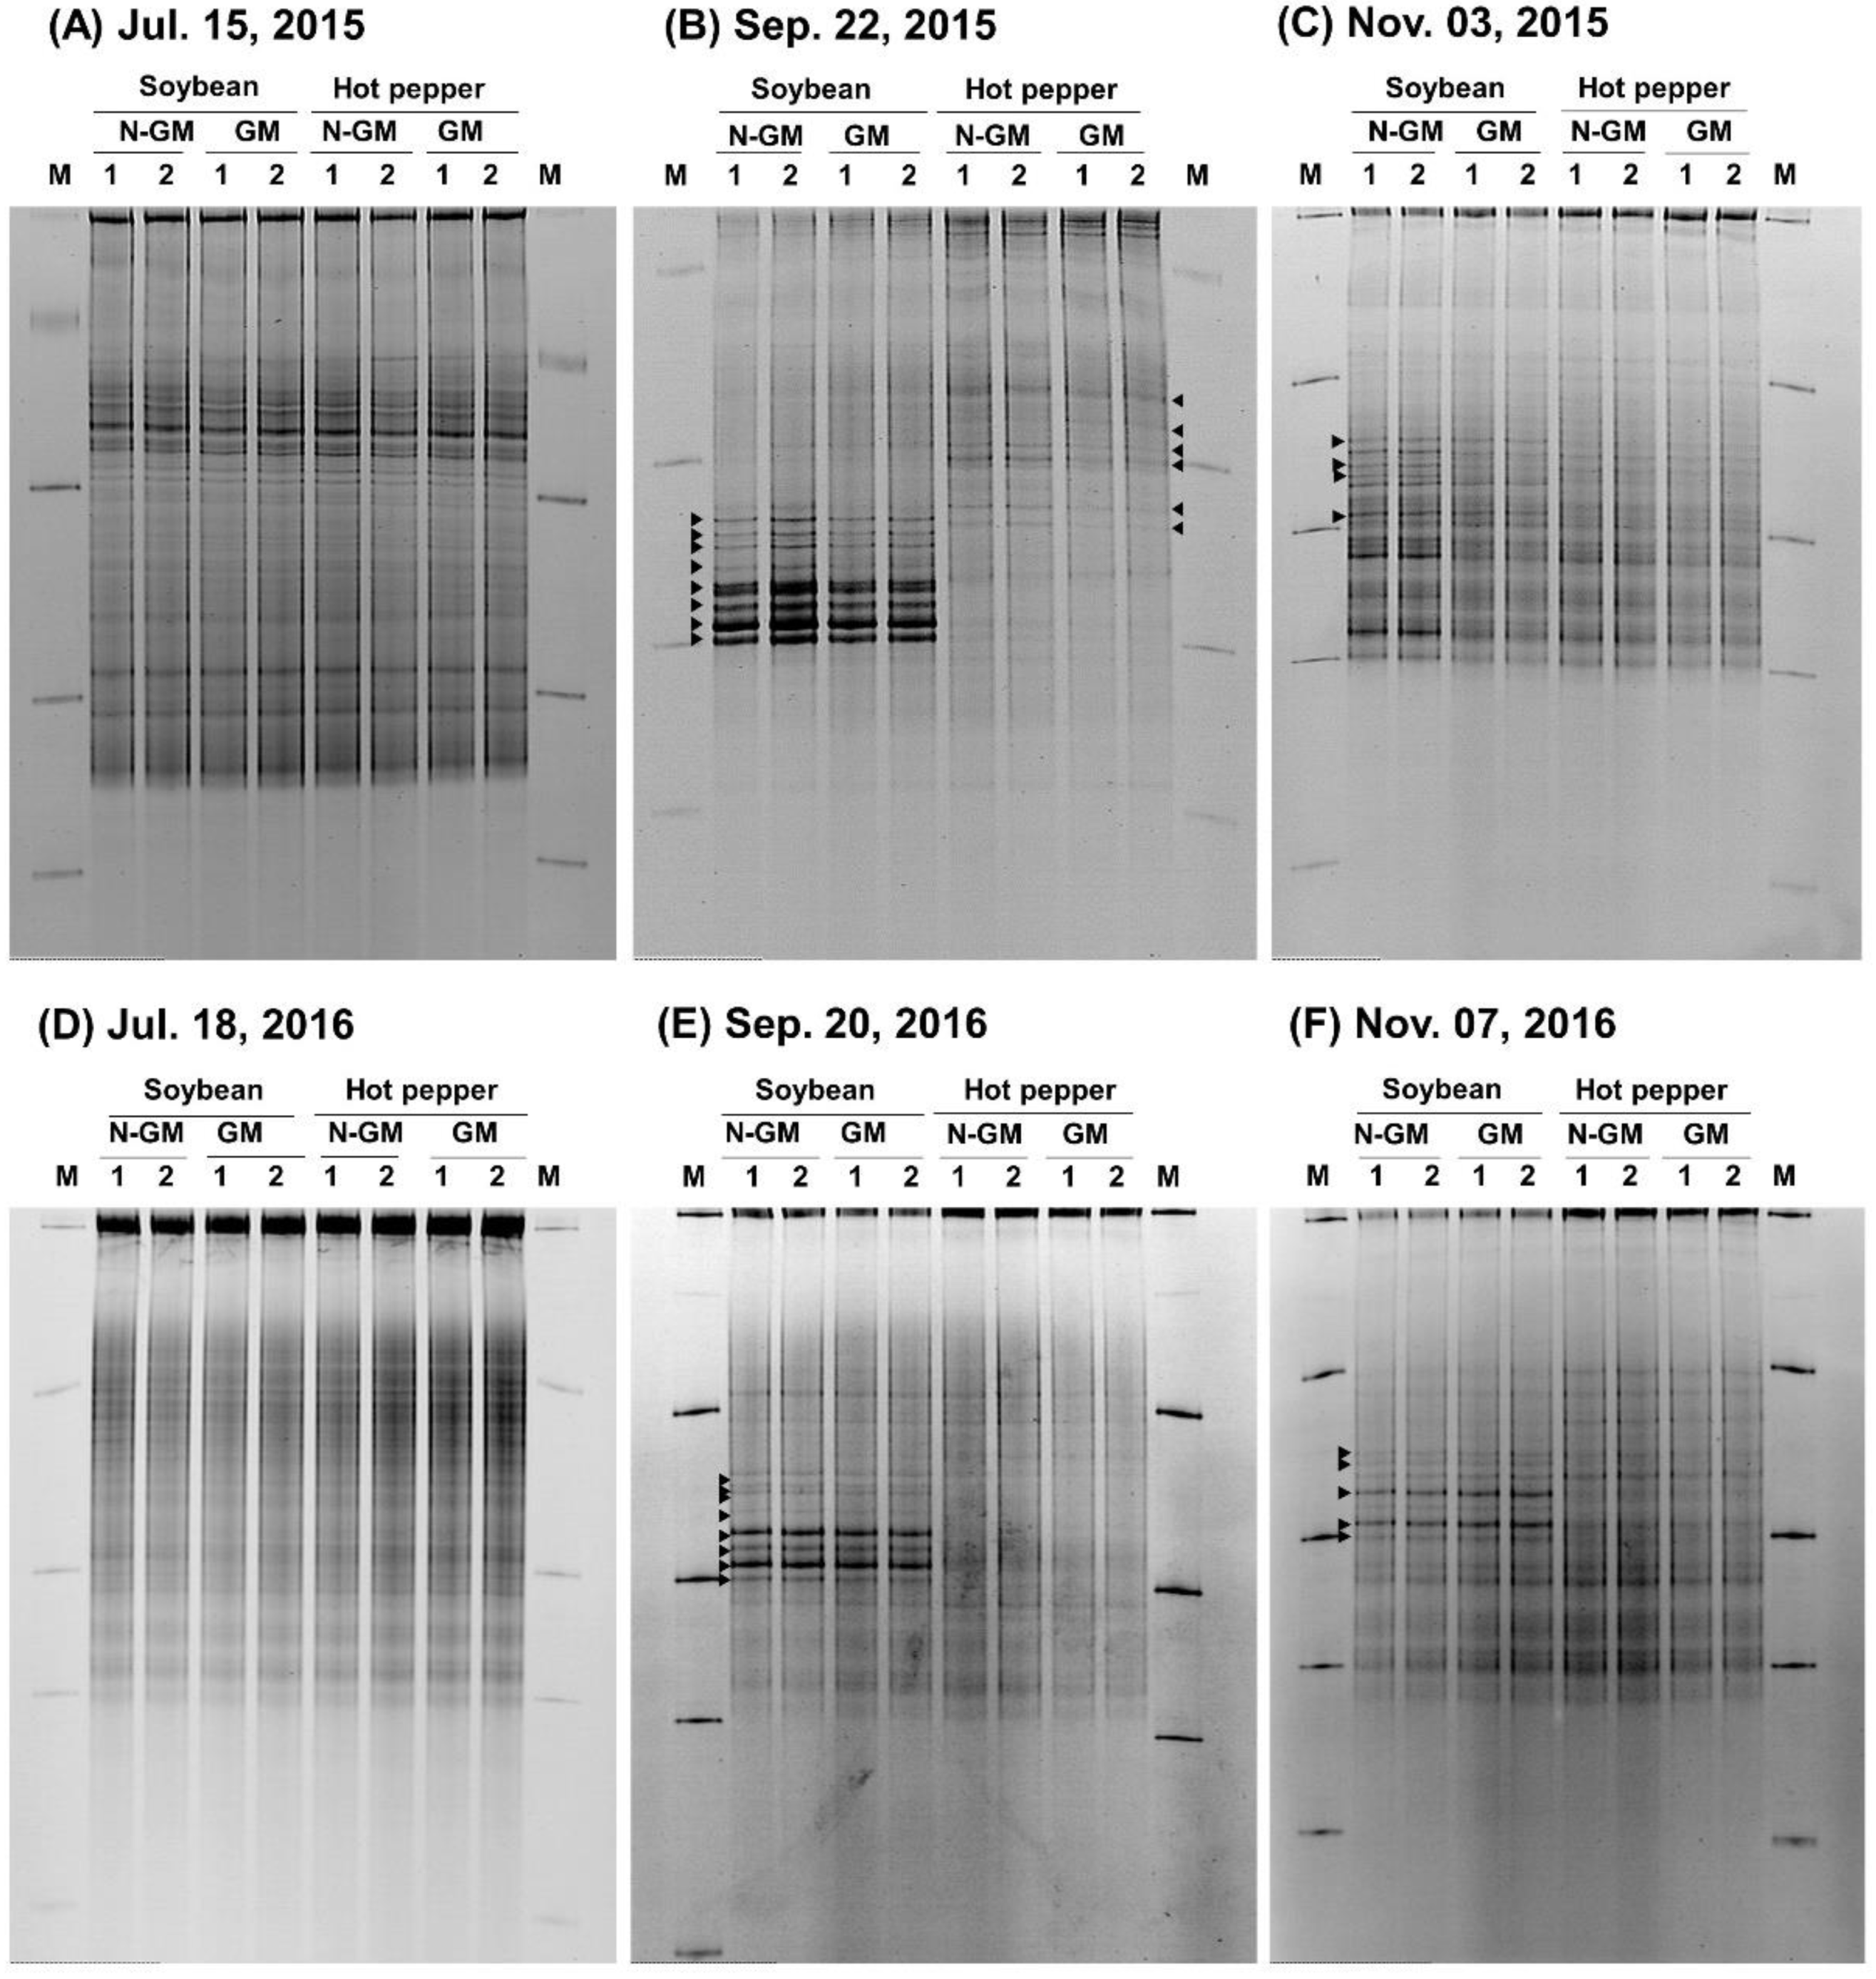
Figure 5 shows the results of the DGGE analysis of 16S rRNA gene and
Figure 6 shows the results of the DGGD analysis of the
nifH.
In the analysis of bacterial community structures using the DGGE approach, similar DGGE band patterns were observed in GM soybean, non-GM soybean, GM hot pepper, and non-GM hot pepper plots on 15 July 2015 and 18 July 2016 immediately after soybean and hot pepper transplanting (
Figure 5A,D). As crops grew, the differences in these DGGE band patterns began to appear between soybean and hot pepper. However, there were no significant differences between the soils with GM and non-GM crops except for irregular fluctuations due to the heterogeneity of soil samples (
Figure 5B,E). At the end of the experiment, the differences in DGGE band patterns between soybean and hot pepper observed in the previous period had almost disappeared. The intensity of the strong band indicating the difference between soybean and hot pepper soils was also weakened. As a result, the DGGE band patterns were similar at the end of the cultivation (
Figure 5C,F). The DGGE bands of 22 September 2015 and 25 August 2016, when the band variation was the greatest between the crops, were clustered and analyzed using the Dice correlation matrix and the unweighted pair group method. The eight lanes of DGGE patterns were divided into two groups of soybean and hot pepper. The similarities of the two groups were 79.85% on 22 September 2015 and 79.35% on 25 August 2016. Conversely, the similarities of GM and non-GM groups were more than 95%.
In the nitrogen-fixing bacteria community structures, similar DGGE band patterns were observed in the GM soybean, non-GM soybean, GM hot pepper, and non-GM hot pepper plots on 15 July 2015 and 18 July 2016 immediately after soybean and hot pepper transplanting (
Figure 6A,D). As crops grew, the high-intensity bands appeared only in GM and non-GM soybean soils. There were similar band patterns between GM and non-GM soils. Differences in band patterns were observed only between soybean and hot pepper soils (
Figure 6B,E). At the end of the experiment, the high-intensity bands in GM and non-GM soybean soils were weakened and the DGGE band patterns had become gradually similar between soybean and hot pepper soils (
Figure 6C,F). The DGGE profiles of 22 September 2015 and 20 September 2016, when the band variations were the greatest between crops, were clustered and analyzed using the Dice correlation matrix and the unweighted pair group method. The eight lanes of DGGE bands were divided into two groups of soybean and hot pepper, and the similarities of the two groups were 60.01% in 22 September 2015 and 72.17% on 20 September 2016. Conversely, the similarities of GM and non-GM groups were more than 95%. These results suggest that the microbial community structures were similar between GM and non-GM crops without being significantly affected by GM crops.
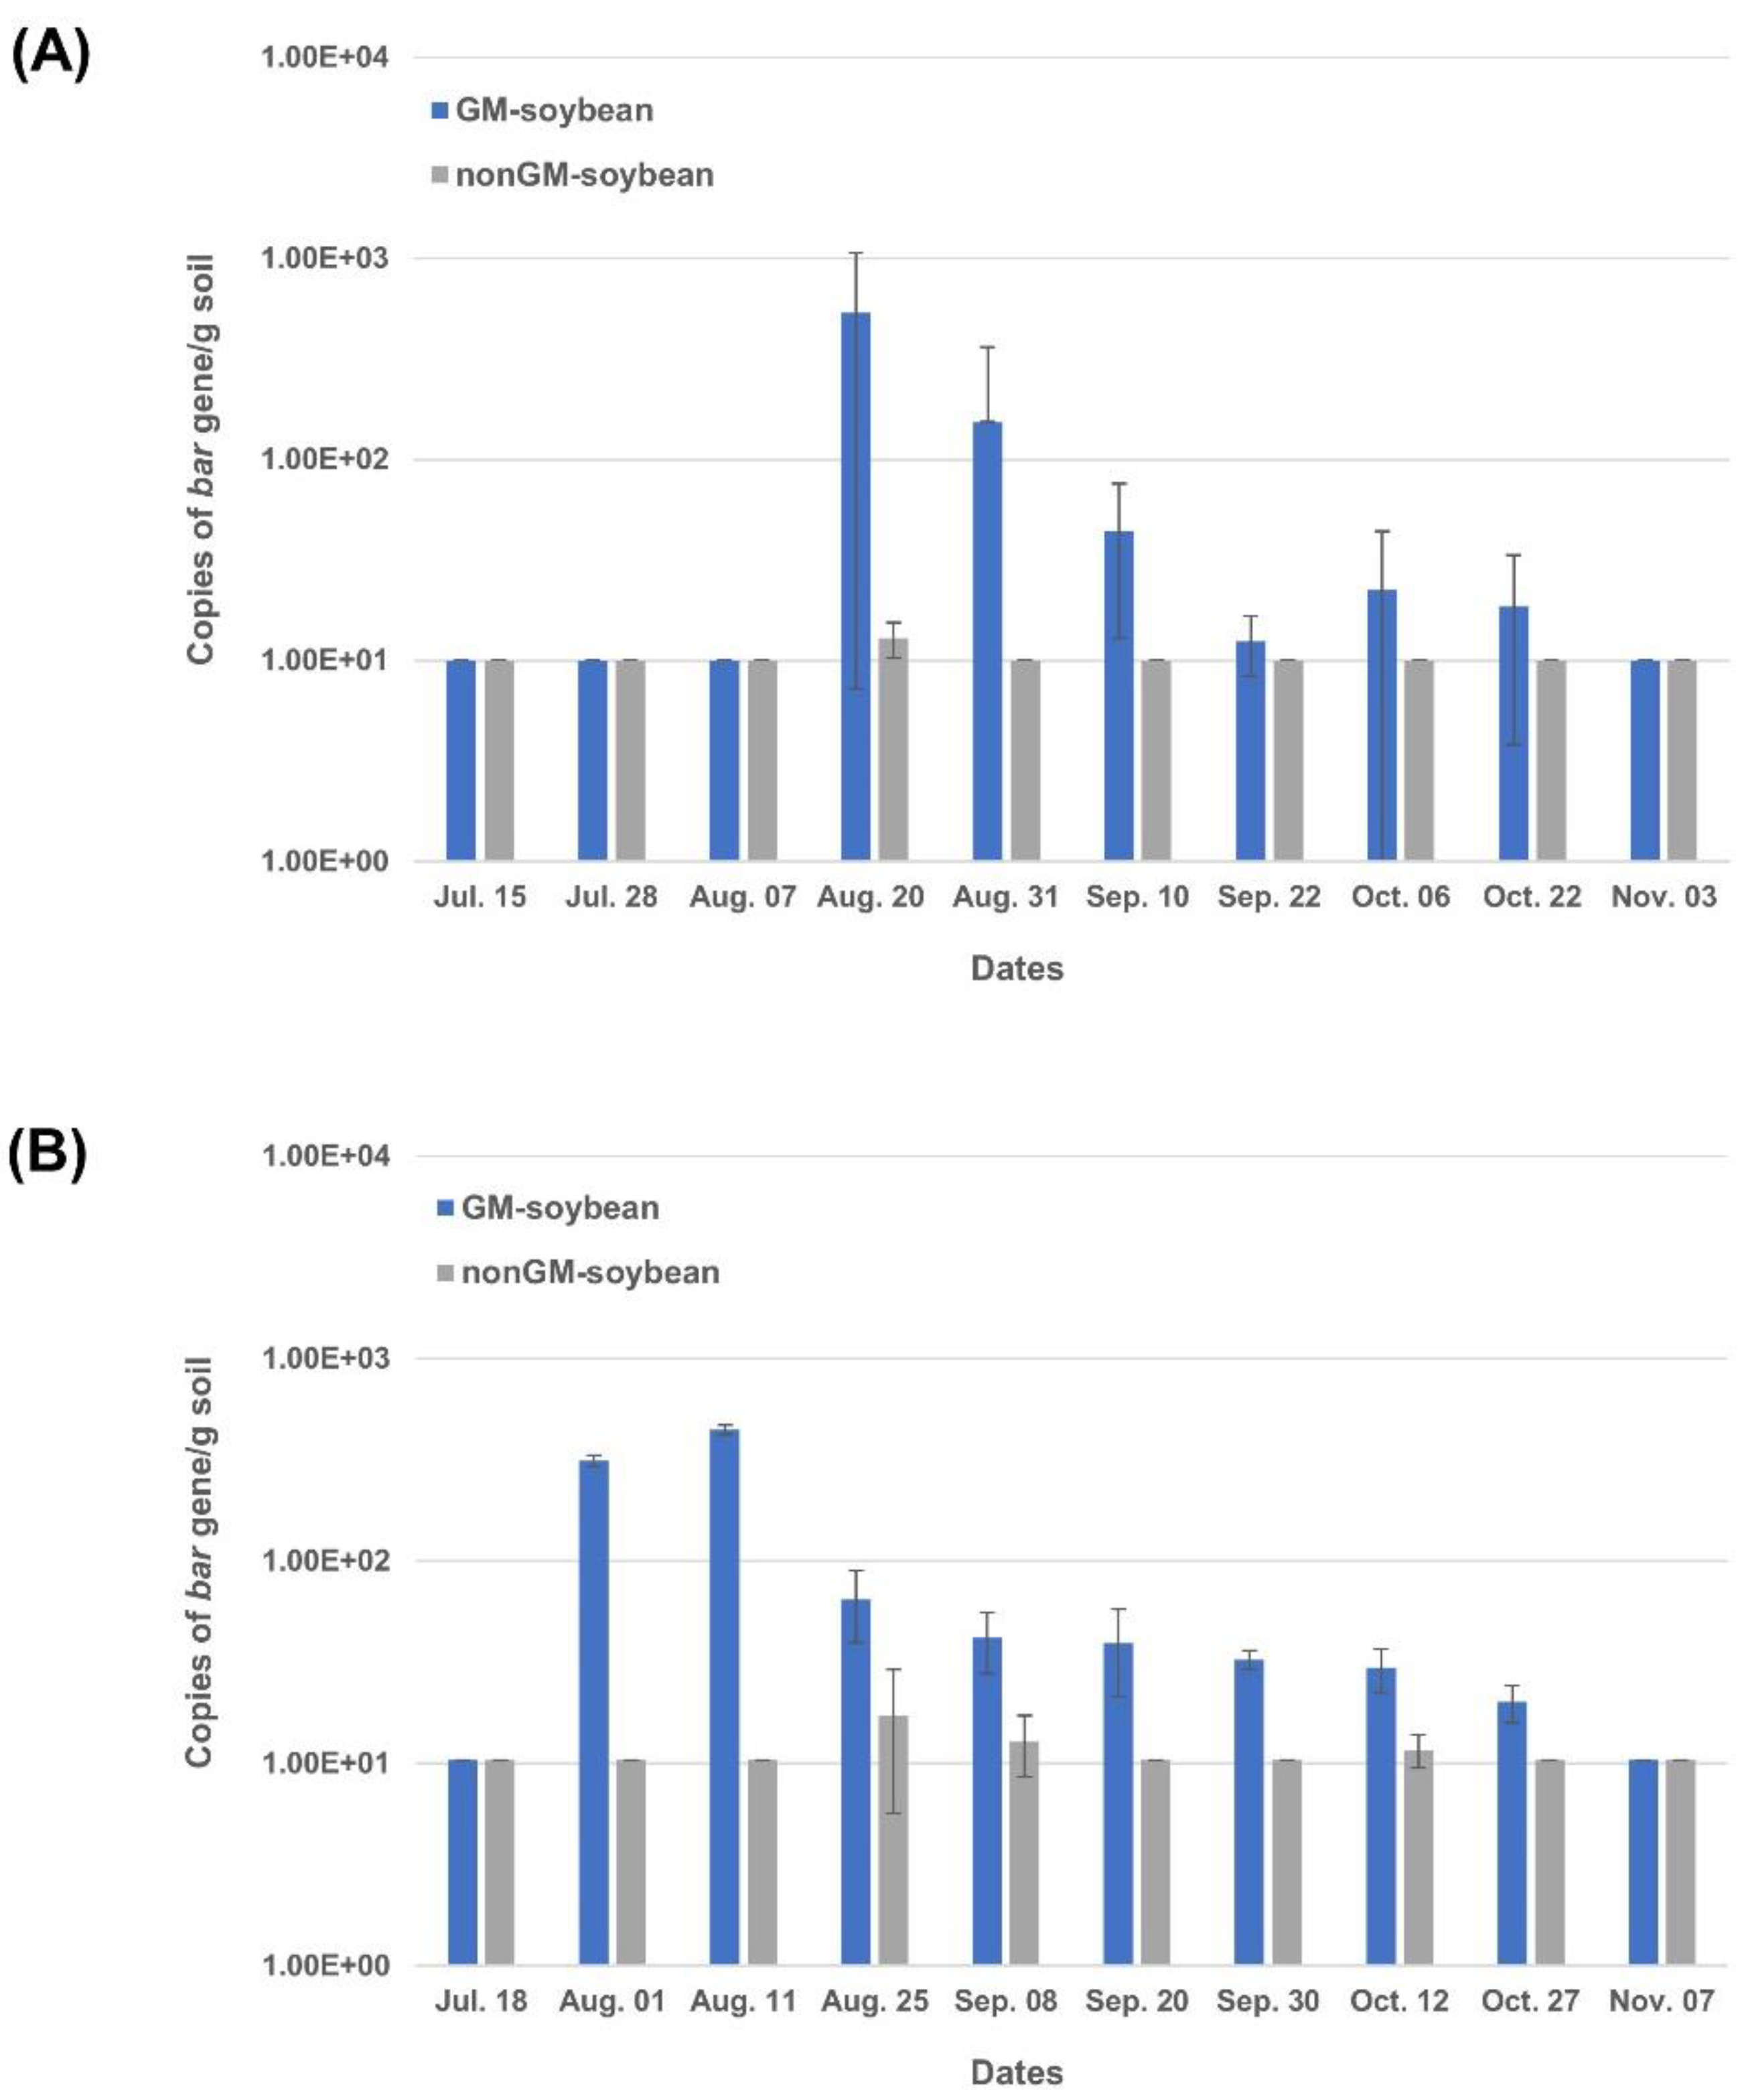
3.3. The Detection of bar Gene Persistence in Soybean and Hot Pepper Field Soils
The persistence of the recombinant
bar gene in soybean and hot pepper field soils was monitored by using a quantitative real-time PCR approach during the experimental periods. Changes in the residual levels of the
bar gene in the soybean field soils are shown in
Figure 7. In the GM soybean field, the original background levels of the glufosinate-resistant gene (
bar) introduced into the GM soybean were 1.01 × 10
1 copies/g soil on 15 July 2015 and 1.04 × 10
1 copies/g soil on 18 July 2016. Thereafter, the level of the
bar gene greatly increased more than about 10-fold compared to the initial background levels in the GM soybean field during the flowering stage of soybean. The increased levels of the
bar gene were 5.30 × 10
2 copies/g soil on 20 August 2015 and 3.13 × 10
2 copies/g soil on 1 August 2016. The levels of the
bar gene decreased to 4.42 × 10
1 copies/g soil on 10 September 2015 and 6.48 × 10
1 copies/g soil on 25 August 2016, respectively. Its level gradually recovered to the initial background level with 1.01 × 10
1 copies/g soil on 3 November 2015 and 1.04 × 10
1 copies/g soil on 7 November 2016. Conversely, the non-GM soybean field was not affected by the
bar gene. The levels of the
bar gene were maintained in the constant range of 1.01 × 10
1–1.74 × 10
1 copies/g soil during the experimental periods.
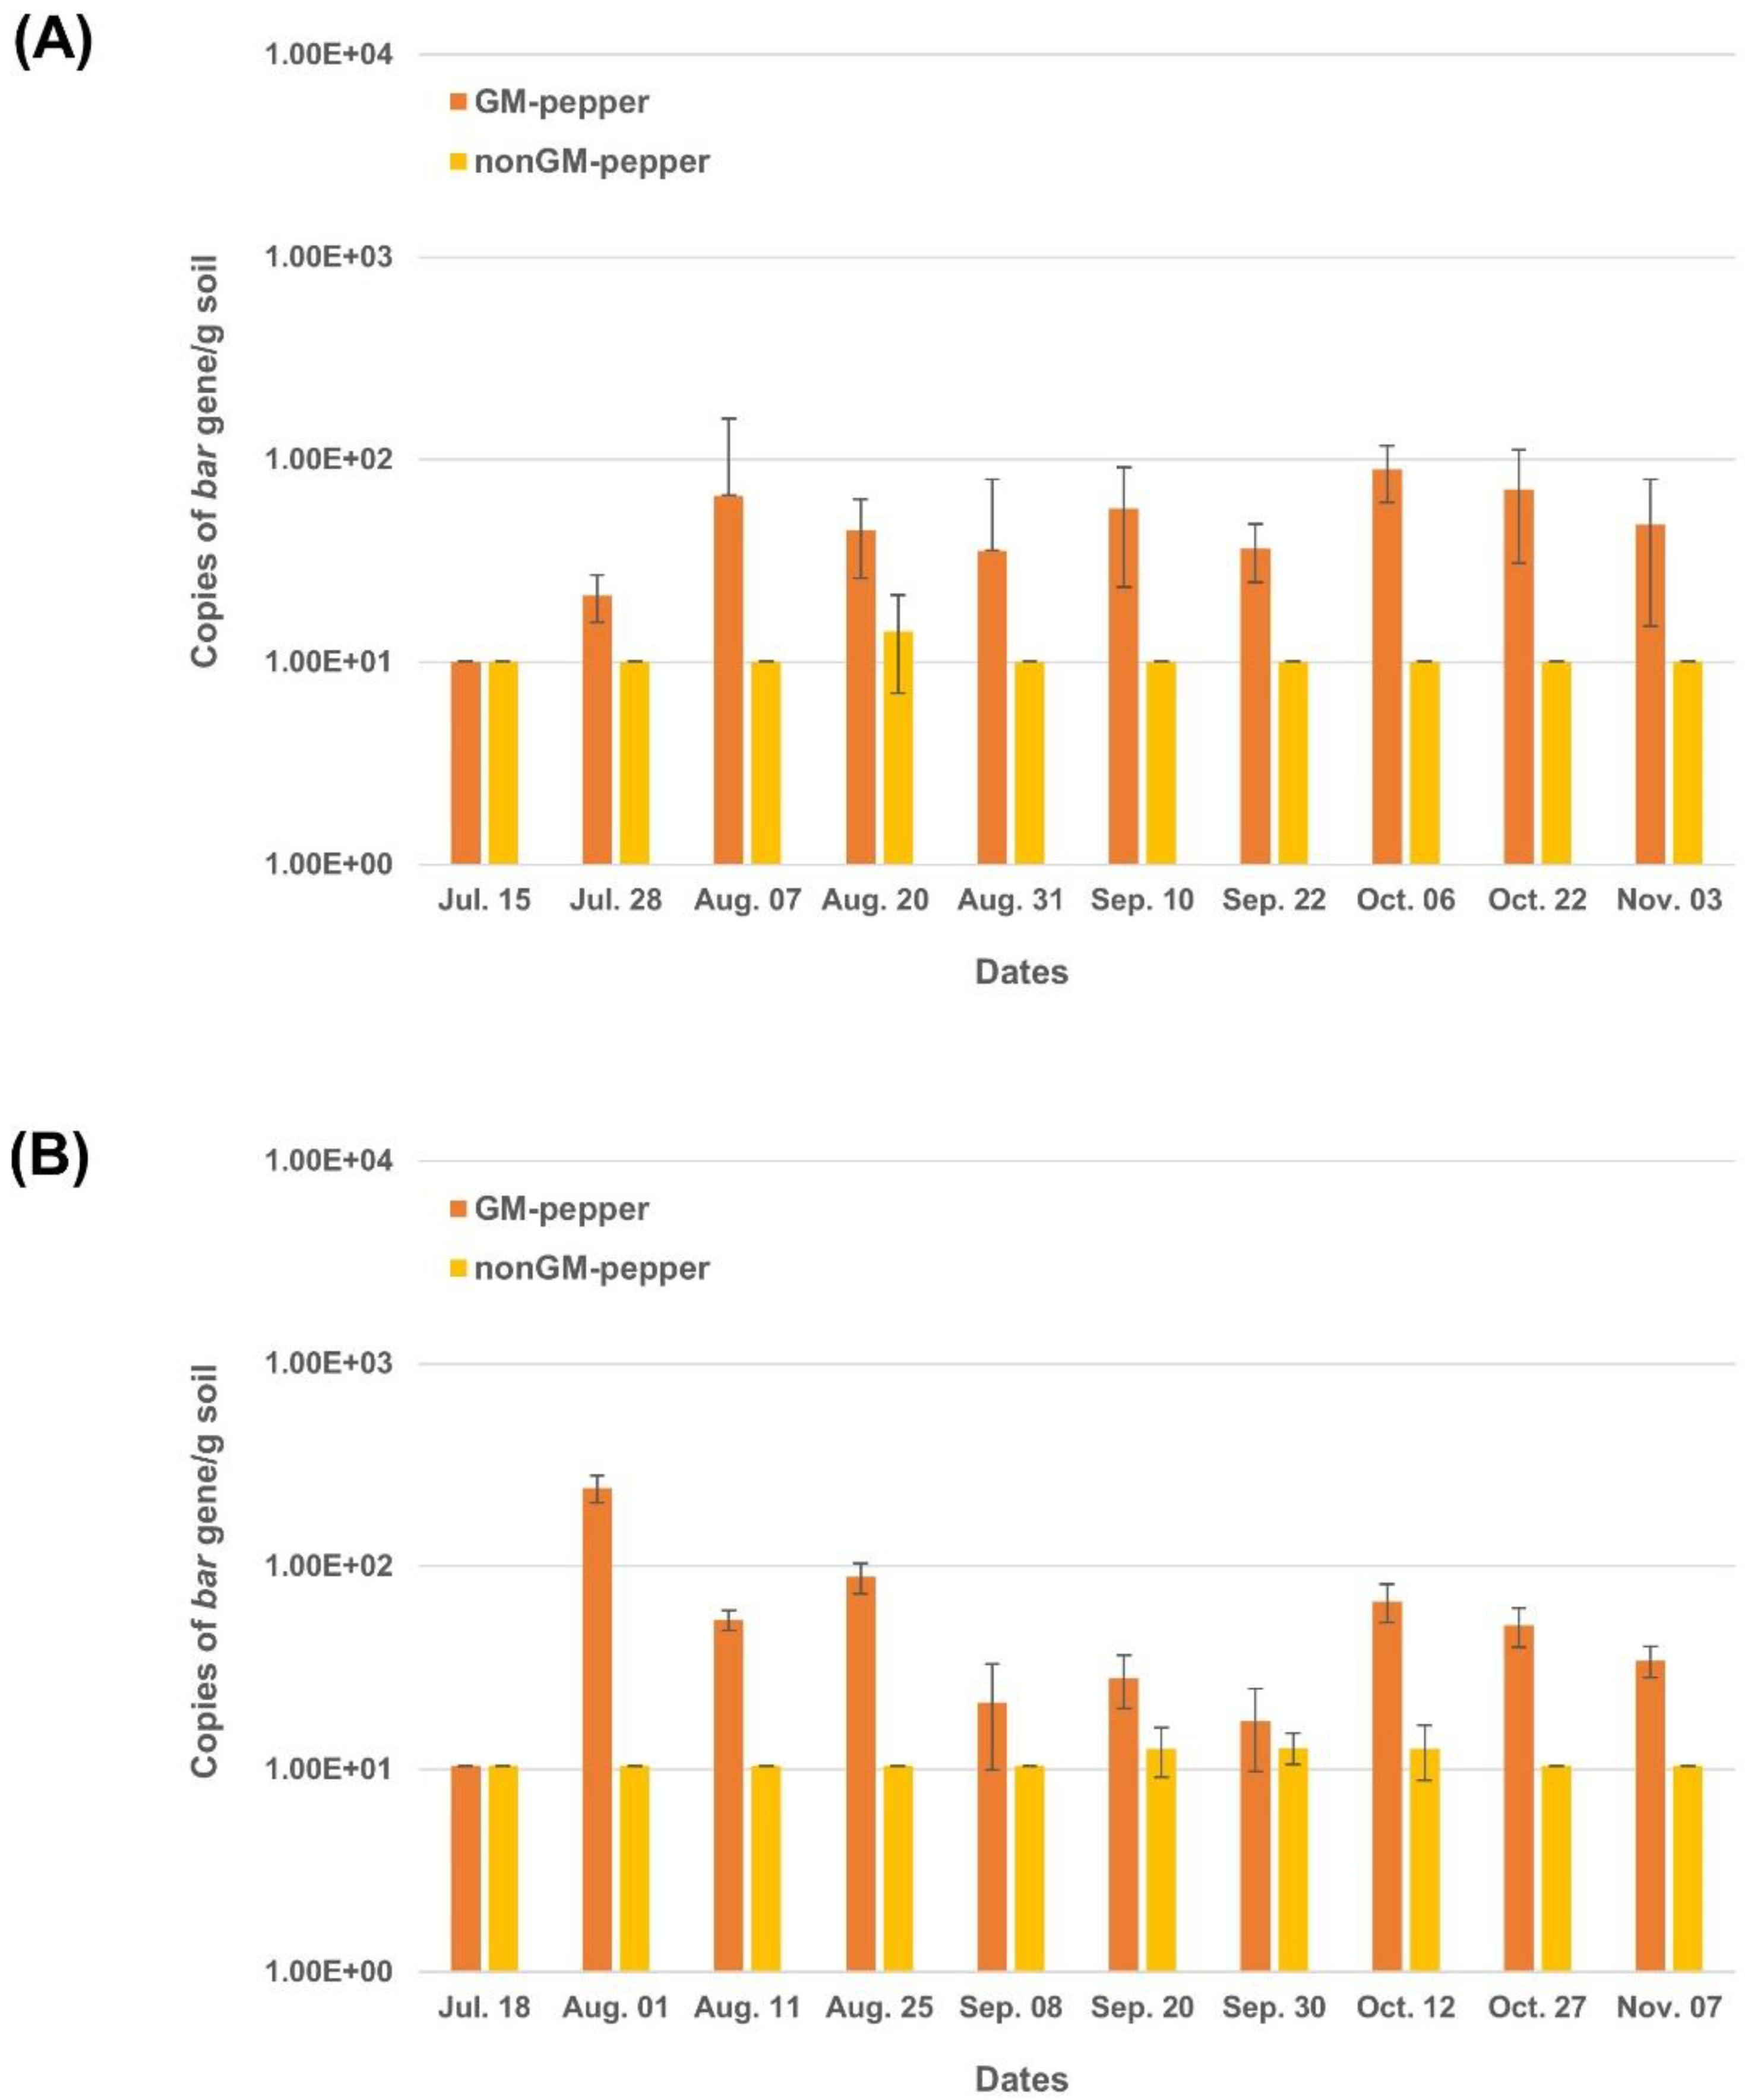
Changes in the residual levels of the
bar gene in the hot pepper field soils are shown in
Figure 8. In the GM hot pepper field, the levels of the
bar gene in 2015 and 2016 repeatedly increased and decreased about four times with flowering. The original background levels of the
bar gene were 1.01 × 10
1 copies/g soil on 15 July 2015 and 1.04 × 10
1 copies/g soil on 18 July 2016. Thereafter, when the hot peppers bloomed, these levels increased to 6.64 × 10
1 copies/g soil on 7 August 2015 and 2.43 × 10
2 copies/g soil on 1 August 2016. The increased levels decreased again to 3.55 × 10
1 copies/g soil on 31 August 2015 and 5.43 × 10
1 copies/g soil on 11 August 2016. Then, the residual levels of the
bar gene repeatedly increased with flowering and decreased in the range of 3.64 × 10
1–8.93 × 10
1 copies/g soil and 1.73 × 10
1–6.70 × 10
1 copies/g soil in 2015 and 2016, respectively.
Conversely, the non-GM hot pepper field was not affected by the bar gene. The levels of the bar gene remained in the constant range of 1.01 × 101–1.42 × 101 copies/g soil during the experimental periods. These results suggested that some of the transgenes were released from the GM crops into the field soil depending on the flowering stage. The flowering of GM soybean and hot pepper caused the bar gene to flow into the cultivated rhizosphere soils. In the case of hot pepper, approximately four flowering stages were observed during the entire cultivation period, while the soybean had a single flowering stage. The bar gene released into the soils was temporarily increased but tended to have decomposed by the time of harvest.
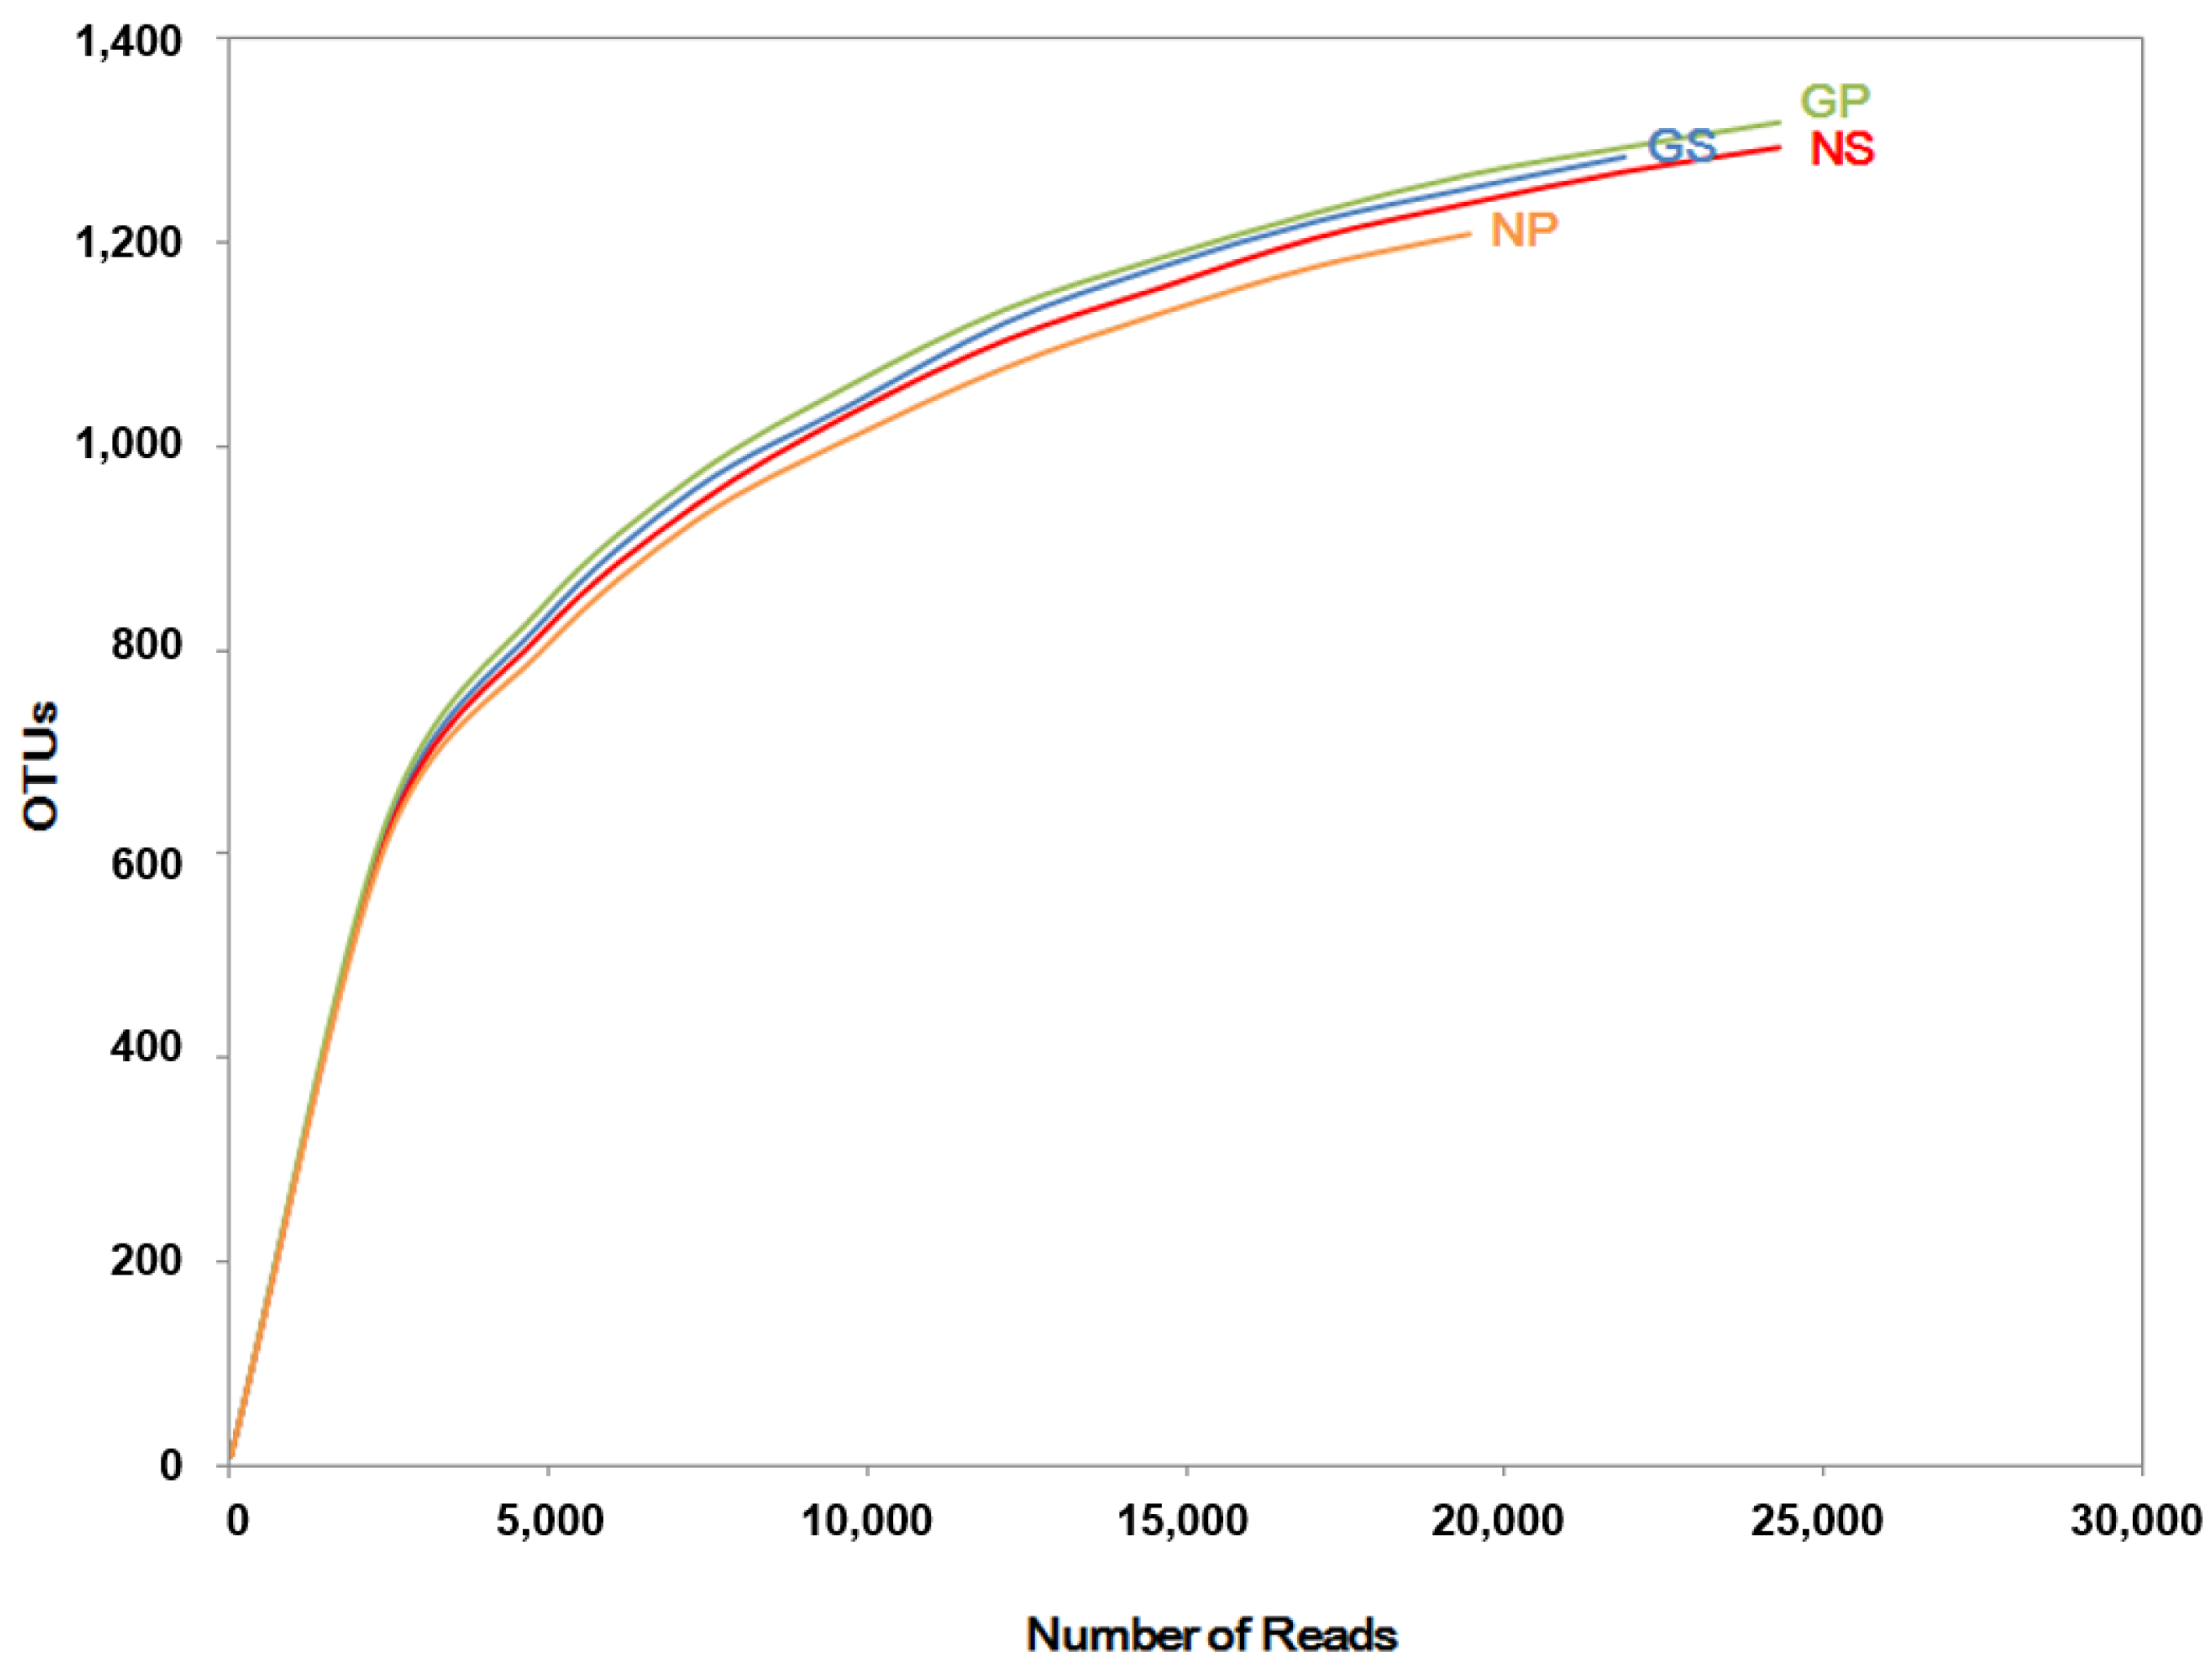
3.4. OTU-Based Microbial Community Profiles
Operational taxonomic unit (OTU)-based profiles were analyzed to assess the GM crops on soil bacterial communities with soil samples of 7 November 2016. The total number of 93,624 reads and 5140 OTUs in 16S rDNA clone libraries were obtained through Illumina MiSeq sequencing analysis. The species richness in soil samples was estimated, based on the construction of the rarefaction curve (
Figure 9). The rarefaction curves constructed from clone libraries of the GM soybean (GS), non-GM soybean (NS), GM hot pepper (GP), and non-GM hot pepper (NP) approached the saturation plateau, showing similar trends. The rarefaction curves of each sample indicated a low gap in the total number of the OTUs.
The diversity indices were calculated by the Chao1, Shannon, and Simpson Indices based on the richness and evenness of the OTUs (
Table 1). The total OTUs of GS, NS, GP, and NP ranged from 1209 to 1329 in a total of 5140 OTUs (
Table 1). To evaluate the difference in species diversity between GM and non-GM crops, an ANOVA analysis was performed with Chao1, Shannon, and Simpson Indices. The result of the ANOVA analysis indicated that the bacterial diversity was not significantly different between the GM and non-GM crops (
p > 0.05).
These results suggest that GM crops had no effects on the soil bacterial community structure.
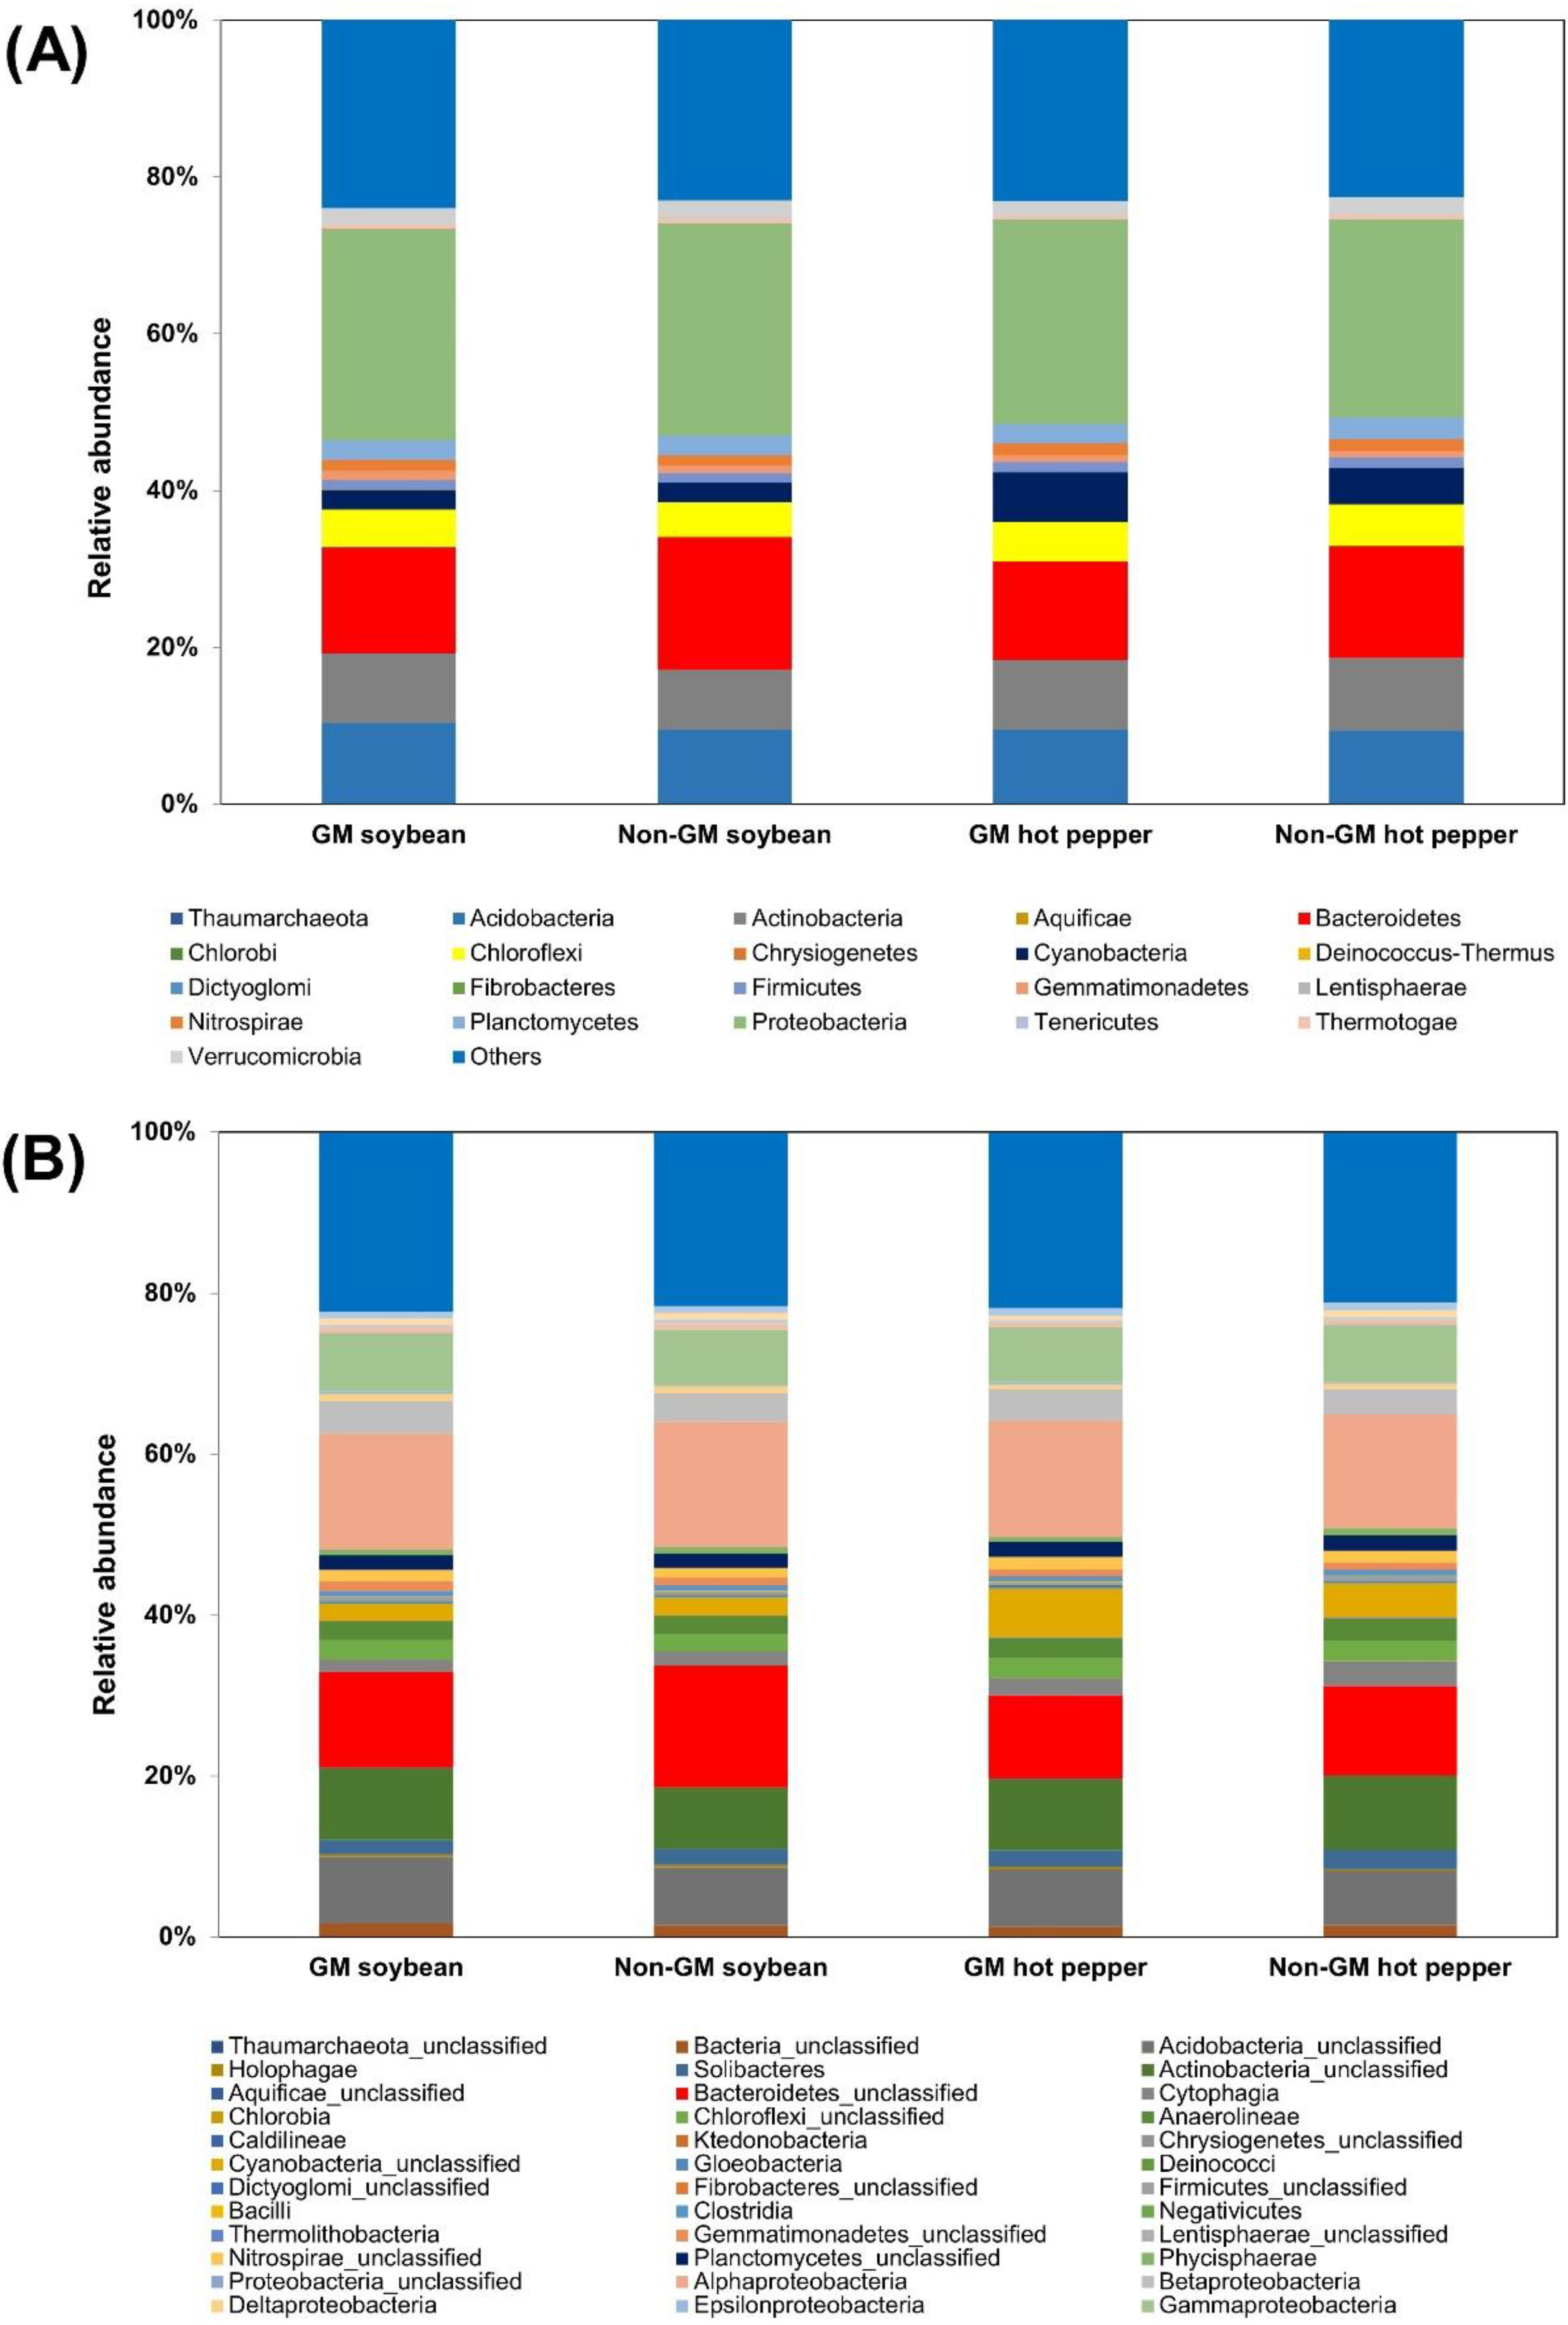
3.5. Taxonomic Composition of the Bacterial Communities in Soybean and Hot Pepper Subplots
The 16S rRNA gene sequences from the communities were identified and classified to assess the differences in bacterial distribution between GM and non-GM crops.
The relative bacterial community abundances at the phylum and class levels are illustrated in
Figure 10. A total of 21 phyla and 36 classes were observed in all soil samples.
Proteobacteria,
Bacteroidetes,
Acidobacteria, and
Actinobacteria were the predominant phyla in common and accounted for more than 55% of the total libraries of each sample. The percentages of
Proteobacteria, the most abundant phylum, in GM soybean, non-GM soybean, GM hot pepper, and non-GM hot pepper were 26.94%, 27.03%, 26.09%, and 25.27%, respectively.
Bacteroidetes, the second most abundant phylum, accounted for 13.46% (GM soybean), 16.92% (non-GM soybean), 12.52% (GM hot pepper), and 14.24% (non-GM hot pepper) of all libraries (
Figure 9). The compositions of the bacterial community at phylum level were not significantly different except for slight differences between GM and non-GM soils.
Further analysis of the relative bacterial community abundance at the class level showed that
Alphaproteobacteria was the most predominant class among the libraries (
Figure 10). The percentages of
Alphaproteobacteria were 14.44% (GM soybean), 15.58% (non-GM soybean), 14.50% (GM hot pepper), and 14.18% (non-GM hot pepper), respectively.
Bacteroidetes_unclassified,
Actinobacteria_unclassified, and
Gammaproteobacteria were the dominant classes. The compositions at class level were not significantly different between the GM and non-GM soils, just as at the phylum level. These results suggest that there were no significant differences between the GM and non-GM crop lines in the composition of the bacterial community structures, and the GM crop did not affect the soil bacterial community structure.
4. Discussion
As transgenic crops continue to increase, the many concerns about their adverse impacts on soil microbial communities are controversial. There are various methodological tools to analyze soil microbial community structures including culture-dependent methods, such as viable plating count, and culture-independent methods, such as denaturing gradient gel electrophoresis (DGGE), terminal restriction fragment length polymorphism (T-RFLP), community level physiological profiling (CLPP), substrate-induced respiration technique (SIR), phospholipid fatty acids (PLFA), fatty acid methyl ester (FAME), and enzymatic activity [
25,
26]. Based on these tools, a lot of studies to assess the influence of transgenic plants on soil microbial communities have been actively conducted and debated. Some previous studies showed that soil microbial communities were influenced by transgenic plants [
5,
6,
7].
Conversely, many researches have suggested that there were no or minor changes in microbial communities, and the differences between GM and non-GM plants were temporary [
13,
14]. Additionally, it was reported that the microbial catabolic activity was not affected by GM crops when compared with non-GM crops [
27,
28]. In the case of glufosinate-tolerant plants, glufosinate ammonium-tolerant canola affected the microbial community compared to the non-GM line [
8]. On the other hand, there were no significant differences in the soil microbial communities between transgenic maize and its non-transgenic cultivar [
29]. The effects of glufosinate-tolerant oilseed rape were also minor compared to the non-GM line [
30].
In this study, we assessed the impact of glufosinate-tolerant transgenic soybean and hot pepper on soil microbial communities, using the culture-dependent plating method, real-time PCR-DGGE, quantitative real-time PCR, and OTU-based community profiling with the Illumina MiSeq platform.
In the culture-dependent method, total counts of the bacteria, actinomycetes, and fungi were measured between GM and non-GM crops. Free-living nitrogen-fixing bacteria and the Rhizobium were also estimated to evaluate the effect of transgenic crops on specific microorganisms. The results showed that the microbial dynamics of GM subplots were quite similar compared to non-GM subplots. Only the density of the Rhizobium associated with legume plants increased in soybean soils.
Our previous study suggested that there were no meaningful differences in microbial community levels between GM and non-GM rice soils [
31]. Similarly, no differences were detected in this study.
The culture-dependent method is simple and useful, but molecular approaches should be performed concurrently due to limits in the cultivation of whole soil microorganisms and the detection of accurate impacts. Next, the amplified 16S rRNA and
nifH gene fragments were analyzed using improved DGGE fingerprint methods from total soil DNA [
16]. DGGE has great resolving power to analyze the microbial community in soil [
32]. The results showed that there were no significant differences in DGGE band patterns between GM and non-GM lines even though slightly differences could be detected due to soil heterogeneities. The DGGE band dendrogram showed that there were only obvious differences between crops (soybean and hot pepper), not between GM and non-GM lines.
The previous studies using glufosinate-tolerant oilseed rape and rice also showed that there were no or minor differences compared with non-GM lines [
30,
31]. To obtain more detailed data, the OTU-based community analysis was also performed because it is difficult to analyze the differences in the related species using the DGGE approach. 16S rRNA gene sequence libraries obtained from each soil sample were compared to evaluate the differences in GM and non-GM lines at the end of the experiment. The taxonomic distributions of four subplots based on the phylum and class levels were similar between GM and non-GM lines. There was only a slight gap between crops. The bacteria belonging to
proteobacteria phylum was the most abundant in all four libraries. There were no statistically significant differences between GM and non-GM lines. The results suggest that the bacterial community structure was not significantly affected by the glufosinate-tolerant soybean and hot pepper.
To investigate the persistence of the
bar gene introduced into GM soybean and hot pepper in experimental field soils, quantitative real-time PCR was performed. The persistence of the transgenic gene in soil has the possibility of creating potential risks for the environment over a long period of time [
3]. It has already been reported that transgenic DNA is detectable for several months [
4,
33]. However, the level of transgenic DNA, rNPT-II, was reduced in the range from 0.03% to 0.14% compared to its beginning level at the end of the experiment [
33]. Likewise, in this study, the level of the
bar gene that escaped from the GM soybean was initially increased more than 10 fold in soils, but its level gradually decreased to the initial level. In the case of GM hot pepper, the level of the
bar gene was repeatedly increased and decreased about four times in the soil. The amount of the
bar gene was observed to increase depending on the flowering stages of the GM hot pepper. The soybean bloomed once, but the hot pepper bloomed about four times during the cultivation. Although the released
bar gene was gradually degraded by the end of the experiment, it was still detectable. Therefore, it is necessary to verify whether the gene is completely degraded or not by a long-term experiment.
5. Conclusions
This study assessed the impacts of GM soybean and hot pepper containing the glufosinate-resistant gene (bar) on soil microbial communities and monitored the persistence of the transgene in the rhizosphere soil. Changes in the microbial density and variations in the microbial community structure were analyzed by a culture-dependent plating method and molecular methods such as DGGE profiles and amplicon-based community profiling using the Illumina MiSeq platform. A quantitative real-time PCR procedure was used to monitor the persistence of the bar gene in the rhizosphere soil.
The cultural method, DGGE analysis, and the amplicon-based community profile indicated that soil microbial communities were not significantly different between GM and non-GM lines. The level of the bar gene in GM soybean plots greatly increased when the crops were actively growing, but thereafter gradually decreased to the initial level. Meanwhile, the level of the bar gene in GM hot pepper plots repeatedly increased and decreased according to the flowering stages. These results indicate that soil microbial community structures were not significantly affected.
In conclusion, this study shows that the bacterial communities of the experimental field soils were not significantly affected by the cultivation of GM soybean and hot pepper. There were no meaningful differences between GM and non-GM lines based on culture-dependent and molecular approaches. However, the released bar gene in the soil was not completely degraded at the end of the experiment. Therefore, further studies are required to assess the impacts on the soil environment of the residual transgenes that escape from GM plants.


