Article

Effect of Conical Spiral Flow Channel and Impeller Parameters on Flow Field and Hemolysis Performance of an Axial Magnetic Blood Pump

1
School of Mechanical and Electronic Engineering, Wuhan University of Technology, Wuhan 430070, China
2
Hubei Provincial Engineering Technology Research Center for Magnetic Suspension, Wuhan 430070, China
*
Author to whom correspondence should be addressed.
Submission received: 15 January 2022 / Revised: 7 April 2022 / Accepted: 19 April 2022 / Published: 26 April 2022
(This article belongs to the Topic Modern Technologies and Manufacturing Systems)

Abstract

:
For a blood pump, the blood flow channel and impeller parameters directly affect the performance of the pump and the resulting blood circulation. The flow channel in particular has a great impact on the hydraulic performance of the pump (e.g., flow and pressure), which directly determines the overall performance of the blood pump. Traditional bearing-supported blood pumps can cause mechanical damage to blood cells, leading to hemolysis and thrombosis. In this study, therefore, we designed a conical spiral axial blood pump with magnetic levitation. The blood pump was supported by electrodynamic bearings in the radial direction and electromagnetic bearings in the axial direction. The impeller and the front and rear hubs were integrated to minimize blood stagnation and reduce the formation of thrombosis. The hub had a conical spiral flow channel design, which not only reduced the size of the impeller but also increased blood flow and pressure while meeting the design requirements. Computational fluid dynamics (CFD) analysis was used to analyze the flow field of the axial blood pump, a power function model was used to establish a hemolysis prediction model, and the particle tracking method was used to obtain the flow trajectories of individual blood cells, thereby predicting hemolysis-related performance of the blood pump. The simulation results showed that the main high shear stress area in the blood pump was located in the impeller inlet and the clearance between the top of the impeller and the inner chamber of the blood pump. When the hub taper angle of the blood pump was 0.72° and the clearance was 0.3 mm, the average hemolysis prediction value was 0.00216. This prediction value was smaller than that of traditional axial blood pumps. These findings can provide an important reference for the structural design of axial blood pumps and for reducing the hemolysis prediction value.

1. Introduction

Heart disease is currently a major cause of death. About one-fifth of heart disease cases each year eventually develop into heart failure [1,2]. Due to a shortage of donors, most patients with heart disease cannot be effectively treated right away, but a ventricular assist device (VAD) can usually buy time for patients until a suitable donor is found [3,4]. However, when the blood pump is operating in the human body, if the incidental destruction of red blood cells by the pump exceeds the renewal rate of red blood cells in the body, the ability of oxygen transmission and carbon dioxide removal can be seriously affected, resulting in insufficient oxygen supply to organs and tissues, and even death [5,6]. Currently, the axial blood pump has evolved to a third-generation magnetic design [7,8]. Turbulent-like hemodynamics with prominent cycle-to-cycle flow variations have received increased attention as a potential stimulus for cardiovascular diseases [9]. Although the problems of hemolysis and thrombosis due to wear of the mechanical bearings have been solved, the difficulty of implantation due to the large size of blood pumps remains. Moreover, despite the great progress in blood pump design, experimental studies and clinical applications have shown that all blood pumps have the potential to cause hemolysis to varying degrees. Hence, continuum-level modeling of hemolysis is likely to be useful well into the future for designing typical cardiovascular devices [10].
In a magnetic blood pump, magnetic bearings generate electromagnetic forces that support the rotor. Therefore, a magnetic blood pump has the advantages of no mechanical contact and no need for lubrication, and it successfully solves the problem of blood cell damage by the mechanical bearings in traditional axial blood pumps. According to their working principles, magnetic bearings can be divided into two types: active magnetic bearings (AMBs) [11] and passive magnetic bearings (PMBs) [12]. AMBs rely on the attraction between ferromagnetic materials and electromagnets (coils and iron cores), whereas PMBs rely on the repulsive force between permanent magnets and/or between the conductive surface and permanent magnets. Since PMBs use permanent magnets and do not require sensors and control circuits, they can be smaller than AMBs [13].
Zhou et al. [14] analyzed the distribution of blood flow in the blood pump flow channel of a self-made axial-flow blood pump and used an optimized model to predict blood pump hemolysis. The results showed that the shear stress in the blood pump flow channel was low. The part of the flow channel with a stress below 200 Pa accounted for the vast majority of the flow channel volume, and the high shear stress was mainly distributed in the gap between the outer diameter of the impeller and the inner wall of the blood pump; the predicted hemolysis value of the blood pump was 0.0057. Chen et al. [15] studied centrifugal blood pumps with different impeller forms and used the rapid hemolysis model to analyze the hemolytic performance of the blood pumps. The results indicated that blood pumps with helical impellers had better performance. Hao et al. [16] of Central South University conducted a computational fluid dynamics (CFD) simulation analysis of an axial-flow blood pump, described the hemolytic performance of the blood pump according to the hemolytic mathematical model, and obtained an average hemolytic predicted value of 0.0047.
In this study, to reduce the size of the blood pump, a conical spiral axial blood pump was designed, with electrodynamic bearings used for support in the radial direction and electromagnetic bearings used for support in the axial direction. In addition, the impeller and the front and rear hubs were integrated to minimize the blood stagnation area, thereby reducing the formation of thrombosis. The hub was given a conical shape, and the distance from the hub to the edge of the inner chamber gradually decreased. Under the condition of meeting design requirements, the size and speed of the impeller were reduced, which helped reduce the hemolysis phenomenon. Referring to the research results of other scholars, a simulation was conducted to solve the influence of the geometric parameters of the non-flow channel on the performance of the blood pump, and the simulation results with the best effect were selected to determine the optimal geometric parameters for the blood pump [17]. Furthermore, hemolysis in the blood pump was analyzed and discussed, and the hemolysis performance of the blood pump under the optimal geometric parameters was discussed from multiple perspectives to determine the feasibility of the blood pump design. Ultimately, achievable parameters of the blood pump were obtained.

2. Model of the Conical Spiral Axial Magnetic Blood Pump

2.1. Structure of Conical Spiral Axial Blood Pump

The structure and dimensions of the conical spiral axial blood pump with magnetic levitation are shown in Figure 1. A model of the axial blood pump and a photograph of its impeller are presented in Figure 2. In order to realise five-degree-of-freedom levitation, the pump was supported by electrodynamic radial bearings in the radial direction and electromagnetic bearings in the axial direction. The electrodynamic radial bearings controlled the radial displacement of the rotor, which means the rotor was fully levitated in four degrees of freedom, including two translations ( x , y ) and two rotations ( x , y ). The electromagnetic axial bearing controlled the axial displacement of the rotor, which means the rotor was controlled in the other axis of translation ( z ). The impeller and the front and rear hubs were integrated, and the impeller hub was tapered. In order to ensure the bearing capacity of the electrodynamic radial bearings, the taper angle should not be too large. The front and rear guide wheel blades were fixed in the inner chamber of the blood pump. The bearings realised rotor suspension, which eliminated mechanical contact and reduced hemolysis caused by mechanical friction [18]. The total length of the blood flow channel was 70 mm, and the diameter was 30 mm, which were smaller than the dimensions of traditional axial blood pumps. Hence, the conical spiral axial blood pump would be convenient for implantation [19].

2.2. Principle of Electrodynamic Suspension Bearing

Electrodynamic bearings can be divided into radial bearings and axial bearings. When the conductive rotor rotates in the magnetic field generated by the permanent magnet, eddy currents are induced on the rotor. As a result, a magnetic field that is opposite to the direction of the magnetic field of the permanent magnet is generated, thereby generating a repulsive force between the rotor and the static permanent magnet [20,21]. The displacement of the rotor remains constant due to the repulsive force. Therefore, the rotor rotates around the center axis of the permanent magnet, and its clearance from the permanent magnet does not change.
The electrodynamic radial bearing used in this study, shown in Figure 3, consisted of a conductive cylinder fixed on a rotating shaft. The permanent magnets were stacked between the iron rings, and there was an inward or outward magnetic flux that was parallel to the axis in the air clearance between the stator and the rotor. The radial displacement of the rotor was balanced by the joint action of the attractive force and repulsive force. Therefore, the rotor always maintained the same clearance from the permanent magnet while rotating around the centre axis.

2.3. Conical Flow Channel

An axial flow pump relies on the force generated by the blades of the rotating impeller to allow fluid to flow along the axial direction. The impeller is usually equipped with two to seven blades, which rotate in a tube-shaped casing, and the pump casing on the upper part of the impeller is equipped with fixed guide vanes, the purpose of which is to eliminate rotational movement of the fluid and transform it into axial movement, thereby converting the kinetic energy of the rotational movement into fluid pressure. Axial flow pumps are generally vertical, with the impeller immersed in the fluid, but there are also horizontal or inclined axial flow pumps.
The main advantages of the axial flow pump are as follows: (1) the angle of the moving blade is adjustable, so the pump has strong adaptability to changes in the flow, head, and total pressure of the system; (2) it is compact and light and has a small volume and a low starting torque; and (3) it allows for high flow. The main disadvantage of the axial flow pump is that its performance in small flow areas is unstable. As the flow decreases, the shaft power increases sharply; therefore, the high-efficiency range of the axial flow pump is narrow, making it unsuitable for applications with a large range of head changes.
The impeller rotor hub of traditional axial flow blood pumps is cylindrical, but in this study, an innovative conical design was proposed. The conical flow channel reduced the pressure loss in the flow channel by controlling the fluid velocity, and it accelerated the fluid under a controlled state. In the conical design, the flow surface area gradually decreased from the inlet to the outlet, resulting in an increase in the pressure energy of the blood. Therefore, it is easier to meet the outlet pressure requirement, which is of great significance to reducing the overall size of the blood pump.

3. Hydraulic Performance of the Blood Pump

3.1. CFD Simulation

CFD is an emerging discipline that combines fluid mechanics and computer science. It exploits the excellent computation ability of computers to rapidly perform fluid dynamics computation methods to calculate the approximate solution of the fluid control equation. CFD software has a good human–computer interaction interface, which enables users to solve practical problems without being proficient in CFD theories. Fluent is currently the most popular commercial CFD software package, and it was designed based on the idea of CFD software group. From the perspective of user needs, Fluent software uses different discrete formats and numerical methods to solve various complex flow phenomena. Its objective is to achieve the optimal performance in terms of calculation speed, stability, and accuracy so as to efficiently solve complex flow problems in various fields. Hence, we used Fluent, software version ANSYS19.2/Fluent 19.2, as the CFD solver in this study.
Turbulence models provided by Fluent include the Spalart–Allmaras model, two-equation models (e.g., standard k-epsilon model, RNG k-epsilon model, realizable k-epsilon model), k-omega models (e.g., standard k-omega and SST k-omega), Reynolds stress model, and large eddy simulation, but the application scope and characteristics of different turbulence models are different. The Spalart-Allmaras model can be used to solve quantitative equations modified by the viscosity of turbulent flow, mainly wall-constrained flows, and has shown good results. This model is mostly used in aeronautics and turbomachinery, and it is preferred for airflow problems with wall constraints. For simple, fully developed turbulence problems, the standard k-epsilon model is fully applicable and converges faster than for other turbulent flows. This model’s coefficients are given by empirical formulas, and its calculation is relatively stable. The RNG k-epsilon model takes turbulent eddies into account to improve accuracy, and RNG theory provides an analytical formula for considering flow viscosity with a low Reynolds number. The performance of this formula depends on the correct treatment of the near-wall region. The realizable k-epsilon model can be used for other flows, including swirling uniform shear flow, free flow (jet and mixed layer), channel flow, and boundary layer flow. The standard k-omega model can achieve better simulation results for compressible and shear flows with bounded walls and low Reynolds numbers, especially for flows around cylinders, radial jets, and mixed flows. The SST k-omega model incorporates the cross-diffusion derived from the ω equation, the turbulent viscosity takes into account the propagation of turbulent shear stress, and the model constants are different.
Because the gap between the wall and the impeller was small in our study, we mainly focused on the influences of wall shear stress and viscous force. As some previous studies used RANS models to analyze hemolysis problems [6,21,22,23], we also used RANS models to verify the hydraulic performance of the blood pump. Furthermore, we investigated the differences between different RANS models by carrying out a total of five sets of simulations for the RANS models and using the viscous stress and total stress in the impeller region as the observation indicators. The simulation values of different models are provided in Table 1.

3.2. Working Conditions and Boundary Conditions

The blood flow of an adult is on average 4.5–6.8 L/min, and in this study the blood flow was set to 6 L/min. In order to meet the physiological needs of the human body, the minimum pressure difference between the inlet and outlet of the blood pump was set to 100 mmHg, i.e., 13.3 kPa. The blood viscosity was set to 0.0035 kg/(m·s), and the blood density was set to 1050 kg/m3 [22]. The multiple reference frames (MRF) model was used to set the rotation area and rotating speed. The turbulence model was the standard κ - ε model [24]. Due to the gradient in the pressure velocity field in the blood pump, the pressure was greatly affected by the change of speed, so the velocity and pressure were coupled using a coupling algorithm. The gradient change was selected in the least squares discrete format based on the element body, the pressure change was discretized by PRESTO, the rest of the discrete formats were all second-order upwind, and the under-relaxation factor was kept at the default value. Blood is a non-Newtonian fluid; that is, the gradient of viscous shear stress size and the velocity do not have a purely linear relationship. However, according to previous research [25], in the state of high shear rate, blood exhibits the properties of a Newtonian fluid. Therefore, blood was considered to be a Newtonian viscous fluid in this study.
The front and rear guide wheels of the blood pump were in a non-rotating state, and the impeller was in a rotating state. Thus, the flow channel model was divided into three parts, which were meshed with non-structured elements. The gradient of physical quantities in the rotating area was large, so the meshes were refined. The final number of elements was 3.2 million (Figure 4). Information was transmitted between the rotating section and the static sections through an interface. The inlet was set to mass-flow-inlet, and the outlet was set to outflow. Fluent was used to simulate the pressure distribution and hemolysis performance of the blood pump.
In order to obtain better simulation results, it is necessary to reduce the discrete error in the fluid simulation process. The discrete error is the difference between the exact solution of the differential equation and the exact solution of the difference equation, which is essentially the truncation error of each item in the equation during the expansion process. Its size is related to the discrete scale. Celik et al. proposed a recommended procedure for estimation of discretization error in recent years [26]. However, for this study, we chose to use grid-independent verification. With this approach, as the mesh is refined, the solution becomes less sensitive to mesh spacing and approaches a continuous solution. The grid is often refined step by step until the grid converges, that is, grid independence verification. In order to better verify the grid independence, in addition to observing the change in the flow velocity at the outlet with the number of grids, the trends of pressure and viscous force with the number of grids were also added because three observation indicators provide more convincing verification of grid independence. In order to avoid the influence of meshing on the simulation results, mesh independence analysis was carried out by varying the number of elements from 120,000 to 4.67 million. With the same blood pump parameters and boundary conditions, the related parameters were compared in Figure 5. It can be seen in the figure that when the number of elements was above 3.2 million, the parameters changed only slightly. So, the number of elements was set to 3.2 million for the simulations.

3.3. Influence of Flow Channel Geometric Parameters on the Performance of the Blood Pump

The flow channel of the blood pump carries blood, and its geometry is directly related to the performance of the blood pump. For example, the number of blades has a certain effect on the head, efficiency, and cavitation performance of the blood pump. Therefore, with other variables fixed, the optimal number of blades should be selected. Additionally, the blade angle at the outlet has a direct impact on the blood pump. Given the same flow conditions, the head increases with the blade angle within a certain range. Therefore, the flow channel’s geometric parameters have different impacts on the performance of the blood pump.
In order to ensure the correctness of the simulation results, in the following simulation process, the variables other than the variables to be analyzed in each section remained unchanged, and only the variables to be studied were changed. Furthermore, all particles were evenly distributed when released, as is shown in Figure 6.

3.3.1. Influence of the Hub Taper Angle on the Pressure Difference between the Inlet and Outlet of the Blood Pump

The blood pressure of a normal adult is 80–100 mmHg. The pressure difference between the inlet and outlet of the blood pump determines whether the blood pump meets the physiological requirements of the human body. Therefore, it is of great significance to study the influence of the hub taper angle on the pressure difference of the blood pump. With the rotating speed of the impeller at 10,000 r/min and the inlet flow rate at 6 L/min, the taper angle of the impeller hub was changed from 0° to 1°, and the resulting pressure differences between the inlet and outlet of the blood pump are shown Figure 7.
It can be seen that the outlet pressure was positively correlated with the hub taper angle. When the taper angle increased from 0° to 1°, the pressure difference increased from 3919 Pa to 17,995 Pa—an increase of 359.2%. However, when the taper angle was too large, backflow occurred, which necessitates further investigation.
Figure 8 shows the streamline distribution and turbulent viscosity of the blood pump under different taper angles. For a fixed moment at any time, there is a curve, which is the streamline, of each fluid particle, and the tangent direction of each point on the curve is parallel to the velocity direction of the fluid at that point. In Fluent, the trajectories of different particles are represented by different color lines to depict the flow of massless particles in the computational domain. Ideally, the blood flow into the blood pump should be consistent with the blood flow out of the blood pump. If the blood stays in the blood pump, it will lead to the generation of thrombus, which is not beneficial to human health. It can be seen from Figure 8 that the blood flow direction represented by each line was not disconnected, and the number of lines representing blood at the inlet and outlet was roughly equal. When the taper angle was set to 0° and 0.25°, the simulation results showed that the numbers of lines at the outlet and inlet of the blood pump were not the same, meaning blood would stay in the blood pump. When the taper angle was set to 0.75°, the simulation results showed that the blood flow lines were clearer, meaning the blood trajectories were more distinct and less turbulent. When the taper angle was set to 1°, blood stagnation occurred in the front impeller section. As can be seen from the cloud image, when the taper is 0.75° or 1°, the turbulent viscosity of the rear area of the guide wheel is smaller than under other conditions. However, the turbulent viscosity at 0.75° is better than the turbulent viscosity at 0.1°. Therefore, based on the streamline diagram and the load-bearing clearance requirements of the electrodynamic radial bearing, a proper taper angle should be about 0.75°, which requires further verification via hemolysis analysis.
The simulation results showed that slightly increasing the taper angle of the hub increased the pressure difference between the inlet and outlet of the blood pump. Therefore, the conical hub design is able to reduce the size of the blood pump while meeting the pressure difference requirements. The finding is of reference value for the design of micro blood pumps.

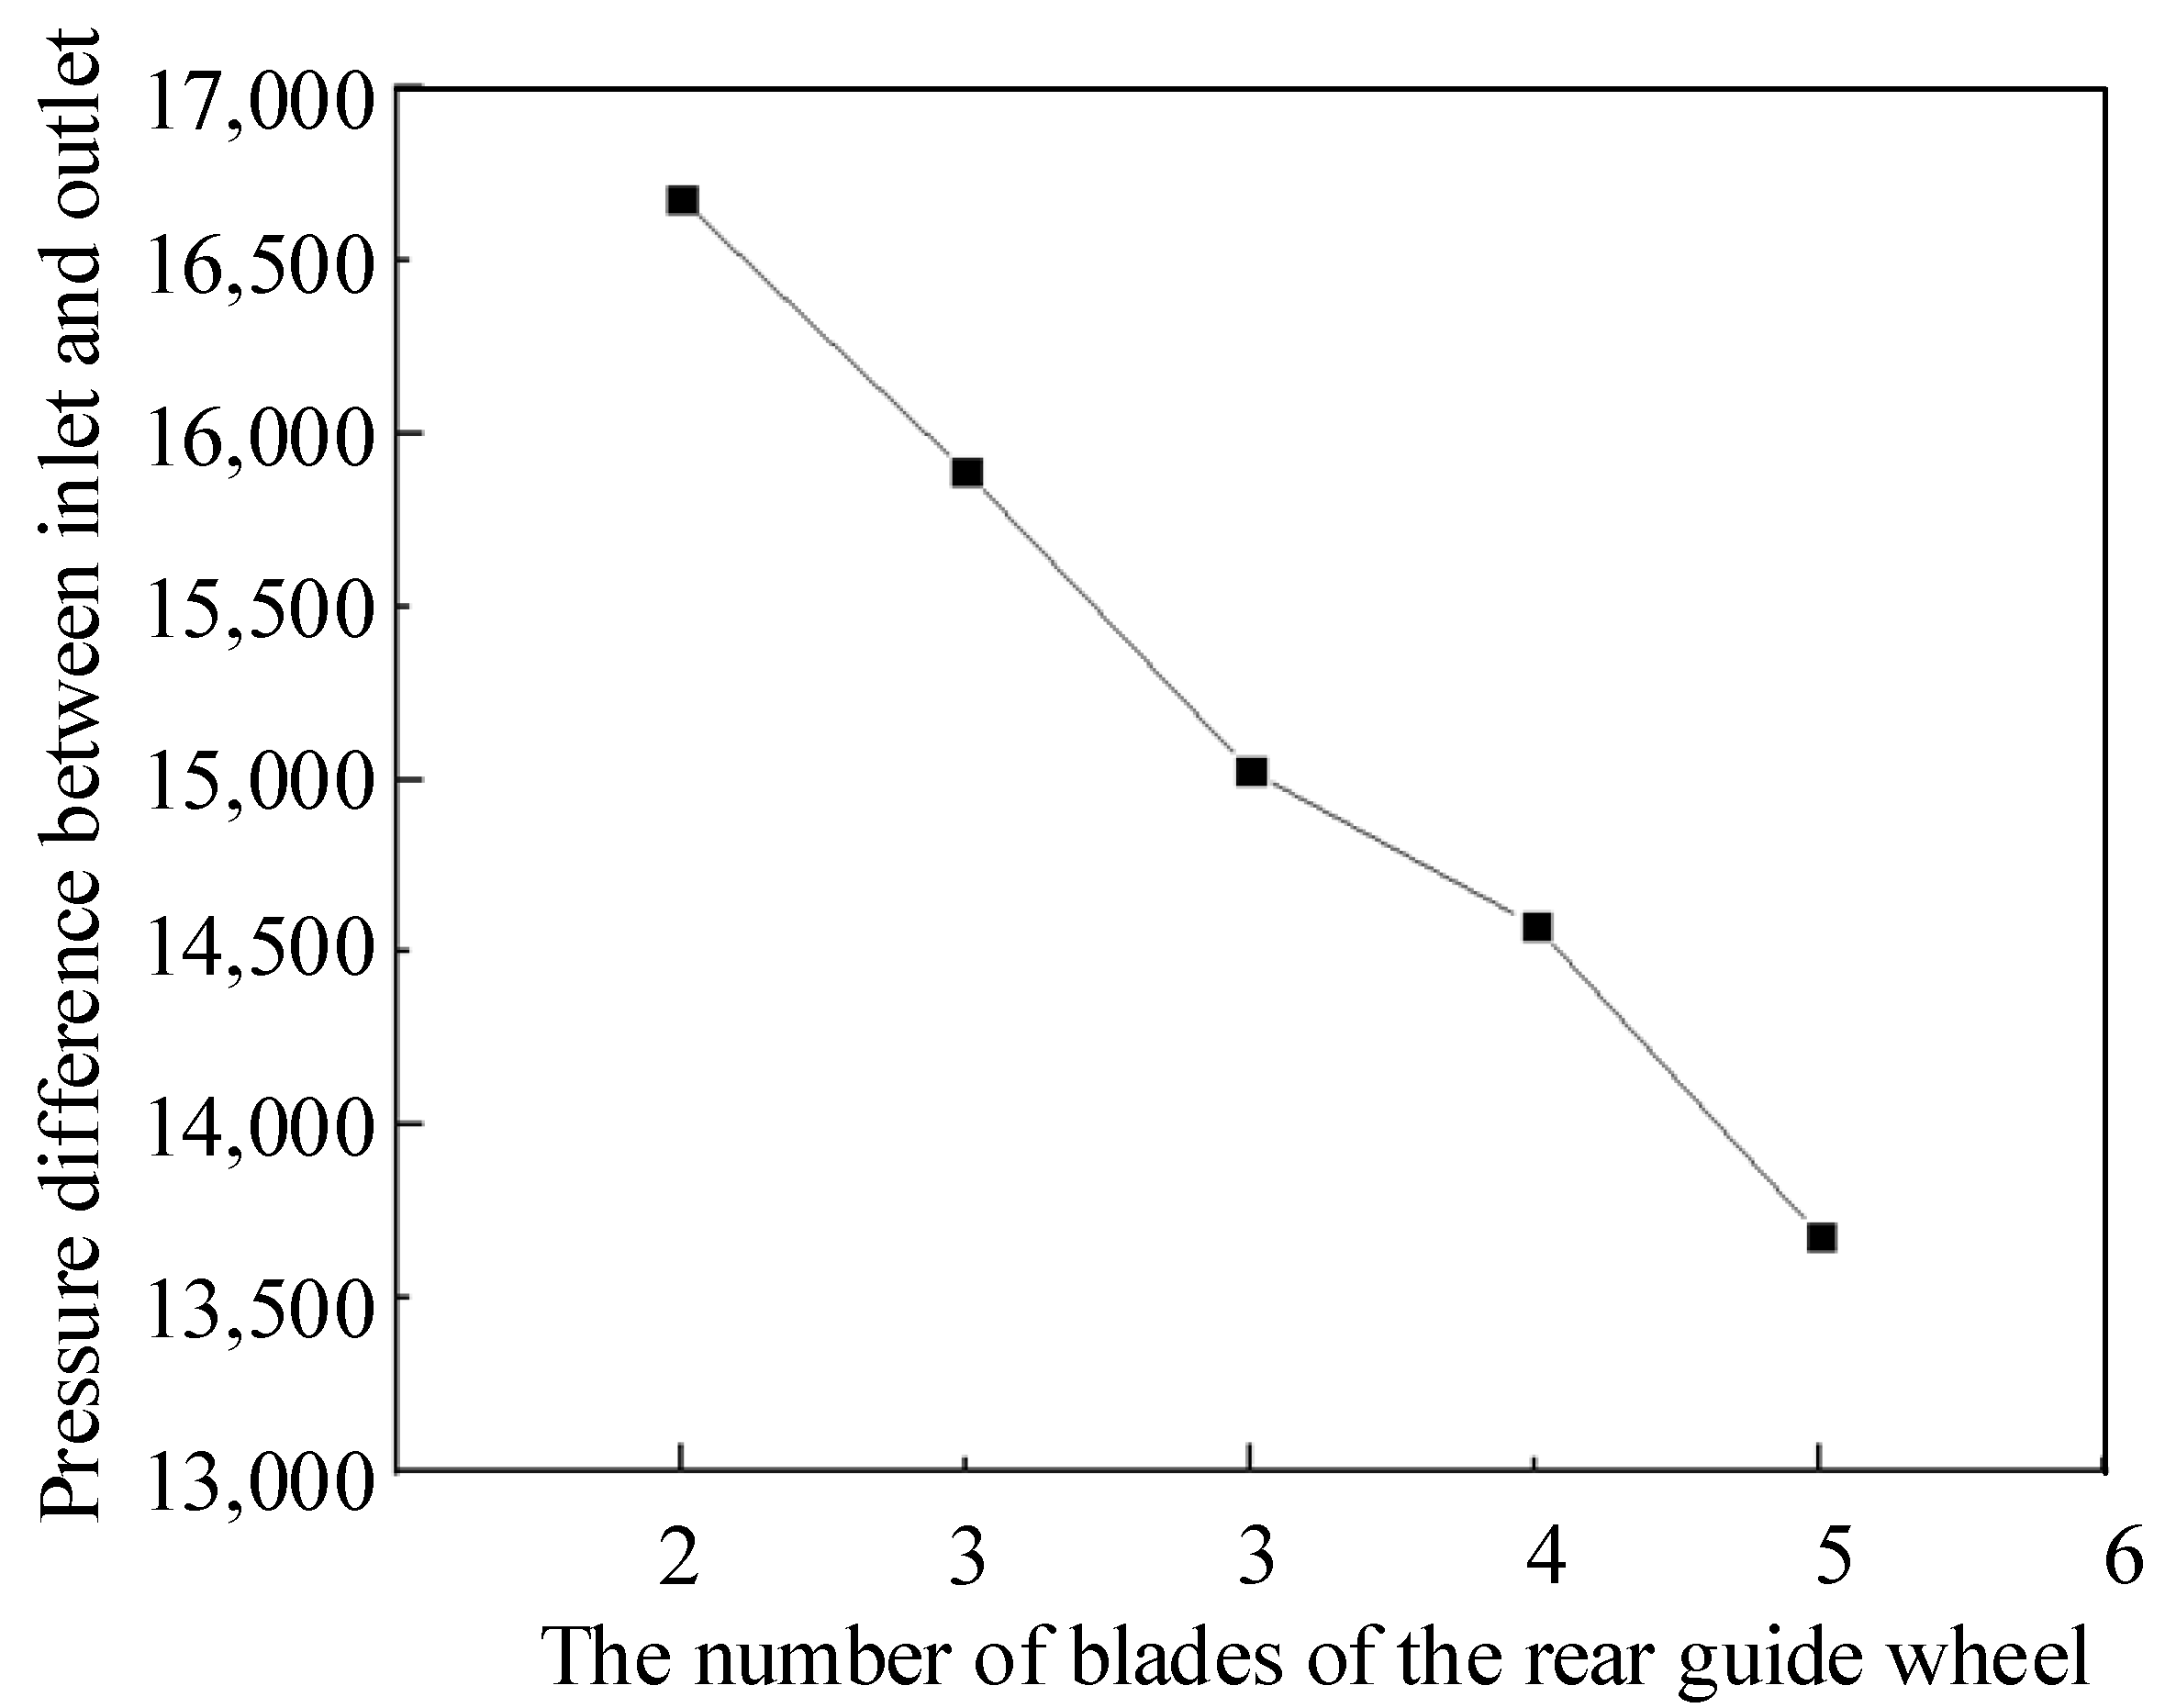
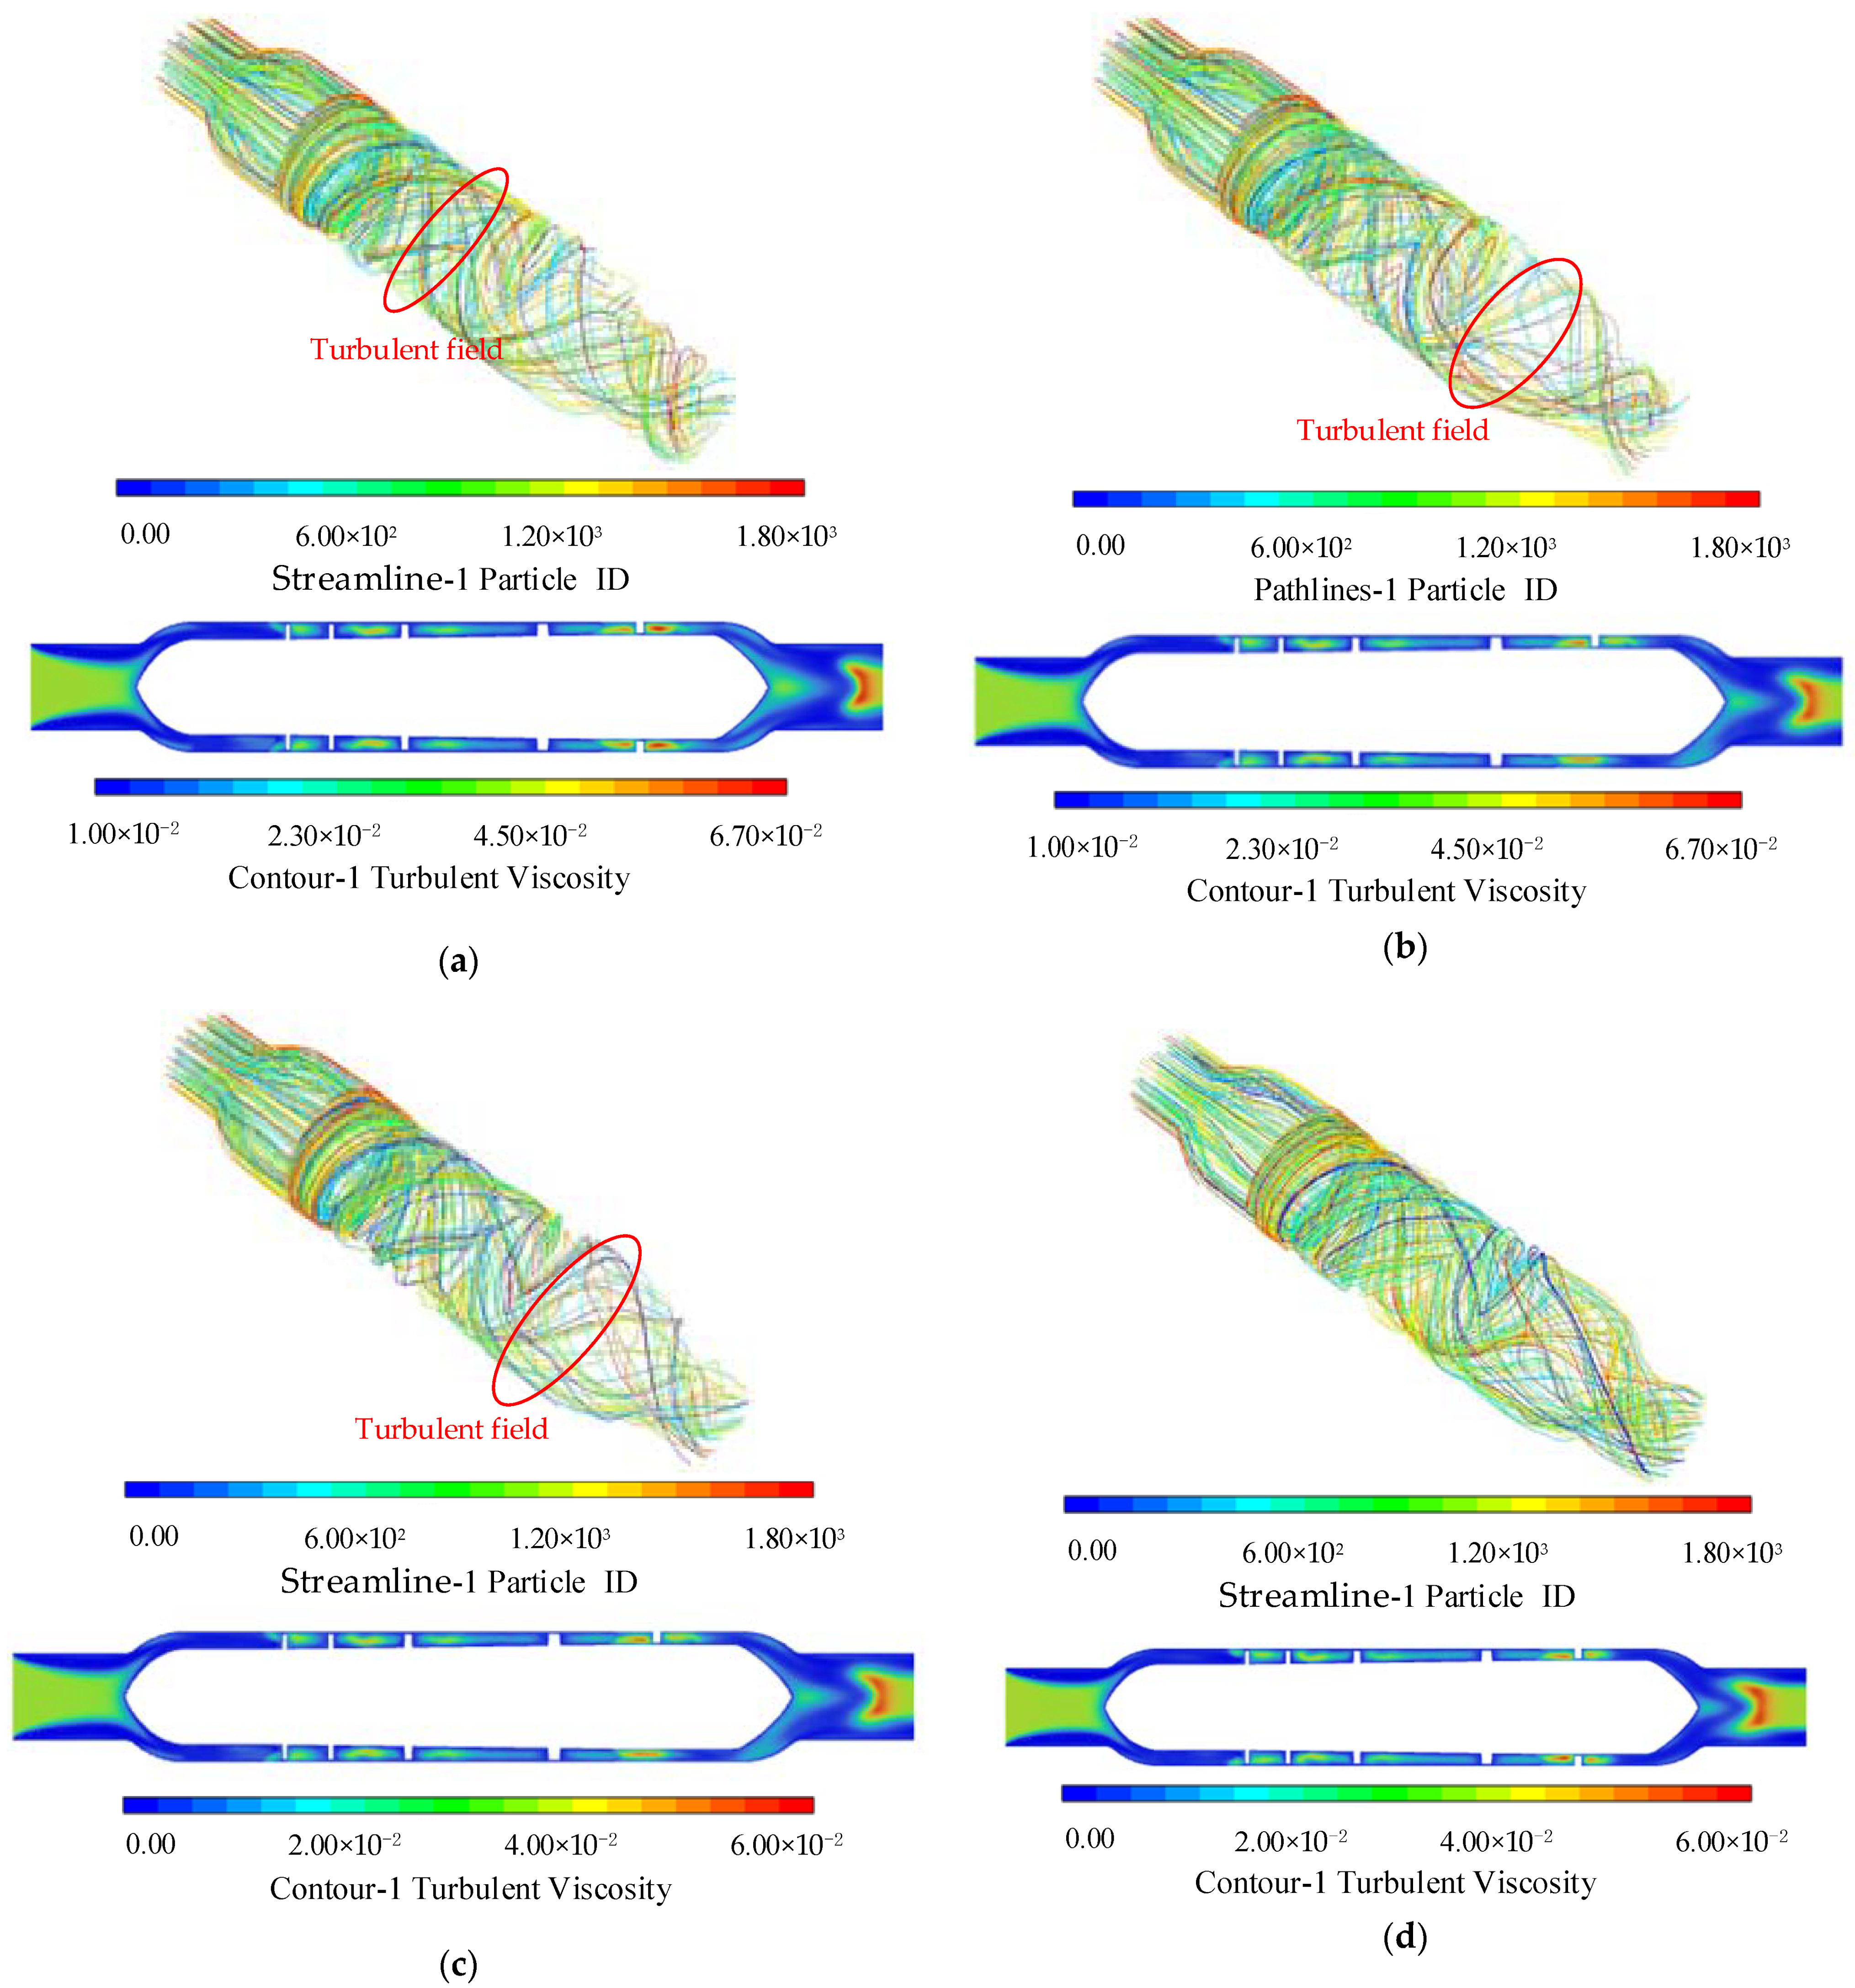
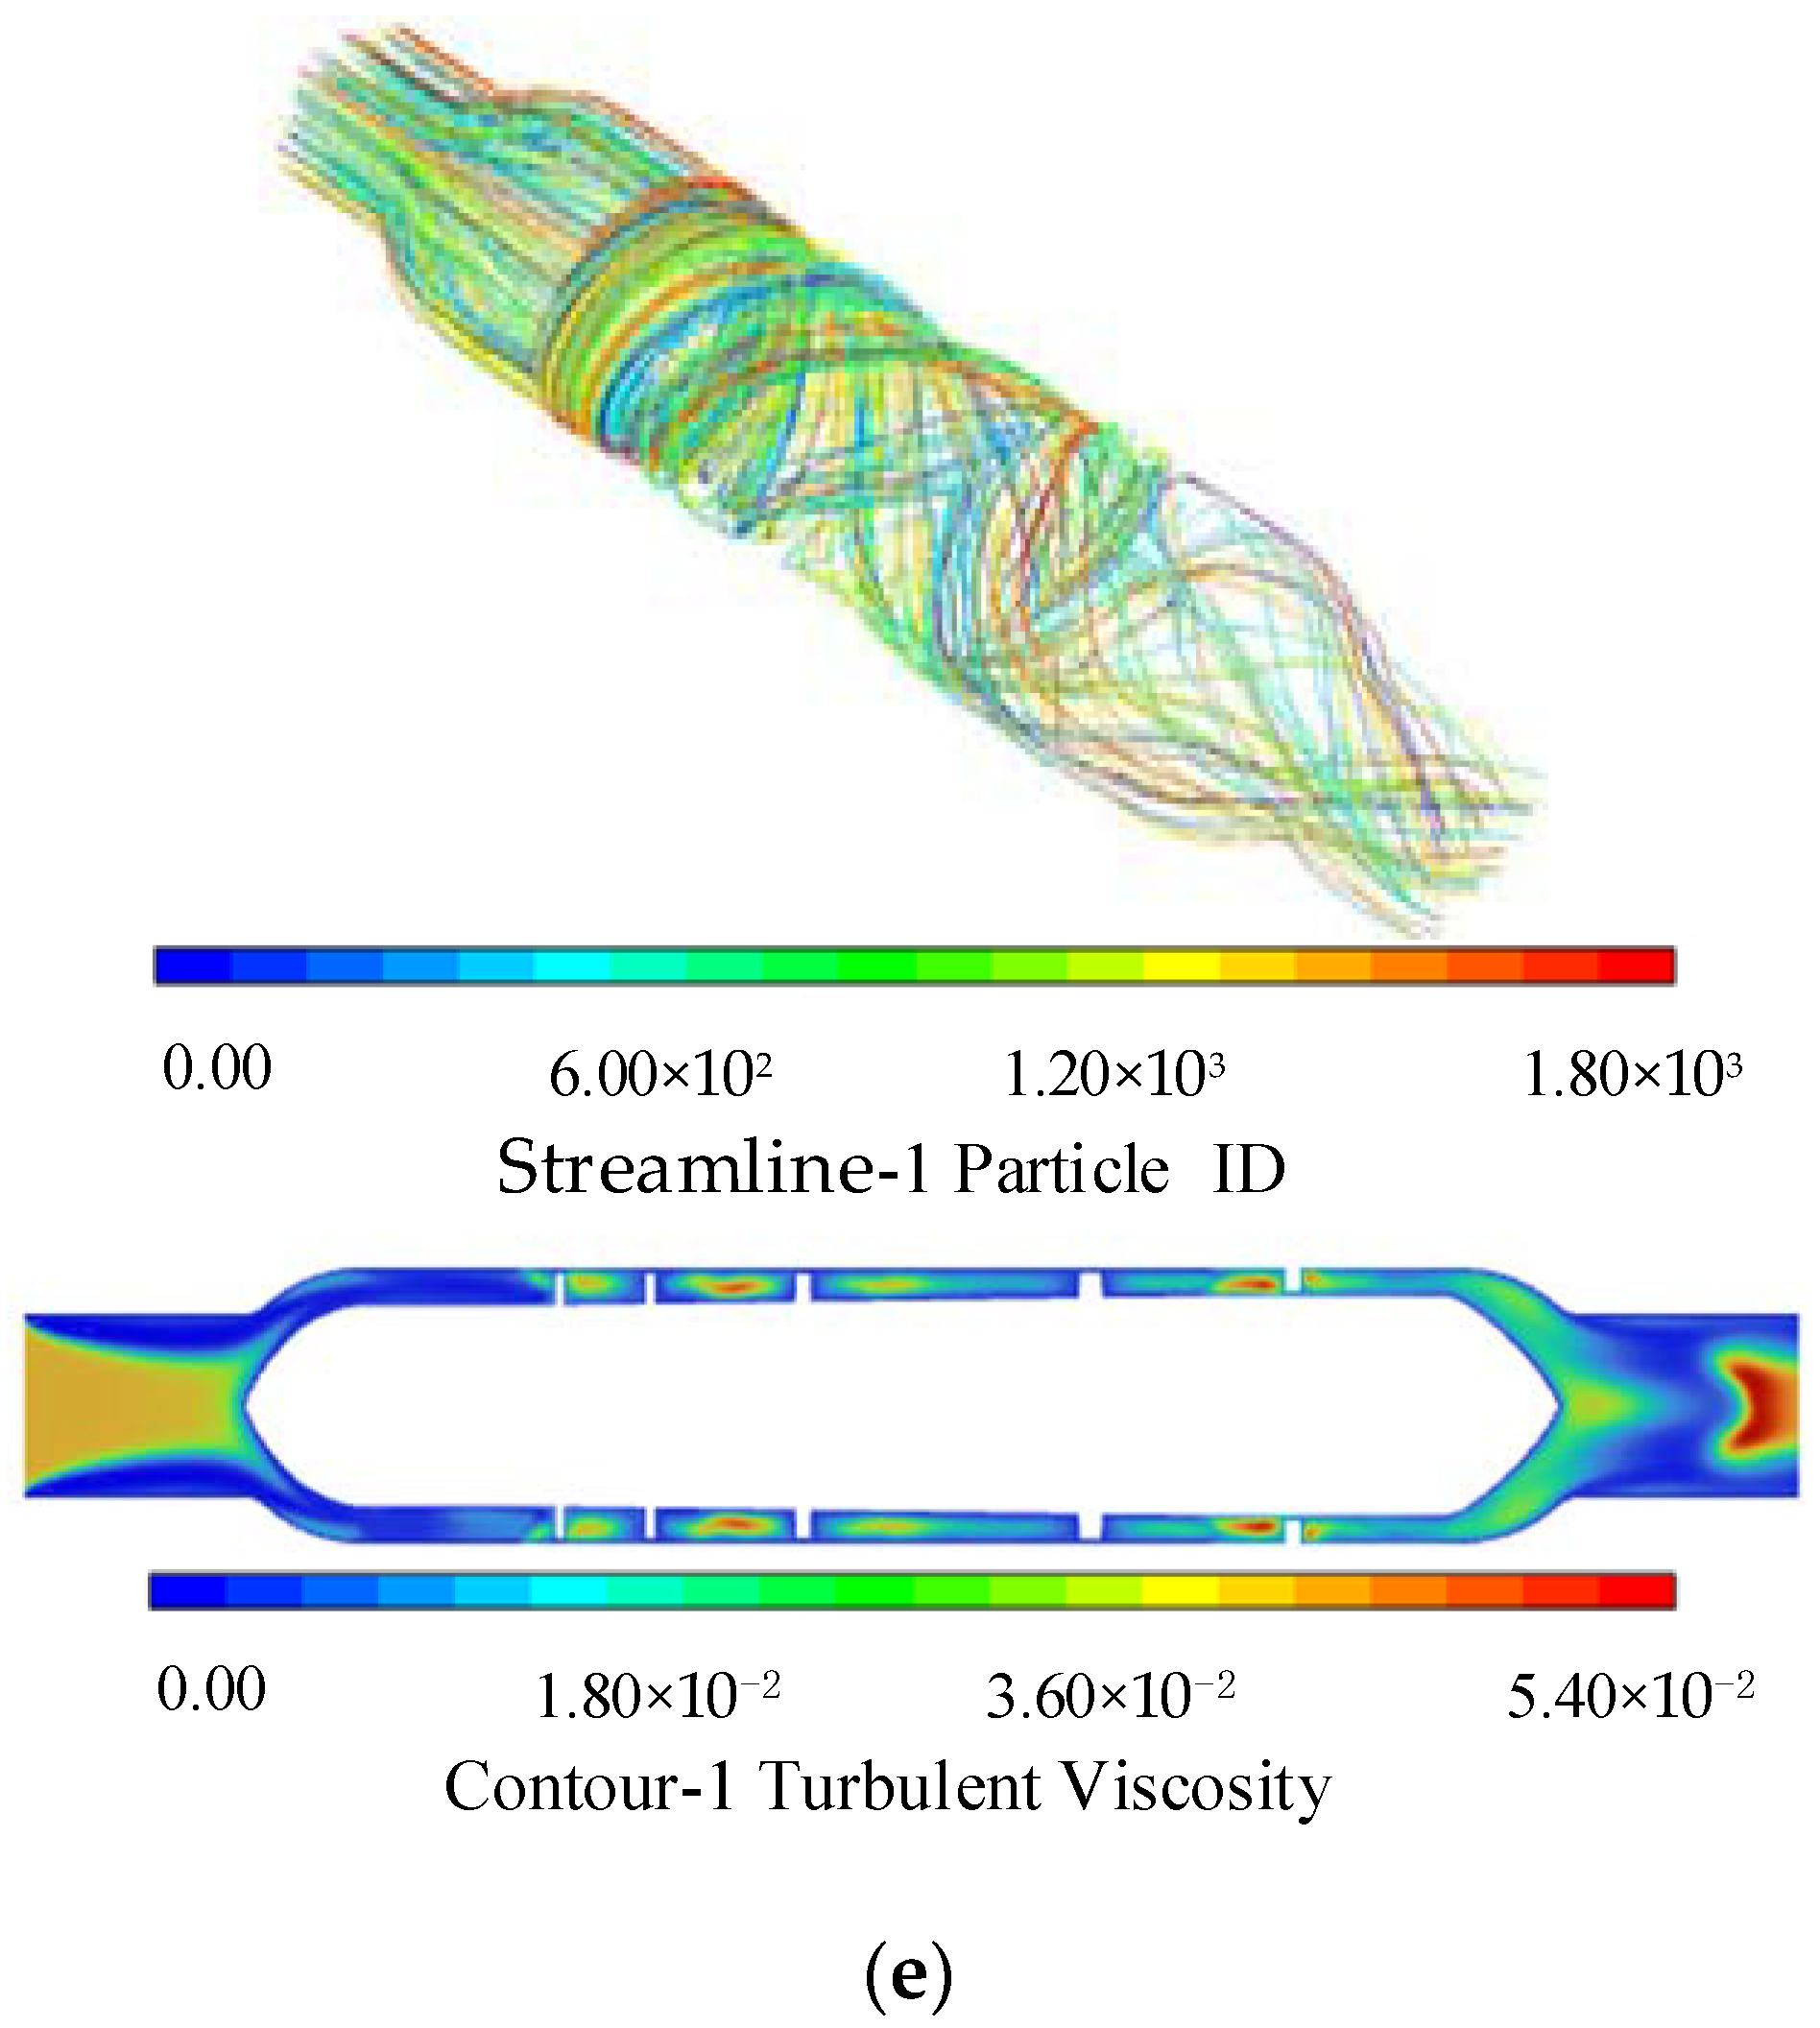
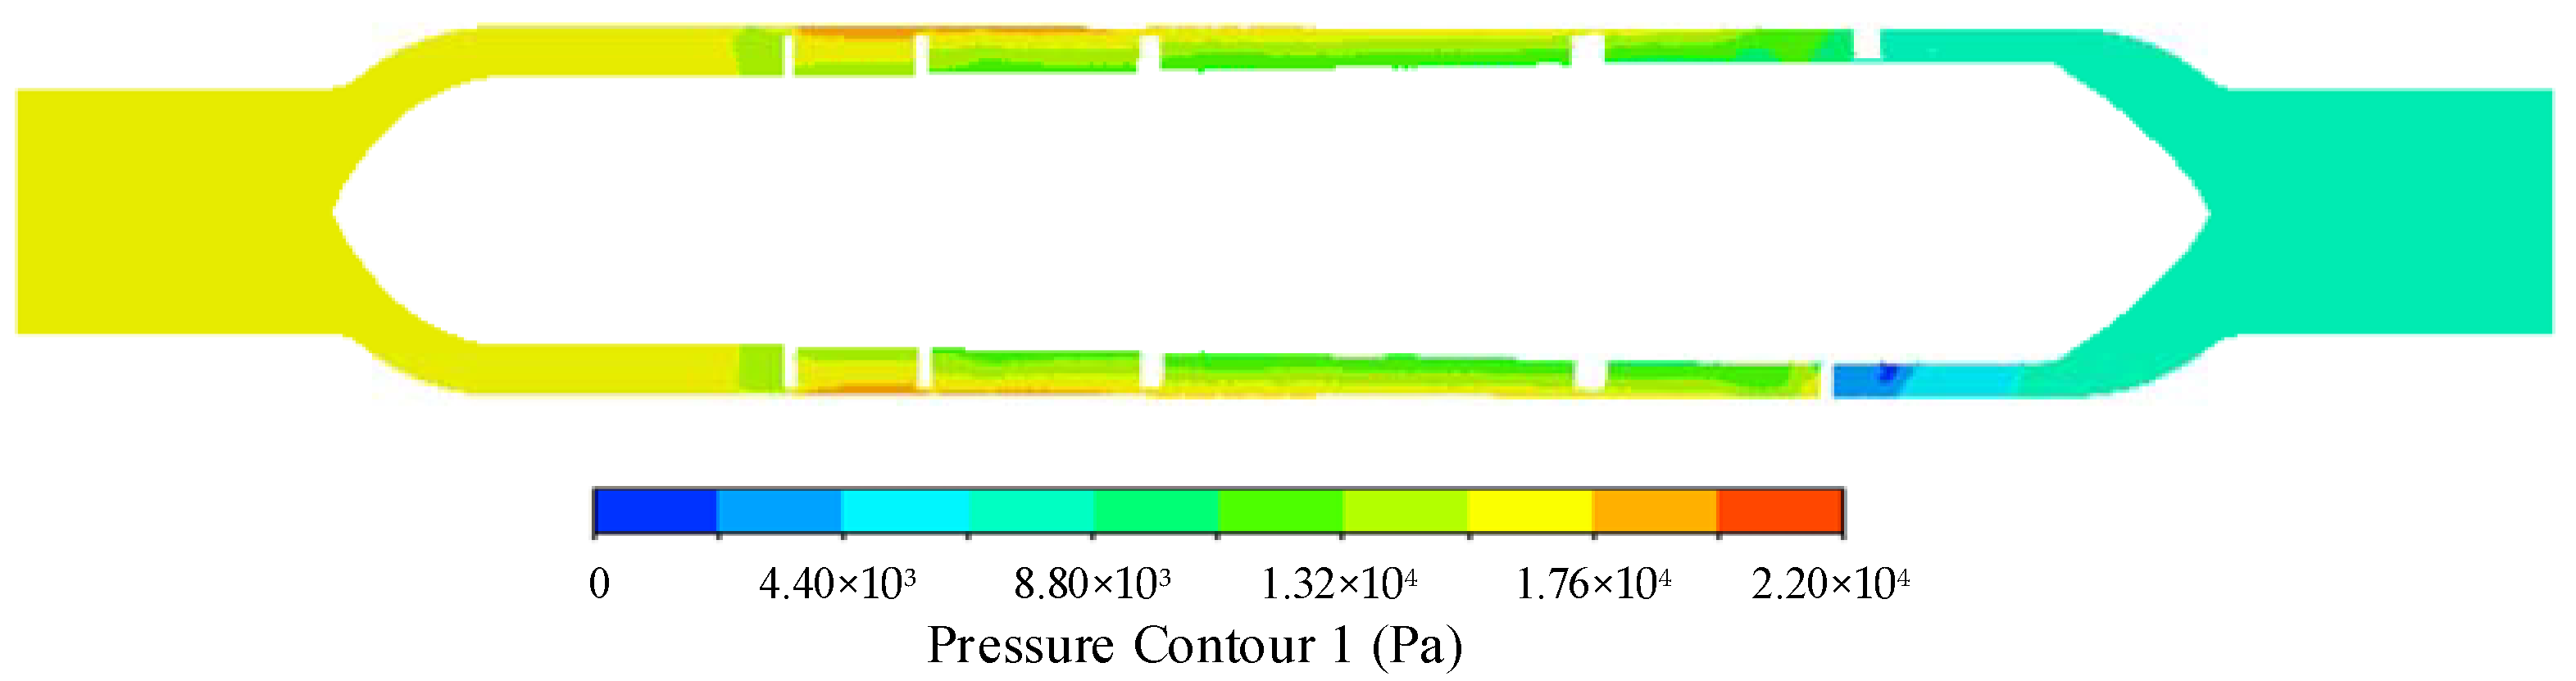
3.3.2. Influence of the Number of Blades of the Rear Guide Wheel on the Outlet Pressure

The rear guide wheel was used to eliminate the circumferential speed component of the blood flow, thereby converting the kinetic energy of the blood into pressure energy. The number of blades of the rear guide wheel is of great significance to the smooth blood output. In this study, the number of blades was varied from two to six, and a numerical simulation was carried out. Figure 9 shows the influence of the number of blades of the rear guide wheel on the outlet pressure of the blood pump.
The flow channel was changed by varying the number of blades of the rear guide wheel. As shown in Figure 9, the outlet pressure was negatively correlated with the number of blades of the rear guide wheel. Meanwhile, the inlet pressure was 24,751.6 Pa. Thus, the rear guide wheel played a role in the resistance to the blood flow. According to theoretical analysis, the points in Figure 9 should be in a straight line. The point corresponding to four blades exhibited a small offset from this line, possibly because the number of iterations calculated by the simulation was insufficient. Each group of simulations was carried out under the same conditions, with only the number of blades being changed, and yet the convergence conditions corresponding to different blade numbers were not the same. In order to reduce the energy loss of the blood flow, it is necessary to select a reasonable number of blades. As shown in Figure 10, which presents the streamline distribution and turbulent viscosity under different numbers of blades, a mismatch between the number of blades and the flow channel caused turbulent blood flow.
It can be seen from Figure 10 that when the number of blades of the rear guide wheel gradually increased, the circumferential speed component of the blood flow at the outlet of the blood pump gradually decreased. When the number of blades was small, the mismatch with the flow channel caused the flow field to be turbulent, which means the numbers of particles at the outlet and inlet of the blood pump were not the same. When the number of blades was large, the blood flow was hindered. In the turbulent viscosity contour with different blade numbers, the turbulent viscosity in the outlet section was relatively concentrated. However, according to the turbulent viscosity nephogram with five blades, the turbulent viscosity distribution in the entire area was relatively uniform, and the impeller area presented a continuous distribution trend, so it is most appropriate for the rear guide wheel to have five blades.
Based on the above results, when the rear guide wheel had five blades, the circumferential speed of the blood at the outlet of the blood pump was greatly reduced and the flow field was relatively stable.
It is very important to evaluate the pressure of the whole flow area under the conditions that the rear guide wheel has five blades and the taper angle of the blood pump is 0.75° because areas of low pressure can cause red blood cells to die. Figure 11, which shows the pressure of the whole flow area relative to standard atmospheric pressure, indicates that there are no areas of low pressure, so the blood pump is safe for human red blood cells.

4. Hemolysis Potential of the Blood Pump

4.1. Shear Stress Model and Hemolysis Prediction Model

Hemolysis, a manifestation of blood damage, refers to the premature damage of red blood cells. One indicator of hemolysis is the release of hemoglobin from red blood cells into plasma. In blood pumps, mechanical damage caused by high shear stress and long exposure time is the main reason for hemoglobin release, and the effects of other factors such as penetration, chemical, and heat transfer processes can be ignored. The red blood cells in the human body are in the shape of a double concave disc with a diameter of 7–9 μm. In order to simplify the model, the red blood cells were assumed to be spherical and uniform in diameter in this study [27]. The diameter was set to 7 μm in the simulation, and the results obtained using this number were close to the actual situation. The rotation of the impeller can damage blood cells to varying degrees, resulting in hemolysis and insufficient oxygen supply. Therefore, hemolysis performance is an important performance indicator of the blood pump. In this section, CFD was used to analyze the flow field of the axial blood pump, and the power function model proposed by Nygaard et al. [28] was used to establish a hemolysis prediction model. The particle tracking method was adopted to obtain the flow trajectories of individual blood cells. The mathematical equation is as follows:
d H b H b [ 0 0 ] = 3.62 × 10 7 × τ 2.416 × t 0.785 ,
where Hb is the total amount of hemoglobin, dHb is the amount of free hemoglobin caused by hemolysis, t is the exposure time (s), and τ is the shear stress (N/m2). The shear stress consists of two parts: turbulent shear stress (Reynolds stress) and molecular shear stress, whose expression is as follows:
τ i j = μ ( u i x j + u j x i ) + μ t ( u i x j + u j x i ) 2 3 ρ κ σ i j ,
where ui is the turbulent viscosity, and σ is the Kronecker index.
The shear stress calculated by the above formula has a large workload, cumbersome calculation, and difficult realization. Bludszuweit [29] proposed a scalar calculation formula for shear stress, which converts the shear stress of three-dimensional turbulent flow into a representative shear stress magnitude. On the scalar of τ , the formula is as follows:
τ = [ 1 6 ( τ i i τ j j ) 2 + τ i j 2 ] 1 2 .
To determine shear forces, early researchers mostly used Reynolds stress in place of the power-law equation, but more and more studies have shown that Reynolds stress is not directly related to the force acting on blood cells. According to the hemolysis model proposed by Faghih et al. [23], the shear stress scalar can be expressed as:
σ = 1 3 ( σ x x 2 + σ y y 2 + σ z z 2 ( σ x x σ y y + σ x x σ z z + σ y y σ z z ) + 3 ( τ x y 2 + τ x z 2 + τ y z 2 ) ) .

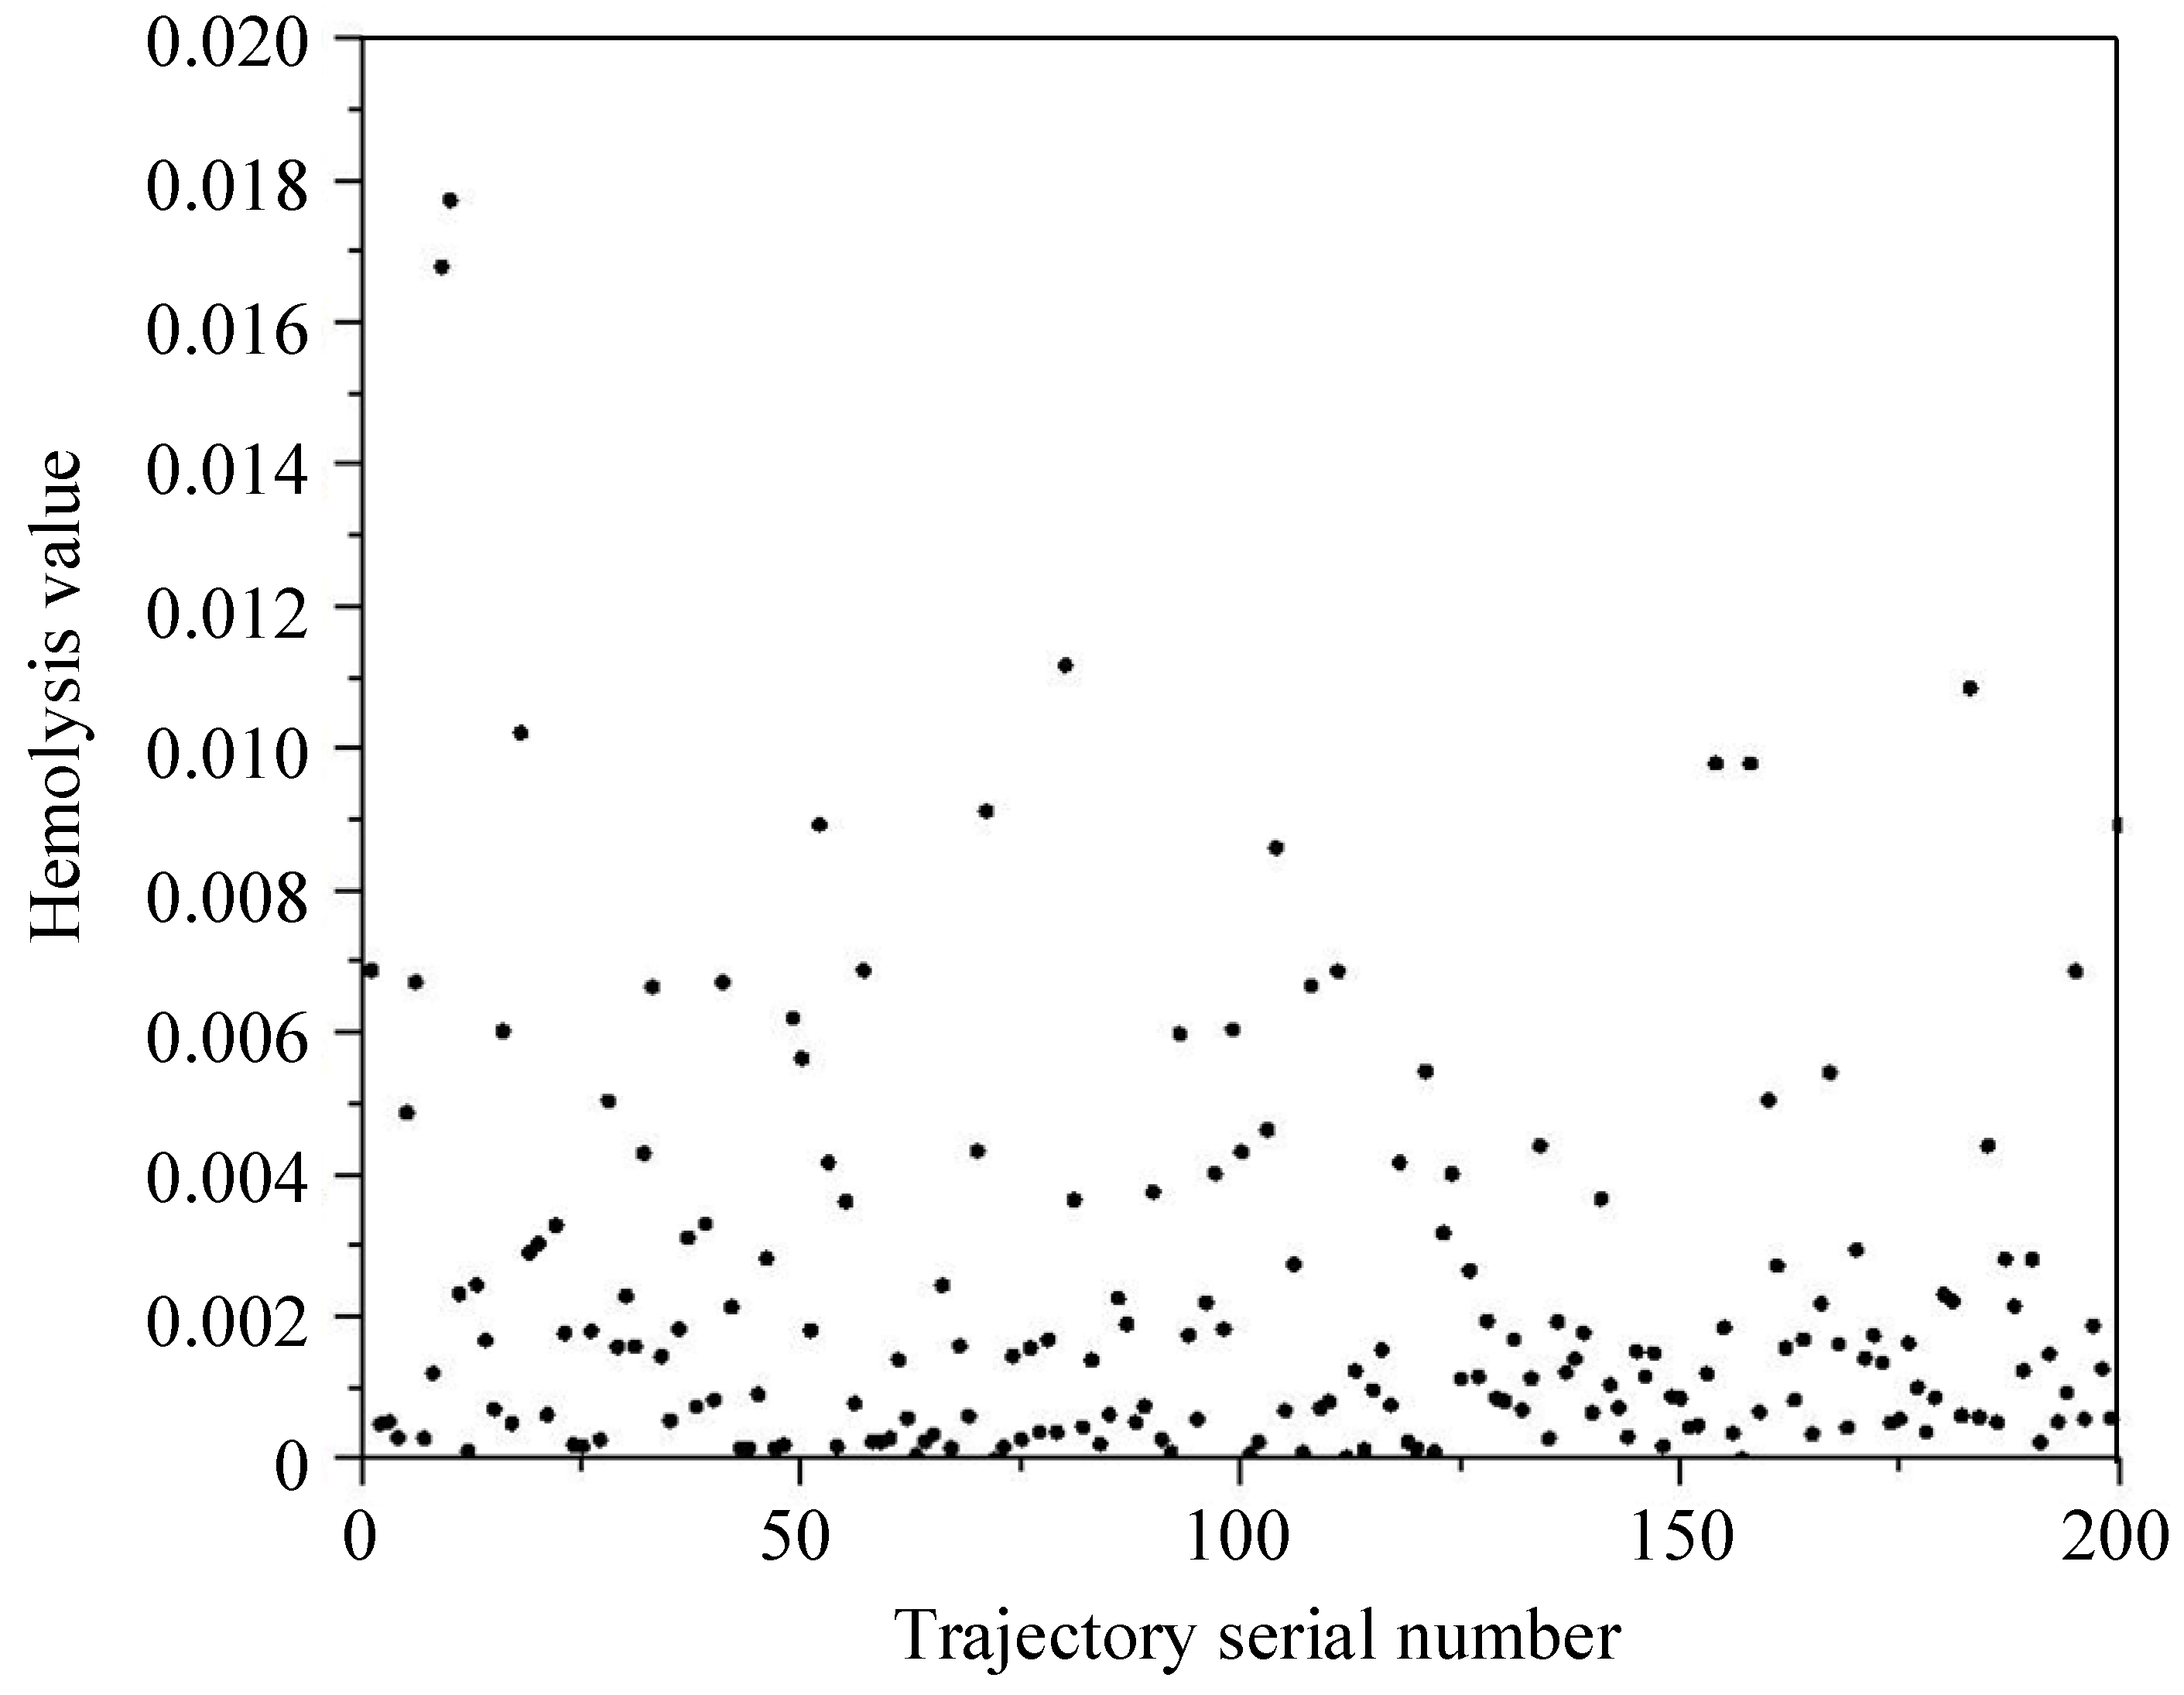
4.2. Trajectory Independence Verification

According to the hemolysis prediction model, the particle tracking method was used to predict the hemolysis of the blood pump, and the trajectories of the particles were obtained. The route and time of each blood cell passing through the flow channel was different. The trajectory data of each blood cell was exported from Fluent software, and a custom-written program in LabVIEW was used to obtain the hemolysis prediction value of each blood cell.
In order to prove the independence of the hemolysis model from the number of trajectories, the number of trajectories was changed from 20 to 200 for hemolysis analysis, and the average hemolysis prediction value E was obtained. The results, displayed in Figure 12, showed that when the number of trajectories was greater than or equal to 140, the number of trajectories had little effect on the result of the hemolysis prediction value. In order to ensure calculation accuracy, the number of trajectories was set to be 200 in the subsequent calculations. The particle tracking method was then used to predict the hemolysis performance of the blood pump, and the trajectories of the particles were obtained. From these trajectories, 200 trajectories were randomly chosen, and the hemolysis prediction value of each blood cell D p , i was calculated. The results are presented in Figure 13.
The results showed that the hemolysis prediction values of a large number of blood cells were lower than 0.004, and the average hemolysis value was E = 0.00232. In another study, the prediction result of hemolysis was above 0.004 [30]. Compared with that result, the hemolysis performance of our blood pump was better.

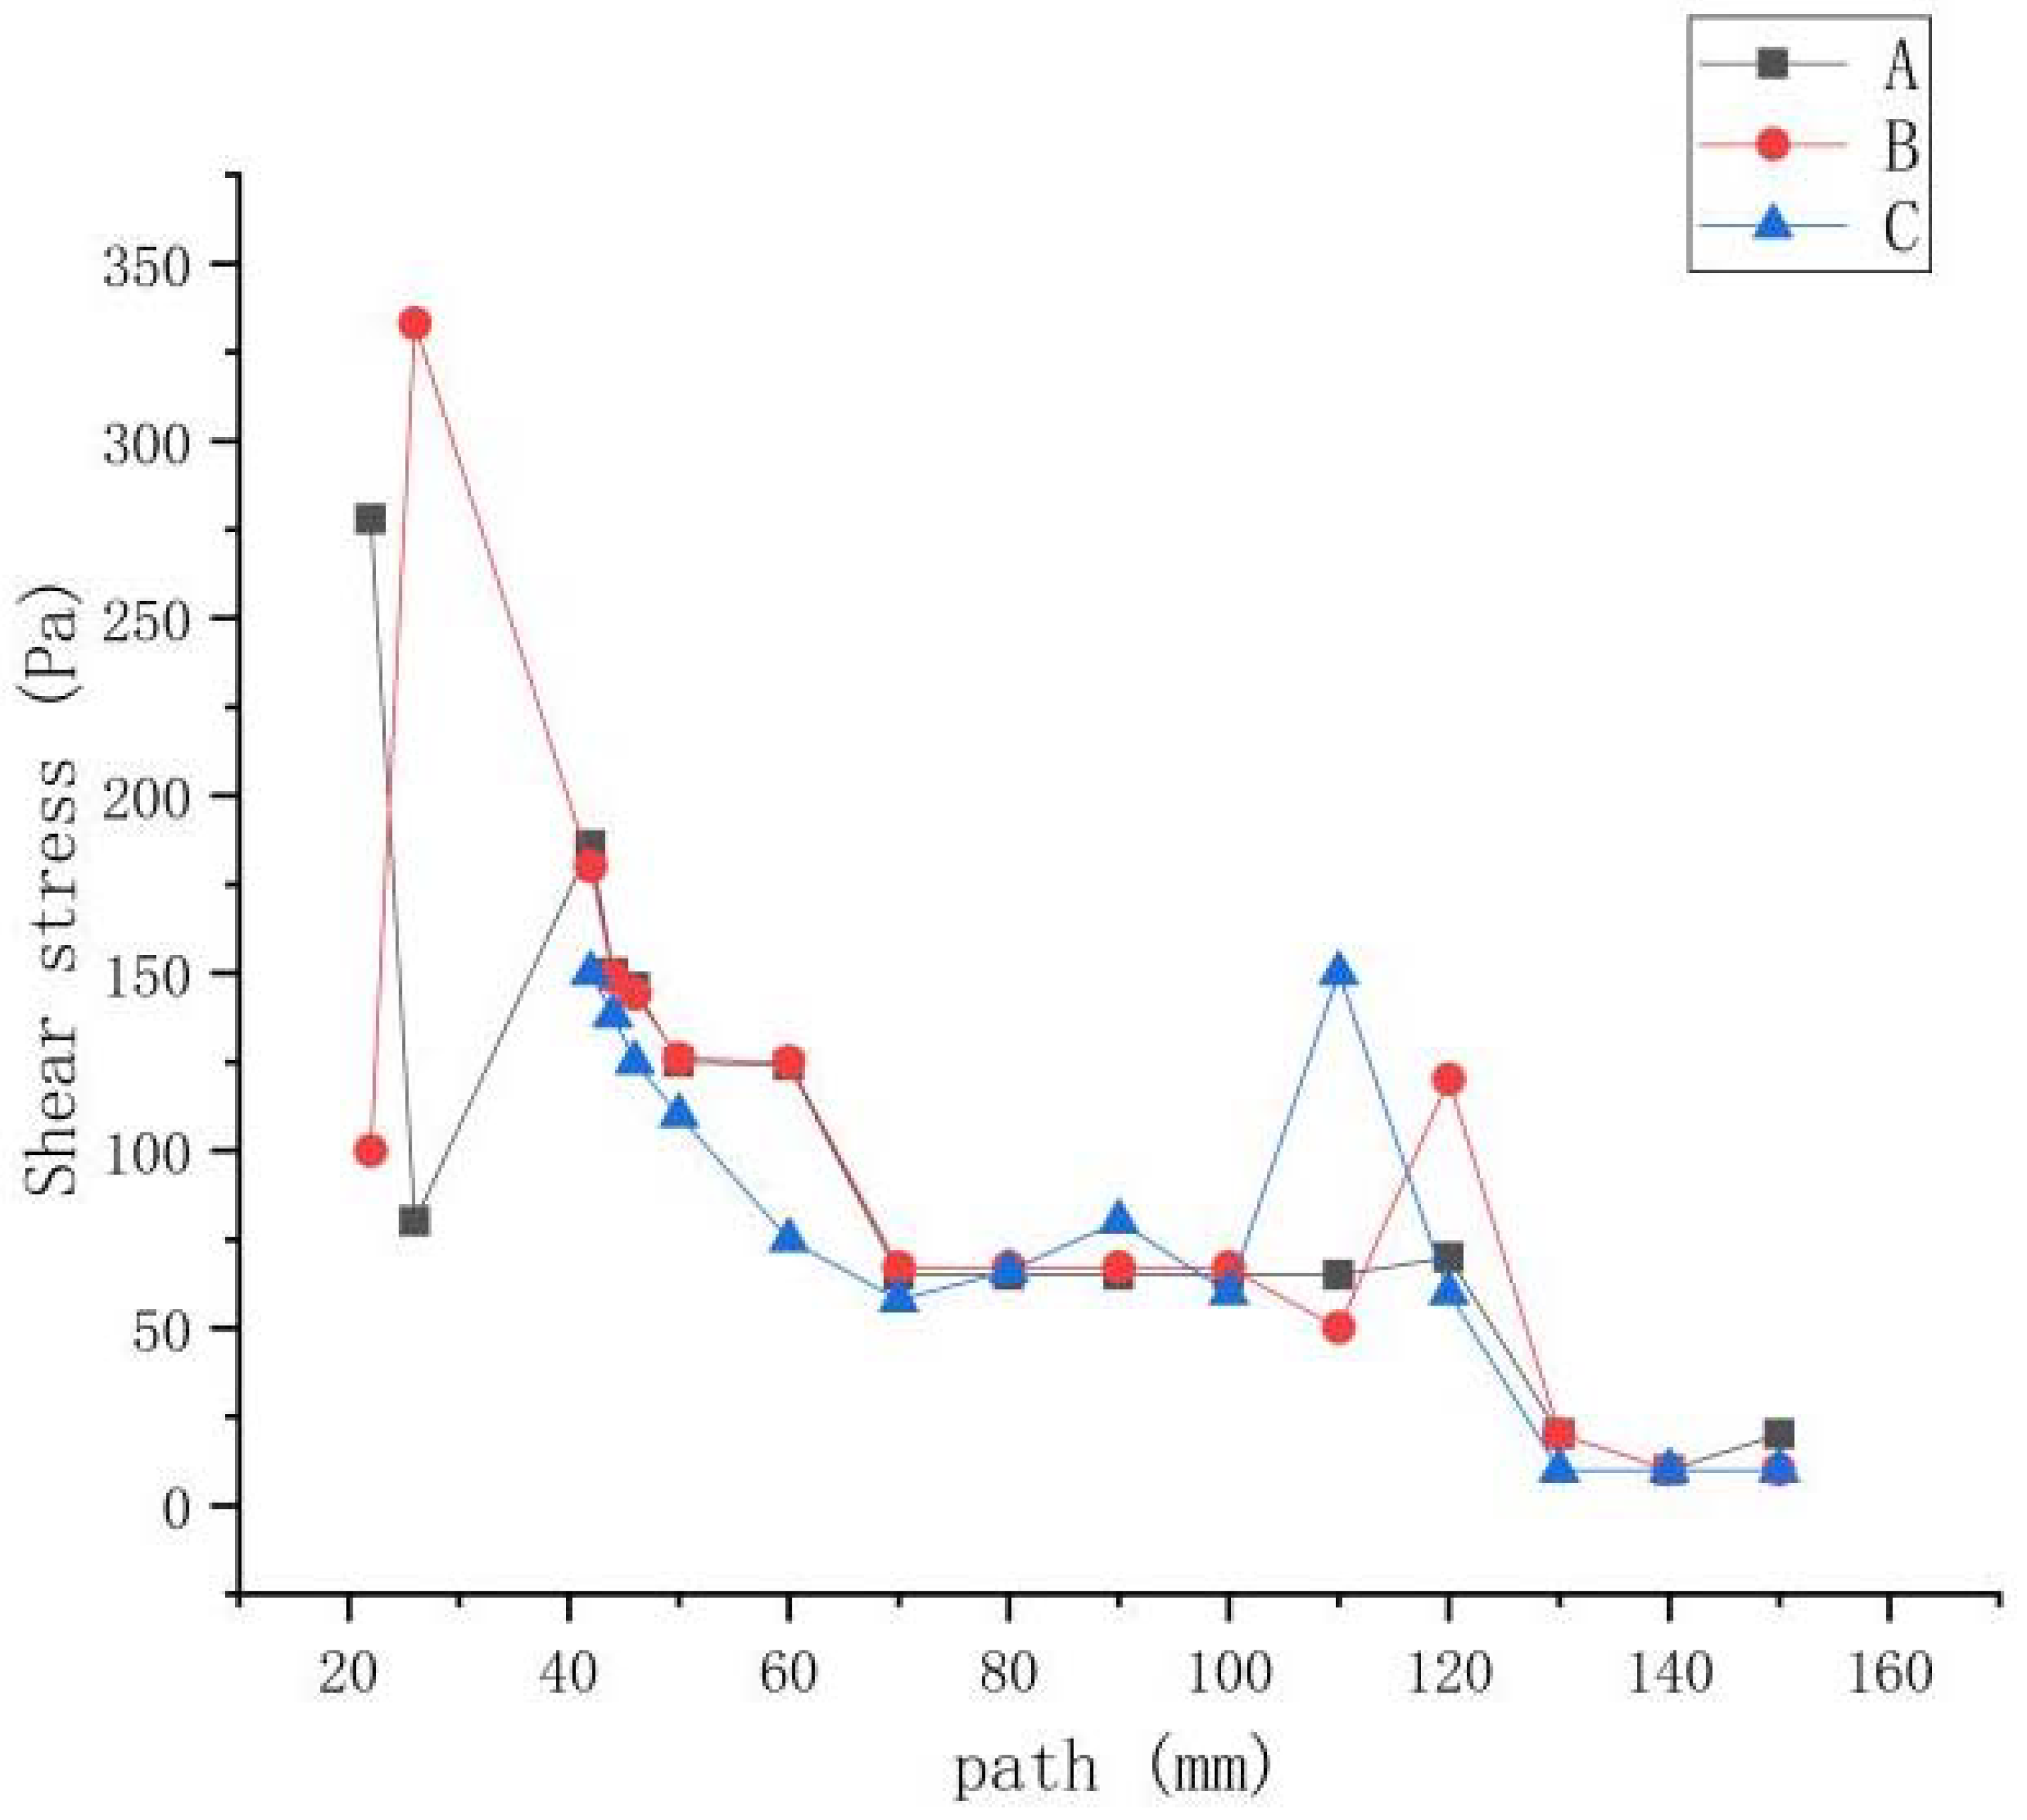
4.3. Shear Stress Analysis of the Blood Pump

The scalar shear stress distribution affects the hemolysis performance of the blood pump. In particular, the area with a shear stress of over 200 Pa has a large destructive effect on red blood cells. The trajectory of each particle was different. Three trajectories (denoted as A, B, and C) were chosen for analysis. Since the hemolysis of blood cells mainly depends on the magnitude of the shear stress, the particle trajectory and the shear stress were plotted together (Figure 14). It can be seen that the high shear stress areas were small, and they were located in the clearance between the casing and the top of the impeller and at the entrance of the impeller. The blood cells could be damaged due to the high shear stress and violent collision with the impeller.
Moreover, it can be seen from Figure 14 that particles A and B showed a sudden increase in shear stress at 22 mm, which was due to the sharp increase in shear stress at the front end of the impeller when the particles entered the high-speed rotating area after the front guide wheel. The increase in shear stress at 40 mm of the trajectory was due to the clearance between the impeller blade and the pump casing. From Figure 14, the area with a shear stress of over 200 Pa was very small for particles A and B, and the shear stress of particle C was always below 200 Pa. The calculation results showed that the hemolysis values of particles A, B, and C were 0.00030, 0.0168, and 0.00018, respectively. Thus, the high shear stress has a large influence on the hemolysis prediction value, and it is necessary to avoid the presence of high shear stress areas in the design of axial blood pumps.

4.4. Relationship between the Clearance and the Hemolysis Prediction Value

When the taper angle of the impeller hub was 0.72°, the rotating speed was 10,000 rpm, and the flow rate was 6 L/min, 200 trajectories were selected. The height of the impeller blades was adjusted from 0.3 mm to 0.6 mm, with a step length of 0.1 mm, to change the radial clearance of the blood pump. The results are shown in Figure 15.
It can be seen that the hemolysis prediction value was negatively correlated with the radial clearance of the blood pump. When the radial clearance increased from 0.3 mm to 0.6 mm, the hemolysis prediction value decreased from 0.00216 to 0.00165—a decrease of 23.6%. However, when the clearance was too large, blood backflow occurred. Thus, it is necessary to select an appropriate clearance.
Further, the hemolysis performance of the blood pump with different clearances was analyzed, and the results are shown in Figure 16.
In this study, the blood cells with a hemolysis prediction value of higher than 0.006 were considered as hemolysed cells [31]. It can be seen from Figure 15 that the number of blood cells with a hemolysis prediction value higher than 0.006 at 0.3 mm, 0.4 mm, 0.5 mm, and 0.6 mm clearance were 19, 17, 15, and 8, respectively. High shear stress is the main cause of hemolysis. As the clearance became smaller, the shear stress at the clearance became larger, resulting in a greater shear stress on blood cells, which increased the probability of hemolysis. When the clearance was too large, blood backflow occurred [30]. Therefore, the clearance should be at the high end of the limited range while meeting other requirements so as to avoid blood backflow.

5. Conclusions

A conical spiral axial blood pump with magnetic levitation was designed. Simulation results showed that when the hub taper angle increased from 0° to 1°, the outlet pressure increased from 3919 Pa to 17,995 Pa—an increase of 359.2%. Thus, by slightly increasing the taper angle of the hub, the pressure difference was greatly increased. Therefore, the conical design of the hub was able to reduce the size of the blood pump while meeting the pressure difference requirement.
Shear stress analysis showed that high shear stress had a large influence on the hemolysis performance of the blood pump. It is necessary, therefore, to avoid the presence of high shear areas in the design of axial blood pumps to improve hemolysis performance.
The results of the hemolysis prediction model showed that the hemolysis prediction value was negatively correlated with the radial clearance of the blood pump. When the radial clearance was large, the hemolysis prediction value was small. However, when the clearance was too large, it caused blood backflow. When the hub taper angle was 0.72°, the hemolysis prediction value was lower than that of the traditional axial blood pump. Thus, the conical design can serve as a reference for the optimization of the axial blood pump and the reduction of the hemolysis prediction value.
In this study, only CFD simulations were carried out. Experimental studies will follow in our future work.

Author Contributions

Conceptualization, W.-B.Y. and H.-C.W.; methodology, W.-B.Y.; software, S.-J.P. and J.Z.; validation, W.-B.Y., J.Z. and W.-H.X.; formal analysis, Y.-F.H.; investigation, M.L.; resources, H.-C.W.; data curation, S.-J.P.; writing—original draft preparation, W.-B.Y.; writing—review and editing, W.-H.X.; visualization, S.-J.P.; supervision, Y.-F.H.; project administration, Y.-F.H.; funding acquisition, Y.-F.H. All authors have read and agreed to the published version of the manuscript.

Funding

This research was funded by the National Key R&D Program of China grant number 2018YFB2000103.

Institutional Review Board Statement

Not applicable.

Informed Consent Statement

Not applicable.

Data Availability Statement

Not applicable.

Acknowledgments

The project was supported by the National Key R&D Program of China, with grant number 2018YFB2000103.

Conflicts of Interest

The authors declare no conflict of interest.

References

  1. Croce, L.; Noseda, V.; Bertelli, A.; Bossi, E. Sudden and unexpected death from heart disease. Epidemiologic, anatomo- and physiopathologic aspects. A study of 1047 cases. Cardiology 1960, 37, 331–360. [Google Scholar]
  2. Steiner, R.E. The roentgenology of pulmonary manifestations in mitral heart disease and left heart failure. Prog. Cardiovasc. Dis. 1959, 2, 1–19. [Google Scholar] [CrossRef]
  3. Peichl, P.; Skalsk, I.; Kautzner, J. Successful catheter ablation of ventricular tachycardia in patient with ventricular assist device. Interv. A Akutni Kardiol. 2011, 10, 260–262. [Google Scholar]
  4. Saxena, P.; Marasco, S.F. Tunneling a pulmonary artery graft: A simplified way to insert and remove a temporary right ventricular assist device. Tex. Heart Inst. J. 2015, 42, 540. [Google Scholar] [CrossRef] [Green Version]
  5. Liu, G.M.; Zhang, Y.; Chen, H.B.; Hou, J.F.; Jin, D.H.; Gui, X.M.; Hu, S.S. Platelet deposition estimation: A novel method for emulating the pump thrombosis potential of blood pumps. Artif. Organs 2020, 44, 465–472. [Google Scholar] [CrossRef]
  6. Goubergrits, L.; Osman, J.; Mevert, R.; Kertzscher, U.; Kai, P.; Hege, H.C. Turbulence in blood damage modeling. Int. J. Artif. Organs 2016, 39, 160–165. [Google Scholar] [CrossRef]
  7. Wu, H.; Gong, G.; Wang, Z.; Hu, Y.; Song, C. Structural design and numerical simulation of the diffuser for maglev axial blood pump. J. Mech. Med. Biol. 2014, 14, 1450045. [Google Scholar] [CrossRef]
  8. Yoganathan, A.P.; Chandran, K.B.; Sotiropoulos, F. Flow in prosthetic heart valves: State-of-the-art and future directions. Ann. Biomed. Eng. 2005, 33, 1689–1694. [Google Scholar] [CrossRef]
  9. Taylor, C.A.; Steinman, D.A. Image-based modeling of blood flow and vessel wall dynamics: Applications, methods and future directions. Ann. Biomed. Eng. 2010, 38, 1188–1203. [Google Scholar] [CrossRef]
  10. Faghih, M.M.; Sharp, M.K. Modeling and prediction of flow-induced hemolysis: A review. Biomech. Modeling Mechanobiol. 2019, 18, 845–881. [Google Scholar] [CrossRef]
  11. Breńkacz, L.; Witanowski, L.; Drosińska-Komor, M.; Szewczuk-Krypa, N. Research and applications of active bearings: A state-of-the-art review. Mech. Syst. Signal Processing 2021, 151, 107423. [Google Scholar] [CrossRef]
  12. Nielsen, K.K.; Bahl, C.R.H.; Dagnaes, N.A.; Santos, I.F.; Bjørk, R. A passive permanent magnetic bearing with increased axial lift relative to radial stiffness. IEEE Trans. Magn. 2020, 57, 1–8. [Google Scholar] [CrossRef]
  13. Safaeian, R.; Heydari, H. Optimal design of passive permanent magnet bearings. In Proceedings of the 27th Iranian Conference on Electrical Engineering (ICEE), Yazd, Iran, 30 April–2 May 2019. [Google Scholar]
  14. Zhou, B.; Jing, T.; Wang, F.; He, Z. Numerical analysis of two-stage axial blood pump based on blood damage. J. Biomed. Eng. 2016, 33, 686–690. [Google Scholar]
  15. Shou, C.; Guo, Y.J.; Su, L.; Li, Y. Numerical assessment of impeller features of centrifugal blood pump based on fast hemolysis approximation model. J. Biomed. Eng. 2014, 31, 1260–1264. [Google Scholar]
  16. Hao, L.; Zhong, Y. Investigation on hydrodynamics and hemolysis prediction of an axial flow blood pump. Mech. Eng. 2016, 8, 10–15. [Google Scholar]
  17. Houston, S.; Patel, S.; Badheka, A.; Lee-Son, K. Clearance of severely elevated plasma free hemoglobin with total plasma exchange in a pediatric ECMO patient. Perfusion 2021, 02676591211021946. [Google Scholar] [CrossRef]
  18. Kang, C.; Huang, Q.; Li, Y. Fluid dynamics aspects of miniaturized axial-flow blood pump. Bio-Med. Mater. Eng. 2013, 23, S743–S749. [Google Scholar] [CrossRef]
  19. Zhao, W.; Pan, X.; Ji, J.; Xu, L.; Zheng, J. Analysis of PM eddy current loss in four-phase fault-tolerant flux-switching permanent-magnet machines by air-gap magnetic field modulation theory. IEEE Trans. Ind. Electron. 2019, 67, 5369–5378. [Google Scholar] [CrossRef]
  20. Gao, Y.; Araki, Y.; Dozono, H.; Muramatsu, K.; Guan, W.; Yuan, J.; Tian, C.; Chen, B. Modeling of anomalous eddy current losses due to movement of domain walls in particles of a soft magnetic composite. IEEE Trans. Magn. 2020, 56, 1–4. [Google Scholar] [CrossRef]
  21. Huo, J.D.; Wu, P.; Zhang, L.; Wu, W.T. Large eddy simulation as a fast and accurate engineering approach for the simulation of rotary blood pumps. Int. J. Artif. Organs 2021, 44, 887–899. [Google Scholar] [CrossRef]
  22. De Bartolo, C.D.; Nigro, A.; Fragomeni, G.; Colacino, F.M.; Wang, D.; Jones, C.C.; Zwischenberger, J. Numerical and experimental flow analysis of the Wang-Zwische double-lumen cannula. Asaio J. 2011, 57, 318. [Google Scholar] [CrossRef] [PubMed]
  23. Benim, A.C.; Frank, T.; Assmann, A.; Lichtenberg, A.; Akhyari, P. Computational investigation of hemodynamics in hardshell venous reservoirs: A comparative study. Artif. Organs. 2020, 44, 411–418. [Google Scholar] [CrossRef] [PubMed]
  24. Xu, J.; Wang, W.; Li, J. Optimization design for the magnetic-liquid suspension blood pump by using CFD. Chin. Hydraul. Pneum. 2013, 3, 61. [Google Scholar]
  25. Mulholland, J.W.; Shelton, J.C.; Luo, X.Y. Blood flow and dam age by the roller pumps during card input monary bypass. J. Fluids Struct. 2005, 20, 129–140. [Google Scholar] [CrossRef]
  26. Celik, I.B.; Ghia, U.; Roache, P.J.; Freitas, C.J. Procedure for estimation and reporting of uncertainty due to discretization in CFD applications. J. Fluids Eng. 2008, 130, 078001. [Google Scholar]
  27. Ya-Min, M.A.; Xiao-Long, J.I.; Yin, T. The observation of human erythrocytes processed by several solutions under Atomic Force Microscopy. Chin. J. Lab. Diagn. 2005, 9, 514–518. [Google Scholar]
  28. Nygaard, H.; Giersiepen, M.; Hasenkam, J.M.; Reul, H.; Paulsen, P.K.; Rovsing, P.E.; Westphal, D. Two-dimensional color-mapping of turbulent shear stress distribution downstream of two aortic bioprosthetic valves in vitro. J. Biomech. 1992, 25, 429–440. [Google Scholar] [CrossRef]
  29. Bludszuweit, C. Model for a general mechanical blood damage prediction. Artif. Organs 2010, 19, 583–589. [Google Scholar] [CrossRef] [PubMed]
  30. Li, M. Optimization-and-Experimental-Study-of Flow—Channel of Conical Axial·Blood·Pump; Wuhan University of Technology: Wuhan, China, 2021. [Google Scholar]
  31. Fangqun, W.; Lan, L.; Zhigang, F.; Kunxi, Q. Prediction of shear stress-related hemolysis in centrifugal blood pumps by computational fluid dynamics. Prog. Nat. Sci. 2005, 15, 951–955. [Google Scholar] [CrossRef]
Figure 1. (a) Structure of the conical spiral axial blood pump and three-dimensional model. (b) Dimensions and five-degree-of-freedom levitation of the axial blood pump and rotor.
Processes 10 00853 g001
Figure 2. (a) Model of the conical spiral axial blood pump. (b) Photo of the impeller.
Processes 10 00853 g002
Figure 3. Electrodynamic radial bearing.
Processes 10 00853 g003
Figure 4. Flow channel meshing model. (a) Whole flow channel, (b) front guide wheel section, (c) impeller section, and (d) rear guide wheel section.
Processes 10 00853 g004
Figure 5. Mesh sensitivity analysis. (a) Viscosity versus number of meshes. (b) Pressure versus number of meshes. (c) Outlet flow velocity versus number of meshes.
Processes 10 00853 g005
Figure 6. Particles of blood when released.
Processes 10 00853 g006
Figure 7. Relationship between the taper angle of the hub and the pressure difference between the inlet and outlet.
Processes 10 00853 g007
Figure 8. Streamline distribution and turbulent viscosity of the blood pump at taper angles of (a) 0°, (b) 0.25°, (c) 0.5°, (d) 0.75°, and (e) 1°.
Processes 10 00853 g008
Figure 9. Relationship between the number of blades of the rear guide wheel and the outlet pressure.
Processes 10 00853 g009
Figure 10. Streamline distribution and turbulent viscosity when the rear guide wheel has (a) two blades, (b) three blades, (c) four blades, (d) five blades, and (e) six blades.
Processes 10 00853 g010aProcesses 10 00853 g010b
Figure 11. Pressure of whole flow area.
Processes 10 00853 g011
Figure 12. Trajectory independence verification.
Processes 10 00853 g012
Figure 13. Hemolysis prediction values of blood cells.
Processes 10 00853 g013
Figure 14. Amplitude of shear stress distribution.
Processes 10 00853 g014
Figure 15. Relationship between the clearance and the hemolysis prediction value.
Processes 10 00853 g015
Figure 16. Distribution of hemolysis prediction values for radial clearance of (a) 0.3 mm, (b) 0.4 mm, (c) 0.5 mm, and (d) 0.6 mm.
Processes 10 00853 g016
Table 1. Simulation results comparison between different models.
Viscous ModelsRealizable k-EpsilonRNG
k-Epsilon
SST
k-Omega
Standard
k-Epsilon
Standard
k-Omega
Viscous force of impeller zone (N)0.140.150.170.150.18
Total force of impeller zone (N)0.320.290.350.370.38
Publisher’s Note: MDPI stays neutral with regard to jurisdictional claims in published maps and institutional affiliations.

