
Comparison between Regression Models, Support Vector Machine (SVM), and Artificial Neural Network (ANN) in River Water Quality Prediction

 ,
,  , ,
, , 
Abstract
:1. Introduction
2. Methodology
2.1. Study Area
2.2. Data Pre-Processing
2.3. Models Development
2.4. Model Performance Evaluation
3. Results and Discussion
Comparisons between Regression, SVM, and ANN models
4. Conclusions
Author Contributions
Funding
Data Availability Statement
Acknowledgments
Conflicts of Interest
References
- Varol, M. Use of water quality index and multivariate statistical methods for the evaluation of water quality of a stream affected by multiple stressors: A case study. Environ. Pollut. 2020, 266, 115417. [Google Scholar] [CrossRef]
- Mekuria, D.M.; Kassegne, A.B.; Asfaw, S.L. Assessing pollution profiles along Little Akaki River receiving municipal and industrial wastewaters, Central Ethiopia: Implications for environmental and public health safety. Heliyon 2021, 7, e07526. [Google Scholar] [CrossRef] [PubMed]
- Hayder, G.; Solihin, M.I.; Mustafa, H.M. Modelling of river flow using particle swarm optimized cascade-forward neural networks: A case study of Kelantan River in Malaysia. Appl. Sci. 2020, 10, 8670. [Google Scholar] [CrossRef]
- Al-Sulttani, A.O.; Al-Mukhtar, M.; Roomi, A.B.; Farooque, A.A.; Khedher, K.M.; Yaseen, Z.M. Proposition of new ensemble data-intelligence models for surface water quality prediction. IEEE Access 2021, 9, 108527–108541. [Google Scholar] [CrossRef]
- Jagaba, A.H.; Kutty, S.R.M.; Hayder, G.; Baloo, L.; Abubakar, S.; Ghaleb, A.A.S.; Lawal, I.M.; Noor, A.; Umaru, I.; Almahbashi, N.M.Y. Water quality hazard assessment for hand dug wells in Rafin Zurfi, Bauchi State, Nigeria. Ain Shams Eng. J. 2020, 11, 983–999. [Google Scholar] [CrossRef]
- Fathi, E.; Zamani-Ahmadmahmoodi, R.; Zare-Bidaki, R. Water quality evaluation using water quality index and multivariate methods, Beheshtabad River, Iran. Appl. Water Sci. 2018, 8, 1–6. [Google Scholar] [CrossRef] [Green Version]
- Kang, G.; Gao, J.Z.; Xie, G. Data-driven water quality analysis and prediction: A survey. In Proceedings of the 2017 IEEE Third International Conference on Big Data Computing Service and Applications (BigDataService), Redwood City, CA, USA, 6–9 April 2017; pp. 224–232. [Google Scholar]
- Alqahtani, A.; Shah, M.I.; Aldrees, A.; Javed, M.F. Comparative Assessment of Individual and Ensemble Machine Learning Models for Efficient Analysis of River Water Quality. Sustainability 2022, 14, 1183. [Google Scholar] [CrossRef]
- Hmoud Al-Adhaileh, M.; Waselallah Alsaade, F. Modelling and prediction of water quality by using artificial intelligence. Sustainability 2021, 13, 4259. [Google Scholar] [CrossRef]
- Koranga, M.; Pant, P.; Kumar, T.; Pant, D.; Bhatt, A.K.; Pant, R.P. Efficient water quality prediction models based on machine learning algorithms for Nainital Lake, Uttarakhand. Mater. Today Proc. 2022, 57, 1706–1712. [Google Scholar] [CrossRef]
- El Bilali, A.; Taleb, A. Prediction of irrigation water quality parameters using machine learning models in a semi-arid environment. J. Saudi Soc. Agric. Sci. 2020, 19, 439–451. [Google Scholar] [CrossRef]
- Moubayed, A. Optimization Modeling and Machine Learning Techniques towards Smarter Systems and Processes. Ph.D. Thesis, The University of Western Ontario, London, ON, Canada, 2018; p. 5573. [Google Scholar]
- Gakii, C.; Jepkoech, J. A classification model for water quality analysis using decision tree. Eur. J. Comput. Sci. Inf. Technol. 2019, 7, 1–8. [Google Scholar]
- Niroobakhsh, M.; Musavi-Jahromi, S.H.; Manshouri, M.; Sedghi, H. Prediction of water quality parameter in Jajrood River basin: Application of multi layer perceptron (MLP) perceptron and radial basis function networks of artificial neural networks (ANNs). Afr. J. Agric. Res. 2012, 7, 4131–4139. [Google Scholar] [CrossRef]
- Talib, A.; Amat, M.I. Prediction of chemical oxygen demand in Dondang River using artificial neural network. Int. J. Inf. Educ. Technol. 2012, 2, 259–261. [Google Scholar] [CrossRef]
- Najah, A.; El-Shafie, A.H.A.H.; Karim, O.A.; Jaafar, O.; El-Shafie, A.H. An application of different artificial intelligences techniques for water quality prediction. Int. J. Phys. Sci. 2011, 6, 5298–5308. [Google Scholar] [CrossRef]
- Zhao, J.; Guo, H.; Han, M.; Tang, H.; Li, X. Gaussian process regression for prediction of sulfate content in lakes of China. J. Eng. Technol. Sci. 2019, 51, 198–215. [Google Scholar] [CrossRef] [Green Version]
- Dogan, E.; Sengorur, B.; Koklu, R. Modeling biological oxygen demand of the Melen River in Turkey using an artificial neural network technique. J. Environ. Manag. 2009, 90, 1229–1235. [Google Scholar] [CrossRef]
- Basheer, A.O.; Hanafiah, M.M.; Abdulhasan, M.J. A study on water quality from Langat River, Selangor. Acta Sci. Malays. (ASM) 2017, 1, 1–4. [Google Scholar] [CrossRef]
- Soo, E.Z.X.; Jaafar, W.Z.W.; Lai, S.H.; Othman, F.; Elshafie, A.; Islam, T.; Srivastava, P.; Hadi, H.S.O. Evaluation of bias-adjusted satellite precipitation estimations for extreme flood events in Langat river basin, Malaysia. Hydrol. Res. 2020, 51, 105–126. [Google Scholar] [CrossRef]
- Hassim, M.; Yuzir, A.; Razali, M.N.; Ros, F.C.; Chow, M.F.; Othman, F. Comparison of rainfall interpolation methods in Langat River Basin. IOP Conference Series: Earth Environ. Sci. 2020, 479, 012018. [Google Scholar] [CrossRef]
- Saudi, A.S.M.; Kamarudin, M.K.A.; Ridzuan, I.S.D.; Ishak, R.; Azid, A.; & Rizman, Z.I. Flood risk index pattern assessment: Case study in Langat river basin. J. Fundam. Appl. Sci. 2017, 9, 12–27. [Google Scholar] [CrossRef] [Green Version]
- Rizal, N.N.M.; Hayder, G.; Yussof, S. River water quality prediction and analysis—Deep learning predictive models approach. In Advances in Science, Engineering, and Technology (ASTI); (Submitted for review-in press); Springer: Berlin/Heidelberg, Germany.
- Rizal, N.N.M.; Hayder, G.; Yusof, K.A. Water quality predictive analytics using an artificial neural network with a graphical user interface. Water 2022, 14, 1221. [Google Scholar] [CrossRef]
- Ahmed, M.F.; Mokhtar, M.; Alam, L.; Ta, G.C.; Lee, K.E.; Khalid, R.M. Recognition of local authority for better management of drinking water at the Langat River Basin, Malaysia. Int. J. Eng. Technol. 2018, 7, 148–154. [Google Scholar] [CrossRef]
- Chen, Y.; Song, L.; Liu, Y.; Yang, L.; Li, D. A review of the artificial neural network models for water quality prediction. Appl. Sci. 2020, 10, 5776. [Google Scholar] [CrossRef]
- Chollet, F. Deep Learning with Python; Manning: Shelter Island, NY, USA, 2021. [Google Scholar]
- Tiyasha; Tung, T.M.; Yaseen, Z.M. Asurvey on river water quality modellinh using artificial intelligence models: 2000–2020. J. Hydrol. 2020, 585, 124670. [Google Scholar] [CrossRef]
- Ewusi, A.; Ahenkorah, I.; Aikins, D. Modelling of total dissolved solids in water supply systems using regression and supervised machine learning approaches. Appl. Water Sci. 2021, 11, 1–16. [Google Scholar] [CrossRef]
- Li, X.; Sha, J.; Wang, Z.L. A comparative study of multiple linear regression, artificial neural network and support vector machine for the prediction of dissolved oxygen. Hydrol. Res. 2017, 48, 1214–1225. [Google Scholar] [CrossRef]
- Abobakr Yahya, A.S.; Ahmed, A.N.; Binti Othman, F.; Ibrahim, R.K.; Afan, H.A.; El-Shafie, A.; Fai, C.M.; Hossain, M.S.; Ehteram, M.; Elshafie, A. Water quality prediction model based support vector machine model for ungauged river catchment under dual scenarios. Water 2019, 11, 1231. [Google Scholar] [CrossRef] [Green Version]
- Rajaee, T.; Jafari, H. Two decades on the artificial intelligence models advancement for modeling river sediment concentration: State-of-the-art. J. Hydrol. 2020, 588, 125011. [Google Scholar] [CrossRef]


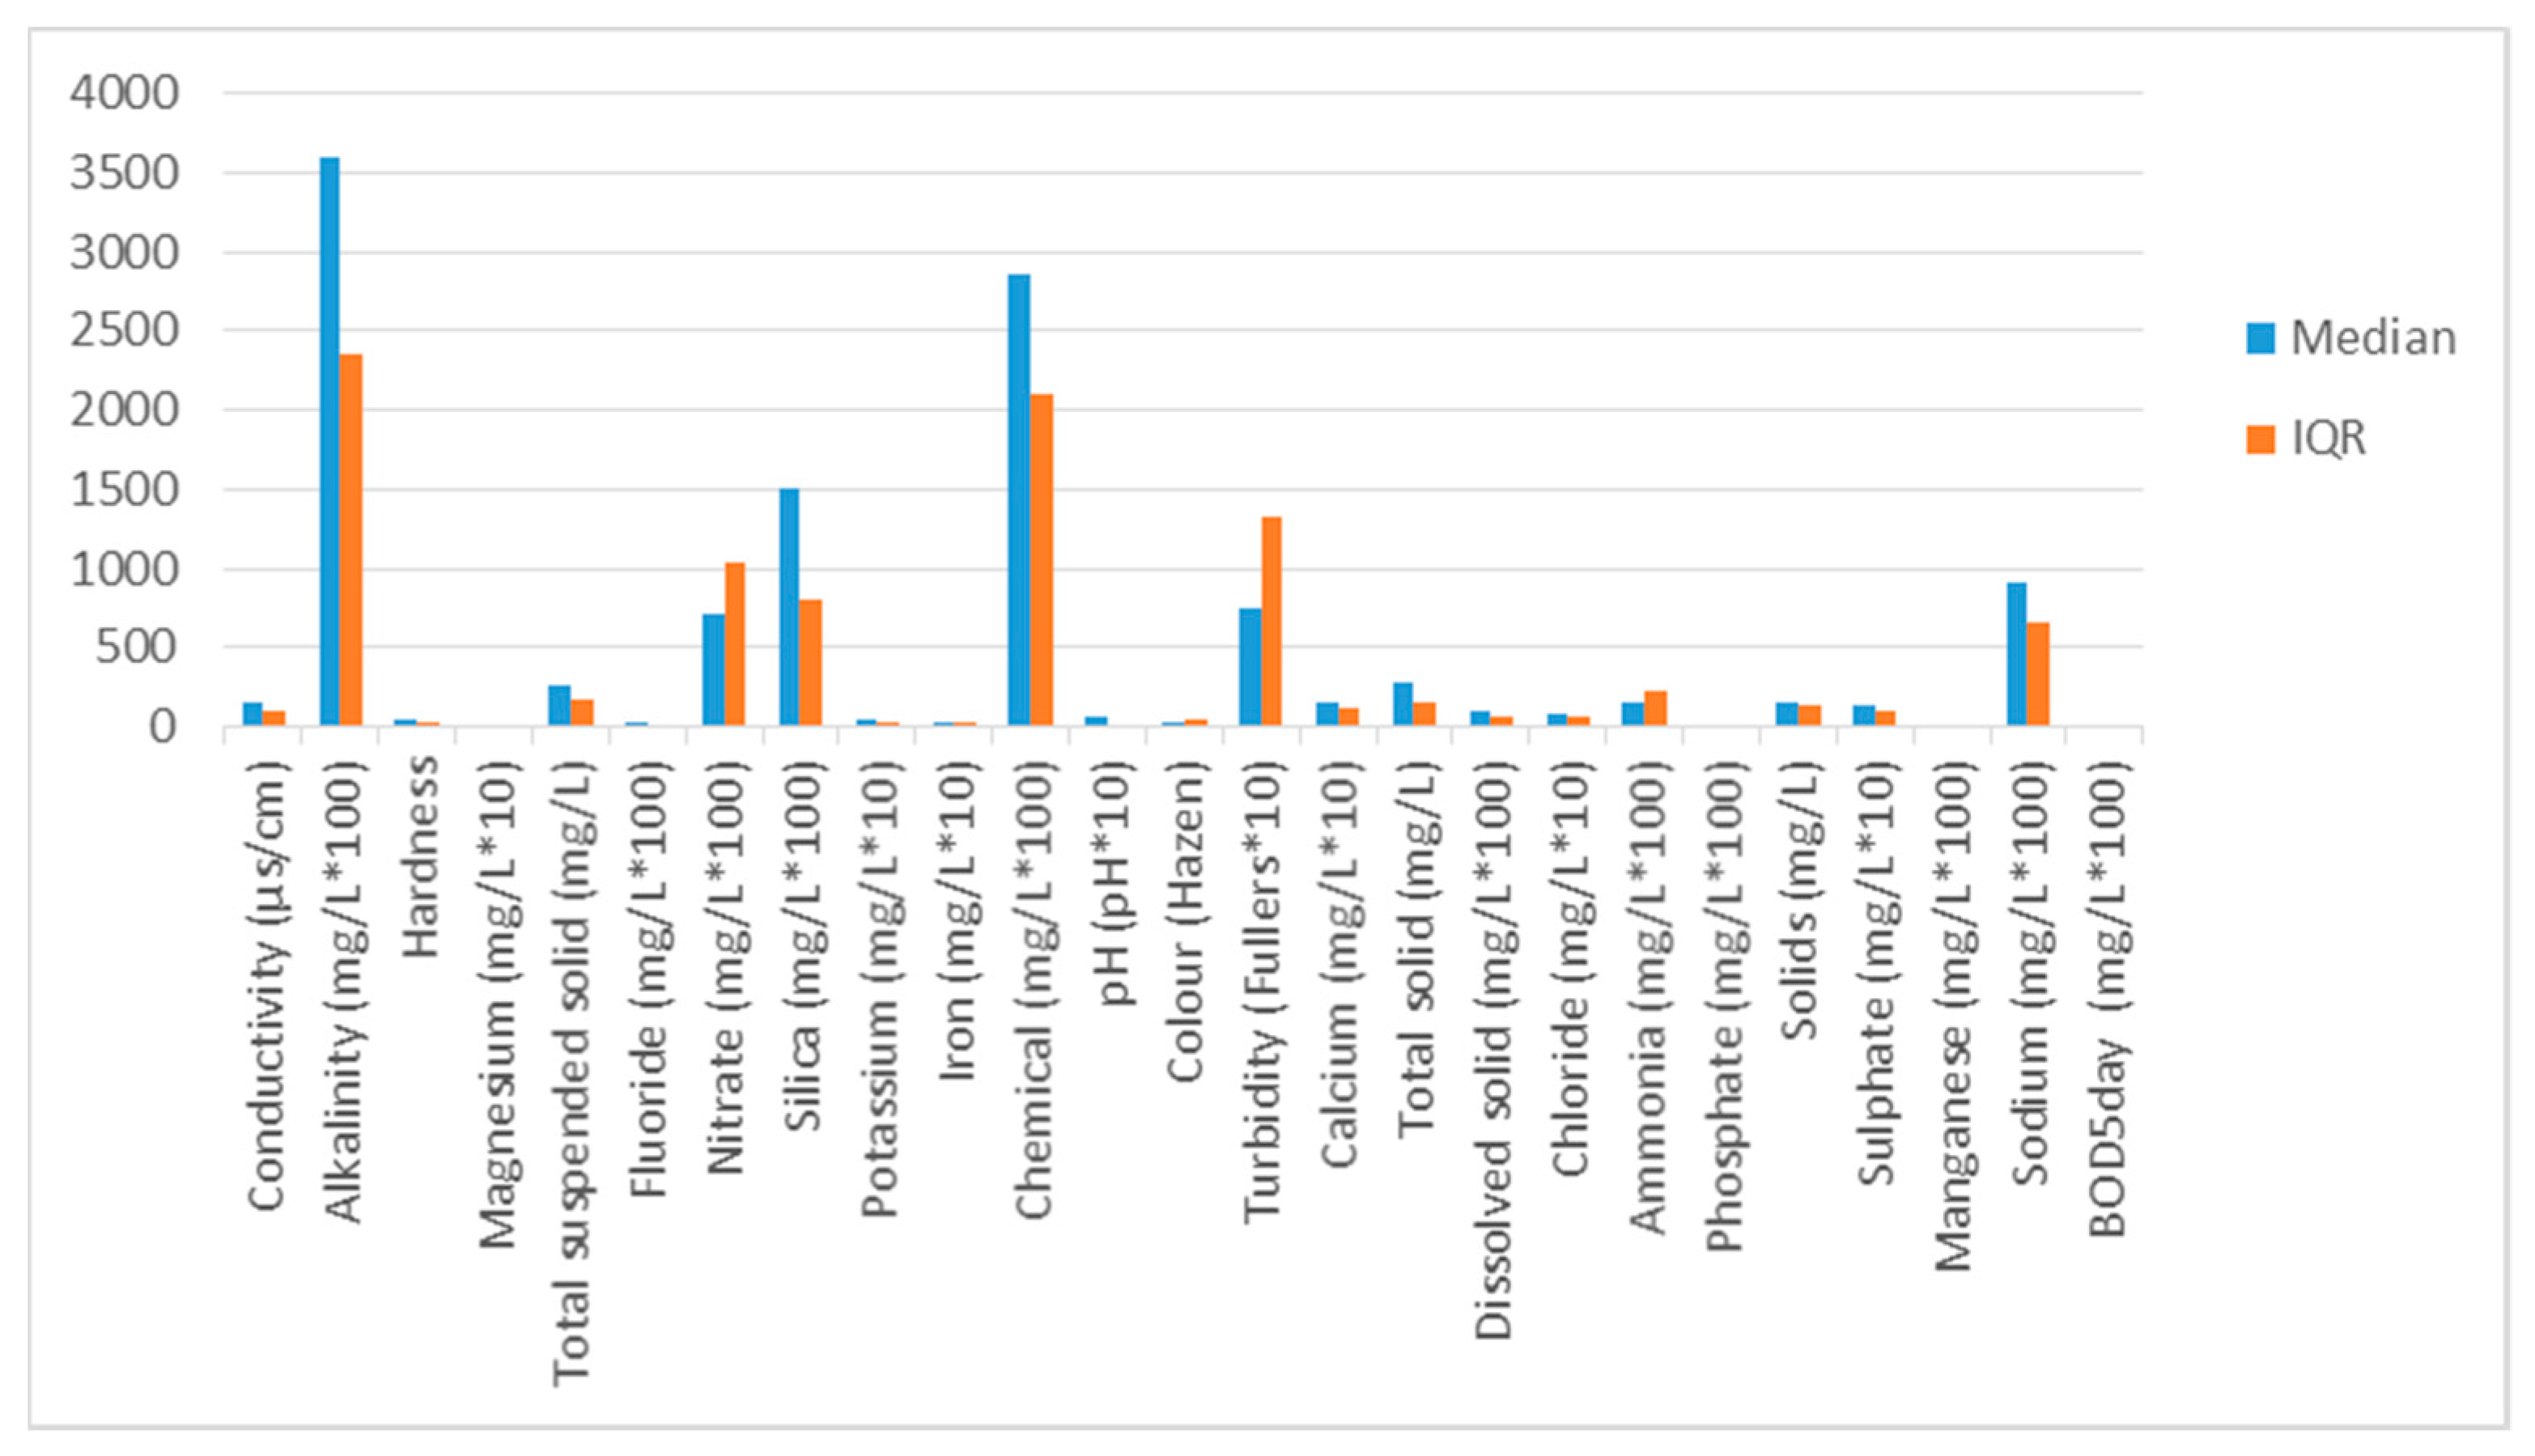
| Variable | Median | IQR |
|---|---|---|
| Conductivity (µs/cm) | 150 | 99 |
| Alkalinity (mg/L × 100) | 3600 | 2350 |
| Hardness | 44 | 30 |
| Magnesium (mg/L × 10) | 10 | 5 |
| Total suspended solid (mg/L) | 266.81 | 165.92 |
| Fluoride (mg/L × 100) | 30 | 12 |
| Nitrate (mg/L × 100) | 710 | 1035 |
| Silica (mg/L × 100) | 1500 | 800 |
| Potassium (mg/L × 10) | 46.5 | 21.25 |
| Iron (mg/L × 10) | 34.5 | 28.5 |
| Chemical (mg/L × 100) | 2850 | 2100 |
| pH (pH × 10) | 65 | 5 |
| Colour (Hazen) | 30 | 50 |
| Turbidity (Fullers × 10) | 750 | 1320 |
| Calcium (mg/L × 10) | 160 | 115.5 |
| Total solid (mg/L) | 284 | 154 |
| Dissolved solid (mg/L × 100) | 94 | 71 |
| Chloride (mg/L × 10) | 82 | 55 |
| Ammonia (mg/L × 100) | 160 | 228 |
| Phosphate (mg/L × 100) | 10 | 0 |
| Solids (mg/L) | 158 | 134 |
| Sulphate (mg/L × 10) | 130 | 97.75 |
| Manganese (mg/L × 100) | 12 | 11 |
| Sodium (mg/L × 100) | 920 | 650 |
| BOD5day (mg/L × 100) | 3 | 6 |
| Type of Model | Parameters | Default Value |
|---|---|---|
| Regression Tree | Minimum leaf size: | 4 |
| -Fine Tree Model | ||
| Regression Tree | Minimum leaf size: | 12 |
| -Medium Tree Model | ||
| Ensemble Tree -Boosted Tree Model | Minimum leaf size: | 8 |
| Number of learners: | 30 | |
| Learning rate: | 0.1 | |
| Ensemble Tree | Minimum leaf size: | 8 |
| -Bagged Tree Model | Number of learners: | 30 |
| Gaussian Process Regression | Basis function: | Constant |
| -Exponential GPR | Kernel function: | Exponential |
| Gaussian Process Regression | Basis function: | Constant |
| -Rational Quadratic GPR | Kernel function: | Rational quadratic |
| Artificial Neural Network | Training algorithm: | Levenberg-Marquardt |
| Epoch: | 0–100 epochs | |
| Support Vector Machine | Kernel function: | Gaussian |
| -Fine Gaussian SVM | Kernel scale: | 1.2 |
| Support Vector Machine | Kernel function: | Gaussian |
| -Medium Gaussian SVM | Kernel scale: | 4.9 |
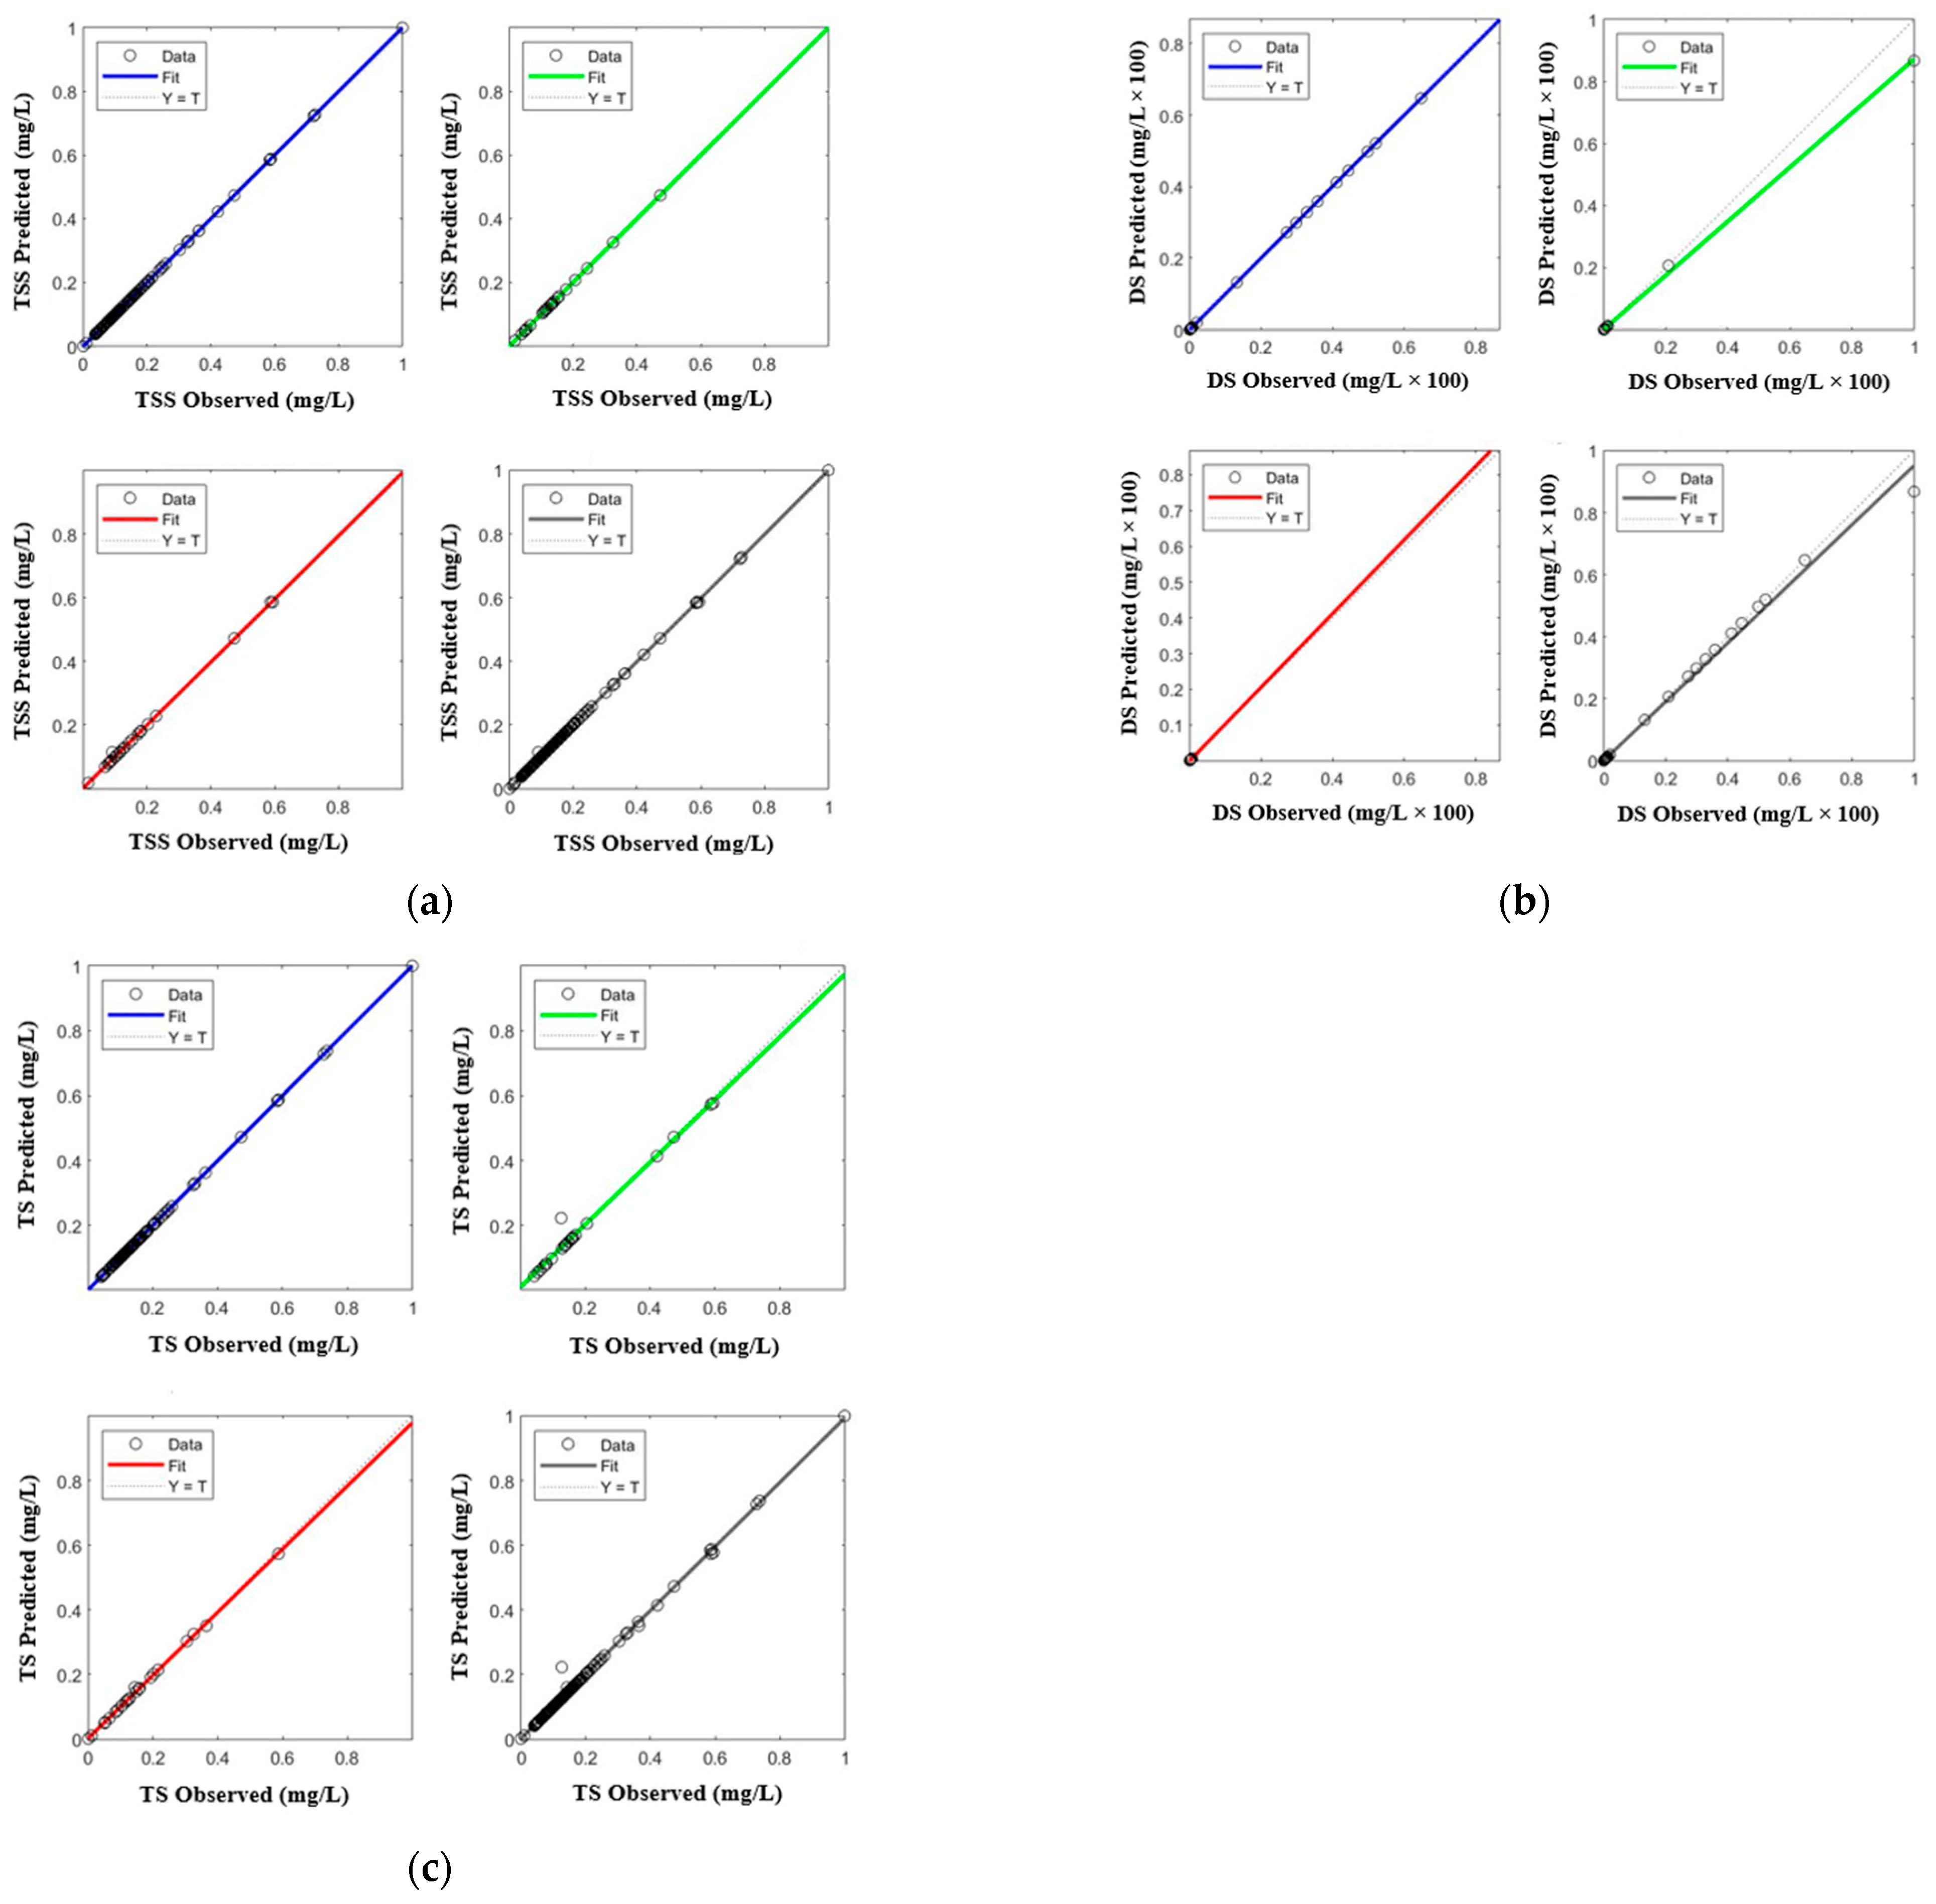
| Parameters | Type of Models | R2 | MSE | RMSE |
|---|---|---|---|---|
| TSS (mg/L) | Fine Tree | 0.8200 | 0.0004 | 0.0195 |
| Medium Tree | 0.0000 | 0.0021 | 0.0462 | |
| Boosted Tree | 0.8100 | 0.0004 | 0.0203 | |
| Bagged Tree | 0.7000 | 0.0006 | 0.0254 | |
| Rational Quadratic GPR | 0.9600 | 7.6799 × 10⁻⁵ | 0.0088 | |
| Exponential GPR | 0.7200 | 0.0006 | 0.0243 | |
| Fine Gaussian SVM | 0.0000 | 0.0021 | 0.0461 | |
| Medium Gaussian SVM | 0.4900 | 0.0011 | 0.0328 | |
| Artificial Neural Network | 0.9988 | 2.7904 × 10⁻⁵ | 5.2824 × 10⁻³ | |
| DS (mg/L × 100) | Fine Tree | 0.5400 | 2.5927 × 10⁻⁶ | 0.0016 |
| Medium Tree | 0.0000 | 5.6248 × 10⁻⁶ | 0.0024 | |
| Boosted Tree | 0.5400 | 2.5839 × 10⁻⁶ | 0.0016 | |
| Bagged Tree | 0.4700 | 2.9763 × 10⁻⁶ | 0.0017 | |
| Rational Quadratic GPR | 0.6200 | 2.1625 × 10⁻⁶ | 0.0015 | |
| Exponential GPR | 0.4400 | 3.1423 × 10⁻⁶ | 0.0018 | |
| Fine Gaussian SVM | 0.0500 | 5.3231 × 10⁻⁶ | 0.0023 | |
| Medium Gaussian SVM | 0.2800 | 4.0532 × 10⁻⁶ | 0.0020 | |
| Artificial Neural Network | 0.9835 | 6.2799 × 10⁻⁸ | 2.5060 × 10⁻⁹ | |
| TS (mg/L) | Fine Tree | 0.7800 | 0.0005 | 0.0213 |
| Medium Tree | 0.0000 | 0.0021 | 0.0457 | |
| Boosted Tree | 0.8200 | 0.0004 | 0.0193 | |
| Bagged Tree | 0.5700 | 0.0009 | 0.0299 | |
| Rational Quadratic GPR | 0.9600 | 8.5497 × 10⁻⁵ | 0.0092 | |
| Exponential GPR | 0.7500 | 0.0005 | 0.0228 | |
| Fine Gaussian SVM | 0.0000 | 0.0021 | 0.0456 | |
| Medium Gaussian SVM | 0.5400 | 0.0010 | 0.0319 | |
| Artificial Neural Network | 0.9880 | 0.8484 × 10⁻⁵ | 5.3370 × 10⁻³ |
| Parameters | Type of Models | R2 | MSE | RMSE |
|---|---|---|---|---|
| TSS (mg/L) | Fine Tree | 0.9200 | 0.0017 | 0.0418 |
| Medium Tree | 0.8100 | 0.0042 | 0.0649 | |
| Boosted Tree | 0.9200 | 0.0018 | 0.0429 | |
| Bagged Tree | 0.8600 | 0.0031 | 0.0556 | |
| Rational Quadratic GPR | 1.00 | 3.2522 × 10⁻⁷ | 0.0006 | |
| Exponential GPR | 0.9500 | 0.0012 | 0.0350 | |
| Fine Gaussian SVM | 0.1600 | 0.0189 | 0.1376 | |
| Medium Gaussian SVM | 0.6100 | 0.0088 | 0.0937 | |
| Artificial Neural Network | 0.9998 | 4.1676 × 10⁻⁶ | 0.0020 | |
| DS (mg/L × 100) | Fine Tree | 0.7500 | 0.0040 | 0.0636 |
| Medium Tree | 0.5800 | 0.0063 | 0.0826 | |
| Boosted Tree | 0.7900 | 0.0035 | 0.0590 | |
| Bagged Tree | 0.5700 | 0.0069 | 0.0832 | |
| Rational Quadratic GPR | 1.00 | 4.8138 × 10⁻⁸ | 0.0002 | |
| Exponential GPR | 0.9000 | 0.0017 | 0.0411 | |
| Fine Gaussian SVM | 0.7500 | 0.0040 | 0.0636 | |
| Medium Gaussian SVM | −0.0300 | 0.0167 | 0.1292 | |
| Artificial Neural Network | 0.9953 | 0.0001 | 0.0104 | |
| TS (mg/L) | Fine Tree | 0.9200 | 0.0017 | 0.0409 |
| Medium Tree | 0.8300 | 0.0037 | 0.0605 | |
| Boosted Tree | 0.9300 | 0.0016 | 0.0395 | |
| Bagged Tree | 0.8600 | 0.0030 | 0.0546 | |
| Rational Quadratic GPR | 1.00 | 3.118 × 10⁻⁷ | 0.0006 | |
| Exponential GPR | 0.9400 | 0.0013 | 0.0358 | |
| Fine Gaussian SVM | 0.1800 | 0.0177 | 0.1331 | |
| Medium Gaussian SVM | 0.6300 | 0.0080 | 0.0895 | |
| Artificial Neural Network | 0.9970 | 6.5419 × 10⁻⁵ | 0.0081 |
Publisher’s Note: MDPI stays neutral with regard to jurisdictional claims in published maps and institutional affiliations. |
© 2022 by the authors. Licensee MDPI, Basel, Switzerland. This article is an open access article distributed under the terms and conditions of the Creative Commons Attribution (CC BY) license (https://creativecommons.org/licenses/by/4.0/).
Share and Cite
Najwa Mohd Rizal, N.; Hayder, G.; Mnzool, M.; Elnaim, B.M.E.; Mohammed, A.O.Y.; Khayyat, M.M. Comparison between Regression Models, Support Vector Machine (SVM), and Artificial Neural Network (ANN) in River Water Quality Prediction. Processes 2022, 10, 1652. https://0-doi-org.brum.beds.ac.uk/10.3390/pr10081652
Najwa Mohd Rizal N, Hayder G, Mnzool M, Elnaim BME, Mohammed AOY, Khayyat MM. Comparison between Regression Models, Support Vector Machine (SVM), and Artificial Neural Network (ANN) in River Water Quality Prediction. Processes. 2022; 10(8):1652. https://0-doi-org.brum.beds.ac.uk/10.3390/pr10081652
Chicago/Turabian StyleNajwa Mohd Rizal, Nur, Gasim Hayder, Mohammed Mnzool, Bushra M. E. Elnaim, Adil Omer Yousif Mohammed, and Manal M. Khayyat. 2022. "Comparison between Regression Models, Support Vector Machine (SVM), and Artificial Neural Network (ANN) in River Water Quality Prediction" Processes 10, no. 8: 1652. https://0-doi-org.brum.beds.ac.uk/10.3390/pr10081652