Article

Enzymatic Synthesis Process of EPA- and DHA-Enriched Structured Acylglycerols at the sn-2 Position Starting from Commercial Salmon Oil and Concentrated by Response Surface Methodology under Supercritical Conditions

by
Gretel Dovale-Rosabal
1,
Alejandra Espinosa
2,3,
Alicia Rodríguez
1,*,
Andrés Barriga
4,
Alan Palomino-Calderón
1 and
Santiago P. Aubourg
5,*
1
Department of Food Science and Chemical Technology, Faculty of Chemical and Pharmaceutical Sciences, University of Chile, Carlos Lorca Tobar 964, Santiago 8380494, Chile
2
Escuela de Medicina, Universidad de Valparaíso, Valparaíso 2340000, Chile
3
Department of Medical Technology, Faculty of Medicine, University of Chile, Independencia 1027, Santiago 8380000, Chile
4
Centre of Studies for the Development of Chemistry (CEPEDEQ), Faculty of Chemical and Pharmaceutical Sciences, University of Chile, Carlos Tobar 964, Santiago 8380494, Chile
5
Department of Food Technology, Marine Research Institute (CSIC), Eduardo Cabello, 6, 36208 Vigo, Spain
*
Authors to whom correspondence should be addressed.
Submission received: 23 December 2022 / Revised: 3 February 2023 / Accepted: 8 February 2023 / Published: 10 February 2023

Abstract

:
The bioavailability of n-3 long-chain polyunsaturated fatty acids (n-3 LCPUFAs) has shown to be greatly influenced by their location in the triacylglycerol backbone. Therefore, the synthesis of structured acylglycerols (SAcyl), which include eicosapentaenoic acids (EPAs) or docosahexaenoic acids (DHAs) at the sn-2 position, has attracted a great interest. The objective of this study was to optimize the synthesis process of a SAcyl from commercial refined salmon oil and an EPA/DHA concentrate in order to enhance the positioning of EPA and DHA in the sn-2 location of the glycerol moiety. For this purpose, immobilized lipase B from Candida antarctica (nonspecific) was used for the acidolysis process under the CO2 supercritical condition. As a result of carrying out a Draper-Lin composite design through the response surface methodology of 18 experiments, an optimized extraction including SAcyl compounds was obtained. Mass spectrometry (MALDI-TOF) analysis was employed to identify the EPA/DHA location at the sn-2 position in the resulting glycerol moiety. In the fraction obtained, an increase in the EPA and DHA content at the sn-2 position was detected. Remarkably, the optimized SAcyl obtained after 6 h, 82 bar, and 60 °C led to the highest EPA/DHA yield at the sn-2 position in the resulting molecule.

1. Introduction

Marine oils have valuable applications as a result of their high presence of n-3 LCPUFAs, such as eicosapentaenoic acid (EPA; 20:5n-3) and docosahexaenoic acid (DHA; 22:6n-3). Consequently, the consumption of such oils is associated with a lower prevalence of different kinds of diseases (i.e., cardiac, circulatory, etc.) [1]. A high n-3/n-6 fatty acid ratio and a daily consumption of n-3 LCPUFA are associated with a lower presence of chronic degenerative diseases [2] and a decrease in cardiac risk and mortality [3]. According to the previous report related to n-3 LCPUFAs [4], studies of controlled feeding and cohort intake of EPA and DHA have shown the physiological benefits in blood pressure, heart rate, triacylglycerols levels and probably inflammation, endothelial function, and diastolic cardiac function. Remarkably, consistent evidence of the reduced risk of fatal coronary disease and sudden cardiac death has been mentioned to be obtained with a daily intake of about 250 mg EPA + DHA [5,6,7].
The most important biological sources of n-3 LCPUFAs are marine organisms (fish, shellfish, algae), with phytoplankton being the primary producer of omega-3 in the food chain [8]. During common fish processing, 20–60% of the initial raw material is generated as by-products. The most significant waste is represented by offal, head, tail, skin, bones, and blood obtained during evisceration, skinning, cutting, and filleting [9]. These by-products cause a waste disposal problem with environmental implications [10], so that their use in the flour and oil industry are highly important [11]. This inconvenience has prompted new challenges to concentrate or purify these fatty acids from fish oil to obtain compounds with higher concentrations of EPAs and DHAs [12], which generate nutritional and health benefits.
After the concentration process with urea is carried out, the amounts of EPAs could increase between 1.6 to 4.1 times and the amounts of DHAs could increase between 3.3 to 7.8 times [13,14,15,16]. However, the delivery of EPA and DHA concentrates in free LCPUFAs is not the most suitable condition, given their low oxidative stability. Therefore, if these free n-3 LCPUFAs obtained by urea concentration could be structured as triacylglycerols, they could be considered a more stable form for human consumption [17]. Simultaneously, a higher amount of n-3 LCPUFAs could be obtained than in the commercial fish oil.
In order to obtain structured triacylglycerols (TGs), the location of fatty acids in the glycerol moiety may be modified through different kinds of reactions, which lead to remarkable improvements in their nutritional or functional properties [18]. The design of structured TGs can lead to advantages in the physical characteristics and chemical properties, as well as nutritional advantages [19]. This structure modification can be achieved through chemical or enzymatic transesterification reactions so that the composition and the location of fatty acids in the glycerol backbone is modified [14,15]. The differences between the bioavailability of the different structures in which fatty acids can be found have been widely described in the literature [20] and have mainly taken into consideration the digestive processes that the body undergoes.
The TG digestion process is mediated by lipases, which mainly hydrolyze the sn-1 and sn-3 positions, giving rise to 2-monoacylglycerol (2-MG) and free fatty acids. These products are then absorbed through the intestinal wall and re-esterified to TGs in the enterocyte. The new re-esterified TGs will become part of the chylomicrons, reaching the peripheral circulation [21]. As reported in the literature [19], when n-3 LCPUFAs located at the sn-2 position are accompanied by medium-length chain fatty acids in the sn-1 and sn-3 positions, such n-3 LCPUFAs can be easily absorbed. This fact can be explained on the basis that the pancreatic lipase can release medium-chain fatty acids from the extreme locations (sn-1 and sn-3), which are absorbed by the portal system and used as an energy source in the cell; in the meantime, 2-MG molecules can be absorbed in the enterocyte [22]. As described, it would be of great value to structure TGs that contain EPAs or DHAs in the sn-2 position to promote their rapid absorption and enhance their health benefits.
Different enzymatic biocatalysts can be used for lipid modification, such as lipases, esterases, and phospholipases. Among such biocatalysts, lipases are the most versatile since their regiospecificity is one of the main advantages for modifying oils and fats and obtaining high-value-added products; therefore, structured lipids, including those with high EPA and DHA levels, may be employed as supplement foods [23]. The structuration of lipids can be developed with supercritical technology that has been applied in extraction and fractionation processes, chromatographic separations, and chemical reaction processes; as a result, the fractions of a mixture and custom-designed products could be obtained [24]. Among supercritical fluids, carbon dioxide (CO2) has proven to be an ideal solvent for food applications [8,25].
Compared to other liquid solvents, the most significant advantages of supercritical (SC) CO2 are the high diffusivity, low viscosity, and surface tension, which allow the acceleration of the mass transfer during the development of the enzymatic reactions [8,26]. This work aimed to optimize the enzymatic synthesis process of structured acylglycerols with EPA/DHA in the sn-2 position (SAcyl) from commercial refined salmon oil (CRSO) and EPA/DHA concentrate (n-3). Additionally, the study was addressed to improve their positioning in the oil molecule and to promote their potential benefits in human health.

2. Materials and Methods

The initial raw materials for carrying out this study were commercial refined salmon oil (CRSO) and omega-3 fatty acid concentrate (n-3 LCPUFA); such concentrates were obtained from CRSO through the urea complexation process [27]. In the optimization of the complexation process, EPA and DHA (g/100 g total fatty acids, TFA) values in the concentrate were maximized and validated experimentally according to the following conditions: a ratio of 9999 for the urea/free fatty acid content ratio; crystallization temperature of 4 °C, stirring speed of 500 rpm, and crystallization time of 18 h. The CRSO was obtained from Fiordo Austral S.A. (Puerto Montt, Chile) and stored at −80 °C in amber plastic bottles until later use. The standards used for thin-layer chromatography (TLC) analysis were obtained from Sigma Aldrich, Merck, St. Louis, MO, USA. Non-specific lipase B from Candida antarctica (CAS 9001-62-1) was donated by Blumos S.A. (Santiago, Chile). Acrylic resin was employed as the carrier. Methyl tricosanoate internal standard (23:0) and GLC-463 reference standard for the gas-liquid chromatography analysis were obtained from Nu-Check-Prep, Elysian, MN, USA. CO2, N2, and H2 gas were purchased from Gaslab-Linde (Santiago, Chile).

2.1. Enzymatic Acidolysis Process under Supercritical CO2 Conditions for the sAcyl Synthesis

EPA/DHA structured acylglycerols in the sn-2 position (SAcyl) were obtained using a Speed SFE system model 7071 (Applied Separation) supercritical CO2 reactor [28], with CRSO and concentrate n-3 LCPUFA as substrates in a 10 g extractor vessel. Static acidolysis reactions (6 h) were catalyzed by Candida antarctica specific lipase B in a Draper-Lin composite design, based on the response surface methodology (RSM) with 18 experimental runs. The independent variables were: n-3 LCPUFA/CRSO ratio (0 to 9, w/w), SC pressure (78–300 bar), SC temperature (40–60 °C), and amount of immobilized lipase B from Candida antarctica (0–10%).

2.2. Analysis of Fatty Acid by Gas Liquid Chromatography (GLC)

The fatty acid (FA) profile and the EPA/DHA values of CRSO, n-3 LCPUFA, and SAcyl were determined by GLC (7890B chromatograph, Agilent, Chile) by employing a fused-silica capillary column (HP-88, 100 m × 0.25 mm i.d. × 0.20 μm film thickness) and a flame ionization detector. FAMEs were obtained by a methylation process. NU-CHEK GLC 463 was used as reference standard to identify the FA profiles by analyzing the retention times [29]. The quantification of the different FAMEs was carried out from the corresponding calibration curves and assessment of the peak/area ratios. The individual FA (g/100 g TFA) value was quantified by employing C23:0 methyl ester as the internal standard, according to the AOCS method [30].

2.3. Purification of sPAG by Neutralization with NaOH

To remove the free fatty acids resulting from the acidolysis reactions from each experiment, purification was carried out by neutralization with NaOH [17,31], followed by collection in hexane for carrying out the GLC analysis. For this purpose, mixing with ethanol and phenolphthalein, titrating with sodium hydroxide, and washing with hexane were carried out. The purification degree of each sample was followed by TLC analysis.

2.4. Identification of CRSO, n-3 LCPUFA and sAcyl by Thin Layer Chromatography (TLC)

The identification of all samples was carried out by TLC on silica gel 60 F254 plates (Merck). For this, a mixture of chloroform, acetone, and glacial acetic acid (96/4/1, v/v/v, respectively) was used as the eluent [32]. The elution order on the chromatographic plate from bottom to top was evaluated according to their decreasing polarity: monoacylglycerols (MGs), diacylglycerols (DGs), and TG [17]. In order to visualize all lipid structures, the plates were stained with an iodine solution.

2.5. Analysis of EPA/DHA Location by Mass Spectrometry (MALDI-TOF)

The purified samples were analyzed before and after the acidolysis process to determine the structures, including EPA/DHA in the sn-2 position of the SAcyl. Mass spectrometry on a Microflex matrix-assisted laser desorption/ionization-time-of-flight (MALDI-TOF) instrument (Bruker Daltonics Inc., Billerica, MA, USA) working in positive ion mode by the reflection detection was used. For the spectra analysis, the mMass program version 5.5.0 was employed, according to the protocols of Strohalm et al. [33,34] and Niedermeyer and Strohalm [35]. To detect the m/z monoisotopic signals from the acquired spectra, the MALDI-TOF peptide algorithm was used (3.0 signal/noise ratio and 0.1% relative intensity limit). To carry out the identification, the detected m/z monoisotopic signals were analyzed and assigned through the Match and Annotate option of the Compound Search tool; comparison to the theoretical monoisotopic masses of different types of glycerolipids (GLs) contained in the LIPID base MAPS (data version 16 November 2013) was carried out. Subsequently, the matches detected were manually examined, and in each case, the experimental isotopic distribution obtained was compared to the theoretical one.

2.6. Optimization of sAcyl Enzimatic Synthesis by Response Surface Methodology (RSM)

The Draper-Lin composite design based on the RSM analysis was used. Thus, the effect of four independent (i.e., processing) variables was studied: n-3 LCPUFA/CRSO ratio (0 to 9, w/w; the total weight of n-3 and CRSO being 10 g and the weight of n-3 LCPUFA varied between 0 and 9), SC pressure (78–300 bar), SC temperature (40–60 °C), and the amount of immobilized lipase B from Candida antarctica lipase (0–10%). The independent variables were adjusted to maximize the responses of EPA, DHA, EPA + DHA, and EPA/DHA at the sn-2 position and to minimize the palmitic acid (PA) variable. The design included 18 total experimental runs, two of them corresponding to central points that allowed for the estimation of the experimental error (Table 1). The essays were carried out in a randomized way in order to minimize the influence of variability on the observed responses. The process optimization was carried out by using RSM, according to the Myers and Montgomery procedure [36]. Data obtained allowed us to build predictive quadratic polynomial models in terms of their regression coefficients for the processing variables. Additionally, the combination of the dependent variables allowed us to obtain a theoretical or to establish the predicted optimum of the EPA, DHA, and EPA/DHA values at the sn-2 position. A mathematical model was obtained from RSM, so that the effect of the independent variables could be predicted:
Y i = β 0 + i = 1 4 β i X i + i = 1 4 β i i X i 2 + i = 1 4 β i j X i X j + ε
where β0, βi, βii, βij represented the intercept, linear, quadratic, and interaction regression coefficients, respectively, and Xi and Xj represented the independent variables. The regression coefficients were obtained by means of multiple regression analysis (p < 0.05). An ANOVA of the regression parameters and the fitted model was performed (p < 0.05). The Statgraphics Centurion XVI-2011 statistical program (Stat Point Technologies, Inc., Rockville, MD, USA) was employed. The SAcyl obtained was experimentally validated by applying the conditions proposed in the theoretical optimum and was stored (−80 °C) under a nitrogen atmosphere until used.

3. Results

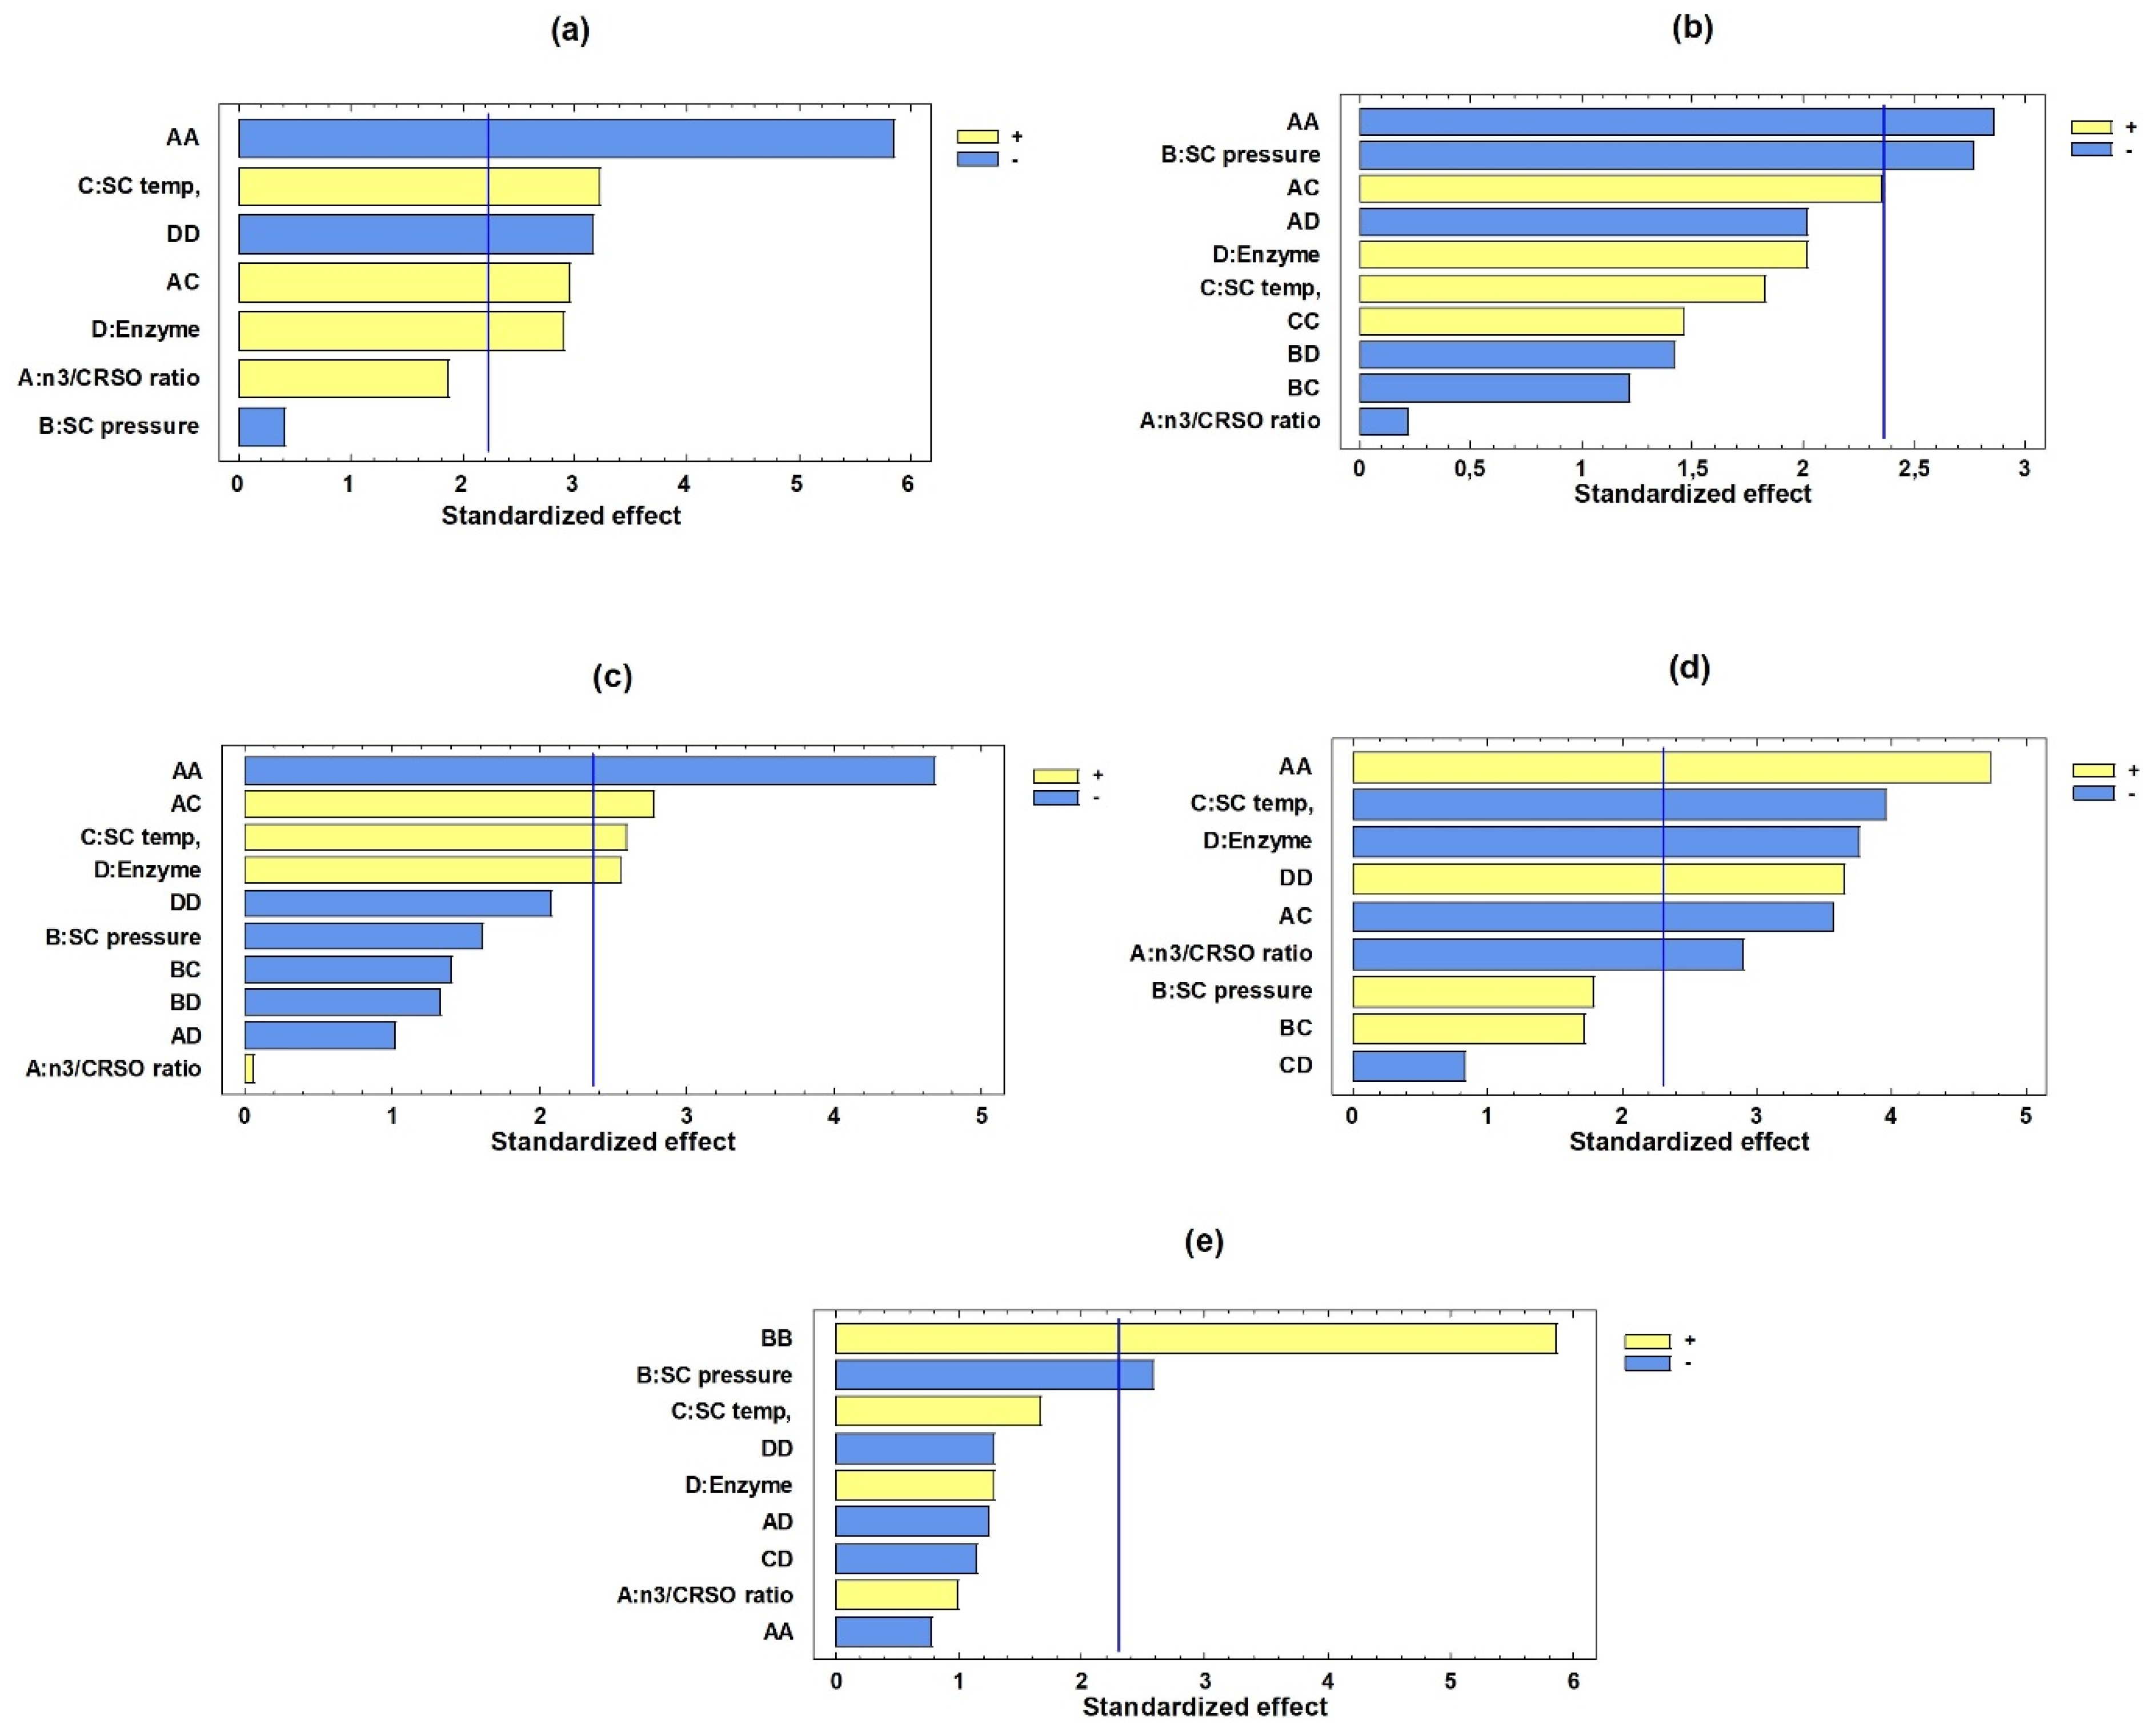
3.1. Enzimatic Acidolysis Process to Synthesize sAcyl by Draper-Lin Composite Design

The enzymatic acidolysis reaction between CRSO and n-3 LCPUFA (n-3) in SC medium was studied and optimized to obtain structured acylglycerols with a maximum concentration of EPA/DHA in the sn-2 position (SAcyl). A Draper-Lin composite design (Table 1) with four independent variables was checked. Their effects on the content of EPA; DHA; EPA + DHA; palmitic acid (PA) values, calculated as g/100 g TFA; and EPA/DHA in the sn-2 position, expressed as the probable number of EPA/DHA in position sn-2 of the SAcyl, were analyzed.
EPA = 4.36956 − 0.160495*A − 0.000257139*B − 0.0221375*C + 0.187589*D − 0.0337653*A2 + 0.00986111*AC − 0.0147594*D2
DHA = 7.67672 − 0.175753*A + 0.0104104*B − 0.195362*C + 0.2849*D − 0.019909*A2
EPA + DHA = 4.603 − 0.345359*A + 0.0226964*B + 0.0261942*C + 0.600326*D − 0.0565978*A2 + 0.019375*AC
PA = 13.677 + 0.498547*A − 0.0173269*B − 0.00910498*C − 0.159978*D + 0.0445666*A2 − 0.0194444*AC + 0.0278689*D2
EPA/DHA in sn-2 = 23.2582 + 1.946*A − 0.392551*B + 0.462498*C + 4.98636*D + 0.000931243*B2
The five models have coefficients of determination (R2 adjusted by the degrees of freedom) of 78.74%, 62.21%, 72.03%, 82.34%, and 74.35% for EPA, DHA, EPA + DHA, AP, and EPA/DHA in the sn-2 location, respectively; this indicates that the variability of the data obtained is adequately represented.
Figure 1 indicates the main processing variables that affect the structuring process using Pareto type charts. The standardized linear, quadratic, and interaction effects for each of the response variables are provided in decreasing order (the line marks the p ˂ 0.05 confidence interval).
It can be observed that the quadratic effect of the n-3/CRSO (A) was significant in all graphs, except for the EPA/DHA in sn-2 response variable, where the pressure (B) and its quadratic effect were the independent factors that affected the structuring process. The positive effect of the temperature (C) and the percentage of the enzyme (D) for increasing the values of EPA, DHA, and EPA + DHA is shown, while palmitic acid has a negative effect. This confirms that the higher values of the variables C and D produce an increase in EPA, DHA, and EPA + DHA to the detriment of the concentration of palmitic acid.
Figure 2 shows the response surface and contour graphs, reflecting the influence of the combination of the primary process variables for each of the response variables. In the EPA and EPA + DHA graphs (panels a and c), the effect of temperature and pressure was similar since, as they increase, there is an increase in the concentration of the response variables.
In the remaining graphs, it can be noticed that, despite the influence of the same independent variables (SC pressure and n-3/CRSO ratio), a similar behavior is not observed; thus, the response variable palmitic acid undergoes a decrease in its concentration as the pressure and the n-3/CRSO ratio decreases. In contrast, the SC pressure has the opposite effect on the variables DHA and EPA/DHA in the sn-2 location.

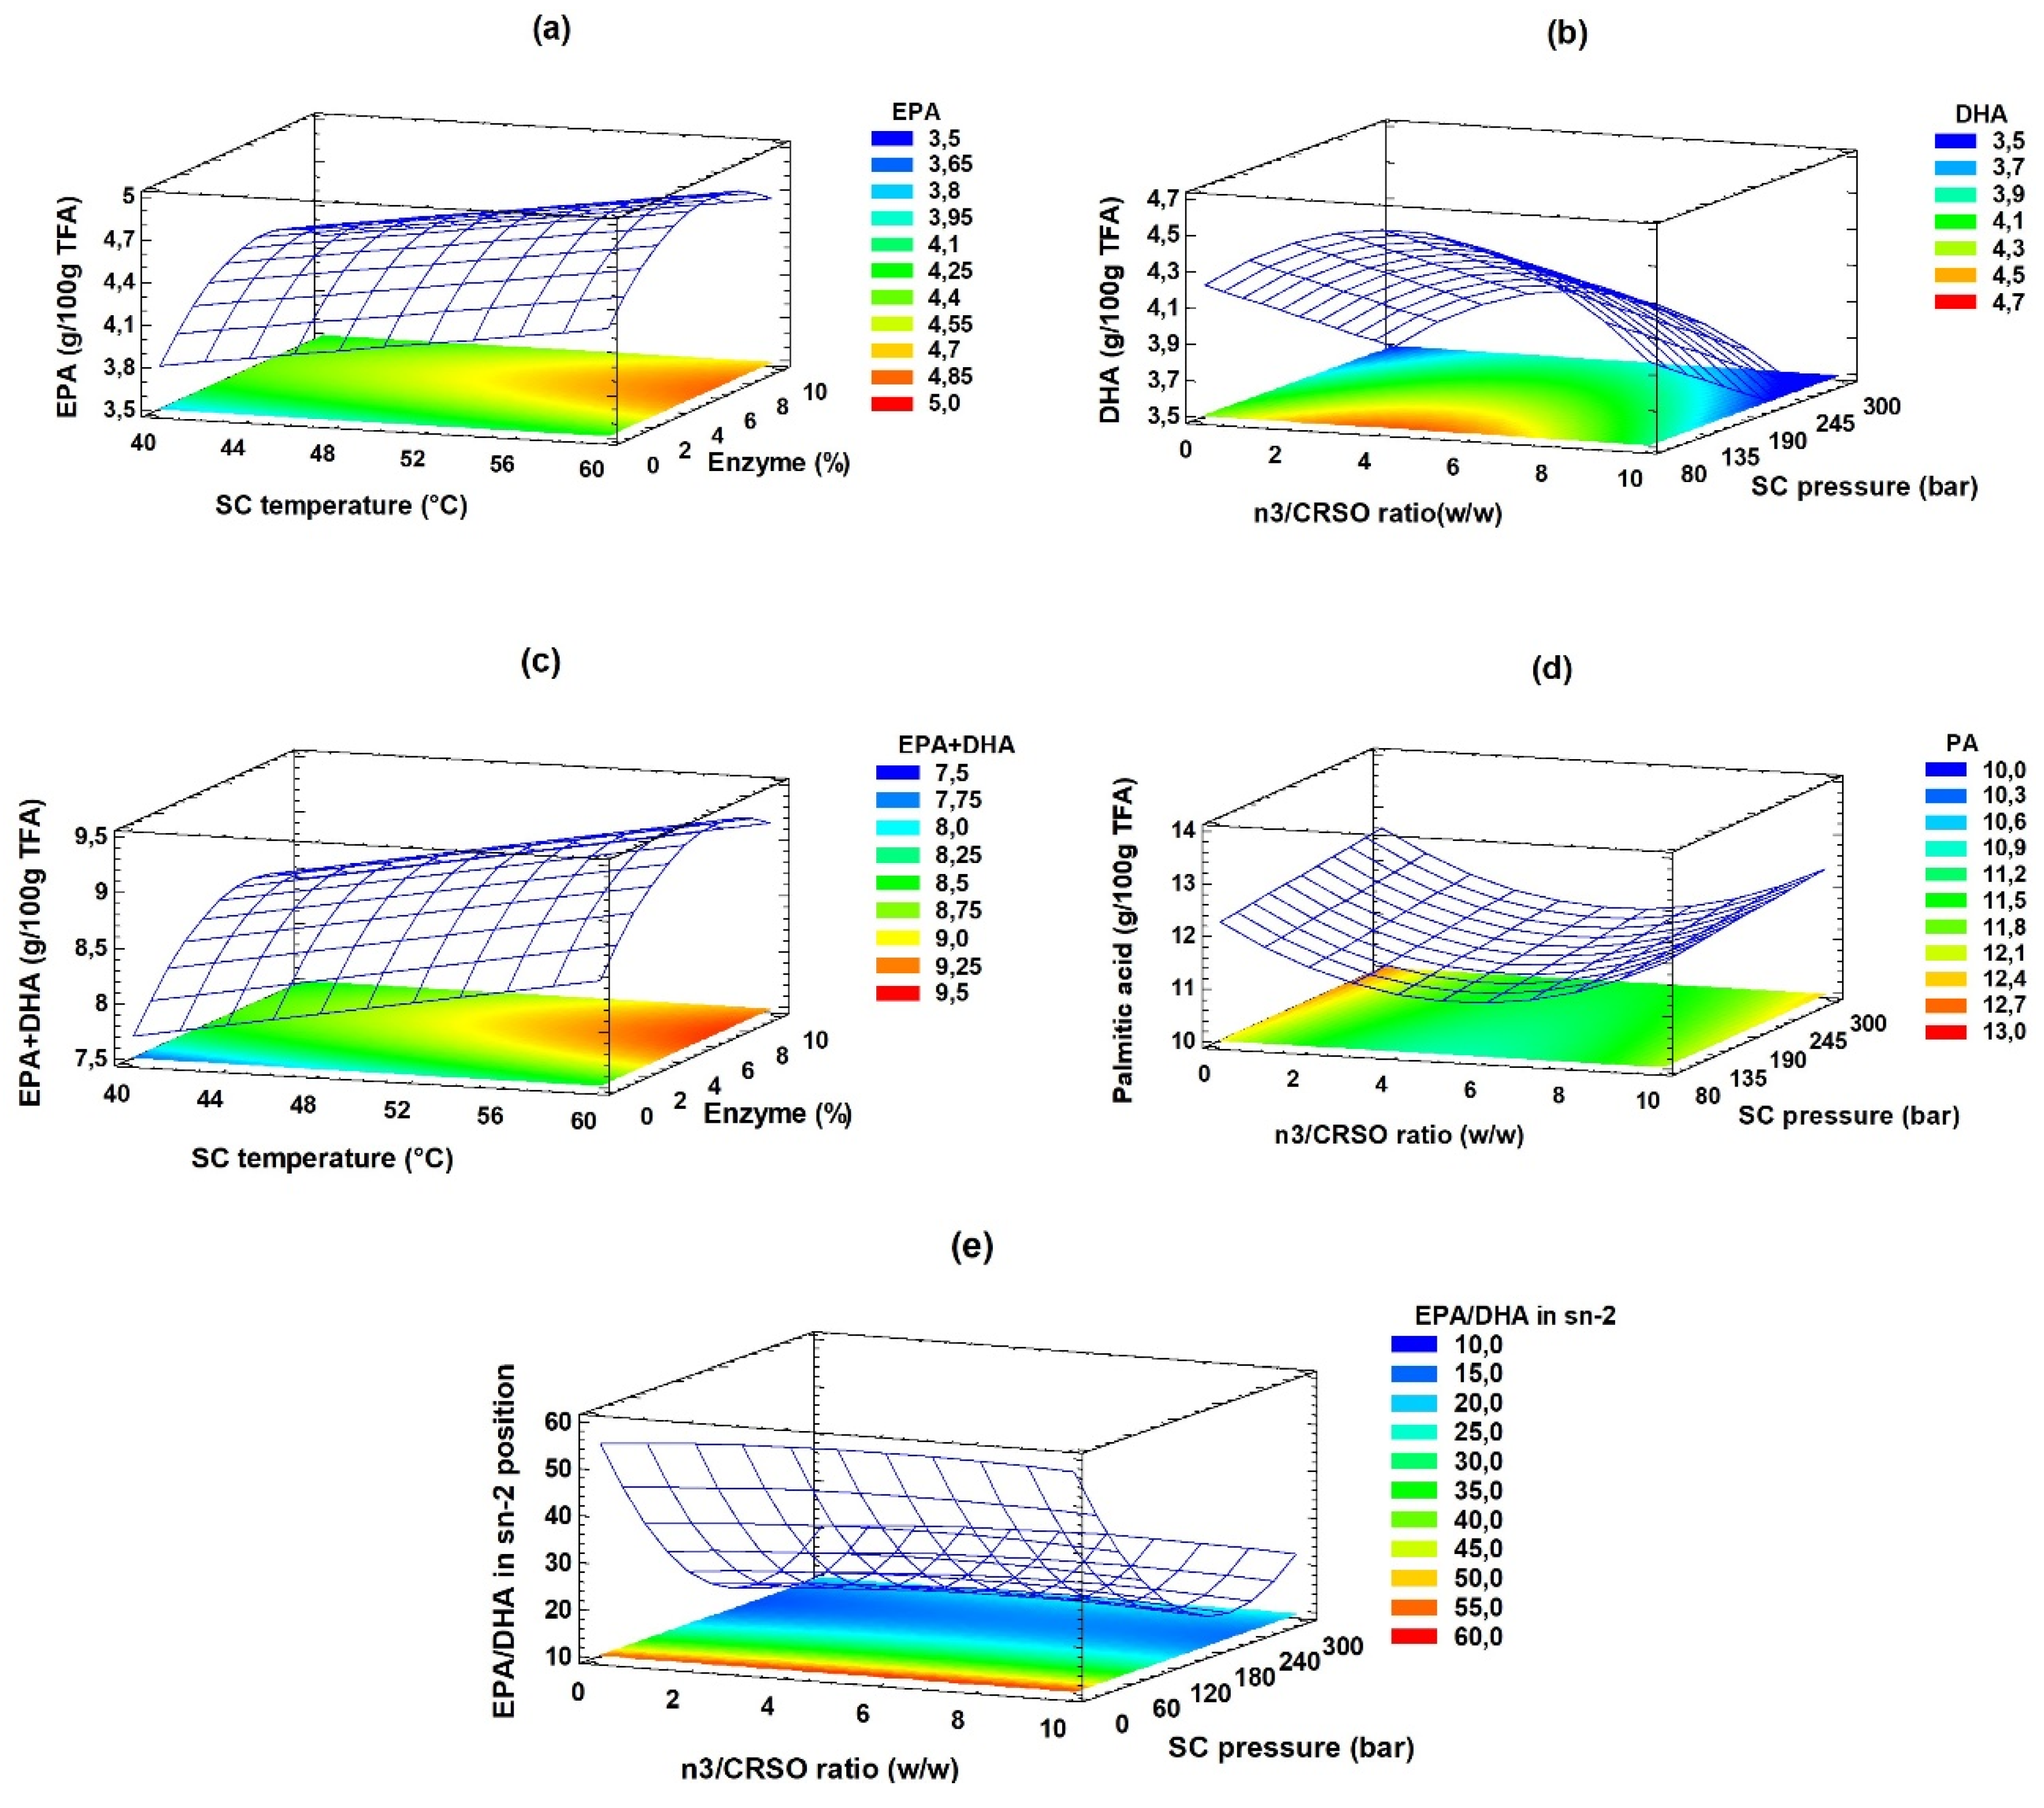
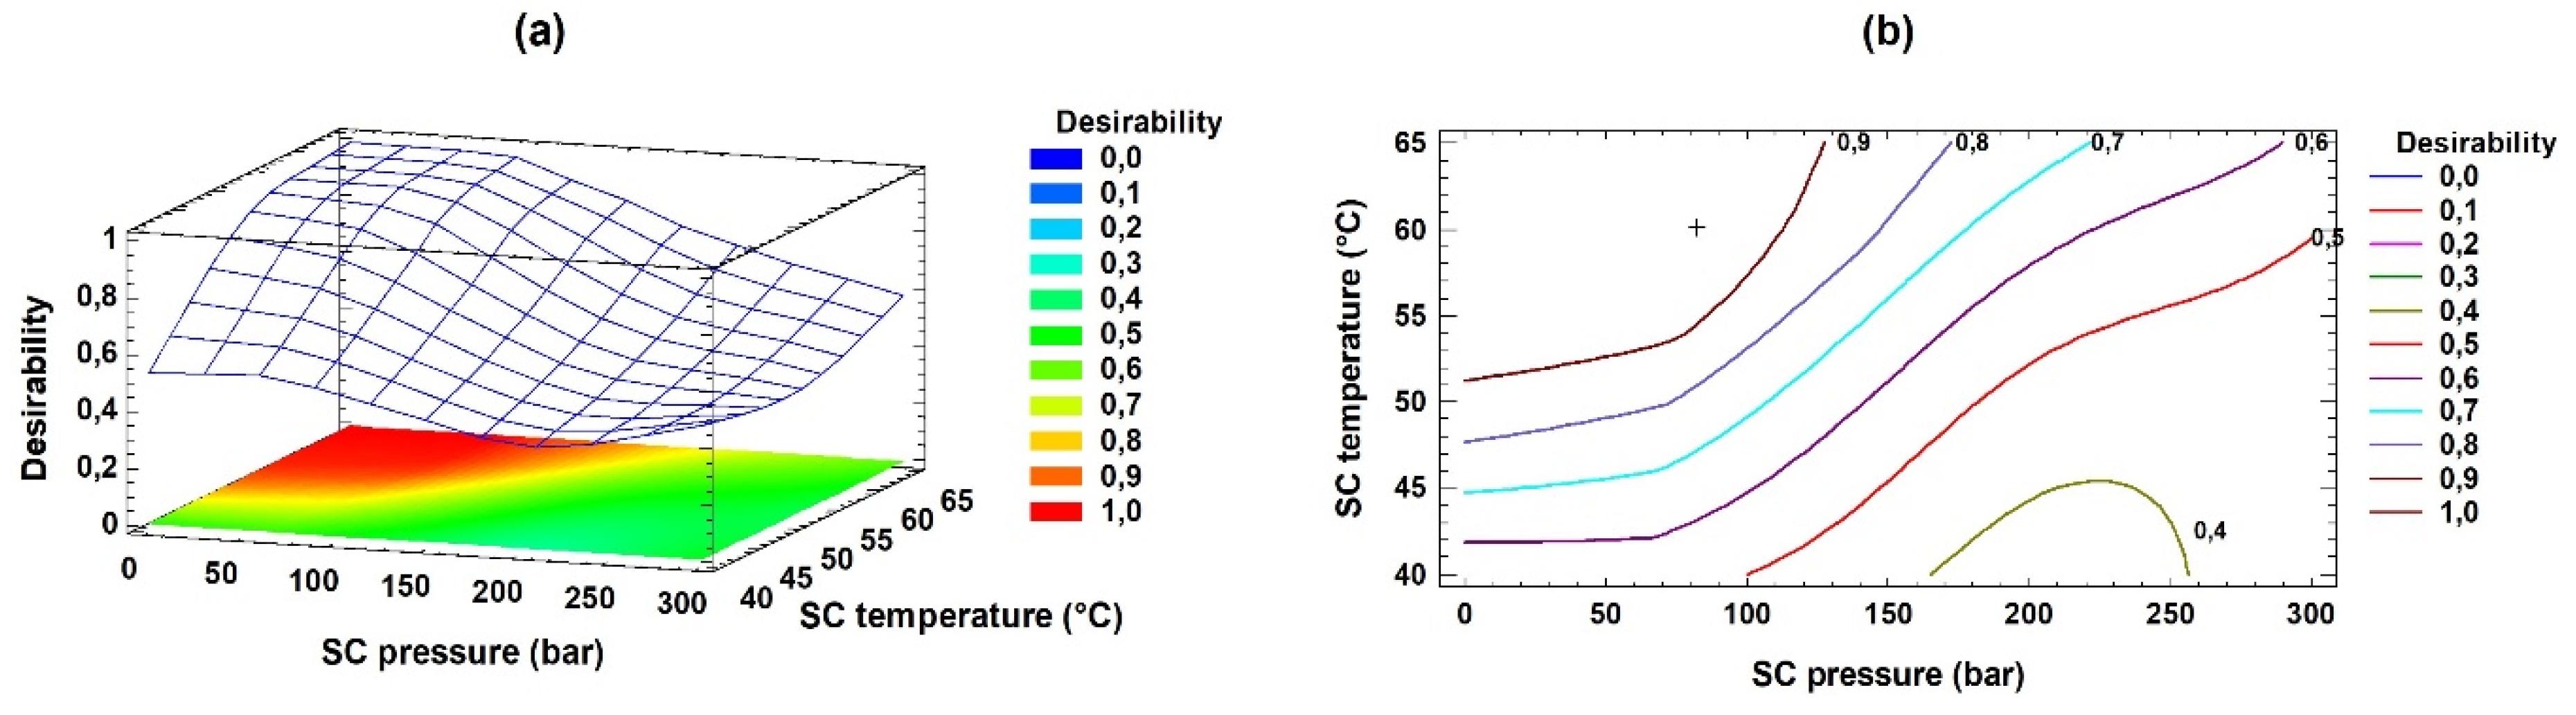
3.2. RSM Optimization of the Acidolysis Process to Synthesize sAcyl

Table 2 shows the optimal predicted values of the structuring process variables obtained from the RSM. In it, the independent variables were configured to maximize the responses of EPA, DHA, EPA + DHA, and EPA/DHA in sn-2 and minimize the palmitic acid variable.
In the multi-response optimization of the response variables, a maximum desirability of 0.98 was obtained. Thus, the final predicted content of EPA, DHA, EPA + DHA, PA, and EPA/DHA in the sn-2 location was 4.95, 5.27, 10.25, 9.74 (g/100 g TFA), and 33.45, respectively. Figure 3 indicates the behavior of the maximum desirability mentioned, with increasing values being observed as the pressure level decreased and the temperature values increased.

3.3. Validation of the Acidolysis Process for Obtaining sAcyl

3.3.1. Analysis of Fatty Acid by GLC of Optimized sAcyl

The multi-response optimization of Table 2 was considered to validate the experimental design. Table 3 (c) shows the SAcyl composition and quantification with the EPA/DHA content (g/100 g TFA) optimized in the experimental validation. When compared to the ASCRD, the differences were observed.
The most abundant fatty acids of the CRSO versus the optimized SAcyl were (calculated as g/100 g TFA): oleic acid (36.95 vs. 34.66), linoleic acid (15.77 vs. 15.48), palmitic acid (12.76 vs. 10.60), α-linolenic acid (4.91 vs. 4.78), EPA (3.92 vs. 5.92), DHA (3.83 vs. 7.18), palmitoleic acid (3.74 vs. 3.39), stearic acid (3.64 vs. 3.17), cis-vaccenic acid (3.32 vs. 2.72), and myristic acid (2.90 vs. 2.15).
Through the optimization of the structuring enzymatic process by RSM, the contents of the total PUFA, n-3 LCPUFA, EPA, DHA, and EPA + DHA increased by 1.2, 1.5, 1.5, 1.9, and 1.7 times, concerning the ASCRD, respectively. It was observed that the increase in the EPA + DHA concentration was higher than predicted in the multi-response optimization (13.1 vs. 10.25, expressed in g/100 g TFA), although the PA concentration was also higher (10.6 vs. 9.74), even when its decrease was expected.

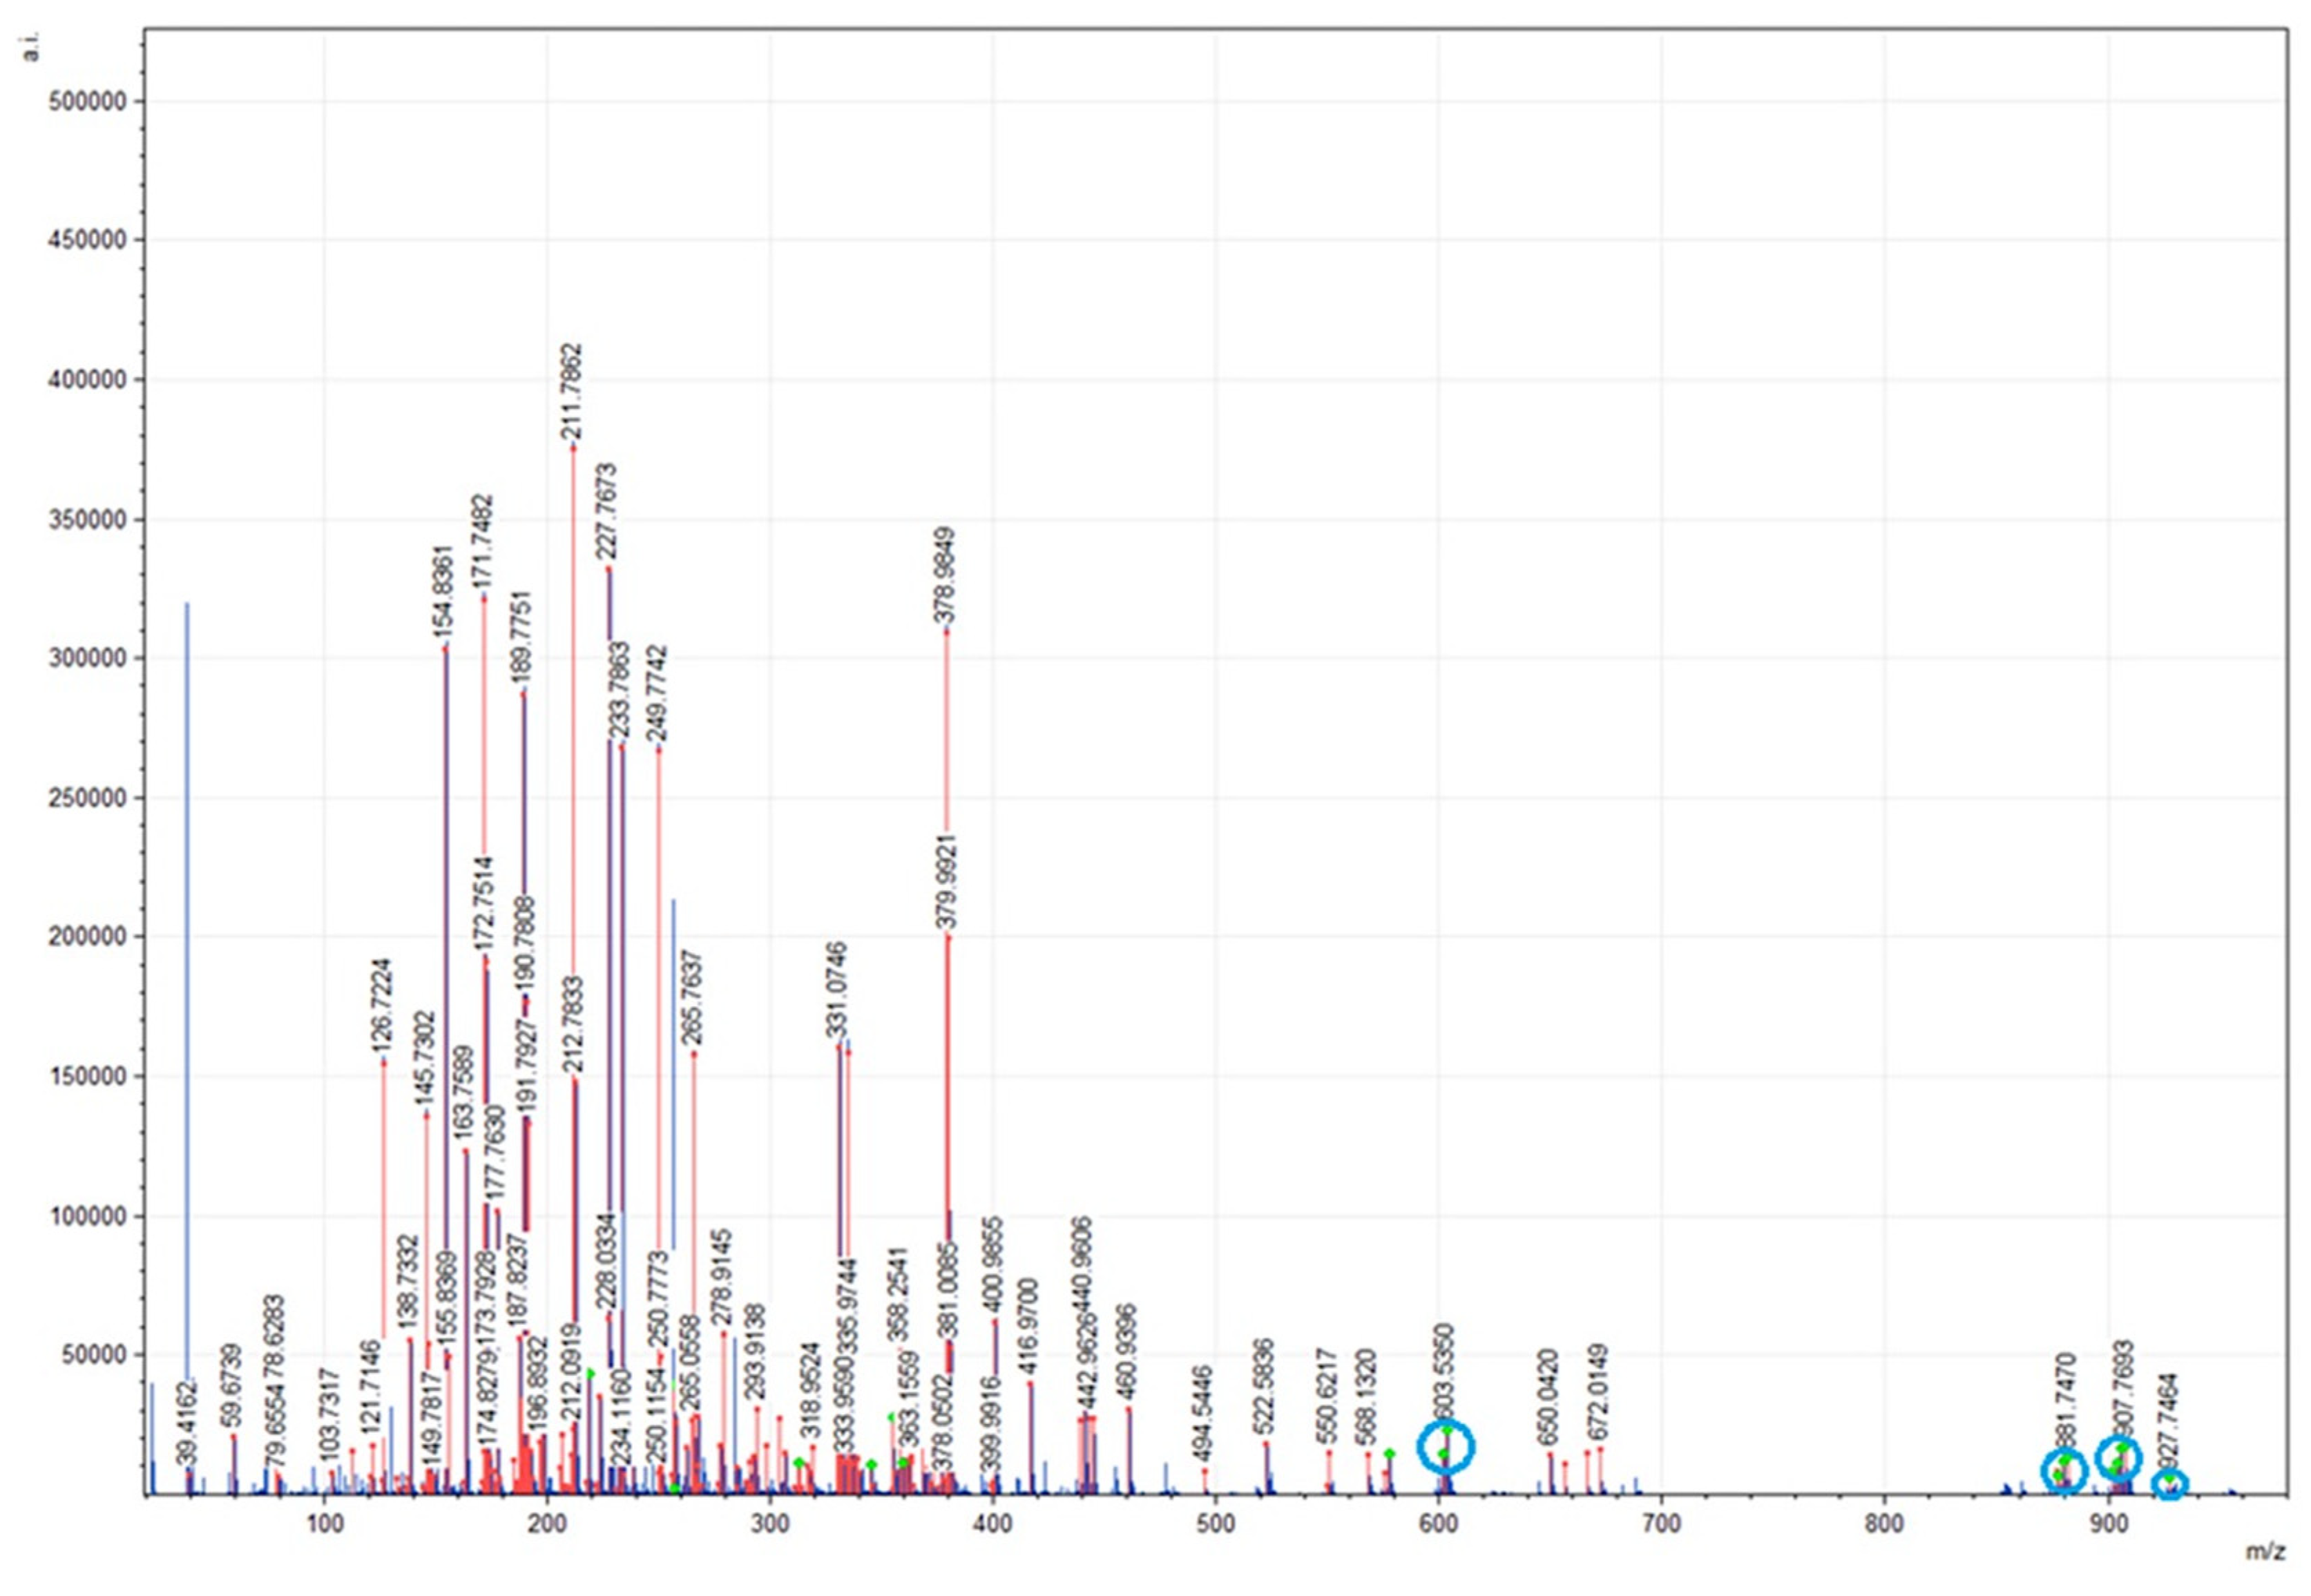
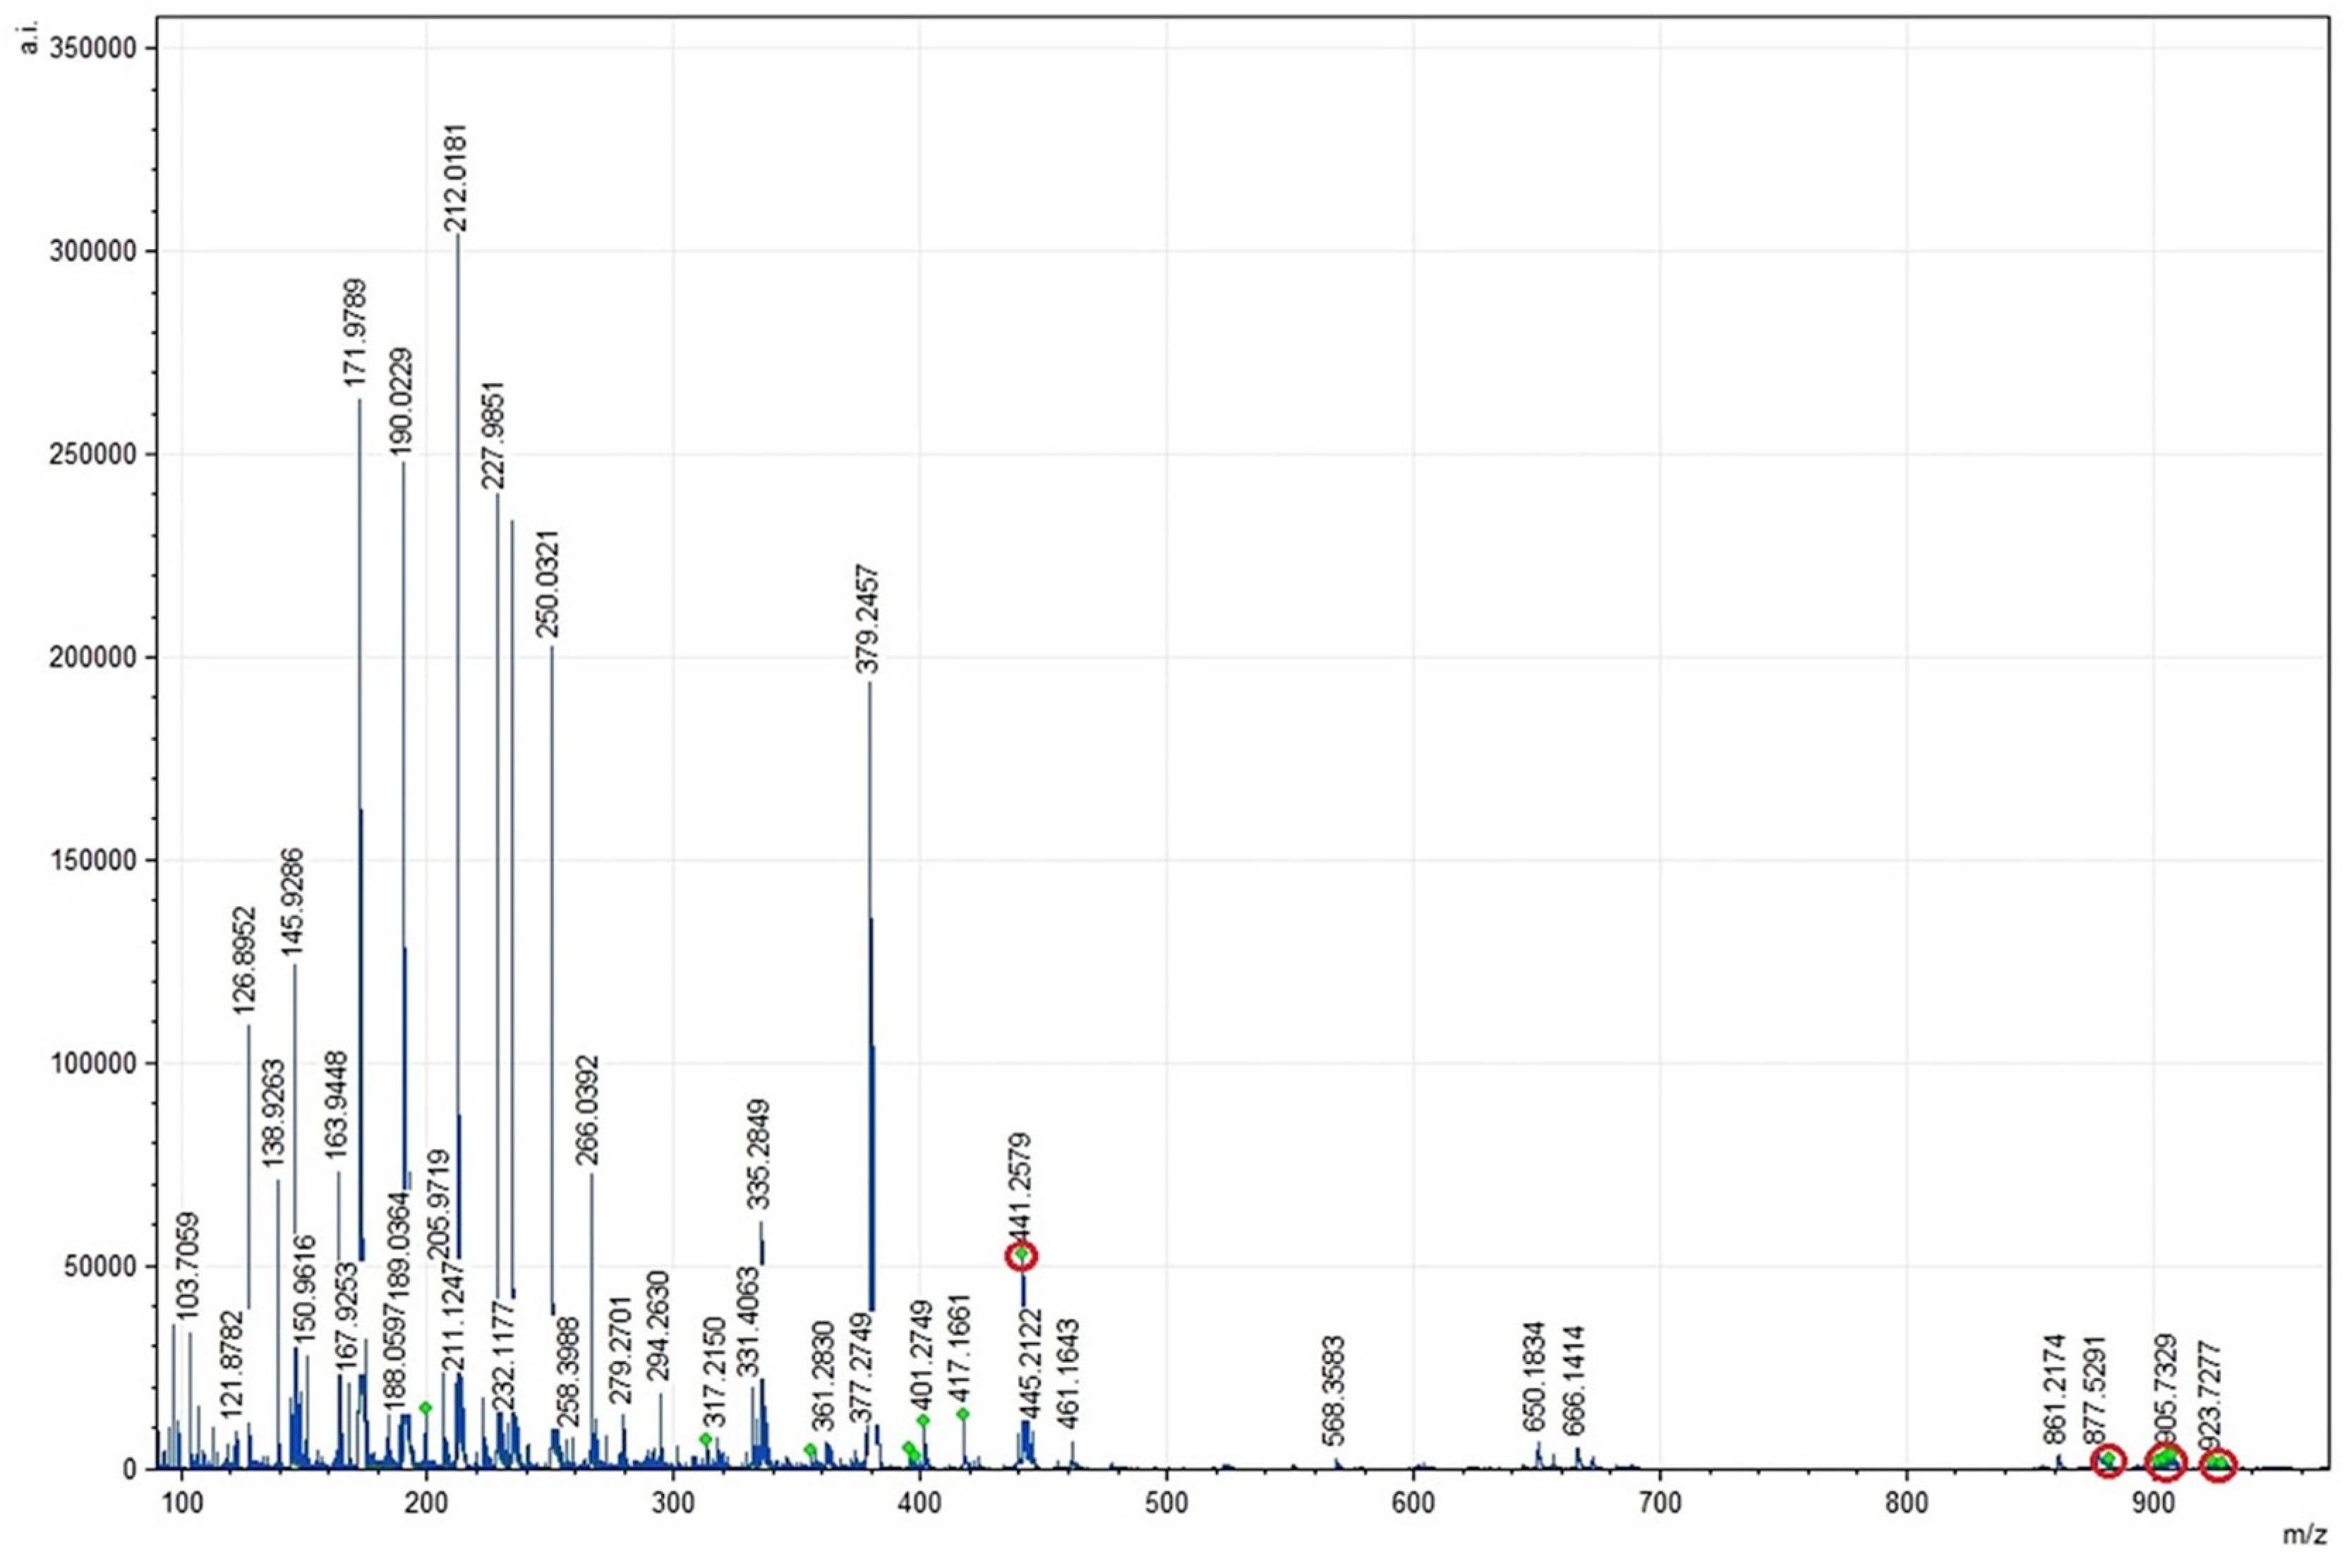
3.3.2. Positional Analysis of EPA/DHA in the Optimized SAcyl, Using Mass Spectrometry (MALDI-TOF)

Table 4 shows the monoacylglycerols and triacylglycerols with EPAs or DHAs in the sn-2 position of glycerol, identified in the CRSO (Table 4a) and the optimized SAcyl (Table 4b), respectively.
EPAs were identified mainly in the sn-2 position of glycerol, while DHAs were found in the sn-3 location, as described for the CRSO. DHAs were not identified in the spectra at 881.7593, 903.7412, 905.6995, and 923.8062 (m/z), while EPAs were present.
In general, the spectral mass ranges for EPAs and DHAs were found between 441.2402 and 927.8375 (m/z); in this range, both fatty acids were always visualized as part of TGs, except for DHAs, whose spectrum at 441.2402 (m/z) was related to the MGs (Figure 4 and Figure 5).
The optimized SAcyl and the CRSO were simultaneously evaluated by mass spectrometry (MALDI-TOF) to compare the probable number of EPA/DHA fatty acids in the sn-2 position of the glycerol backbone. Table 5 summarizes the number of acylglycerols identified with EPA/DHA in the sn-2 position by mass spectrometry (MALDI-TOF). Notably, SAcyl showed an increase in the amount of EPAs and DHAs in the sn-2 position (33 vs. 24), and the presence of PAs in the sn-2 position (191 vs. 158) decreased when compared to the CRSO; additionally, DHA presence in the sn-2 position was only obtained in the optimized SAcyl, this fact improving its structural characteristics.

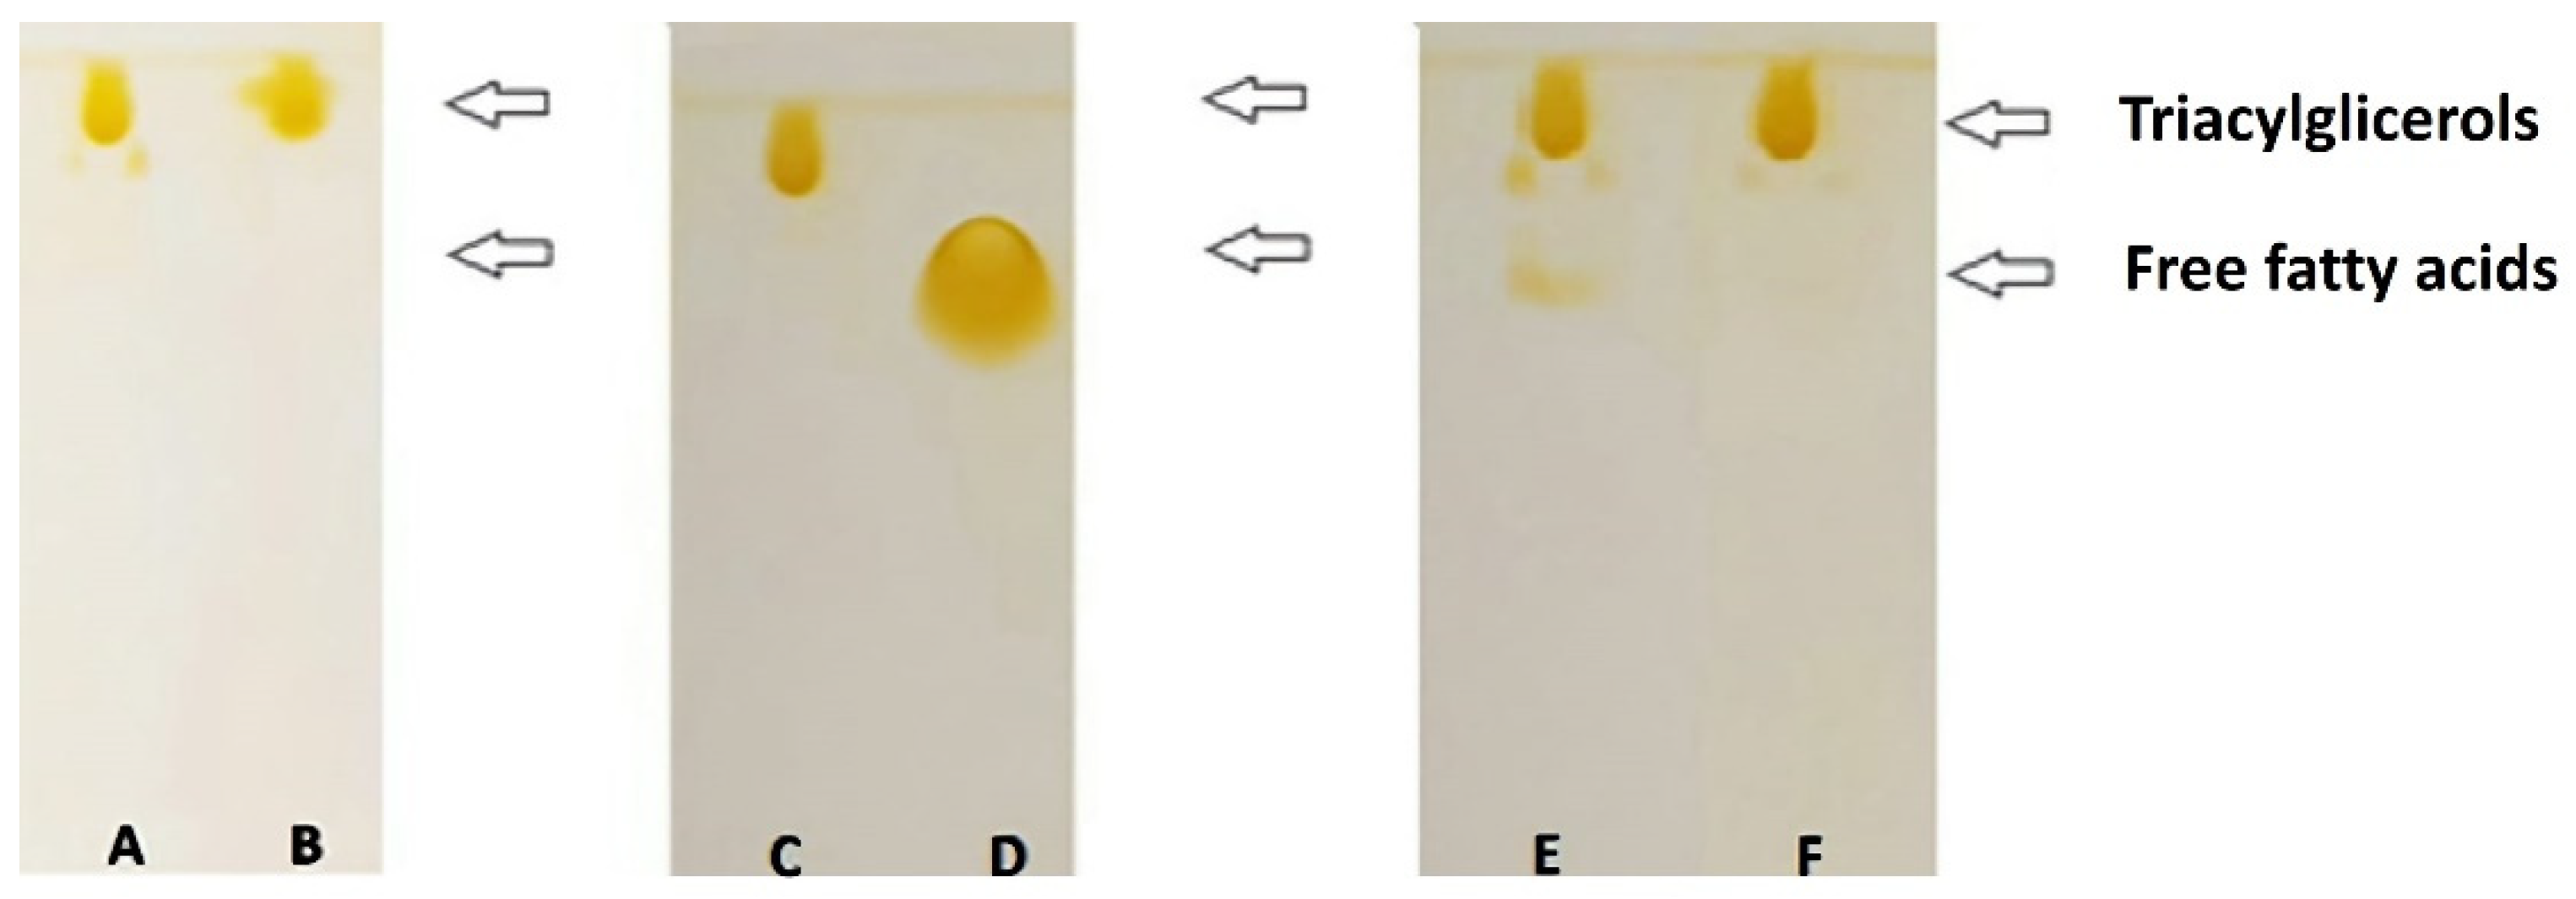
3.3.3. Identification by TLC of CRSO, n-3 LCPUFA, and SAcyl Optimized

A thin-layer chromatographic separation of each compound (concentrated n-3 LCPUFA, CRSO, and optimized SAcyl) was observed according to the polarity degree (Figure 6). As expected, MGs migrated the least, while TGs migrated the fastest, according to previous reports [28,37]. The CRSO samples were found in the form of triacylglycerols (bands A, B, and C), while the n-3 LCPUFA concentrate (band D) showed only the presence of free fatty acids, according to their structural characteristics. The non-purified SAcyl is shown in band E, evidencing the free fatty acids presence in the sample and the characteristic TG of the structured acylglycerols. In the purified sample (band F), TG was identified as the only product of the enzymatic acidolysis reaction, proving the effectiveness of the purification method [22,31]. These results are in agreement with those determined by mass spectrometry, in which mainly structured TGs were identified while the presence of DGs was not detected.

4. Discussion

In the current study, the synthesis process of bioactive lipids with the properties of n-3 LCPUFA in the sn-2 position was optimized. The interest of the current study is based on the possibility to synthesize lipid molecules that are rich in DHA/EPA in the sn-2 position and control the process with RSM. This study optimized the content of EPA, DHA, and EPA + DHA and the probability of finding such fatty acids in the sn-2 position in glycerol. The probability of EPA in sn-2 was maximized, increasing from 24 to 33 (Table 5). In addition, the probability of increasing DHAs in the sn-2 position was increased from zero to two. These results partially agree with what was reported by our work group in previous studies [28], where the probability of finding DHA in sn-2 was increased from 2 to 4 when using the same enzyme and similar reaction times greater than 60 min. This probability of synthesizing SAcyl with EPA/DHA in the sn-2 location was significantly affected by the SC pressure, since the increase in the latter caused its decrease. Regarding the EPA, DHA, and EPA + DHA values, their increase was markedly influenced by the SC temperature, the SC pressure, and the n-3/CRSO ratio, in agreement with the conclusions reported by other studies [38] regarding the significant influence of these independent variables in enzymatic acidolysis processes and using experimental designs (RSMs). It can be observed that the enzyme percentage obtained in the current work is in the range between 5 and 10%, which is in agreement with the information reported in the literature [18,39] for acidolysis reactions, in which the highest incorporation of fatty acids is expected. Regarding the n-3/CRSO ratio, most authors used ratios greater than 1:1, favoring the amount of free fatty acids [40,41,42] like the n-3/CRSO ratio of 7.24 predicted in Table 2.
In previous research, the usefulness of the SC fluid technology has been proven for extraction processes [43,44], chromatographic analysis and separation [45,46], and reactions focused on enzymatic modification to obtain omega-3 enriched oils from marine substrates [47,48]. In the present study, the SC condition has been found to be useful in assisting and obtaining high levels of EPA and DHA in the sn-2 position, based on the fact that supercritical fluids can provide an accurate medium for enzymatic reactions. When employing higher pressures and temperatures than their critical values, this medium reaches partial gas/liquid properties. Above this critical point, no liquefaction is produced by pressurization nor gasification by heating. Therefore, at this state the material is compressible and behaves as a gas but has the density of a liquid and brings its solvent capacity. Its density can be modified as a function of the pressure and the temperature, since at its critical pressure, its compressibility reaches a maximum value and small changes in thermal parameters can lead to big changes in the local density. Its greatest advantages in front of other liquid solvents (i.e., hexane) are its high diffusivity, low viscosity, and low surface tension. As a result, a mass transfer acceleration in enzymatic reactions can be produced, as in the present study, for modifying the composition of the sn-2 location.
In the current work, it was possible to increase the EPA and DHA values in the final optimum structure; meantime, the palmitic acid content decreased. Remarkably, the optimized SAcyl obtained after 6 h, 82 bar, and 60 °C led to the highest EPA and DHA yield in the sn-2 position in the resulting molecule. It was proven that EPA is more likely to be located at the sn-2 position of the glycerol structure, while DHA is mainly located at the sn-3 position. By employing the present method, the MALDI-TOF analysis established that the current condition in the SAcyl included the highest levels of EPA or DHA values at the sn-2 position of the samples that were identified. In the present work, convenient experimental conditions were established for the enzymatic acidolysis reaction in order to produce acylglycerols with a high biological value. Such acylglycerol compounds could be employed in future applications as potential products for the prevention of different kinds of human illnesses (i.e., inflammatory, cardiac, circulatory, etc.), thus adding an increased value to the synthesized acylglycerols.

5. Conclusions

The present study showed that it was possible to obtain and optimize the enzymatic synthesis process of structured acylglycerols with EPA/DHA in the sn-2 position (SAcyl compound), starting from commercial refined salmon oil and an EPA/DHA concentrate (n-3) obtained from the same commercial oil. As a result, the highest EPA/DHA yield at the sn-2 position in the resulting molecule was obtained by applying reaction conditions consisting of 6 h, 82 bar, and 60 °C.
The suitability of the SC fluid condition for obtaining an SAcyl compound has been proven. Its employment as a green and alternative method is recommended in order to replace strategies, including the use of organic solvents, and reduce the risk of chemical exposure to humans and the environment.

Author Contributions

Conceptualization, A.R., A.E. and G.D.-R.; methodology, G.D.-R., A.E. and A.B.; formal analysis, G.D.-R., A.P.-C. and A.B.; investigation, A.R., G.D.-R., A.P.-C. and A.E.; resources, A.E. and A.R.; data curation, S.P.A.; writing—original draft preparation, A.R., A.E. and G.D.-R.; writing—review and editing S.P.A., A.E., A.R. and G.D.-R.; visualization, G.D.-R.; supervision, S.P.A.; project administration, A.R. and A.E. All authors have read and agreed to the published version of the manuscript.

Funding

This research was funded by FONDECYT Regular 1181774, FONDECYT Regular 1221633 and Project AYV10/01-22 Concurso Vicerrectoría de Investigación y Desarrollo (VID), University of Chile. The APC was partially funded by the Spanish National Research Council (CSIC).

Institutional Review Board Statement

Not applicable.

Informed Consent Statement

Not applicable.

Data Availability Statement

Not applicable.

Conflicts of Interest

The authors declare no conflict of interest.

References

  1. Minihane, A.M.; Armah, C.K.; Miles, E.A.; Madden, J.M.; Clark, A.B.; Caslake, M.J.; Packard, C.J.; Kofler, B.M.; Lietz, G.; Curtis, P.J.; et al. Consumption of Fish Oil Providing Amounts of Eicosapentaenoic Acid and Docosahexaenoic Acid That Can Be Obtained from the Diet Reduces Blood Pressure in Adults with Systolic Hypertension: A Retrospective Analysis. J. Nutr. 2016, 146, 516–523. [Google Scholar] [CrossRef]
  2. Ofosu, F.K. Current Trends and Future Perspectives on Omega-3 Fatty Acids. Res. Rev. J. Biol. 2017, 5, 11. [Google Scholar]
  3. Takahashi, M.; Tsuboyama-Kasaoka, N.; Nakatani, T.; Ishii, M.; Tsutsumi, S.; Aburatani, H.; Ezaki, O. Fish Oil Feeding Alters Liver Gene Expressions to Defend against PPARα Activation and ROS Production. Am. J. Physiol.-Gastrointest. Liver Physiol. 2002, 282, G338–G348. [Google Scholar] [CrossRef]
  4. FAO FINUT. Grasas y Ácidos Grasos en Nutrición Humana: Consulta de Expertos: 10–14 de Noviembre de 2008 Ginebra; FAO FINUT: Granada, Spain, 2012; ISBN 978-92-5-306733-6. [Google Scholar]
  5. Mozaffarian, D.; Rimm, E.B. Fish Intake, Contaminants, and Human Health: Evaluating the Risks and the Benefits. JAMA 2006, 296, 1885. [Google Scholar] [CrossRef] [PubMed]
  6. Yokoyama, M.; Origasa, H.; Matsuzaki, M.; Matsuzawa, Y.; Saito, Y.; Ishikawa, Y.; Oikawa, S.; Sasaki, J.; Hishida, H.; Itakura, H.; et al. Effects of Eicosapentaenoic Acid on Major Coronary Events in Hypercholesterolaemic Patients (JELIS): A Randomised Open-Label, Blinded Endpoint Analysis. Lancet 2007, 369, 1090–1098. [Google Scholar] [CrossRef] [PubMed]
  7. GISSI-HF Investigators. Effect of N-3 Polyunsaturated Fatty Acids in Patients with Chronic Heart Failure (the GISSI-HF Trial): A Randomised, Double-Blind, Placebo-Controlled Trial. Lancet 2008, 372, 1223–1230. [Google Scholar] [CrossRef]
  8. Rubio-Rodríguez, N.; Beltrán, S.; Jaime, I.; de Diego, S.M.; Sanz, M.T.; Carballido, J.R. Production of Omega-3 Polyunsaturated Fatty Acid Concentrates: A Review. Innov. Food Sci. Emerg. Technol. 2010, 11, 1–12. [Google Scholar] [CrossRef]
  9. Waldron, K.W. Handbook of Waste Management and Co-Product Recovery in Food Processing; Woodhead Publishing in Food Science, Technology and Nutrition; CRC Press: Boca Raton, FL, USA; Woodhead Publishing: Cambridge, UK, 2007; ISBN 978-0-8493-9132-3. [Google Scholar]
  10. Folador, J.F.; Karr-Lilienthal, L.K.; Parsons, C.M.; Bauer, L.L.; Utterback, P.L.; Schasteen, C.S.; Bechtel, P.J.; Fahey, G.C. Fish Meals, Fish Components, and Fish Protein Hydrolysates as Potential Ingredients in Pet Foods. J. Anim. Sci. 2006, 84, 2752–2765. [Google Scholar] [CrossRef]
  11. Granata, L.A.; Flick, G.J.; Martin, R.E. (Eds.) The Seafood Industry: Species, Products, Processing and Safety, 2nd ed.; Wiley-Blackwell: Chichester, UK, 2012; ISBN 978-0-8138-0258-9. [Google Scholar]
  12. Furche Guajardo, C.; Martínez Torres, C. Identificación y Análisis de las Fortalezas y Restricciones del Crecimiento Agroalimentario Chileno. Estudio Contratado por la Oficina de Estadística y Política Agraria, ODEPA. Licitación Pública Nº 688-29-LE11; Qualitas Agroconsultores: Santiago, Chile, 2011; p. 117. [Google Scholar]
  13. Dovale-Rosabal, G.; Rodríguez, A.; Contreras, E.; Ortiz-Viedma, J.; Muñoz, M.; Trigo, M.; Aubourg, S.P.; Espinosa, A. Concentration of EPA and DHA from Refined Salmon Oil by Optimizing the Urea–Fatty Acid Adduction Reaction Conditions Using Response Surface Methodology. Molecules 2019, 24, 1642. [Google Scholar] [CrossRef]
  14. Pando, M.E.; Rodríguez, A.; Galdames, A.; Berríos, M.M.; Rivera, M.; Romero, N.; Valenzuela, M.A.; Ortiz, J.; Aubourg, S.P. Maximization of the Docosahexaenoic and Eicosapentaenoic Acids Content in Concentrates Obtained from a By-Product of Rainbow Trout (Oncorhynchus Mykiss) Processing. Eur. Food Res. Technol. 2018, 244, 937–948. [Google Scholar] [CrossRef]
  15. Berríos, M.M.; Rodriguez, A.; Rivera, M.; Pando, M.E.; Valenzuela, M.A.; Aubourg, S.P. Optimisation of Rancidity Stability in Long-Chain PUFA Concentrates Obtained from a Rainbow Trout (Oncorhynchus Mykiss) by-Product. Int. J. Food Sci. Technol. 2017, 52, 1463–1472. [Google Scholar] [CrossRef]
  16. Pando Ma, E.; Bravo, B.; Berrios, M.; Galdames, A.; Rojas, C.; Romero, N.; Camilo, C.; Encina, C.; Rivera, M.; Rodríguez, A.; et al. Concentrating N-3 Fatty Acids from Crude and Refined Commercial Salmon Oil. Czech J. Food Sci. 2014, 32, 169–176. [Google Scholar] [CrossRef]
  17. Wanasundara, U.N.; Shahidi, F. Positional Distribution of Fatty Acids in Triacylglycerols of Seal Blubber Oil. J. Food Lipids 1997, 4, 51–64. [Google Scholar] [CrossRef]
  18. Nunes, P.A.; Pires-Cabral, P.; Guillén, M.; Valero, F.; Luna, D.; Ferreira-Dias, S. Production of MLM-Type Structured Lipids Catalyzed by Immobilized Heterologous Rhizopus Oryzae Lipase. J. Am. Oil Chem. Soc. 2011, 88, 473–480. [Google Scholar] [CrossRef]
  19. Safra, N.M. Producción de lípidos estructurados por transesterificación enzimática del aceite de soja y aceite de palmiste en reactor de lecho empacado. Grasas Aceites 2008, 9, 337–345. [Google Scholar]
  20. Dyerberg, J.; Madsen, P.; Møller, J.M.; Aardestrup, I.; Schmidt, E.B. Bioavailability of Marine N-3 Fatty Acid Formulations. Prostaglandins Leukot. Essent. Fat. Acids 2010, 83, 137–141. [Google Scholar] [CrossRef] [PubMed]
  21. Valenzuela, R.; Valenzuela, A. Overview About Lipid Structure. In Lipid Metabolism; Valenzuela Baez, R., Ed.; InTech: London, UK, 2013; ISBN 978-953-51-0944-0. [Google Scholar]
  22. Hita, E.; Robles, A.; Camacho, B.; Ramírez, A.; Esteban, L.; Jiménez, M.J.; Muñío, M.M.; González, P.A.; Molina, E. Production of Structured Triacylglycerols (STAG) Rich in Docosahexaenoic Acid (DHA) in Position 2 by Acidolysis of Tuna Oil Catalyzed by Lipases. Process Biochem. 2007, 42, 415–422. [Google Scholar] [CrossRef]
  23. Akoh, C.C. (Ed.) Handbook of Functional Lipids; CRC Press: Boca Raton, FL, USA, 2005; ISBN 978-0-429-12556-0. [Google Scholar]
  24. King, J.W. Critical Fluid Technology for the Processing of Lipid-Related Natural Products. Comptes Rendus Chim. 2004, 7, 647–659. [Google Scholar] [CrossRef]
  25. Budisa, N.; Schulze-Makuch, D. Supercritical Carbon Dioxide and Its Potential as a Life-Sustaining Solvent in a Planetary Environment. Life 2014, 4, 331–340. [Google Scholar] [CrossRef]
  26. Shekarchizadeh, H.; Kadivar, M.; Ghaziaskar, H.S.; Rezayat, M. Optimization of Enzymatic Synthesis of Cocoa Butter Analog from Camel Hump Fat in Supercritical Carbon Dioxide by Response Surface Method (RSM). J. Supercrit. Fluids 2009, 49, 209–215. [Google Scholar] [CrossRef]
  27. Espinosa, A.; Ross, A.; Dovale-Rosabal, G.; Pino-de la Fuente, F.; Uribe-Oporto, E.; Sacristán, C.; Ruiz, P.; Valenzuela, R.; Romero, N.; Aubourg, S.P.; et al. EPA/DHA Concentrate by Urea Complexation Decreases Hyperinsulinemia and Increases Plin5 in the Liver of Mice Fed a High-Fat Diet. Molecules 2020, 25, E3289. [Google Scholar] [CrossRef]
  28. Dovale-Rosabal, G.; Rodríguez, A.; Espinosa, A.; Barriga, A.; Aubourg, S.P. Synthesis of EPA- and DHA-Enriched Structured Acylglycerols at the Sn-2 Position Starting from Commercial Salmon Oil by Enzymatic Lipase Catalysis under Supercritical Conditions. Molecules 2021, 26, 3094. [Google Scholar] [CrossRef]
  29. Council of Europe. Composition of Fatty Acids in Oils Rich in Omega-3-Acid. In European Pharmacopoeia; 07/2010:20429; Council of Europe, European Directorate for the Quality of Medicines and Healthcare: Strasbourg, France, 2013; Volume 1, ISBN 978-92-871-7525-0. [Google Scholar]
  30. AOCS. Determination of Cis-, Trans-, Saturated, Monounsaturated, and Polyunsaturated Fatty Acids by Capillary Gas Liquid Chromatography (GLC). Sampling and Analysis of Commercial Fats and Oils. In Official Method Ce 1j-7. Official Methods and Recommended Practices of the American Oil Chemists Society; AOCS: Champaign, IL, USA, 2017. [Google Scholar]
  31. Jiménez, M.J.; Esteban, L.; Robles, A.; Hita, E.; González, P.A.; Muñío, M.M.; Molina, E. Production of Triacylglycerols Rich in Palmitic Acid at Position 2 as Intermediates for the Synthesis of Human Milk Fat Substitutes by Enzymatic Acidolysis. Process Biochem. 2010, 45, 407–414. [Google Scholar] [CrossRef]
  32. Sabally, K.; Karboune, S.; St-Louis, R.; Kermasha, S. Lipase-Catalyzed Transesterification of Dihydrocaffeic Acid with Flaxseed Oil for the Synthesis of Phenolic Lipids. J. Biotechnol. 2006, 127, 167–176. [Google Scholar] [CrossRef] [PubMed]
  33. Strohalm, M.; Hassman, M.; Košata, B.; Kodíček, M. MMass Data Miner: An Open Source Alternative for Mass Spectrometric Data Analysis: Letter to the Editor. Rapid Commun. Mass Spectrom. 2008, 22, 905–908. [Google Scholar] [CrossRef]
  34. Strohalm, M.; Kavan, D.; Novák, P.; Volný, M.; Havlíček, V. MMass 3: A Cross-Platform Software Environment for Precise Analysis of Mass Spectrometric Data. Anal. Chem. 2010, 82, 4648–4651. [Google Scholar] [CrossRef]
  35. Niedermeyer, T.H.J.; Strohalm, M. MMass as a Software Tool for the Annotation of Cyclic Peptide Tandem Mass Spectra. PLoS ONE 2012, 7, e44913. [Google Scholar] [CrossRef]
  36. Myers, R.H.; Montgomery, D.C.; Anderson-Cook, C.M. Response Surface Methodology: Process and Product Optimization Using Designed Experiments, 4th ed.; Wiley Series in Probability and Statistics; Wiley: Hoboken, NJ, USA, 2016; ISBN 978-1-118-91601-8. [Google Scholar]
  37. Haq, M.; Park, S.-K.; Kim, M.-J.; Cho, Y.-J.; Chun, B.-S. Modifications of Atlantic Salmon By-Product Oil for Obtaining Different ω-3 Polyunsaturated Fatty Acids Concentrates: An Approach to Comparative Analysis. J. Food Drug Anal. 2018, 26, 545–556. [Google Scholar] [CrossRef] [PubMed]
  38. Pando, M.E.; Rodríguez, A.; Valenzuela, M.A.; Berríos, M.M.; Rivera, M.; Romero, N.; Barriga, A.; Aubourg, S.P. Acylglycerol Synthesis Including EPA and DHA from Rainbow Trout (Oncorhynchus Mykiss) Belly Flap Oil and Caprylic Acid Catalyzed by Thermomyces Lanuginosus Lipase under Supercritical Carbon Dioxide. Eur. Food Res. Technol. 2021, 247, 499–511. [Google Scholar] [CrossRef]
  39. Nagachinta, S.; Akoh, C.C. Enrichment of Palm Olein with Long Chain Polyunsaturated Fatty Acids by Enzymatic Acidolysis. LWT—Food Sci. Technol. 2012, 46, 29–35. [Google Scholar] [CrossRef]
  40. Hamam, F.; Shahidi, F. Structured Lipids from High-Laurate Canola Oil and Long-Chain Omega-3 Fatty Acids. J. Am. Oil Chem. Soc. 2005, 82, 731–736. [Google Scholar] [CrossRef]
  41. Carrín, M.E.; Crapiste, G.H. Enzymatic Acidolysis of Sunflower Oil with a Palmitic–Stearic Acid Mixture. J. Food Eng. 2008, 84, 243–249. [Google Scholar] [CrossRef]
  42. Wang, Y.; Xia, L.; Xu, X.; Xie, L.; Duan, Z. Lipase-Catalyzed Acidolysis of Canola Oil with Caprylic Acid to Produce Medium-, Long- and Medium-Chain-Type Structured Lipids. Food Bioprod. Process. 2012, 90, 707–712. [Google Scholar] [CrossRef]
  43. Ahmadkeyayeh, S.; Hawboldt, K. Extraction of lipids and astaxanthin from crustacean by-products: A review on supercritical CO2 extraction. Trends Food Sci. Technol. 2020, 103, 94–108. [Google Scholar] [CrossRef]
  44. Singh, S.; Kumar Verma, D.; Thakur, M.; Tripathy, S.; Patel, A.R.; Shah, N.; Utama, G.L.; Srivastav, P.P.; Benavente-Valdés, J.R.; Chávez-González, M.L.; et al. Supercritical fluid extraction (SCFE) as green extraction technology for high-value metabolites of algae, its potential trends in food and human helath. Food Res. Int. 2020, 150, 110746. [Google Scholar] [CrossRef]
  45. Tyskiewicz, K.; Gieysztor, R.; Maziarczyk, I.; Hodurek, P.; Rój, E.; Skalicka-Wozniak, K. Supercritical fluid chromatography with photodiode array detection in the determination of fat-soluble vitamins in hemp seed oil and waste fish oil. Molecules 2018, 23, 1131. [Google Scholar] [CrossRef] [PubMed]
  46. Song, L.; Huang, Y.; Gou, M.J.; Crommen, J.; Jiang, Z.; Feng, Y. Method development and validation for the determination of biogenic amines in soy sauce using supercritical fluid chromatography coupled with single quadrupole mass spectrometry. J. Sep. Sci. 2020, 43, 2728–2736. [Google Scholar] [CrossRef]
  47. Castejón, N.; Señoráns, F.J. Enzymatic modification to produce health-promoting lipids from fish oil, algae and other new omega-3 sources: A review. New Biotechnol. 2020, 57, 45–54. [Google Scholar] [CrossRef]
  48. Castejón, N.; Señoráns, F.J. Integrated green and enzymatic process to produce omega-3 acylglycerols from Echium plantagineum using immobilized lipases. J. Am. Oil Chem. Soc. 2021, 98, 341–352. [Google Scholar] [CrossRef]
Figure 1. Effect of the n-3/CRSO ratio, SC temperature, SC pressure, and amount of enzyme on the SAcyl synthesis process. Standardized Pareto diagrams showing the influence of the independent variables on the response variables (the blue line indicates the p ˂ 0.05 confidence interval). Panels (ae), represent EPA, DHA, EPA + DHA, PA, and EPA/DHA in sn-2, respectively.
Processes 11 00537 g001
Figure 2. Effect of n-3/CRSO ratio, SC temperature, SC pressure, and amount of enzyme on the SAcyl synthesis process. Estimated response surface and contour response surface. Panels (ae), represents EPA, DHA, EPA + DHA, PA, and EPA/DHA in sn-2, respectively.
Processes 11 00537 g002
Figure 3. Response surface and contouring graphs showing the multi-response optimization of EPA, DHA, AP, EPA + DHA, and EPA/DHA in sn-2 (SC, supercritical conditions). Panels: (a) desirability function; (b) contours of estimated response surface.
Processes 11 00537 g003
Figure 4. MALDI-TOF mMass report spectrum of glycerolipids profile obtained from CRSO, obtained between 100 and 900 m/z ratio values. The m/z ratio signals corresponding to MG, DG, and TG presenting EPA at the sn-2 position are marked in blue. Database: LIPID MAPS for glycerolipids.
Processes 11 00537 g004
Figure 5. MALDI-TOF mMass report spectrum resulting from SAcyl obtained between 100 and 900 m/z ratio values. The m/z ratio signals corresponding to MG, DG, and TG presenting EPA/DHA at the sn-2 position are marked in red. Database: LIPID MAPS for glycerolipids.
Processes 11 00537 g005
Figure 6. Thin-layer chromatography analysis: (A) non-purified CRSO, (B,C) purified CRSO, (D) n-3 LCPUFA, (E) optimized SAcyl non-purified, and (F) optimized SAcyl purified.
Processes 11 00537 g006
Table 1. Draper-Lin composite design by RSM. Tests for optimizing the conditions for obtaining the structured acylglycerol (SAcyl) *.
RunIndependent VariablesResponse Variables
n-3/CRSO
Ratio
(g/g)
A
SC Press. (bar)
B
SC Temp.
(°C)
C
B Lipase (%)
D
EPADHAEPA
+
DHA
PAEPA/
DHA in sn-2
(g/100 g TFA)
17.22555624.444.488.9311.3717
27.22554424.114.098.1912.0816
37.21235684.984.799.7710.2920
41.82554484.304.278.5711.6119
57.21234484.114.088.1911.8922
61.81235624.114.108.2111.9919
71.82555684.224.048.2611.8717
81.81234424.094.008.0912.0516
901895053.753.767.5012.5815
1091895053.833.707.5312.1118
114.5785054.614.559.1611.0634
124.53005054.613.828.4311.6325
134.51894054.294.278.5611.7912
144.51896054.694.439.1210.8821
154.51895003.883.797.6812.6315
164.518950104.344.328.6511.6516
174.51895054.654.459.0911.1017
184.51895054.544.328.8711.1916
* Y1: EPA, Y2: DHA, Y3: EPA + DHA; Y4: Palmitic acid (calculated as g/100 g of total fatty acids), and Y5: EPA/DHA in sn-2 (probable amount of structures with EPA or DHA in the sn-2 position of the SAcyl).
Table 2. Optimal values of the independent variables n-3/CRSO ratio, SC pressure, SC temperature, and enzyme percentage to maximize the EPA, DHA, EPA + DHA, and EPA/DHA in sn-2 responses by SAcyl, and the multi-response optimization of these variables *.
Optimizationn-3/CRSO
(g/g)
SC Pressure (bar)SC Temp (°C)Lip,
B
(%)
Stat, PointOptimal
Predicted Value
EPA6.4178.0060.095.69Max4.99
DHA4.3378.0060.0910.035.77
EPA + DHA6.1478.0060.098.7210.65
EPA/DHA in sn-29.0179.0160.09037.33
PA9.0430060.0910.04Min9.59
Multi-response optimization7.2482.0360.095.16MaxEPA: 4.95
DHA: 5.27
EPA + DHA: 10.25
EPA/DHA
in sn-2: 33.45
MinPA: 9.74
* n-3/CRSO: Fatty acid concentrate n-3/commercial refined salmon oil (CRSO) ratio. EPA, DHA, PA, and EPA + DHA content, expressed as g/100 g TFA.
Table 3. Composition and quantification * of fatty acids from: (a) commercial refined salmon oil (CRSO), (b) concentrate of long-chain polyunsaturated fatty acids n-3 (n-3 LCPUFA), and (c) optimally structured acylglycerols with EPA/DHA in sn-2 (SAcyl), (calculated as g/100 g TFA).
Systematic NameCRSO
(a)
n-3 LCPUFA
(b)
SAcyl
(c)
Lauric acid0.06 ± 0.00N/IN/I
Myristic acid2.90 ± 0.010.18 ± 0.002.15 ± 0.00
Palmitic acid12.76 ± 0.030.25 ± 0.0010.60 ± 0.00
Palmitoelaidic acid0.07 ± 0.000.25 ± 0.000.21 ± 0.00
Palmitoleic acid3.74 ± 0.011.90 ± 0.003.39 ± 0.00
Heptadecanoic acid0.22 ± 0.000.28 ± 0.00N/I
Heptadecenoic acid0.13 ± 0.001.30 ± 0.000.44 ± 0.00
Stearic acid3.64 ± 0.011.56 ± 0.003.17 ± 0.00
Trans-vaccenic acidN/IN/I0.47 ± 0.01
Oleic acid36.95 ± 0.083.15 ± 0.0034.66 ± 0.03
Cis-Vaccenic acid3.32 ± 0.000.33 ± 0.002.74 ± 0.00
Linoleaidic acid0.06 ± 0.002.14 ± 0.000.75 ± 0.01
Linoleic acid15.77 ± 0.0722.36 ± 0.0315.48 ± 0.00
Gamma linolenic acid0.32 ± 0.001.10 ± 0.000.37 ± 0.00
5-Eicosanoic acid0.22 ± 0.001.18 ± 0.02N/I
8-Eicosanoic acid0.44 ± 0.01N/IN/I
11-Eicosanoic acid1.84 ± 0.04N/I1.94 ± 0.00
α-Linolenic acid4.91 ± 0.009.32 ± 0.014.78 ± 0.00
Eicosadienoic acid1.34 ± 0.010.32 ± 0.000.90 ± 0.00
Behenoic acid0.36 ± 0.00N/IN/I
Eicosatrienoic acid0.33 ± 0.001.78 ± 0.001.29 ± 0.00
Erucic acid0.29 ± 0.011.53 ± 0.00N/I
Arachidonic acid0.35 ± 0.04N/IN/I
Docosadienoic acid0.12 ± 0.013.03 ± 0.141.07 ± 0.00
Eicosapentaenoic acid3.92 ± 0.0418.45 ± 0.045.92 ± 0.01
Nervonic acid0.27 ± 0.031.52 ± 0.00N/I
Docosatetraenoic acid0.15 ± 0.030.64 ± 0.010.49 ± 0.00
Docosapentaenoic acid1.69 ± 0.054.55 ± 0.012.00 ± 0.00
Docosahexaenoic acid3.83 ± 0.0422.88 ± 0.047.18 ± 0.02
Total saturated fatty acids19.942.2715.92
Total monounsaturated fatty acids47.2711.1643.85
Total polyunsaturated fatty acids32.7986.5740.23
Total n-3 long-chain PUFA9.4445.8816.39
Total n-3 fatty acids14.3555.221.17
EPA + DHA7.7541.3313.1
* EPA, DHA, PA, and EPA + DHA content expressed as g/100 g TFA. Values correspond to the mean (n = 3) ± standard deviation.
Table 4. Analysis of sn-2 position of EPA/DHA * in the monoacylglycerol (MG), diacylglycerol (DG), and triacylglycerol (TG) of CRSO (panel a) and optimized SAcyl (panel b).
m/z(a)
EPA and/or DHA Identified in sn-2 Position in CRSO
377.2686MG (0:0/20:5/0:0)
877.7280TG (12:0/20:5/22:2); TG (15:1/17:0/22:6)
879.7436TG (12:0/20:5/22:1); TG (14:0/18:0/22:6);
881.7593TG (12:0/20:5/22:0); TG (13:0/20:5/21:0)
901.7256TG (12:0/20:5/22:1); TG (14:0/18:0/22:6)
901.7280TG (14:0/20:5/22:4); TG (12:0/22:3/22:6); TG (14:1/20:5/22:3);
903.7436TG (14:0/20:5/22:3); TG (12:0/22:2/22:6); TG (14:1/20:5/22:2)
903.7412TG (12:0/20:5/22:0); TG (13:0/20:5/21:0)
905.7593TG (14:0/20:5/22:2); TG (15:1/19:0/22:6); TG (14:1/20:5/22:1)
907.7749TG (15:1/20:5/21:0); TG (14:0/20:0/22:6); TG (14:0/20:5/22:1); TG (14:1/20:5/22:0)
909.7906TG (15:0/20:5/21:0); TG (14:0/20:5/22:0)
929.7569TG (15:1/20:5/21:0); TG (14:0/20:0/22:6); TG (14:0/20:5/22:1); TG (14:1/20:5/22:0)
929.7593TG (17:2/19:1/22:6); TG (16:1/20:5/22:3); TG (18:0/18:3/22:6); TG (16:0/20:5/22:4)
m/z(b)
EPA and/or DHA Identified in sn-2 Position in Optimized SAcyl
441.2402MG (-/22:6/-)
881.7593TG (12:0/20:5/22:0); TG (13:0/20:5/20:0)
901.7280TG (14:0/20:5/22:4); TG (14:1/20:5/22:3)
901.7256TG (12:0/20:5/22:1)
903.7436TG (14:0/20:5/22:3); TG (14:1/20:5/22:2)
903.7412TG (12:0/20:5/22:0); TG (13:0/20:5/21:0)
905.7593TG (14:0/20:5/22:2); TG (14:1/20:5/22:1)
905.6630TG (13:0/20:5/22:6); TG (15:1/20:5/20:5)
905.6995TG (12:0/20:5/21:0)
907.6786TG (15:0/20:5/20:5); TG (13:0/20:5/22:5)
907.7749TG (15:1/20:5/21:0); TG (14:0/20:5/22:1); TG (14:1/20:5/22:0)
923.6525TG (15:0/20:5/20:5); TG (13:0/20:5/22:5)
923.7123TG (16:1/20:5/22:6); TG (18:2/20:5/20:5); TG (14:0/22:6/22:6)
923.8062TG (15:0/20:5/22:0); TG (16:0/20:5/21:0)
923.6371TG (14:0/20:5/22:4); TG (14:1/20:5/22:3)
927.7777TG (18:0/20:5/20:5); TG (16:0/20:5/22:5); TG (16:1/20:5/22:4)
927.7436TG (14:0/20:5/22:2); TG (14:1/20:5/22:1)
927.8375TG (13:0/20:5/22:3)
* EPA and DHA presence is highlighted in bold.
Table 5. Summary of the presence of structures with EPA/DHA in sn-2 and sn-3 probable positions identified in CRSO and SAcyl optimized validated.
SamplesEPA/sn-2 PositionEPA/sn-3 PositionDHA/sn-2 PositionDHA/sn-3 PositionAP/sn-1 PositionAP/sn-2 Position
CRSO2466-6016724
SAcyl3310129313523
Disclaimer/Publisher’s Note: The statements, opinions and data contained in all publications are solely those of the individual author(s) and contributor(s) and not of MDPI and/or the editor(s). MDPI and/or the editor(s) disclaim responsibility for any injury to people or property resulting from any ideas, methods, instructions or products referred to in the content.

