1. Introduction
Pneumatic conveyance, which refers to the transportation of materials using air as a medium in a pipeline system, is a cornerstone of various industries, including food, chemical, and pharmaceutical [
1]. This conveyance method distinguishes itself into two primary types of flow behaviours: dilute and dense phase flows [
2]. Dilute phase flows are characterised by their low solids concentrations and high velocities [
3], while dense phase flows exhibit high solids concentrations at lower velocities [
4]. Despite these differences, dense phase flows are often preferred due to their inherent advantages of higher efficiency and gentler material handling when materials are amenable to this flow behaviour [
5]. However, the practical application of dense-phase conveying faces considerable obstacles. The inherent challenge lies in the accurate characterisation of its discontinuous, wave-like nature, which significantly restricts its broader implementation. As a result, the design process of dense-phase conveying tends to lean heavily towards empirical methods often involving costly conveying trials to ensure reliable operation [
6]. Designing a pneumatic conveying system requires an in-depth understanding of the distinct flow behaviours exhibited by materials in the pipelines. The identification of these flow modes is the first step. Following this, the ability to predict potential regime changes becomes an integral part of ensuring an efficient and effective system design [
3].
One widely adopted approach to investigating the flow behaviour of bulk solids involves the use of fluidisation tests [
7]. These tests, which entail introducing air through a porous base, allow for researchers to observe and quantify the key behaviours of the material, such as aeration, deaeration, and permeability. The insights derived from these tests serve as crucial inputs for developing models that predict bulk solids’ flow characteristics under various conditions. These predictive models, in turn, are instrumental in optimising the design and operation of equipment and processes across diverse industries [
8].
A seminal contribution to this area of study is Geldart’s framework, which classified particles into four distinct groups on the basis of their fluidisation behaviour [
9]. Each group represents a different set of particle properties, including density and diameter. Classification hinges on key factors such as differences in solid and gas density, and the mean particle size.
Despite the foundational significance of Geldart’s fluidisation classification and several relevant studies [
10,
11], its applicability for pneumatic conveying applications has been subject to debate. Notably, Wypych expressed concerns regarding the sufficiency of Geldart’s classification in predicting a material’s capacity for dense-phase conveying [
12]. Responding to these concerns, Dixon extended Geldart’s work, proposing a specifically tailored classification system for pneumatic conveyance. This system, like Geldart’s, is based on factors such as density difference and mean particle size, but additionally takes into account distinct material behaviours, such as the propensity to form slugs or flow in fluidised form [
13].
Distinctions that set apart diverse fluidisation behaviours have been rigorously analysed and contrasted by several scholars in this domain [
14,
15,
16,
17,
18]. The ongoing scrutiny of these boundaries holds significant importance, considering its implications for the effective management and processing of bulk solids across various industries.
In addition to these debates, Geldart’s work has faced criticism for its neglect of the bulk properties of materials. In response, some researchers proposed using bulk density as opposed to particle density as the basis for distinguishing between particle behaviours [
19,
20]. In particular, “loosely poured” bulk density has emerged as a vital parameter offering enhanced predictive accuracy compared to Geldart’s original classification. In their pursuit of greater predictive precision regarding pneumatic-conveyance flow modes, researchers have turned their attention towards the air-particle behaviour of bulk materials. A method that has shown promise in this regard involves bench-scale tests of fluidisation and deaeration to derive permeability and deaeration factors [
21].
Defined mathematically, the permeability factor is the inverse of the fluidisation curve’s linear section slope, while the deaeration factor is the product of the pressure gradient and deaeration time [
21]. These metrics offer a new lens through which to examine and predict flow modes. Several researchers have developed predictive techniques leveraging these factors. Mainwaring and Reed, for instance, proposed a method that used steady-state fluidisation pressure, permeability, and deaeration parameters in a two-diagram system [
22]. Following this, Jones devised a system that contrasted a material’s permeability with its deaeration behaviour under mechanical vibration. This approach employs a single chart and enables the empirical grouping of materials into three distinct categories [
23].
In addition to the aforementioned strategies, another line of inquiry has involved the use of dimensionless numbers to categorise materials on the basis of their behaviour [
24]. In an example of this approach, Chambers devised a dimensionless parameter obtained by dividing the product of the particle density and permeability factor by the deaeration time constant [
25]. However, this method has faced scrutiny. Sanchez, in particular, challenged its efficacy, indicating its high sensitivity to the deaeration time constant as a significant drawback. He contended that the frameworks proposed by Dixon and Geldart provide a more reliable means of classifying material behaviour [
26].
Furthermore, the previously mentioned approaches for material categorisation have primarily focused on particle and bulk properties, often neglecting the influence of operational conditions. Recognising this gap, several researchers have incorporated operational factors into their studies. For instance, Borzone scrutinised the impact of operational conditions on a Class D material as per Geldart’s classification, which is indicative of its suitability for plug flow [
27]. However, when categorised according to Pan’s system, the same material was assigned to the third group, suggesting its compatibility with only dilute-phase flow [
20]. Borzone’s study emphasised that, by manipulating the air velocity, materials could be accommodated within a spectrum of flows, from plug flow to dilute-phase.
Adding to this discussion, Rabinovich and Kalman presented a flow regime chart tailored for vertical pipe flow, taking into account both material properties and operational conditions, especially air velocity [
28]. Defined by the Reynolds number (representative of operating conditions) and the Archimedes number (reflective of the properties of transported solids), their chart outlines several potential modes of flow for both fluidised beds and vertical pneumatic-conveyance systems. These modes include dilute flow, fast fluidisation, turbulent fluidisation, slugging flow, bubbling flow, and fluidised flow. Building on this work, Kalman and Rawat further adapted the concept of a flow regime chart to specifically address horizontal flow [
29]. Through conducting a series of experiments that varied in the material and pipe diameter, they delineated the boundaries between different types of plug flows in dense-phase conveying. Interestingly, these regions could be defined by a power law relationship between the Reynolds and Archimedes numbers.
While significant progress has been achieved in understanding the flow modes for typical granular materials, there remains a conspicuous research gap concerning unconventional materials such as biomass. Particularly, the conveyance of agroforestry biomass material, which is an integral component of the biofuel/bioenergy supply chain, is underexplored. This chain involves the mechanical transportation of crops, residues, and byproducts, requiring efficient handling and conveyance systems to distribute biomass for varied uses, including animal feed, fuel production, and composting. Consequently, enhancing our comprehension of the potential flow modes for these materials is of utmost importance [
30]. The applicability of existing flow mode identification methods to biomass material is restricted given the unique properties of such materials, such as irregular and heterogeneous particle shapes, and broad particle size distribution [
31,
32]. This leaves ample room for discovery in the study of biomass flow modes. An area ripe for investigation is pneumatic conveyance, which holds untapped potential for fresh insights.
Our current understanding of biomass flow modes is also limited due to the sparse research on the pneumatic conveyance of biomass. In the context of dilute-phase conveying where solids concentrations are low and particles are dispersed, particle–particle interactions are typically negligible [
33]. As such, this form of conveyance for biomass was the focal point of numerous studies [
34,
35]. Various studies have delved into the pneumatic conveyance of specific biomass materials. For instance, Barbosa et al. [
36] explored the conveyance of cork stoppers in a vertical pipe by adjusting the total friction factor for the gas–solid mixture, as initially proposed by Weber [
37]. Additionally, Gomes et al. [
38] examined feeding biomass into a dilute pneumatic-conveyance system. They discovered that a biomass with low bulk density demonstrated enhanced feeding efficiency at lower silo material heights due to the effortless disruption of cohesive arches. Conversely, denser materials were more efficiently fed at greater heights.
In a more recent investigation, Rajabnia et al. [
39] analysed the flow modes for cottonseed conveying and sought to discern the conditions leading to Plug-1 formation [
40]. Their findings indicated the significant influence of the feeding method in determining plug formation that they proposed was contingent on local particle arrangements during fixed bed formation. Interestingly, the study also demonstrated that the base or rear of a plug served a critical function in maintaining the plug structure by acting as a piston to push the material bed ahead. An essential contribution of the study of Rajabnia et al. [
39] was the development of a reliable and repeatable method to generate Plug-1 flow for cottonseeds while taking into account such factors as feeding, precompaction, orientation, and batch sizes.
The present study expands on prior research [
39], delving into the dense-phase flow properties of three more unique biomass materials: wood chips, wood pellets, and wheat straw. A key area of exploration is the feasibility of using the ratio of time constants linked to aeration and deaeration pressure changes during fluidisation tests. The aim is to anticipate the blockages or “pluggability” of these materials by applying the existing understanding of plug formation to cottonseeds, wood pellets, wood chips, and wheat straw. To investigate the relationship between the time constant ratio and flow behaviour, a series of experiments were conducted involving blending different materials in various configurations. Following this, a sequence of experimental tests were executed on a 12 m pneumatic-conveyance system. Testing was divided into two categories: single batch-fed conveying and continuous conveying, facilitated by a rotary valve. We analysed the behaviour of the studied materials across a wide range of air mass flow rates. The results of the study suggest that the time constant ratio could function as a unique identifier for materials exhibiting plug or non-plug flow behaviour. Furthermore, a material’s behaviour in fluidisation beds mirrored that seen during pneumatic conveyance regardless of whether it was in single-batch or continuous mode. This finding opens up new perspectives in predicting flow modes for biomass materials, a field that remains relatively uncharted.
2. Experimental Apparatus, Test Methodology, and Material Properties
In this segment, the material properties and experimental setup are introduced. This study utilised three distinct experimental configurations, specifically the aeration and deaeration test apparatus, single-batch conveying, and continuous conveying enabled by a rotary valve. Due to the unique characteristics of the test rig and the methodology associated with each configuration, each is comprehensively described in the three following subsections.
2.1. Materials
These materials exhibit diverse properties in terms of particle size, density, and shape. Fuzzy cotton seeds are lightweight and irregularly shaped, while wood chips come in various sizes and shapes, with some being denser than others. Wheat straw has a unique elongated and tubular structure that affects its fluidisation behaviour. Lastly, wood pellets are more uniform in size and shape, with a higher density compared to that of the other materials. The materials used in this study were sourced directly from the market to ensure that the findings were closely aligned with encountered conditions in industrial-scale analysis.
Representative samples of the various materials employed in this study are depicted in
Figure 1.
According to the existing literature, the reported bulk densities for cottonseed [
41], wood chips [
42], wood pellets [
43], and wheat straw [
44] range from 290 to 350, 200 to 250, 600 to 750, and 50 to 150 kg/
, respectively. In this context, the actual bulk density of the selected biomass materials was ascertained using a method involving the introduction of the different weights of each material into a vertical pipeline, followed by the computation of the average bulk density in relation to the height of the formed bed. The bulk density, particle morphology, and dimensions (length and width) of the biomass materials used in our research are detailed in
Table 1.
The results demonstrate that the bulk densities of cottonseed, wood chips, wood pellets, and wheat straw were in alignment with those in the literature.
2.2. Aeration and Deaeration Test Setup and Procedure
For the initial experimental setup, a transparent pipe with an inner diameter of 153 mm was employed to conduct aeration and deaeration tests. This test setup was similar to that reported by Rajabnia et al. [
39], and consisted of a test section and accompanying components. A schematic of the test section and its components can be seen in the previous study of Rajabnia et al. [
39].
The procedure for conducting aeration and deaeration tests involves carefully injecting and removing air from a bed of material. First, the fluidisation rig is filled with the known mass of a biomass material, and the height of the bed is measured to ensure the full coverage of the fluidisation plate. The material is then fed into the test section using a funnel from the upper section of the rig. The appropriate nozzle number is selected on the controller, and the air supply is initiated by pressing the button on the air controller. The gas flow rate is kept constant for a specific time interval to measure pressure drop and bed contraction.
After the aeration phase, the deaeration process begins by turning off the air supply to the fluidisation rig. To determine the minimal conveying velocity, the air mass flow rate is gradually increased from a low flow rate in a stepwise manner. This procedure is then continued to discover the onset of fluidisation and the possible modes of flow as described in [
39].
In order to maintain impartiality and uniformity while gauging the initial condition of the bed, the initial bed mass was given preference over the initial bed height. The bed weight was calculated by taking an average value corresponding to a specific bed height to test section diameter (H/D) ratio. To simplify matters, the initial bed mass is denoted on the basis of this average H/D value. Irrespective of whether the orientation was vertical or horizontal, the material was vertically introduced into the test section.
2.3. Batch-Fed Pneumatic Conveying Test Setup
The batch-fed pneumatic conveying test rig is a versatile experimental setup specifically designed for testing single-plug conveying. The setup comprised a 12 m transparent PVC pipeline with a diameter of 101.6 mm (4 inches).
To enable feeding the material into the system, the first 2 m of the pipeline could rotate from a horizontal to a vertical orientation before attaching to the rest of the pipeline to convey a single batch of the material. The transparent nature of the PVC pipeline, as shown in
Figure 2, facilitated the observation of the material’s behaviour during conveying, including the formation and movement of plugs.
The test setup included key elements such as PVC pipes, a plenum, Morris couplings, a receiver, wireless sensors, and stands. Six wireless sensors were strategically positioned along the pipeline to monitor and record the pressure drop during the experimental trials. The first sensor was located at the bottom of the first pipe.
In addition, two cameras were installed at different distances in front of the continuous pneumatic-conveyance rig. The first camera recorded the initial one-third section of the test, while the second camera recorded the final one-third section of the rig.
In this setup, all four types of biomass materials were tested for dense-phase flow during conveying. The testing procedure included vertically feeding all materials. To ensure consistency during testing, cottonseeds, wood pellets, and wood chips were fed in batches of 3 and 4 kg. However, because wheat straw is much lighter, half and full 2 m pipes were used to create a single plug.
In the experiments involving wood chips, wood pellets, and cottonseeds, the first air flow was set to an initial superficial air velocity of 9 m/s. However, because wheat straw is lighter and requires less air for conveying, the initial tests for this material began at 6.5 m/s. In the subsequent tests using the same material, the velocity was gradually decreased by 0.5 to 0.8 m/s. This cycle was repeated until either no conveying accrued inside the pipe or the plug became unstable and could not exit the pipeline.
2.4. Continuous Pneumatic-Conveyance Test Setup
The continuous pneumatic-conveyance rig was developed to investigate the conveying behaviour of biomass materials in dense-phase flow. This experimental setup was a combination of the batch-fed pneumatic-conveyance rig, and a hopper and rotary valve, enabling the continuous feeding of the material into the pipeline. A 250 mm inlet and outlet diameter rotary valve, model no. DT 500 C NS from NU-CON Engineering LTD was selected. This specific rotary valve features an 8-vane bevel tip rotor design that reduces air leakage and product accumulation, promoting steady and uniform material flow. Furthermore, its dual-shaft air seals inhibit product leakage, boosting the efficiency and dependability of biomass-material conveyance. To ensure the efficient and effective conveyance of biomass material, a drop box was incorporated into the conveying system under the rotary valve. The inlet air supply was positioned at a distance of 1000 mm from the centre of the drop box to promote optimal air flow and facilitate better interaction with the material in the drop box. The air supply hose was directly connected to the pipeline using a 1-inch fitting, and the same controller was employed to introduce air to the system. The assembly of the hopper and rotary valve utilised in this study is illustrated in
Figure 3.
To facilitate flexible and efficient testing, the speed of the rotary valve was controlled using variable-speed-drive (VSD) motor controllers. This allowed for the precise adjustment of the rotary valve speed within a wide range of frequencies from 0 to 50 Hz. The maximal RPM of the rotary valve was measured at 12 RPM, which corresponds to 50 Hz in VSD. As a result, the use of VSDs enabled the tests to be conducted with different solid mass flow rates while maintaining a consistent rotary valve speed.
On the basis of the initial investigation of the rotary valve’s performance, we found that wood chips and wheat straw had the potential to cause damage to the valve’s chain, thereby posing safety risks. Consequently, these materials were excluded from the continuous pneumatic-conveyance tests.
In terms of testing procedures, the primary distinction between batch-fed and continuous pneumatic conveyance pertains to the method of material feeding. In continuous testing, the material is loaded into the hopper and conveyed through the pipeline using a load of roughly 40 kg fed from the top of the hopper for each test. The tests were performed at three distinct RPMs of the rotary valve, namely, 30, 40, and 50 Hz, which corresponded to 7, 9, and 12 RPM, respectively, with varying air mass flow rates. Prior to loading the material into the hopper, the desired frequency for the correct RPM of the rotary valve had been established. Once the frequency had been set, the material was loaded into the hopper, and the testing commenced. In addition, the pipeline’s receiver was equipped with load cells that enabled the measurement of the solid mass flow rate. These load cells were linked to a computer and configured to capture the mass flow rate at a frequency of 20 Hz.
For all three experimental setups, a compressor was utilised to ensure adequate air supply throughout the experiments. The system was provided with the required airflow rate via a set of sonic nozzles controlled by a digital airflow regulator.
3. Biomass Flow Modes
In this section, the results of the aeration and deaeration tests are presented, along with the analysis of the potential flow modes for all four materials. Possible flow regimes for cottonseeds were recently presented by Rajabnia et al. [
39], and the same procedures were applied to the other materials, namely, wood chips, wood pellets, and wheat straw. Observations indicate that plugs could be formed by all materials, although the minimal required superficial velocity of air to mobilise the bed of material varied. Moreover, the probability and controllability of plug formation were higher for cottonseeds and wheat straw than those for wood chips and wood pellets. An illustration of a formed plug for wood chips, wood pellets, and wheat straw can be found in
Figure 4.
As discussed in a previous study [
39], the stability of a plug’s tail section is vital to forming a stable plug, which is directly related to material properties such as mechanical cohesiveness among particles. The presence of fuzz around cottonseed particles and the entanglements created by nested wheat-straw particles contribute to this cohesiveness, resulting in a stable plug rear. Conversely, wood pellets and wood chips, with their more uniform shapes and sizes, form plugs that are prone to collapsing as they advance through the pipeline.
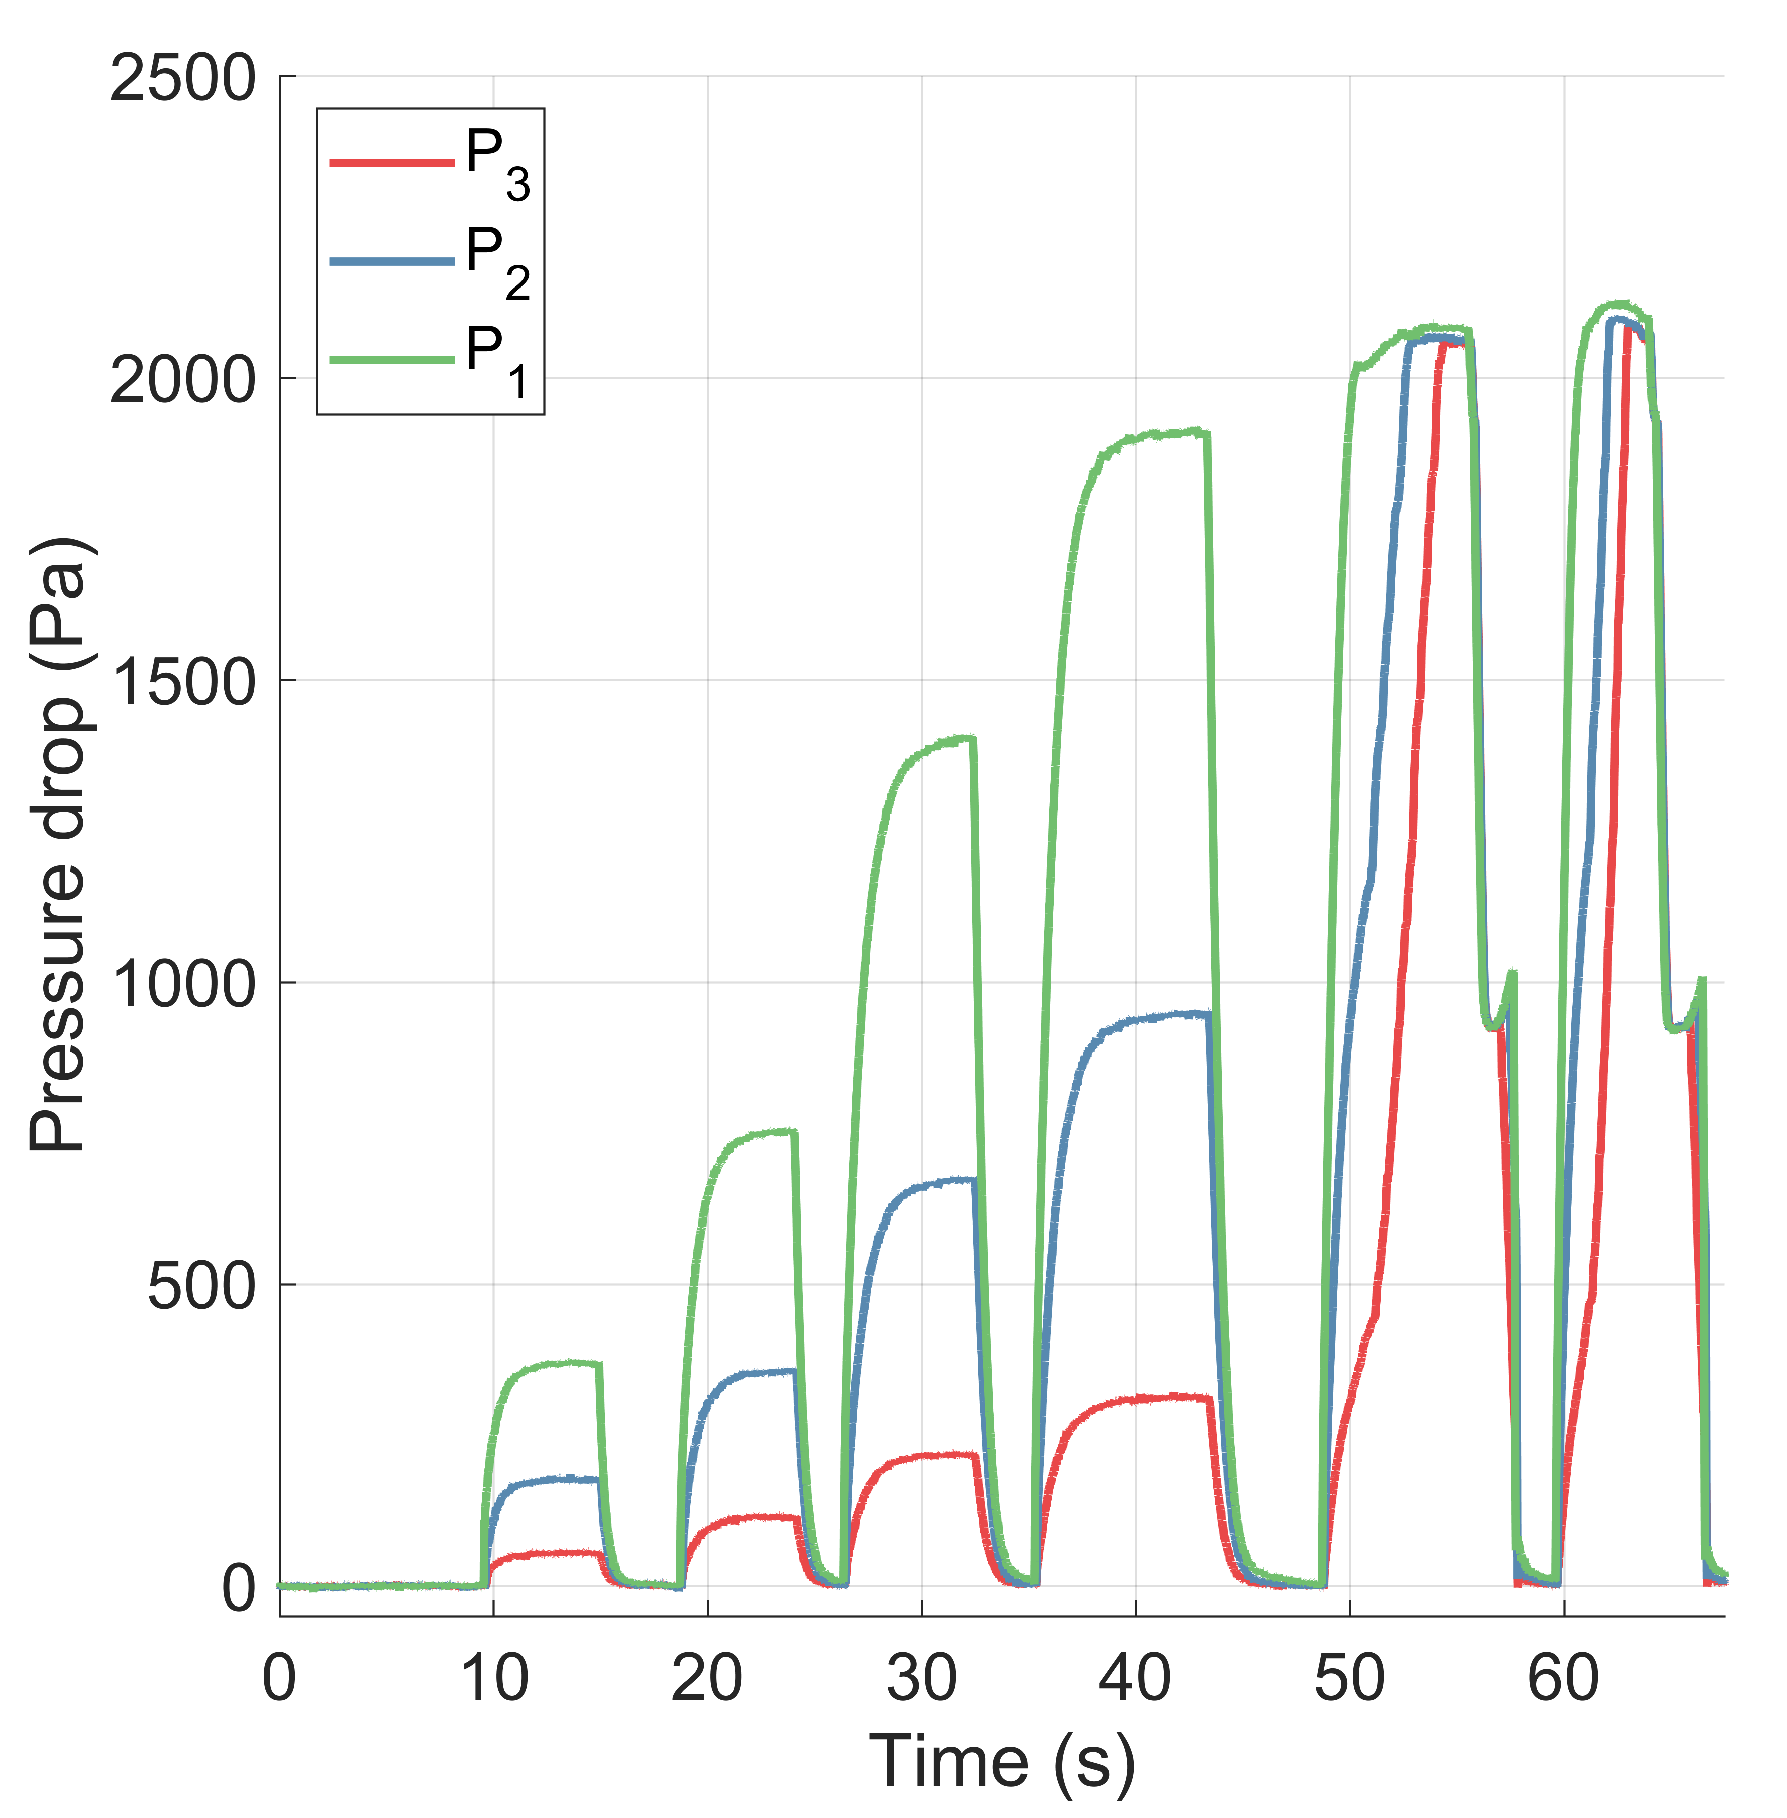
In order to gain a deeper understanding of the characteristics of all four materials, it was imperative to investigate the occurrence of aeration and deaeration in the region where the superficial velocity is below the transition superficial velocity. We could accomplish this by examining the pressure drop over the entire bed of cottonseed.
Figure 5 provides an example 3D set of aeration and deaeration time series for cottonseeds presented by Rajabnia et al. [
39], where the length of the plug was equivalent to a distance three times the pipe diameter.
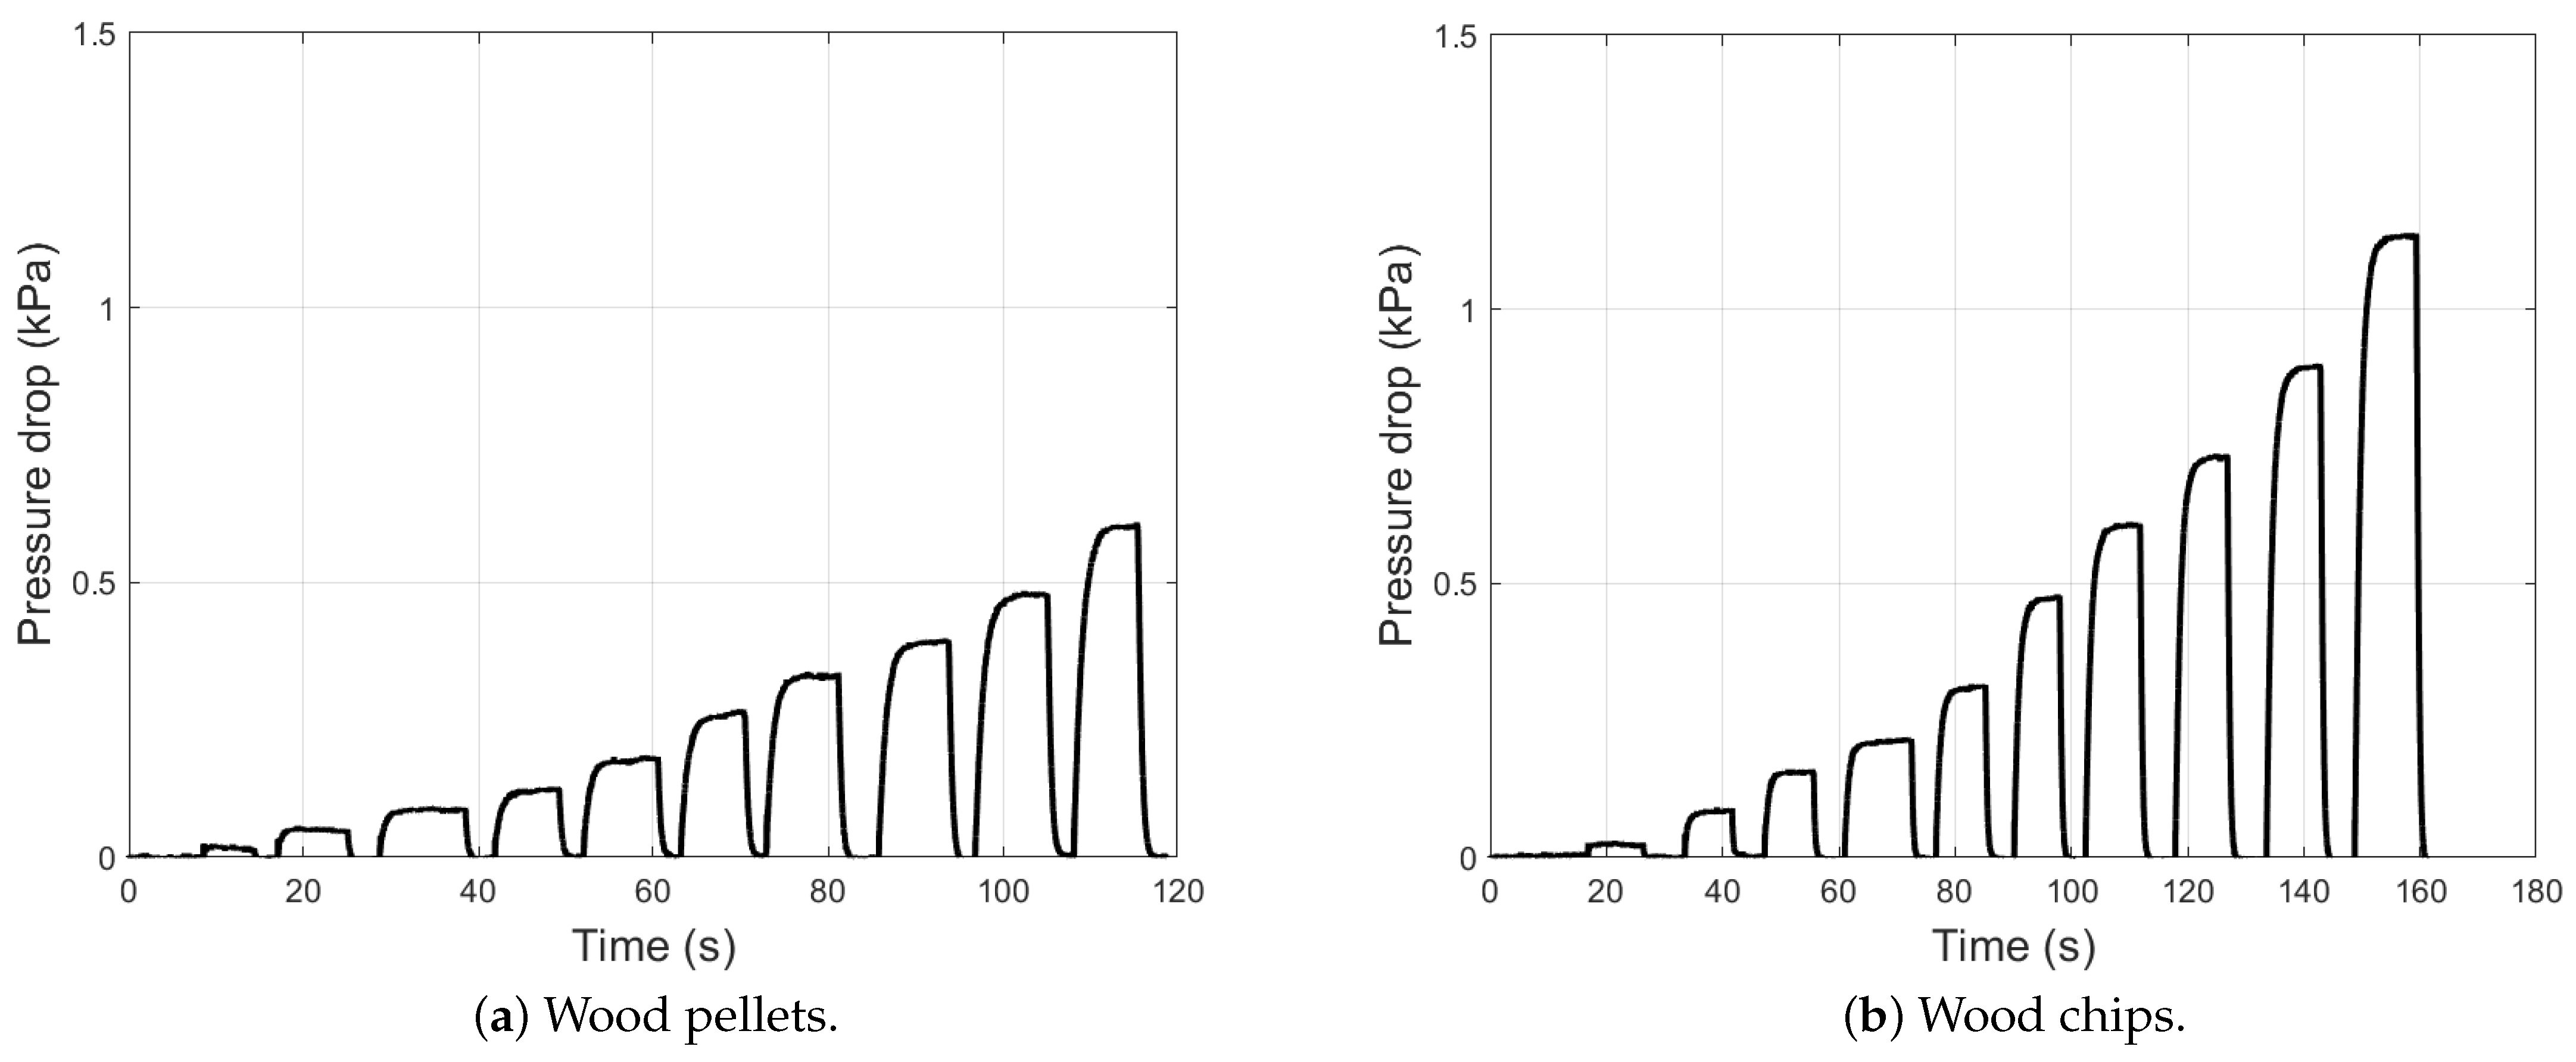
To further our analysis, we also present the time series of the pressure drop for wood chips and wood pellets in
Figure 6.
In the figures, an exponential pressure response in the region below the fluidisation onset corresponding to the ideal aeration and deaeration of a fixed bed is evident. This exponential behaviour had been documented in the literature, with deaeration being the more commonly used method to describe material behaviour. According to the literature [
45], high air retention capacity is critical in pneumatic-conveyance systems, and the rate of deaeration of a fluidised sample of the material can serve as a direct measure of this property. As a result, exponential deaeration behaviour had been acknowledged and explored as a method of characterising materials [
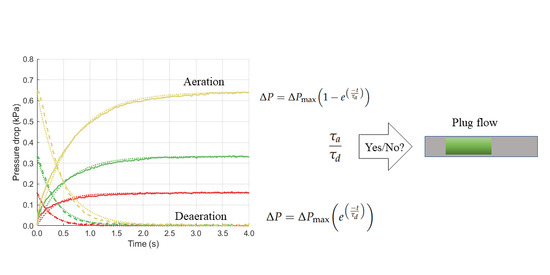
45]. However, aeration immediately preceding deaeration has not been extensively researched. Since the primary focus of this study is to investigate the time constant ratio of aeration to deaeration, the following section presents the equations for aeration and deaeration pressure drops, and provides a detailed analysis of the potential of this concept in characterising materials.
4. Aeration and Deaeration Pressure Drop Equation Derivation
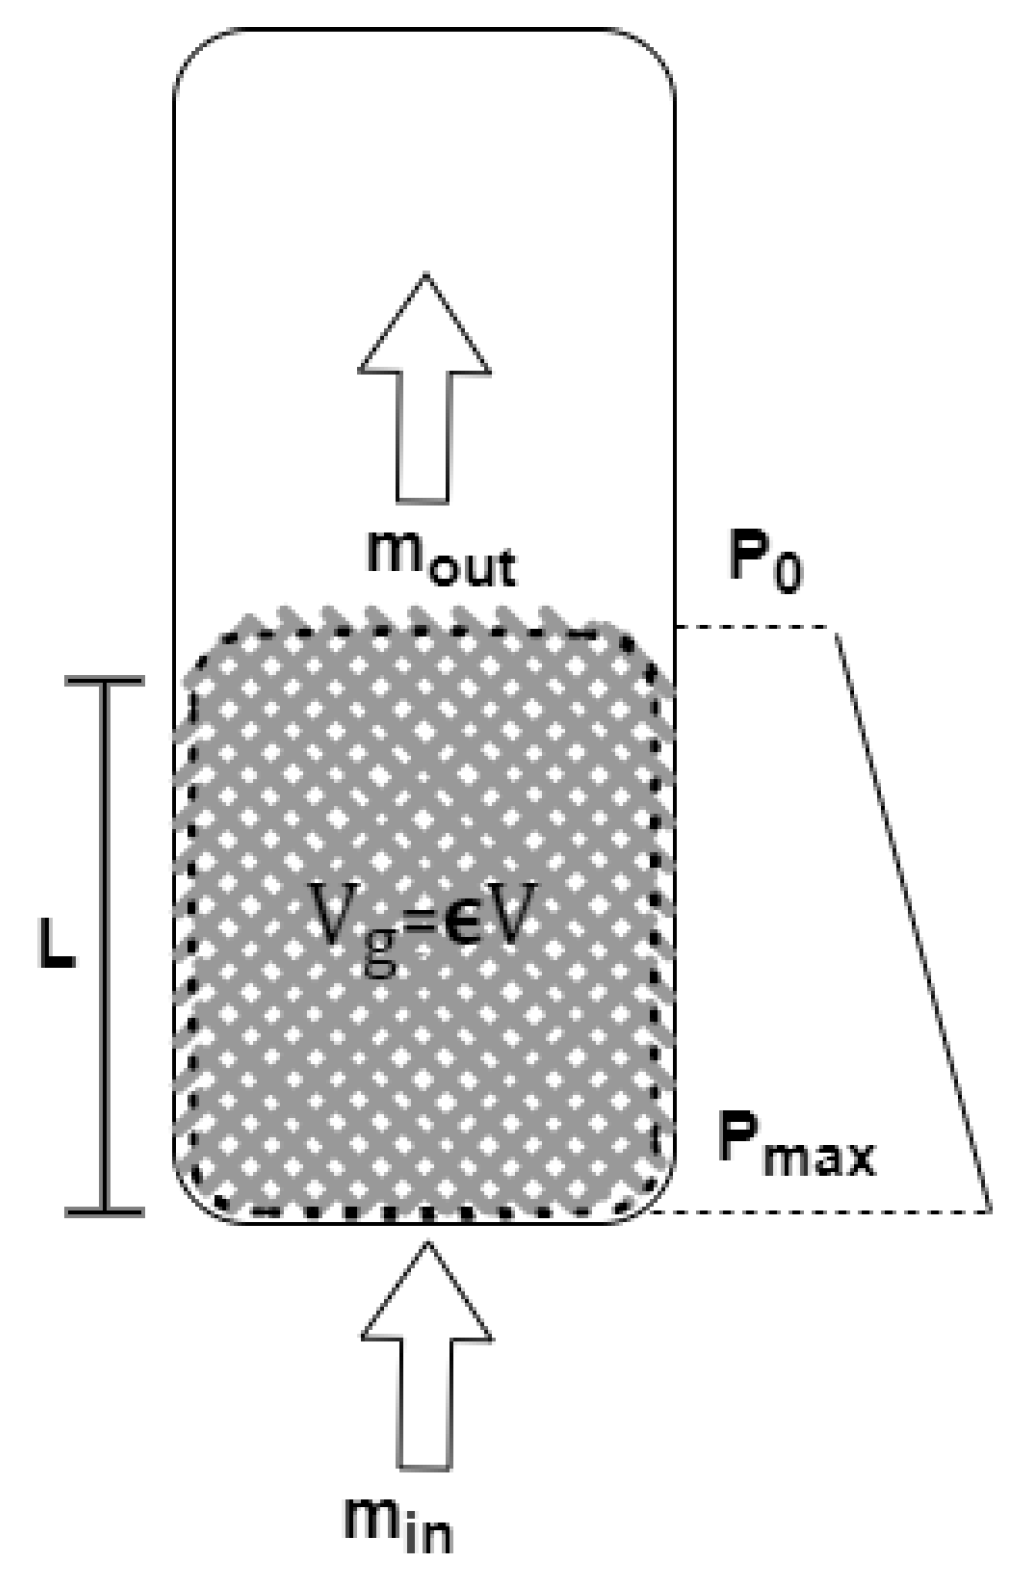
The objective of the present investigation is to examine how the ratio between aeration and deaeration time constants can be utilised to comprehend the behaviour of materials. In order to achieve this objective, the current section presents a derivation of the relevant equations. As illustrated in
Figure 7, the packed-bed assumption has been commonly employed for many years to derive the necessary equations for the pressure drop in a bed of bulk solid material.
In
Figure 7 and
are the air mass flow rates entering and leaving the bed, respectively,
is the volume of the gas inside the bed, and
and
are the maximal absolute pressure at the bottom of the bed and the ambient pressure, respectively.
Aeration is defined as the phenomenon of when air penetrates the bed of a material until the pressure drop over the bed reaches a steady-state condition that corresponds to the maximal pressure drop over the bed. Conversely, in deaeration, air flow to the bed of a material is halted, and air leaves the bed as the pressure decreases from the maximal steady-state condition to zero. The packed bed is considered a two-phase system consisting of a mix of air and solid particles, and gas volume
is calculated by multiplying the volume of the bed by the porosity of the packed bed,
. By considering the average pressure drop over the bed the pressure of the whole bed, an ideal gas equation for the gas phase of the system can be applied. However, the derivation relies on the assumption of a linear pressure drop over the bed with relatively small length L. Therefore,
can be written as follows:
By taking this assumption and substituting
, the ideal gas equation can be written as follows:
In order to account for the time dependence of the pressure drop during both aeration and deaeration, the time derivative of the ideal gas equation is taken for both phases of the system. This results in the following equation:
Assuming that the volume of the bed remains constant throughout the process, the equation can be simplified into:
The mass conservation equation for the gas within the control volume of the bed can be expressed as follows:
By substituting Equation (
5) into Equation (
4), we have:
In order to solve Equation (
6), it was assumed that the pressure drop was a function of the permeability, which is similar to the Darcy equation. The equation for Darcy’s law can be written as follows:
where
is the volumetric flow rate of gas flowing out of the bed,
is the pressure drop across the bed,
k is the permeability of the bed,
A is the cross-sectional area of the bed,
L is the length of the bed, and
is the viscosity of the gas. This equation can be rewritten in terms of the mass flow rate out of the bed as follows:
where
is the density of the gas. It was demonstrated through the conservation of mass and the ideal gas equation that, once the pressure drop had reached its maximal steady-state condition, the amount of air entering the bed was equal to the amount of air exiting the bed. Specifically, if
then,
. Therefore, when the pressure drop reached its steady-state condition, the mass flow rate entering the bed could be expressed as follows:
By substituting Equations (
9) and (
8) into Equation (
6) we have:
By solving this differential equation, the pressure drop over the bed as a function of time is as below:
where,
Furthermore, the deaeration pressure drop could be determined by satisfying the initial conditions that met the deaeration phenomenon while solving Equation (
10). This yields the following equation for the deaeration pressure drop:
The achieved equations demonstrate that the pressure drops associated with aeration and deaeration processes in a bed exhibit an exponential trend, as evidenced by Equations (
11) and (
13), where
and
are aeration and deaeration time constants, respectively. Notably, the time constant of this trend is reliant on the ratio of permeability to porosity, as indicated in the equations. Given that the time constant incorporates the permeability term, and the steady-state pressure drop is directly proportional to permeability, it follows that the maximal pressure drop is determined by the time constant.
To validate the equation derivation and investigate the time constant for different materials, an exponential curve fitting approach is applied in the subsequent section. Specifically, this approach was utilised to model aeration and deaeration pressure drop data for superficial velocities that were less than the transition superficial velocity.
5. Aeration and Deaeration Pressure Drop Data Analysis
The previous section established that the pressure drops associated with aeration and deaeration processes in a bed exhibit an exponential trend with a time constant. In this section, the pressure drop data for cottonseeds, wood pellets, wood chips, and a blended combination of these materials plus wheat straw are examined. The objective of this analysis is to validate the previously derived equation and investigate the time constant’s ratio ability to characterise materials in the context of fluidisation and pneumatic conveyance. The results are presented in three distinct subsections. The first two subsections cover the time constant ratios for individual materials, followed by blended combinations of materials and their associated time constant ratios. The third subsection serves as a general discussion, providing an opportunity to further analyse and discuss the results obtained from the previous sections.
5.1. Single Material Analysis
In this section, we outline aeration and deaeration tests that were conducted on wood chips, wood pellets, and cottonseeds with an exponential curve fitting method applied using MATLAB. (2022b). Natick, Massachusetts: The MathWorks Inc. programming. Wheat straw is not included in this section due to its considerably lighter nature, rendering the aeration test for this single material infeasible. This occurs because the aeration and deaeration cycle for wheat straw can be executed within an extremely low range of air mass flow rates, such as 0.00186 to 0.00408 kg/s; at air mass flow rates above these values, the bed moves as a plug. Consequently, the wheat-straw aeration and deaeration test was excluded from the single material test. However, in the following subsection, wheat straw is utilised as a component of blended materials.
The accuracy of the curve fit was assessed by extracting the coefficient of determination . The air supply range commenced with the minimal possible air flow rate in the rig that was available in the workshop. Subsequently, the air flow rate was incrementally increased in discontinuous steps until the plug of material had moved up or stable fluidisation had been achieved. The curve fitting procedure involves plotting the pressure drop time series in MATLAB and identifying the moment when the air supply is introduced to the system. This point was selected as the last moment when the pressure drop measured by the sensor is in close proximity to zero. Subsequently, the end of aeration is defined as the last moment before the pressure drop ceases to decay.
Figure 8 illustrates an instance of curve fitting applied to the aeration and deaeration pressure drop data for cottonseeds, wood pellets, and wood chips. As evidenced by the figures, there was excellent agreement between the exponential fitted curve, and the aeration and deaeration pressure drop data.
The outcomes of the exponential curve fitting for aeration and deaeration are shown in
Figure 9, which illustrates the aeration and deaeration time constants for each tested material.
Figure 9 displays a code where the initial two characters represent the used material:“Cs” denotes cottonseed, “Wc” stands for wood chips, and “Wp” indicates wood pellets. The following two characters indicate the length of the material bed. On the basis of the measured true bulk density of cottonseed, 960 g of this material corresponds to 1D. Therefore, to ensure consistency, equal weights of wood pellets and wood chips were introduced into the pipeline. During the experimentation process, the pressure fluctuations for wood chips and wood pellets were unacceptably high at the lowest air flow rates. As a result, it was not possible to obtain a reliable fit under these conditions. In order to ensure the accuracy of the data analysis, the two lowest air mass flow rate results were excluded from the final analysis. Additionally, the movement of cottonseed plugs occurred at a lower superficial velocity of approximately 0.56 m/s than those of wood chips and wood pellets, which require higher air mass flow rates. Therefore, the data for cottonseeds were restricted to lower superficial velocities.
Figure 9 reveals an increase in the time constants for both aeration and deaeration processes as the superficial velocity was heightened. This trend could be attributed to the mathematical expressions of Equations (
11) and (
13) that were formulated to describe the aeration and deaeration phenomena, respectively. These equations demonstrate that the time constant is proportional to the permeability of the material. Therefore, escalation in the air superficial velocity caused an upsurge in the pressure drop over the bed, consequently leading to an increase in the time constants for both aeration and deaeration. Although the time constants provide some insights, they are not unique values and may not be sufficient for a thorough material characterisation. Nevertheless, given the similar aforementioned trends observed in both aeration and deaeration, the ratio of aeration to deaeration time constants could serve as a potentially effective parameter for material characterisation, and can be written as follows:
Figure 10 illustrates the variation in the ratio of aeration to deaeration time constants for all three materials under consideration.
Figure 10 shows that the time constant ratio provided a more distinctive value than that of either the aeration or deaeration time constant, which could potentially serve as a better indicator of the behavioural characteristics of a given material.
However, because the time constant has a very small value, it is highly sensitive to the selection of start and end points, which could result in fluctuations in the ratio measurements. To obtain more accurate results, the average value of the ratios was calculated for each material. On the basis of this approach, the time constant ratios for cottonseeds, wood pellets, and wood chips were 1.24, 2.11, and 2.21, respectively. Despite a threefold difference in the bulk densities of wood chips and wood pellets, and a significant dissimilarity in their particle shapes, the time constant ratio values for the two materials were quite similar. However, when compared to cottonseeds, the time constant ratio was almost twice as high.
The time constant ratio signifies the relationship between the aeration and deaeration rates for a specific material, which is a distinctive value associated with its inherent properties and behaviour. This implies that the time needed for air to infiltrate the material’s porous structure and surpass its bulk permeability is different from the time required for air evacuation from the bulk. To the best of our knowledge, the time constant ratio had not been investigated in this manner before. In order to further analyse the time constant ratio, the next section of this study focuses on investigating a blend of various biomass materials. This investigation involves fluidisation tests to determine the behavioural patterns of these materials and their corresponding time constant ratios. Subsequently, we examine their ability to create a stable plug.
5.2. Blended Material Analysis
To gain a deeper understanding of the time constant ratio concept, it is necessary to investigate a broader range of materials. In this study, however, only three materials were examined. To address this limitation, a composite blend was created using these materials, and the time constant ratio of the resulting mixture was assessed, providing insights into the behaviour of the composite material in relation to its aeration and deaeration properties.
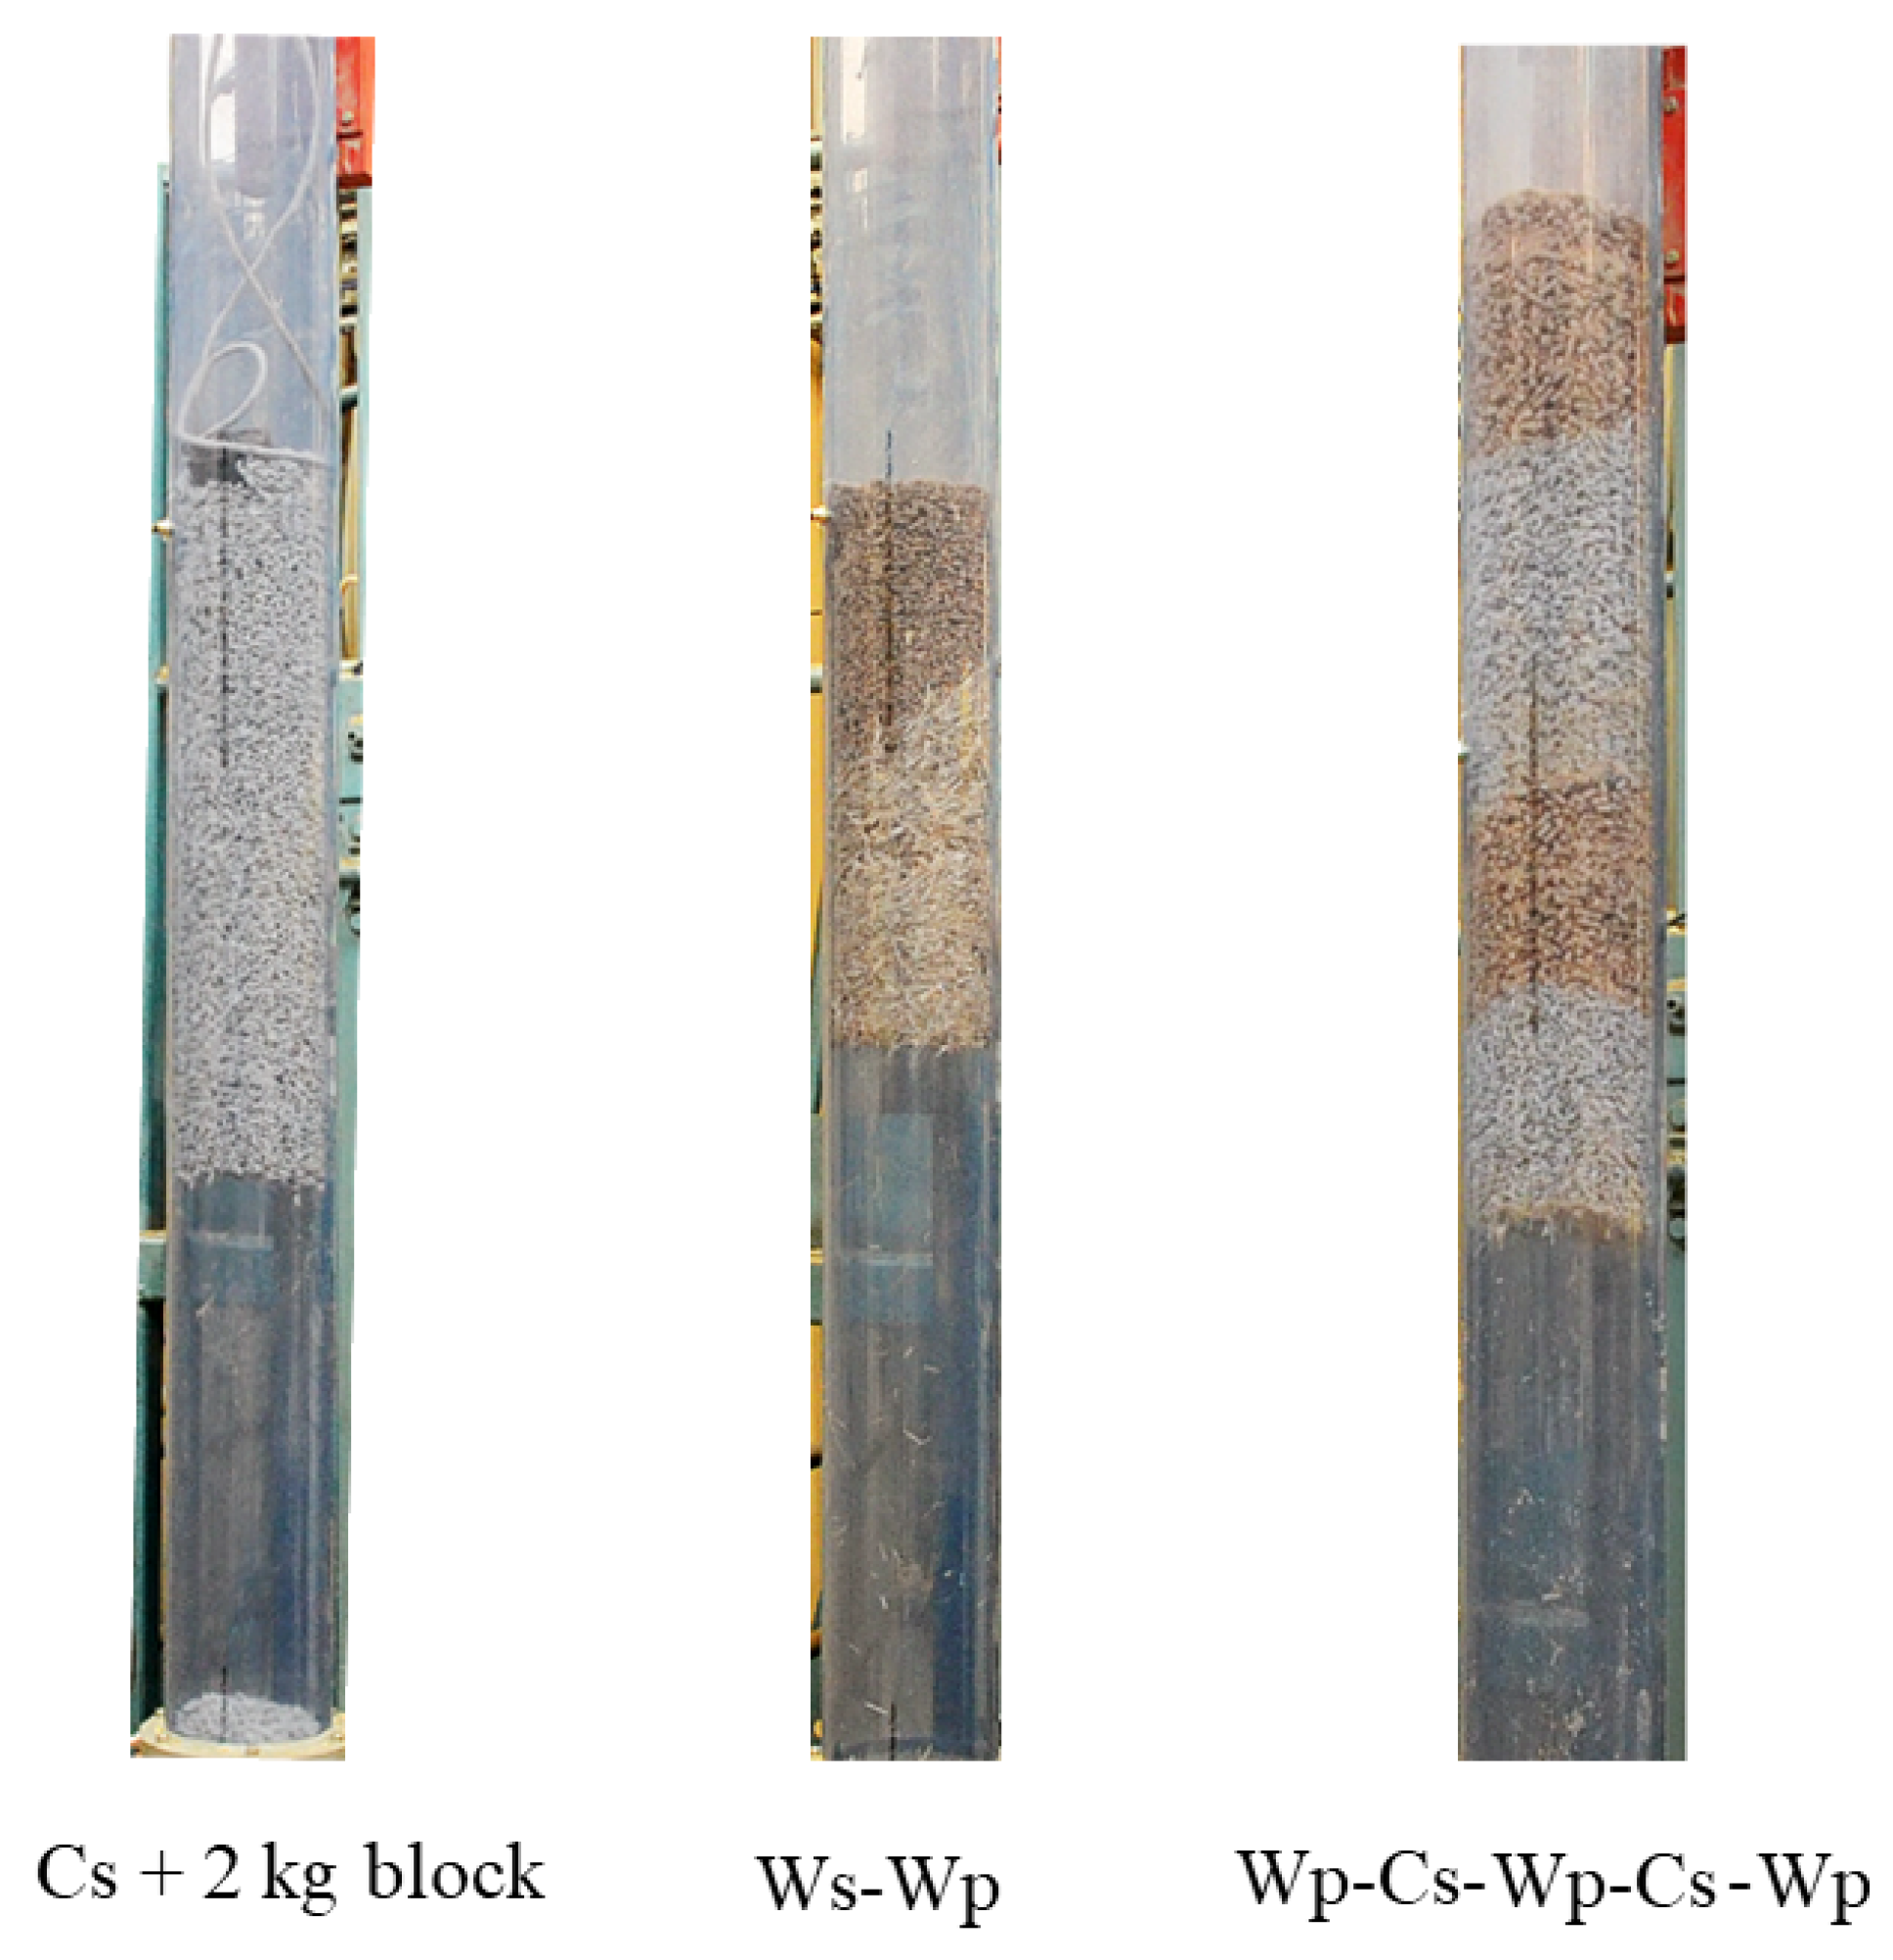
The experimental procedure incorporated two separate blending methods. The first method involved introducing a batch of material into the test column where one type of material was added followed by the other. The second method entailed preblending different proportions of materials before testing. In this context, various combinations of cottonseed, wood pellets, and wheat straw were examined in the aeration and deaeration rig, along with plug formation through increasing the air flow rate. To further investigate the uniqueness of the time constant ratio and its connection with particle and bulk properties, a 2 kg block was placed on top of a cottonseed plug, and the aeration and deaeration cycles were carried out again for this test.
Figure 11 showcases an example of the mentioned combinations of materials and the corresponding plug flows.
Following the procedure outlined in this study, the aeration and deaeration time constants were extracted for all these combinations, and the time constant ratio was obtained through the same approach.
Table 2 presents the time constant ratios obtained for various material blends, including the single material tests, as demonstrated here.
According to the findings, placing cottonseed at the bottom of the pipeline reduced the time constant and increased the probability of plug formation, especially when compared to wood pellets occupying the bottom. Additionally, introducing 11% wheat straw at the bed’s base where wood pellets were located at the top resulted in a decreased time constant ratio, leading to stable plug formation. Conversely, when wood pellets were the sole material, the probability of plug formation was much lower. The data also reveal that a blend consisting of 50% cottonseed led to a lower time constant ratio, promoting stable plug formation. However, incorporating 14% wood pellets with 86% cottonseed increased the time constant ratio, in contrast to a pure batch of cottonseed.
In this study, we introduce a new experiment that had not been previously reported in the literature that involves placing a weighted block on top of the material bed, and examining its aeration and deaeration time constants. When a 2 kg block had been placed atop a cottonseed bed, a stable plug could still form. As evidenced by
Figure 11, a plug was formed, while there was no significant change in the time constant ratio, implying the distinctiveness of the time constant ratio and its association with material behaviour.
From the observed data, we could infer that the relationship between the time constant ratio and the material’s propensity for plugging or nonplugging behaviour was significant. The evidence suggests that the material’s location within the pipeline and its compositional blend play a crucial role in determining the time constant ratio and the probability of plug formation. This highlights the necessity of understanding the connection between the time constant ratio and material behaviour for effective pneumatic-conveyance applications.
5.3. General Discussion
Key points from
Section 5.1 and
Section 5.2 demonstrate a discernible relationship between stable plug formation and the time constant ratio. In this section, we delve deeper into this pattern, ultimately leading to the final conclusion of this research on the efficacy of the time constant ratio in characterising the plugging or nonplugging behaviour of these biomass materials.
The present study establishes that the time constant ratio is a material-specific property that is independent of the amount of material or air mass flow rate introduced into the system. Additionally, we demonstrate that a closer time constant ratio to 1 leads to a higher likelihood of plug formation, suggesting that the plug/nonplug behaviour of the material may be attributed to the time constant ratio. This relationship can be justified by considering the balanced aeration and deaeration properties. When the time constants for aeration and deaeration are similar, this indicates a uniform distribution of air throughout the bulk solid, which is conducive to plug-flow behaviour. Moreover, a balanced time constant ratio minimises differences in air pressure within the material, reducing the likelihood of segregation or channeling that would hinder plug-flow formation. We found that the time constants for aeration and deaeration are directly proportional to the permeability of the material. Thus, a higher time constant ratio implies that the air finds it more difficult to exit the bed, indicating a lower permeability of the bulk of material. This observation is consistent with the proposed flow predictive diagram by Jones and Williams [
46] that suggests that the higher permeability of a bed leads to a greater likelihood of plug flow being observed. Cottonseed and wheat straw exhibited bed expansion, which increases porosity once air is introduced into the bed. This effect leads to a decrease in the time constant, resulting in a smaller time constant ratio for these materials.
The time constant ratio reflects the combined effect of porosity and permeability while air is flowing through the material bed. While the effect of permeability has been explored in the context of predictive models for modes of flow, the impact of porosity during aeration and deaeration has not been previously investigated. The proposed approach, therefore, has significant potential for further development. However, to validate the approach, it is necessary to test multiple materials and compare their time constant ratios. This topic may be considered for future studies.
In the subsequent section, the performance of the four aforementioned biomass materials in a 12 m pneumatic conveying system is examined. This analysis aims to elucidate the relationship between the material behaviour observed in the vertical fluidisation setup and its manifestation in the horizontal pneumatic-conveyance system.
6. Biomass Modes of Flow in 12 M Pneumatic Conveyance
This section presents findings indicating that the four distinct biomass feedstocks evaluated in this study exhibit plug flow characteristics in an aeration test rig. In order to further elucidate the conveying characteristics of these materials, they were subjected to both batch feeding and continuous pneumatic conveyance through a 12-m pipeline utilising a rotary valve. A series of tests were conducted on all four materials. The initial test involved using the maximal possible superficial velocity, followed by a gradual reduction in velocity until a threshold had been reached when the material was no longer moved inside the pipeline. The experiments were conducted at diverse air superficial velocities spanning from 2.56 to 9.38 m/s. Wheat straw and cottonseeds were assessed at all velocity ranges, utilising 330 and 660 g batches for wheat straw, and 3000 and 4000 g batches for cottonseeds. Conversely, wood pellets and wood chips underwent testing at air superficial velocities within the scope from 4.75 to 9.38 m/s, with both materials examined using 3000 and 4000 g batches.
Upon examination of the experimental data, it was observed that cottonseed, wood chips, and wheat straw exhibited complete plug flow during pneumatic conveyance. Wood pellets initially demonstrated plug-flow behaviour, but later transitioned to a longer and more sluglike conveyance.
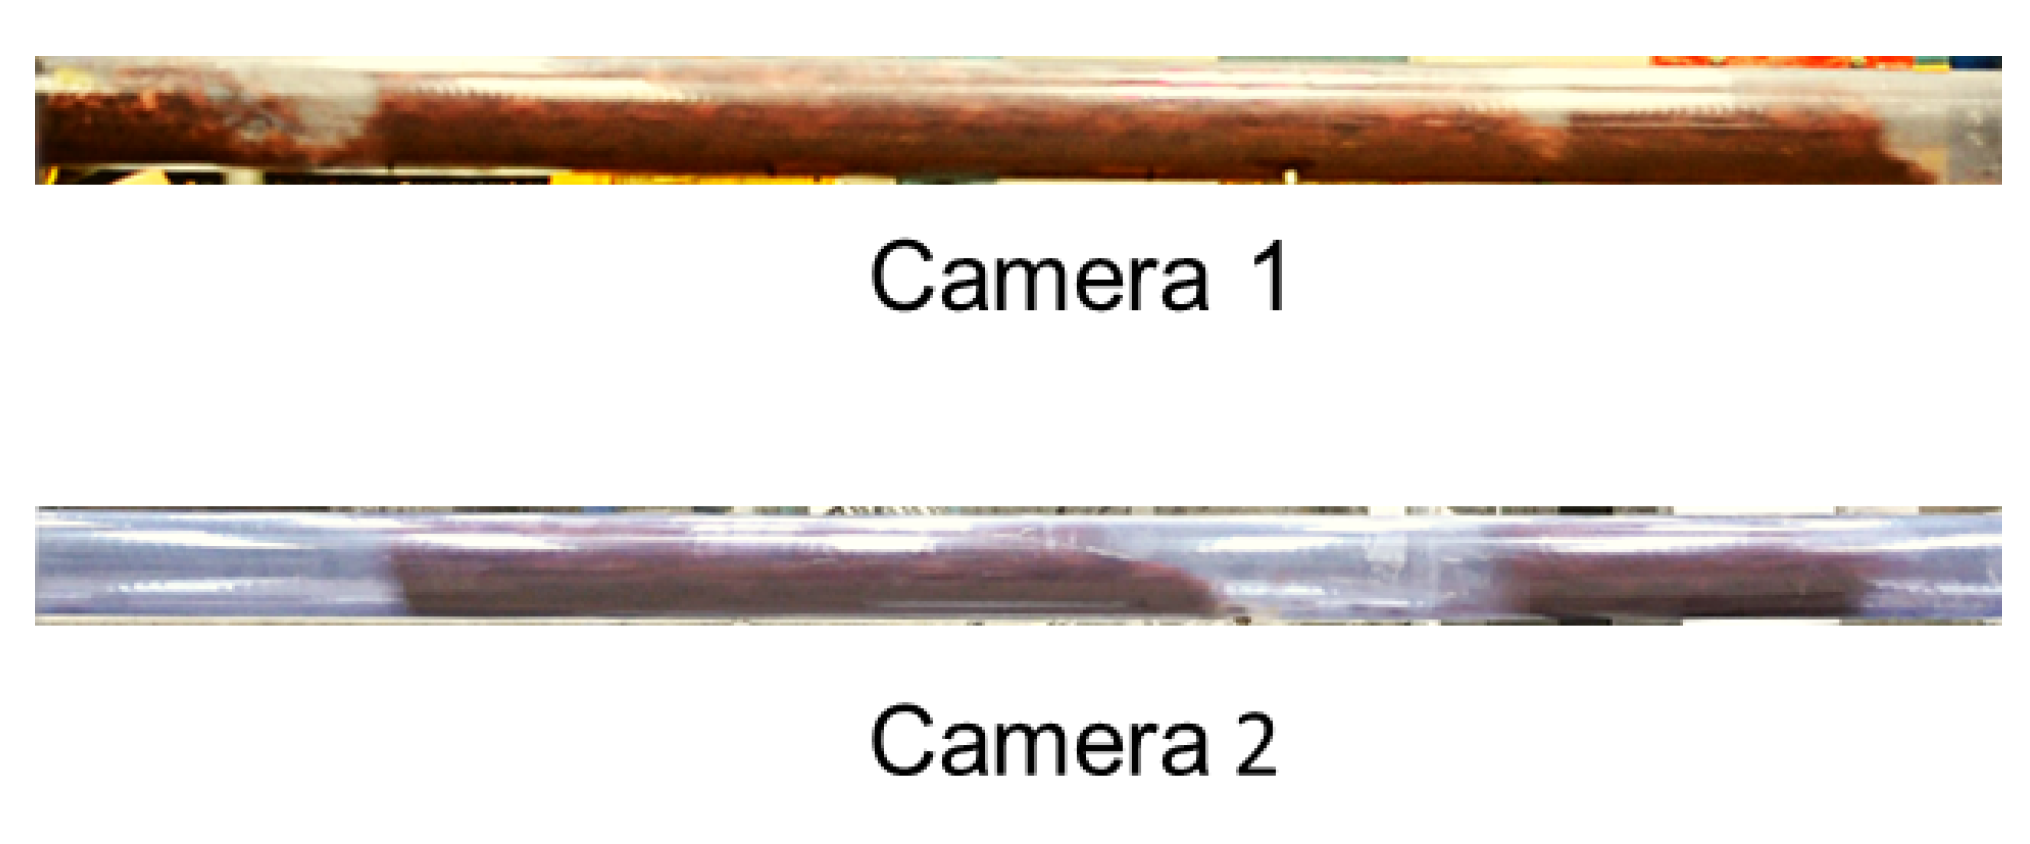
Figure 12,
Figure 13,
Figure 14 and
Figure 15 provide a visual representation of the conveying behaviour of all four materials, as recorded with Camera 1, situated at the pipeline’s front, and Camera 2, located at the pipeline’s end. The experimental observations revealed that cottonseed can be conveyed over a wider range of air supply, owing to its lower minimal conveying superficial velocity. Conversely, wood chips require nearly three times more air supply to be conveyed inside the pipeline. This finding was observed during the aeration and deaeration tests presented in the previous section.
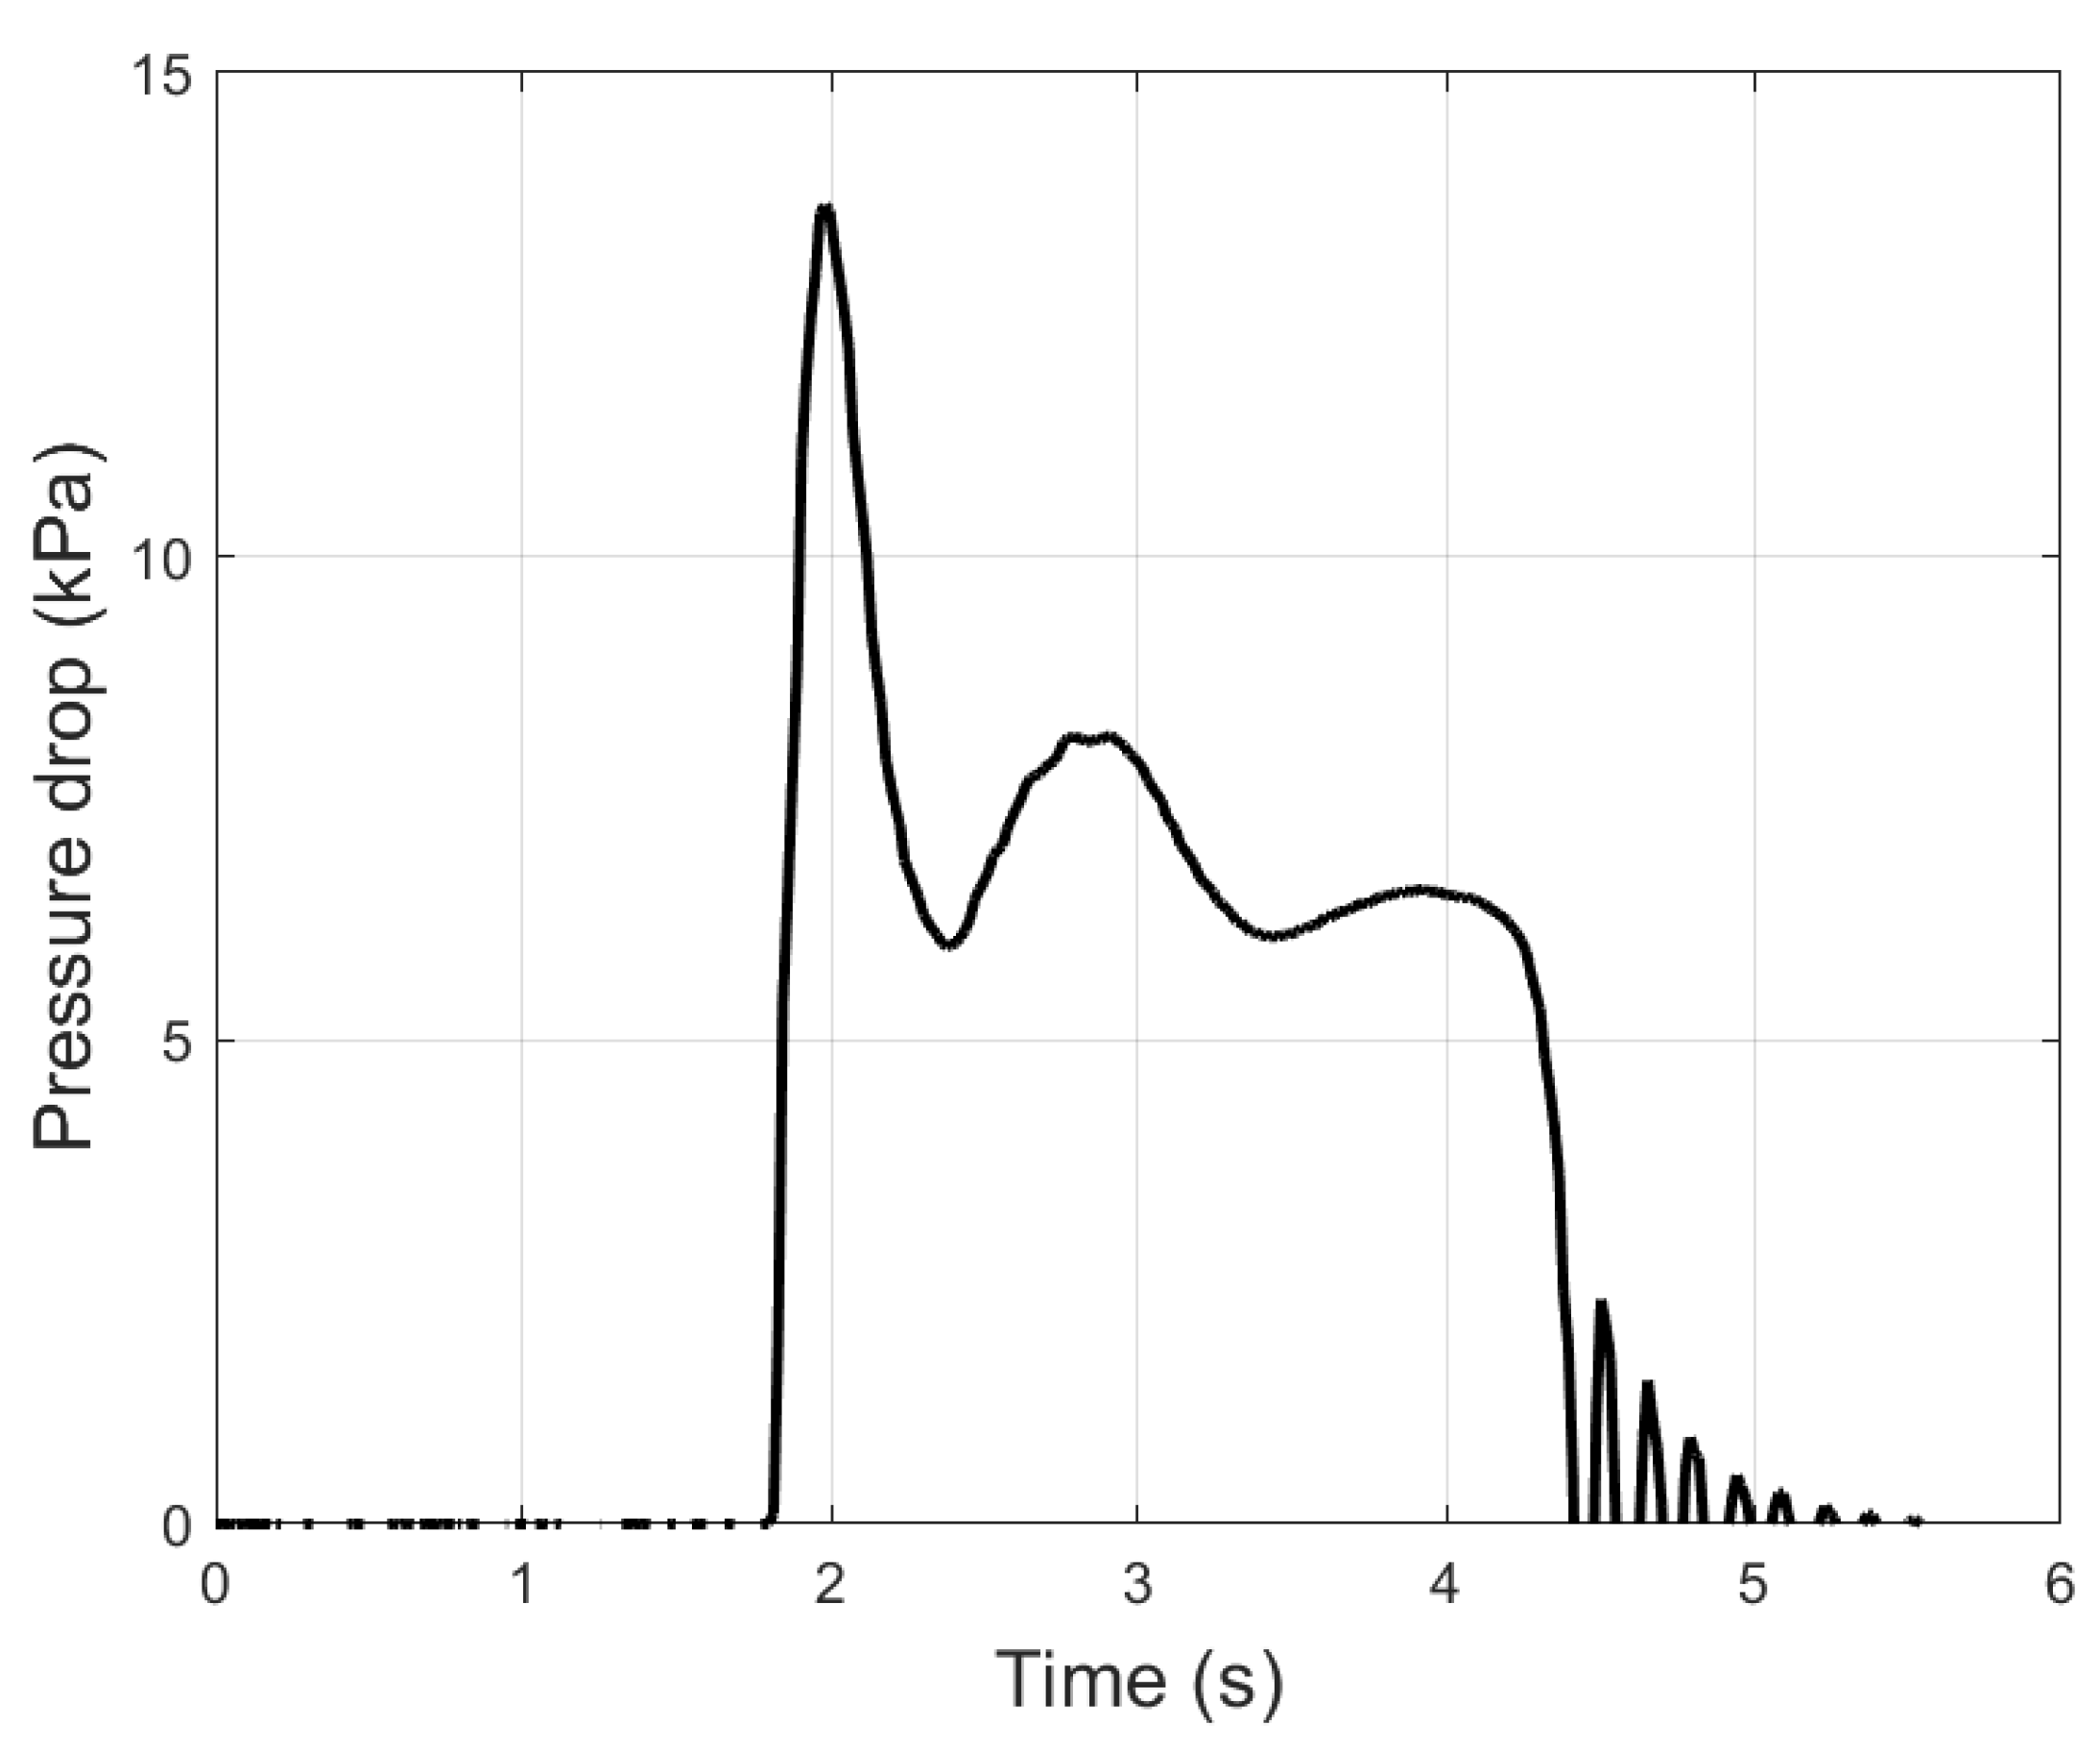
In order to study the behaviour of these materials during pneumatic conveyance, the pressure drop and aeration time constant during batch-fed conveyance were investigated. The pressure drop of 4 kg cottonseeds was measured at a superficial air velocity of 7.23 m/s, as shown in
Figure 16. The results indicate that the pressure drop initially increased, then decreased to a relatively steady-state condition, and lastly returned to zero once the material had exited the pipe.
Upon analysing the pressure drop and plug movement using video analysis, the initial increase in pressure drop had occurred before the bed started moving. This indicates that this part of the graph represents only the aeration of the bed. Therefore, it is expected that an exponential curve could be fitted to this section of the graph.
Following the same approach as that described earlier, the time constants for cottonseeds, wood chips, and wood pellets were extracted.
Table 3 displays the extracted time constants for all three materials, with a bed weight of 4 kg and under similar superficial air velocities. In addition, the time constant for wheat straw was extracted for a lower range of superficial air velocities, as shown in
Table 4.
The results for the time constants can be better understood and analysed when complemented with the pressure drop data. This comprehensive approach allows for a more complete evaluation of the system’s performance. Consequently,
Figure 17 presents the pressure drop for all tests in the single-batch and continuous conveyance of all materials as a function of the solid mass rate. “Single” and “PC” denote single batch and continuous pneumatic-conveyance tests, respectively, while “Cs”, “Wc”, “Wp”, and “Ws” represent cottonseed, wood chips, wood pellets, and wheat straw, respectively.
The results reveal that wheat straw and cottonseeds had lower aeration time constants, indicating faster and more efficient air penetration into the bed. Conversely, wood pellets and wood chips exhibited higher aeration time constants, with wood pellets demonstrating greater consistency, and wood chips displaying a wider range of variation in aeration time constants.
These results support the discussion on the minimal conveying velocity earlier in this section, where cottonseed and wheat straw require lower air mass flow rates for plug formation. This implies that the rate of air entering and leaving the bed for wood chips and wood pellets was lower than those for cottonseed and wheat straw, leading to a higher time constant ratio. Therefore, the likelihood of segregation and blockage in these materials is increased, causing the plug to collapse or resulting in a significant increase in pressure drop as a sign of blockage within the bed. On the other hand, cottonseed typically forms a stable plug, and if the air supply is insufficient for the bed, no significant pressure drop occurs in the system, allowing for air to enter and leave the bed under steady-state conditions.
The observed relationship between the time constant ratio and the likelihood of plug-flow formation provides further justification for the importance of this ratio in predicting material behaviour. A more balanced ratio (closer to 1) would result in the uniform distribution of air within the bed, promoting plug-flow formation, and reducing the likelihood of segregation and blockage.
In the context of continuous pneumatic-conveyance experiments, both cottonseed and wood pellets were tested, revealing that plug flow is more likely to occur in both materials. However, the plug formation differed: cottonseed formed multiple shorter plugs, while wood pellets formed fewer but longer plugs. This behaviour was analysed and explained through captured videos of the pneumatic-conveyance process for both materials.
Cottonseeds tend to form clusters, which reduces the time required to form the rear of the plug. In contrast, wood pellets have a tendency to roll along the pipe, leading to a lower probability of forming a full cross section of material at the rear of the plug. Once the cross section of the material is formed, the back pressure generated at the rear of the plug initiates plug movement. Nevertheless, this process increases the risk of blockage, as the longer plug necessitates a significantly higher pressure drop.
Furthermore, due to the higher time constant ratio in wood pellets, air encounters increased resistance from the bed, hindering exiting. As a result, the minimal conveying air mass flow rate required for wood pellets was considerably higher than that for cottonseed, as demonstrated by the test matrix.
7. Conclusions
In conclusion, this study conducted a comprehensive investigation into the flow modes of four distinct biomass materials, namely, wood chips, wood pellets, cottonseed, and wheat straw, employing three separate test setups: aeration and deaeration, single-batch, and continuous conveyance. Building upon the authors’ previous research, which highlighted cottonseed’s propensity to form a plug in both vertical and horizontal configurations, this study aimed to further explore the behaviour of these intricate materials within pneumatic-conveyance systems. To achieve this, three additional biomass materials were examined due to the scarcity of existing research in this area.
Initially, the aeration and deaeration behaviours of cottonseeds, wood chips, and wood pellets were scrutinised, resulting in the derivation of exponential equations for aeration and deaeration. The findings revealed that the time constant is directly proportional to the permeability and porosity ratios. Additionally, as the aeration and deaeration time constants rose with superficial velocity, the proportion of these constants manifested as a more unique characteristic of the material. In particular, when the ratio of time constants approached 1, it signified an increased probability of the material developing a plug flow.
Subsequent experimental tests involving various combinations of the aforementioned biomass materials corroborated this finding. This study also examined the behaviour of these materials within a 12 m pneumatic-conveyance system employing both single-batch and continuous conveyance setups with a rotary valve. The results indicate that the aeration time constants for all materials in the aeration test setup followed a similar trend, with cottonseeds displaying a more stable and lower time constant than that of wood chips, which exhibited a broader variation in their time constants. As a consequence, higher aeration time constants in wood chips and wood pellets led to increased minimal conveying superficial velocities, elevating the likelihood of blockage.
This research offers a novel contribution by introducing the concept of the ratio of aeration time constants to deaeration, paving the way for future studies to examine a wider array of materials from diverse types to yield further insights into this phenomenon.

 ,
, 


