
Direct Numerical Simulation of Bubble Cluster Collapse: Shape Evolution and Energy Transfer Mechanisms

Key Laboratory of Acoustics Research, College of Metrology and Measurement Engineering, China Jiliang University, Hangzhou 310018, China
*
Author to whom correspondence should be addressed.
Processes 2023, 11(7), 2191; https://0-doi-org.brum.beds.ac.uk/10.3390/pr11072191
Submission received: 26 June 2023
/
Revised: 14 July 2023
/
Accepted: 19 July 2023
/
Published: 21 July 2023
(This article belongs to the Special Issue Complex Fluid Dynamics Modeling and Simulation)
Abstract
:This study employs the VOF method to conduct the direct numerical simulation of the collapse progress of the near-wall bubble cluster. Factors such as viscosity, compressibility, and surface tension are taken into account, with an emphasis on the flow field energy evolution. Firstly, the collapse of a cubic bubble cluster comprising 64 bubbles is simulated, validating previous research regarding the morphological evolution and energy release mechanisms during cluster collapse. Overall, the cubic bubble cluster collapse exhibits a layer-by-layer phenomenon, where the outer layer bubbles collapse first, converting a portion of bubble potential energy into fluid kinetic energy, which then contributes to the inner layer bubble collapse. The pressure wave energy is primarily released when the whole bubble cluster completely collapses. Secondly, we investigate the collapse process of columnar bubble clusters, which closely resemble realistic cloud cavitation. By comparing the collapse behavior of bubble clusters with different heights, we reveal the non-linear delay effect of the cluster height on the collapse time. Additionally, we consolidate our long-term research on the bubble cluster and conclude that both the scale and shape of the bubble clusters have a limited impact on the conversion rate of bubble potential energy to pressure wave energy . For instance, when the stand-off distance and the inter-bubble distance , the conversion rate remains consistently 9–15% for various bubble clusters of different scales and shapes.
1. Introduction
Cavitation erosion, precipitated by the cavitation structure collapse, contributes detrimentally to the functionality of hydraulic machinery and ship propulsion systems. Specifically, the cavitation effect will reduce the hydraulic system efficiency, erodes the material surface, and induces significant noise [1,2,3]. Hence, the prevention and avoidance of cavitation erosion have always been critical issues in engineering. Researchers generally aim to prevent and mitigate the impact of cavitation effects during the design phase. On the other hand, the cavitation phenomenon plays a crucial role in ultrasound-based therapeutic diagnosis [4,5], which requires prior cavitation prediction. Thus, to both prevent and leverage the cavitation effect, estimating its intensity in the target flow field is vital. To achieve this, further research must delve into the mechanisms underlying bubble cluster collapse.
Recently, investigations on the cavitation bubble collapse have covered various aspects, leading to a better understanding of the bubble dynamics behavior and establishing the foundation for the cavitation prediction mechanisms. Currently, the single bubble dynamics have been sufficiently investigated, but practical cavitation phenomena are generally associated with cloud cavitation. The energy released during the bubble cluster collapses not only surpasses that of a single bubble but also has a higher density energy flow during a specified period and triggers a highly intensive impact on materials, leading to cavitation erosion. To further develop the prediction of cavitation erosion, it is urgent to clarify cloud cavitation dynamics and erosion mechanism. As a result, research into the bubble cluster collapse becomes a hot spot.
Researchers primarily employ numerical methods to study the complex dynamic behavior induced by the interaction between bubbles and the bubble cluster collapse mechanism. Ghahramani [6] evaluated the performance of three different numerical methods for multi-bubble simulation side by side and factoring in the liquid phase compressibility when determining the collapse release pressure. Chahine [7], on the other hand, applied the boundary element method to examine the bubble interaction and evolution in unsteady flow, where phenomena such as the jet, bubble splitting, shear detachment, and unstable interface deformation were identified. Tiwari [8] carried out a compressible multiphase flow simulation using the diffusion interface method to study the collapse of a hemispherical bubble cluster composed of 50 cavitation bubbles near the wall. His study indicated that the overall collapse direction is toward the center of the cluster, with a weak correlation to the geometric arrangement within the bubble cluster. Bui et al. [9] used the boundary element method to simulate the collapse of a cavitation cloud composed of 37 bubbles. This study found that the collapse of the bubble cluster followed an outside-in progression, and the bubbles in the inner layer were unaffected by the collapse of the outer layer and known as the shielding effect. Through a combination of experimental and simulation studies, Jian et al. [10] demonstrated that cloud cavitation flow generates two potentially cavitating pressure waves: one from the cavitation bubble collapse and the other from bubble detachment. More importantly, the vacuoles in cloud cavitation will form small cavitation structures and collapse independently. Zhang [11] conducted comprehensive studies on the cavitation effects of various cavitation flows, using direct numerical simulation based on the volume of fluid (VOF) method. He thoroughly examined the laws governing bubble cluster collapse and detailed the energy evolution during cavitation bubble collapse [12]. Collectively, these findings elucidate the dynamic characteristics of bubble collapse, including trajectory, collapse timing, and shape. Key parameters such as driving pressure, proximity to the wall, and inter-bubble distance primarily determine these dynamics and are closely associated with cavitation intensity.
The numerical model of cavitation erosion prediction was developed based on the above research. One of the primary challenges in advancing the cavitation prediction is understanding the cavitation erosion mechanism, primarily explained by two main theories: jet impact and pressure wave impact. In recent years, significant attention has been devoted to the cavitation erosion prediction system based on the pressure wave theory. The pressure wave impact is characterized by the emission of spherical pressure waves from the center point of bubble collapse, which rapidly propagate in the flow field and eventually impact the solid surface. The bubble potential energy theory is essential to the pressure wave impact theory. The bubble potential energy theory was first proposed by Hammitt et al. [13] in 1963. According to this theory, the bubble potential energy positively correlates with the bubble volume and the pressure difference at the bubble interface. In Cole’s experimental study [14], it was observed that the pressure wave generated by the bubble collapse is linearly related to the bubble potential energy, particularly in the case of spherical bubble collapse, as further verified by Vegol [15]. Fortes [16] also suggested that the pressure wave shock theory is the primary mechanism for cavitation erosion. Numerous studies focus on understanding the spatiotemporal distribution of the pressure wave post-collapse, revealing a connection between the signal characteristics of the pressure wave and the bubble potential energy [17].
The pressure wave shock theory has been developed based on a deeper understanding of bubble dynamics. Kato et al. [18] proposed using this theory for cavitation prediction, while Fortes [19] developed a set of cavitation erosion prediction methods based on Kato et al.’s research that can forecast material surface damage. This method uses the Herring–Keller equation [20] and the explicit Tait equation [21] to simulate the pressure release during bubble collapse and employs the acoustic approximation algorithm to estimate the potential energy contained in the pressure wave. The finite element calculation based on the SOLID model [22] is then used to simulate the material deformation caused by the pressure wave. This system predicts the energy transfer process from the bubble potential energy to the pressure wave energy and calculates the energy absorbed by a material surface through an analysis of surface deformation. Melissaris [23] applied a method of cavitation erosion prediction, grounded in both URANS simulation and energy transformation theory, exhibiting robust agreement with cavitation hydrofoils’ experimental data. Building on Forte’s research, Schenke et al. revealed the mechanism of cavitation from an energy perspective [24] and combined the method of energy projection [25] to establish a refined erosion prediction system [26], which is capable of predicting the distribution of the average cavitation intensity. In summary, most cavitation erosion prediction models are based on the dynamics of a single bubble, whereas actual cavitation phenomena are closely associated with bubbly flows. Therefore, a refined comprehension of bubble cluster dynamics can enhance the accuracy of erosion intensity prediction.
This paper aims to conduct numerical simulations of bubble cluster collapse and explore the characteristics of pressure wave energy using energy analysis. Firstly, a compressible numerical simulation method is developed. Based on this method, the bubble collapse process is simulated, and the propagation of pressure waves and the energy variation in the flow field are monitored. Finally, the conversion rate of bubble potential energy to pressure wave energy is determined by analyzing the energy conversion process. Considering the frequent appearance of horseshoe-shaped bubble clusters in hydrodynamics, with only the “horseshoe” in contact with the wall, we simplify the structure and focus on the cubic and columnar bubble cluster structures in this paper. The erosion forecasting is mainly based on energy analysis methods; therefore, we focused on the influence of various factors on the energy conversion rate of bubble potential to the pressure wave energy.
2. Numerical Methods
In this study, we undertook a numerical simulation of the two-phase flow, with water as the principal phase and vapor as the secondary phase. The interface of bubbles is captured by the VOF method, with consideration of surface tension. The fundamental assumption underpinning VOF is that two fluids remain unmixed and maintain a continuous phase interface, with each phase displaying identical velocity and temperature fields.
The governing equations of simulation are demonstrated below:
where signifies the volume fraction of the liquid phase, and the velocity vector and pressure are represented by and , respectively. The surface curvature is denoted by , and we set the surface tension coefficient, , to N/m. Furthermore, indicates the shear rate tensor, while the normal vector of the surface is marked by . Finally, we compute the density, , and viscosity, , of the fluid mixture using the volume fraction-weighted average of the two-phase fluids.
In this paper, subscript 1 corresponds to the water component, whereas subscript 2 denotes the vapor component.
where kg/m3 and kg/m3 denote the phase densities for the liquid and gas phase, respectively. The local sound speeds for each phase are represented by and . The parameter is fixed, and the parameter is computed under an isentropic assumption. The constant pressure model simulates the vapor bubble dynamics to ensure that the bubble’s pressure never exceeds the saturation pressure.
In the study, we analyzed the energy variation during bubble collapse and defined three energy categories: bubble potential energy, flow kinetic energy, and pressure wave energy. Their corresponding computation formulas are presented below:
where is the pressure difference between the inside and outside of the bubble’s interface, c is the liquid’s sound speed. is the density of the mixed fluid. R is the bubble’s radius, whose initial value is . The initial bubble potential energy is , And to estimate the ability of energy variation, the conversion rate of bubble potential energy to pressure wave energy is defined as:
The FVM discretizes governing equations, and PISO is applied to solve the variable coupling computation. The spatial discretization of convective terms utilizes the VanLeer scheme, while the Laplace operator’s discretization incorporates the central differencing method. For temporal discretization, the study applies a first-order explicit Euler method. The coupling calculation between velocity and pressure utilized the implicit pressure splitting operator. The pressure equation was solved using the preconditioned conjugate gradient algorithm, while the velocity equation was solved using the biconjugate gradient algorithm. All simulations were performed on the open-source platform OpenFOAM.
The solver’s reliability is ascertained by simulating the collapse of a single bubble and juxtaposing the results with the analytical solution derived from the Rayleigh–Plesset equation and the Rattray equation.
In the formula above, denotes the collapse time as calculated by Rayleigh’s equation under flow-field conditions, and T symbolizes the collapse time computed using Rattray’s equation under near-wall conditions. Furthermore, refers to the density of the liquid, whereas signifies the stand-off distance.
In Figure 1, the dimensionless parameters of time and bubble radius are normalized to the total bubble collapse time and the initial bubble radius, respectively. The Rayleigh–Plesset equation’s numerical solution was rendered using the fourth-order Runge–Kutta method. It can be observed that the numerical solution in this study closely matches the solution of the R–P equation, indicating that the solver employed in our research accurately simulates the vapor bubble collapse process.
Figure 2 presents the collapse time of a single bubble under varying stand-off distances, juxtaposed with Rattary’s collapse time. The congruence between our numerical results and Rattary’s under near-wall conditions further validates the solver’s reliability.
3. Result
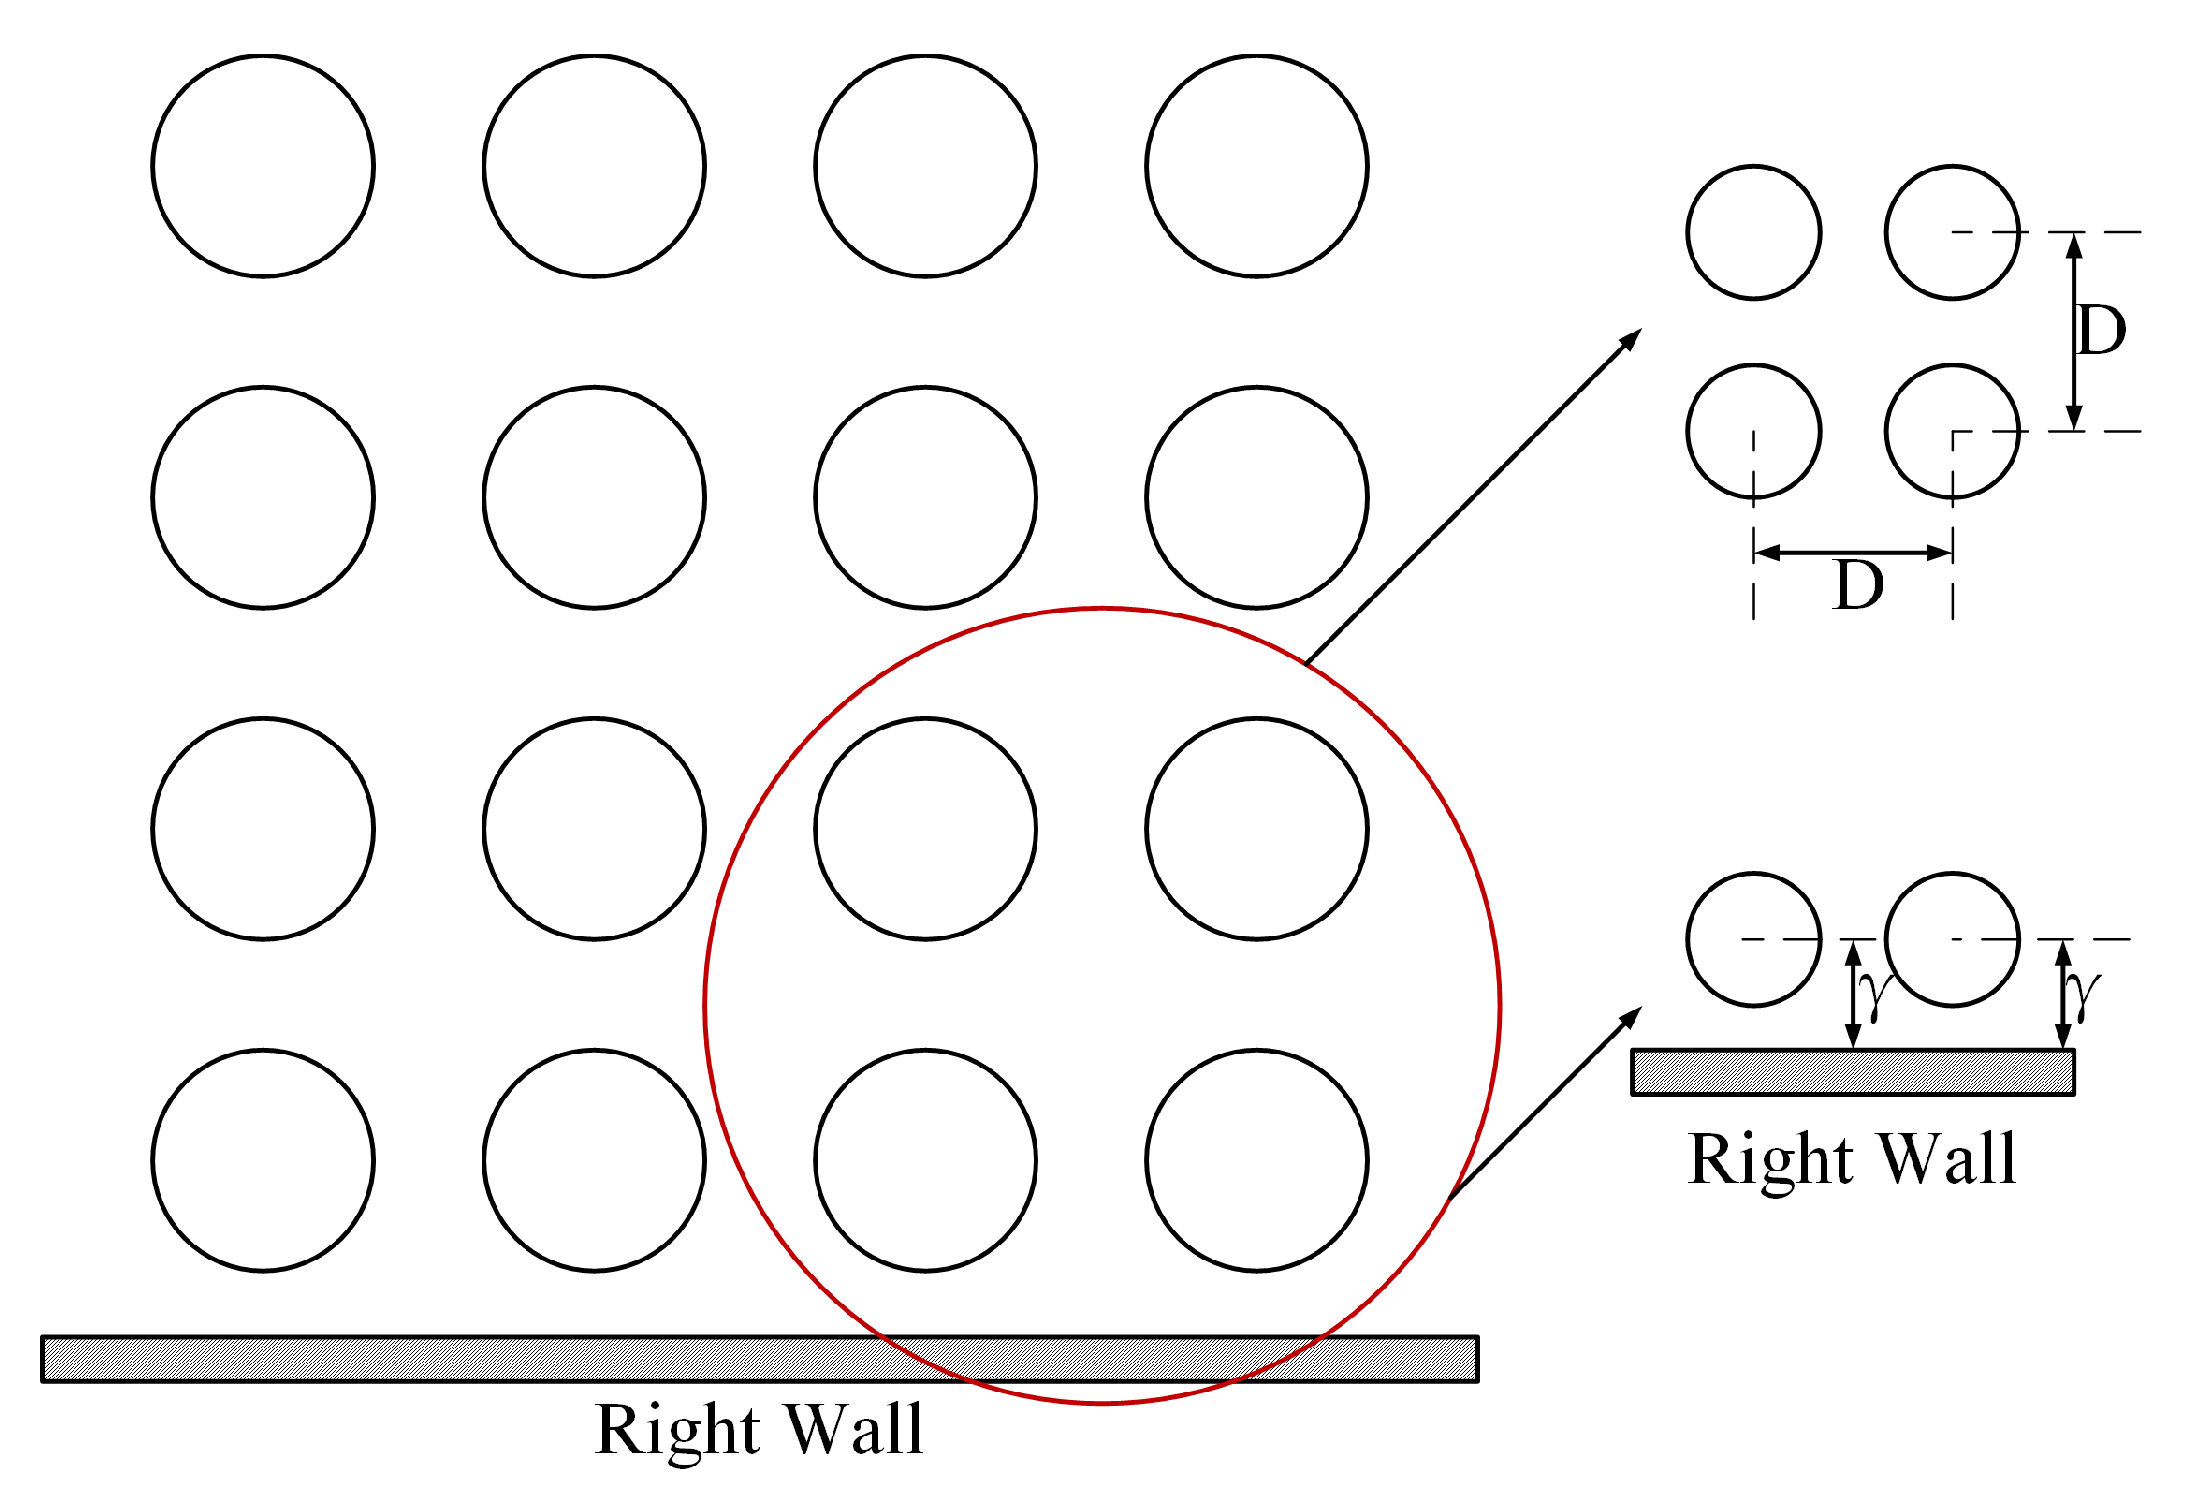
This section presents a detailed investigation into the collapse process of cubic and columnar bubble clusters, focusing on the flow field’s energy evolution during the bubble cluster collapse. Our study primarily involves a 64-bubble cubic bubble cluster and several columnar bubble clusters with varying heights. The stand-off distance, denoted as , between the bubble cluster and the wall, was maintained consistently at 1.5, while the dimensionless inter-bubble spacing, represented by D, persistently remained at 2.5.
As shown in Figure 3, the dimensionless distance, D, between adjacent bubbles is defined as the ratio of the inter-bubble spacing to the initial bubble radius. Similarly, the stand-off distance, , between the bubble and the wall is defined as the vertical distance from the bubble’s center to the wall, normalized by the initial bubble radius.
3.1. Cubic Bubble Cluster Collapse
Our previous investigations studied the collapse processes of cubic bubble clusters comprised of 8 and 27 bubbles, respectively. Notably, in the case of the 27-bubble cluster collapse, we observed a distinct layer-by-layer collapse phenomenon. As the complexity of inter-bubble interactions escalates with larger cluster sizes, verifying the reliability of the layer-by-layer collapse process becomes of paramount importance in larger-scale clusters. In pursuit of this, we simulated the 64-bubble cluster collapse process.
Table 1 and Table 2 outline the parameter settings and boundary conditions employed in the numerical simulation. These parameters will persist constantly throughout our study, allowing us to focus on bubble clusters of varying scales and shapes.
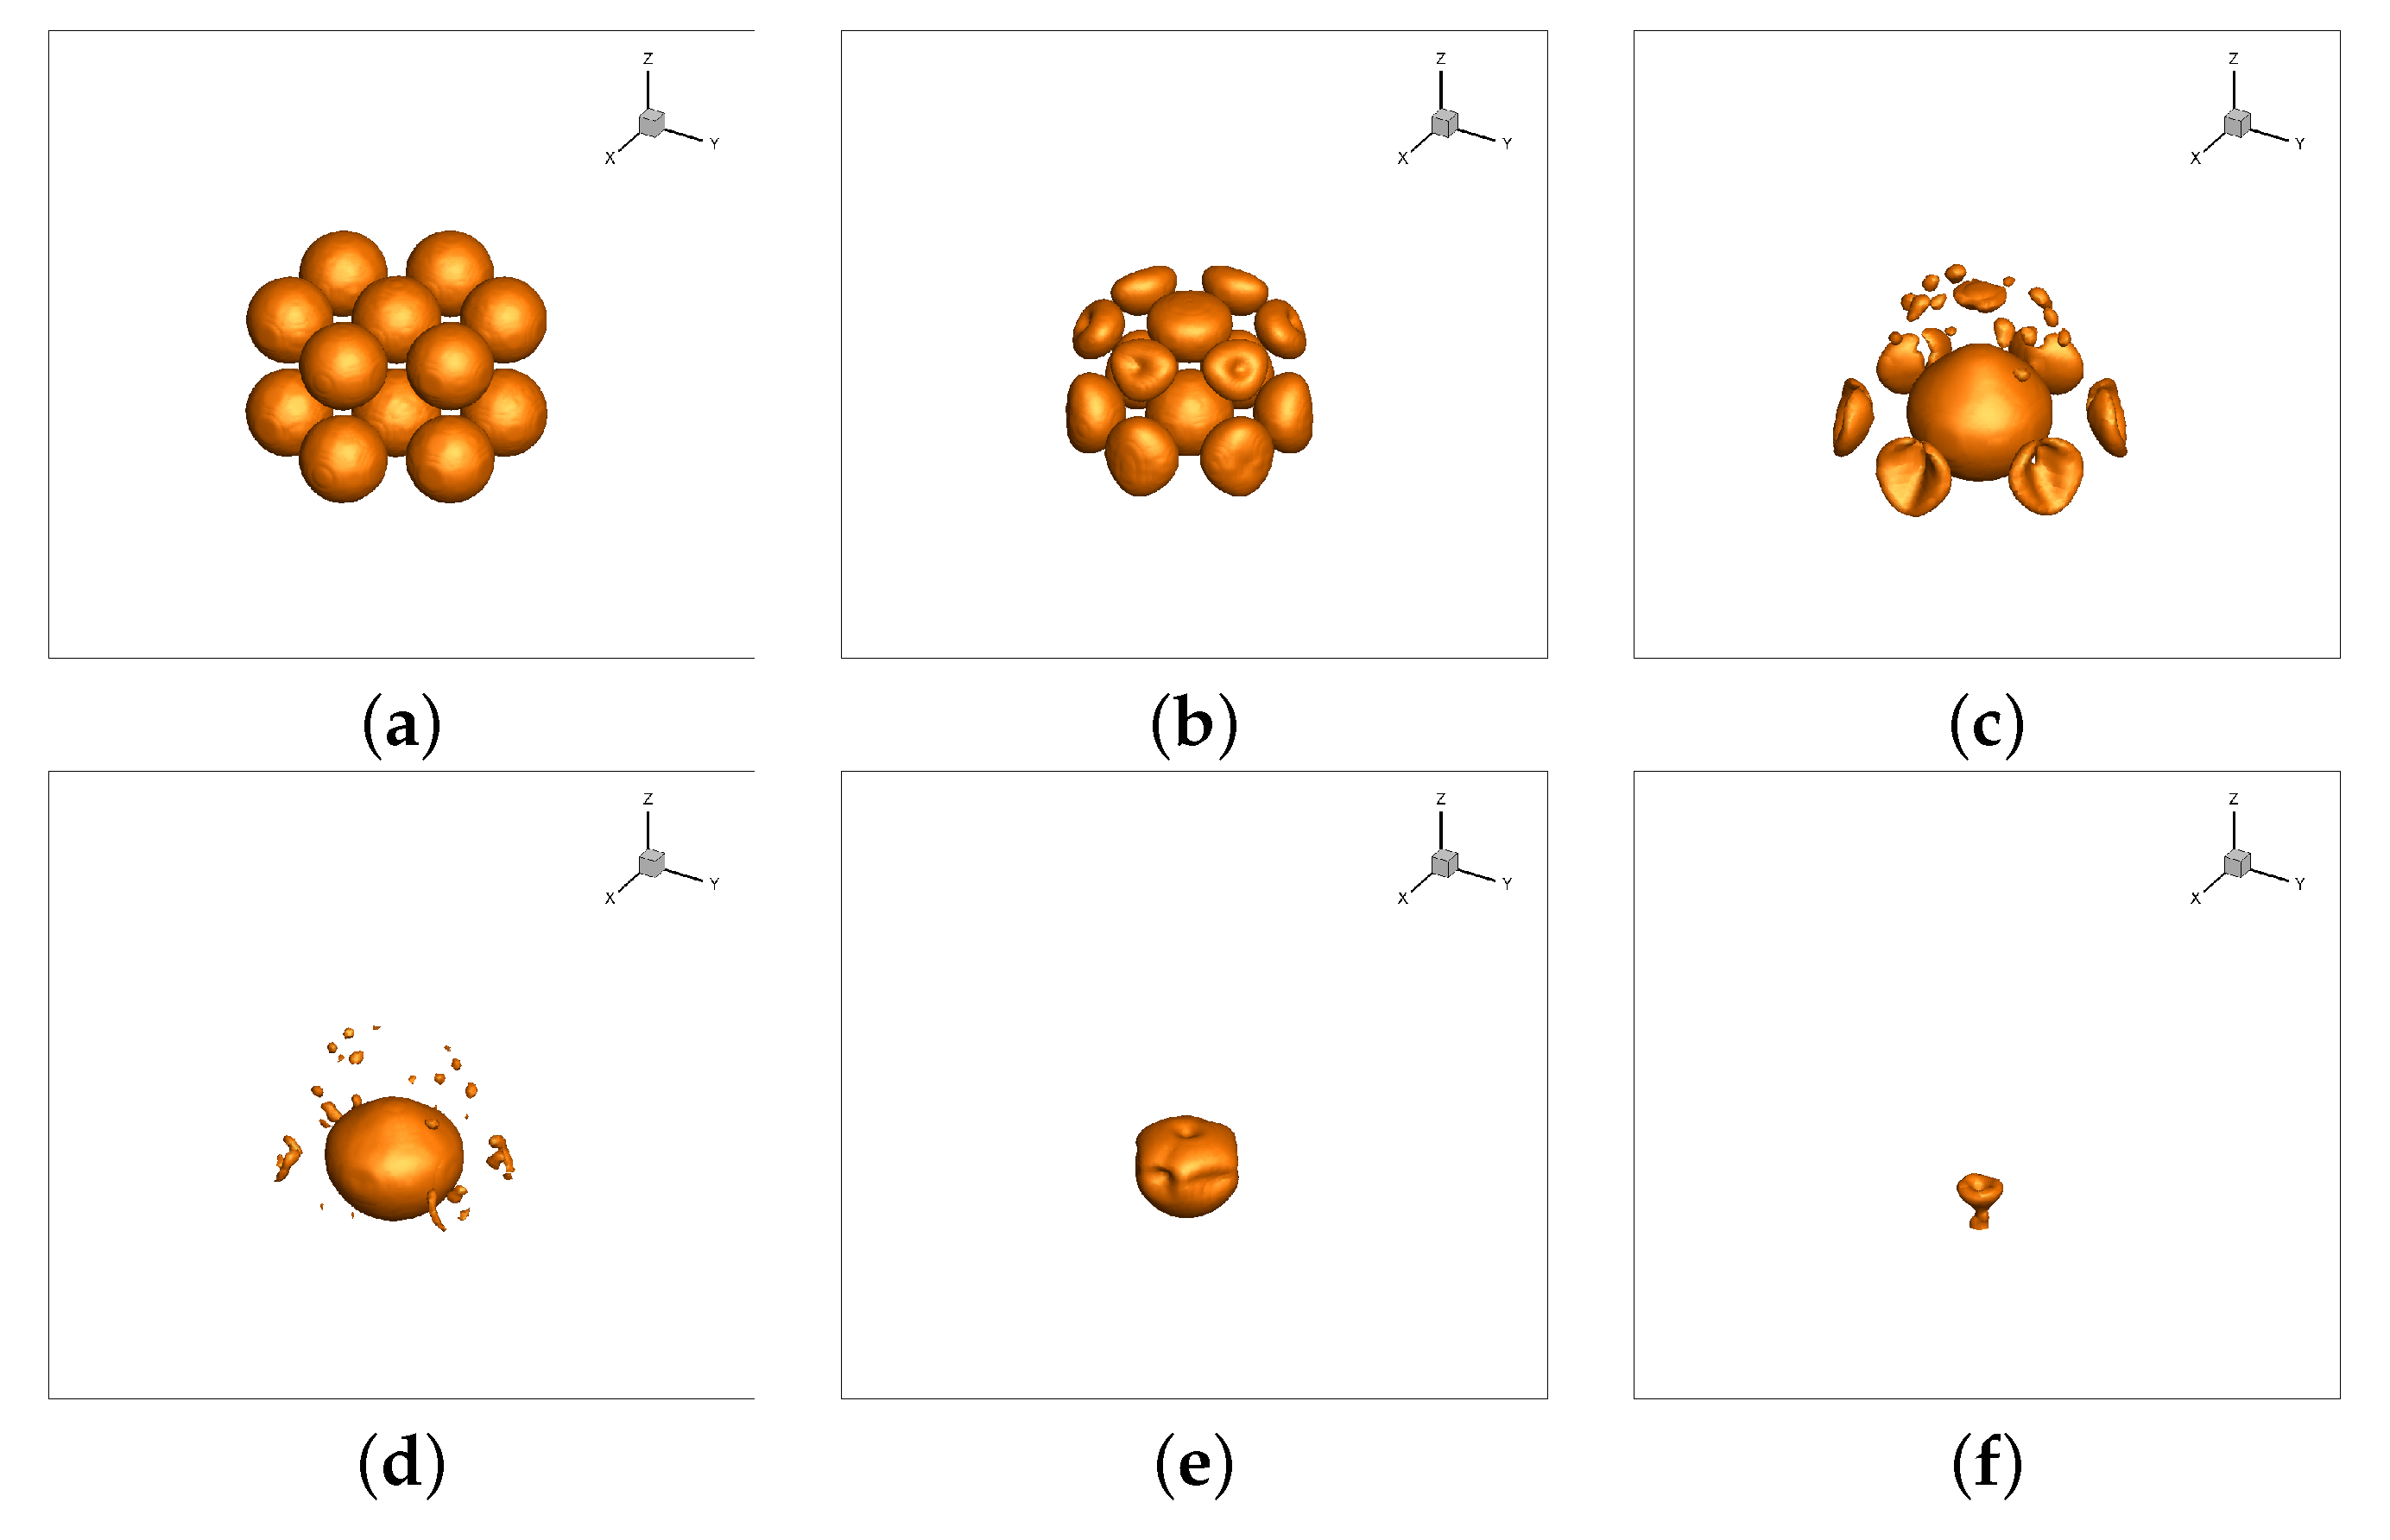
From Figure 4, it can be observed that the collapse process of the 64-bubble cluster also exhibited a significant shielding effect, where the inner layer bubbles maintained a stable shape until the outer layer bubbles completely collapsed. Consequently, once the outermost layer bubbles completely collapsed, the collapse process of the bubble cluster was similar to that of the eight bubble cluster [12]. In terms of the bubble cluster collapse time, the 64-bubble cluster initiated collapse at approximately 100 s, with the outermost layer bubbles completely collapsing around 650 s, and overall collapse took an estimated 768 s. The collapse rate within the 64-bubble cluster surpassed the initial rate within the 8-bubble cluster. This phenomenon is attributed to the partial energy release from the outer bubble collapse, which contributes to the collapse of the inner layer bubbles.
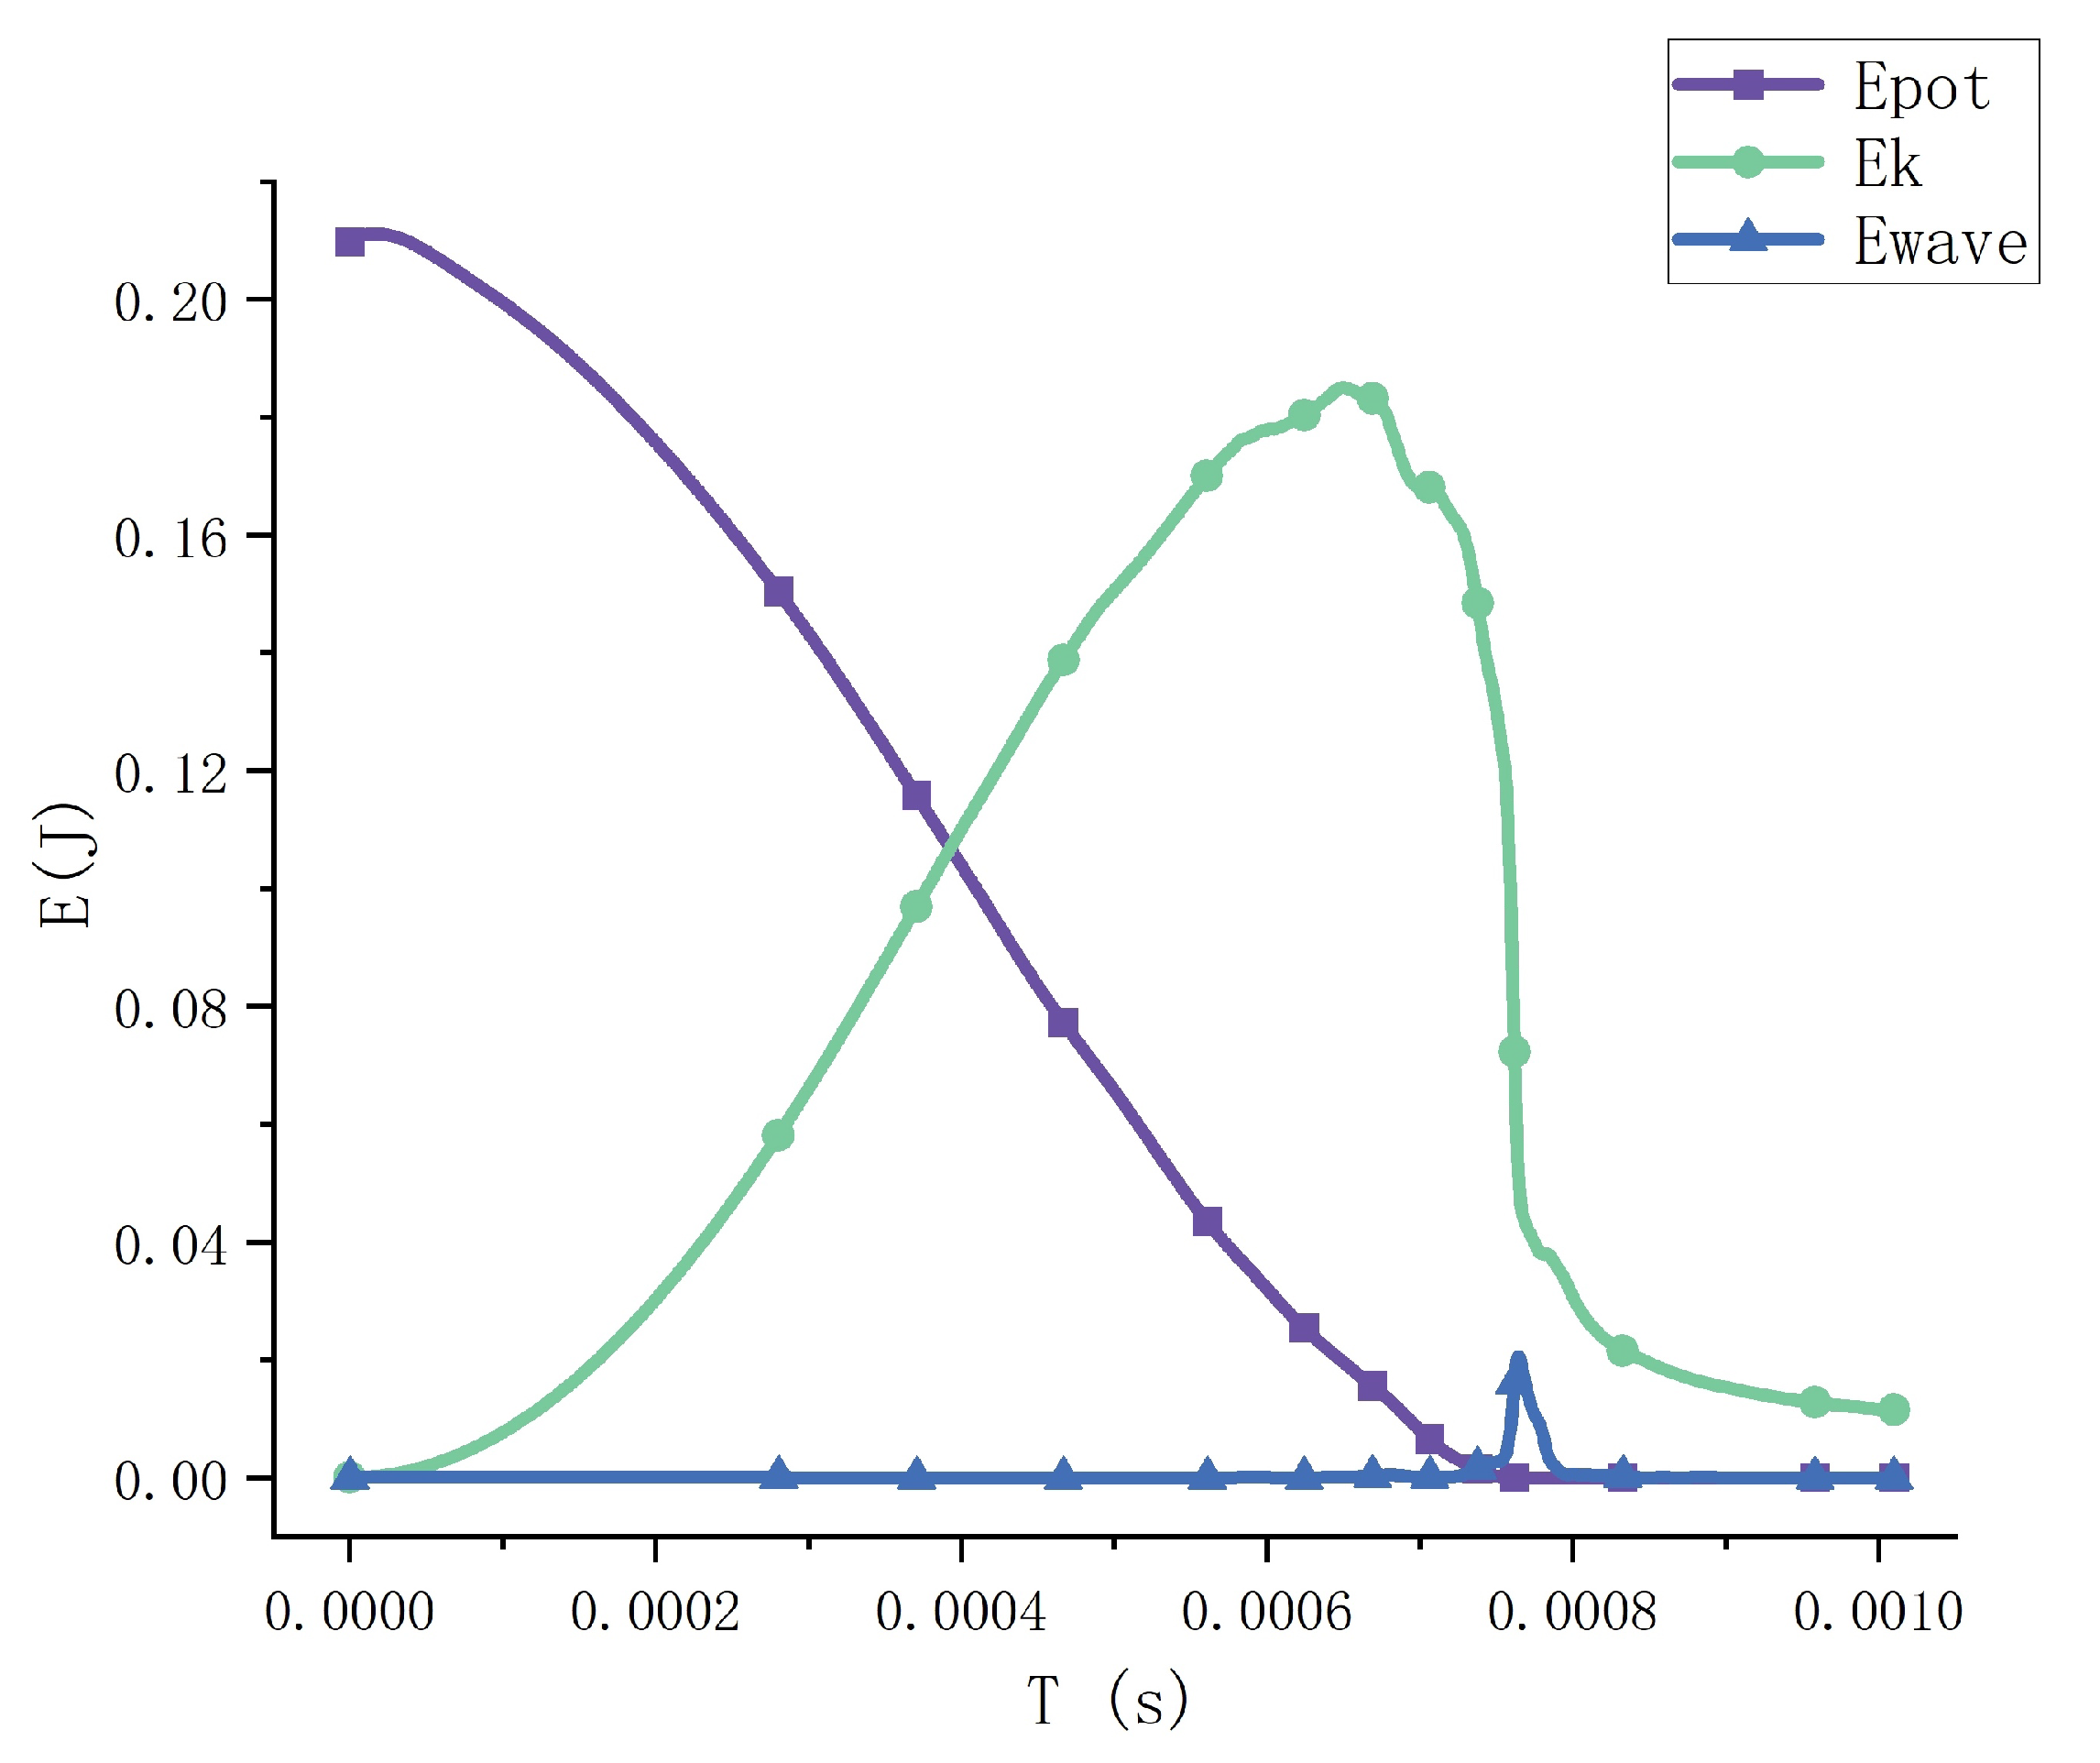
As shown in Figure 5, during the bubble cluster collapse process, the bubble potential energy is predominantly converted into flow kinetic energy, while in the final stage, a portion of the flow kinetic energy is transformed into pressure wave energy. Once the bubble cluster completely collapses, all forms of calculated energy dissipate. However, this energy conversion process is rather complex. The shock wave released by the collapse of the bubble group will emit sound waves during propagation, and there will be a specific pressure drop in the region where the wave has passed. However, the sound energy, fluid potential energy, latent heat of phase change, etc., are not the focus of this study, so we still consider them as dissipated energy temporarily.
Key observations drawn from this study provide a thorough understanding of the bubble cluster collapse process. Firstly, there is a small “step” in decreasing the flow kinetic energy toward the final stage of the bubble cluster collapse. This phenomenon can be attributed to the asymmetric collapse of the single bubble. Secondly, our primary research on the collapse of the 27-bubble cluster indicated that [11] following the complete collapse of bubbles in the outer layer, the bubble cluster finally collapsed as a single bubble. Additionally, the final collapse pattern of the 64-bubble cluster resembles our previous research on 8-bubble cluster collapse [12]. These contrasting bubble cluster types exhibit unique characteristics for pressure wave energy release. For instance, the 27-bubble cluster would display a concentrated release of a small portion of pressure wave energy when the bubbles at the geometrical center of the cluster collapse. However, compared with the 64-bubble cluster, the conversion rate of pressure wave energy to bubble potential energy discharged by the 27-bubble cluster at the cluster collapse’s terminal stage remained noticeably higher. We will elaborate upon this in the following text. Furthermore, the collapse patterns of all cubic bubble clusters in the final stages resembled those of the previously discussed 8-bubble and 27-bubble clusters. Nevertheless, the pattern of bubble cluster collapse in the final stage within actual engineering contexts remains unclear, inviting the necessity of corresponding experimental exploration to ascertain whether a bubble cluster, similar to the 64-bubble cluster, maintains potent symmetry throughout the totality of the collapse process; monitoring pressure waves could serve as a promising point of research initiation.
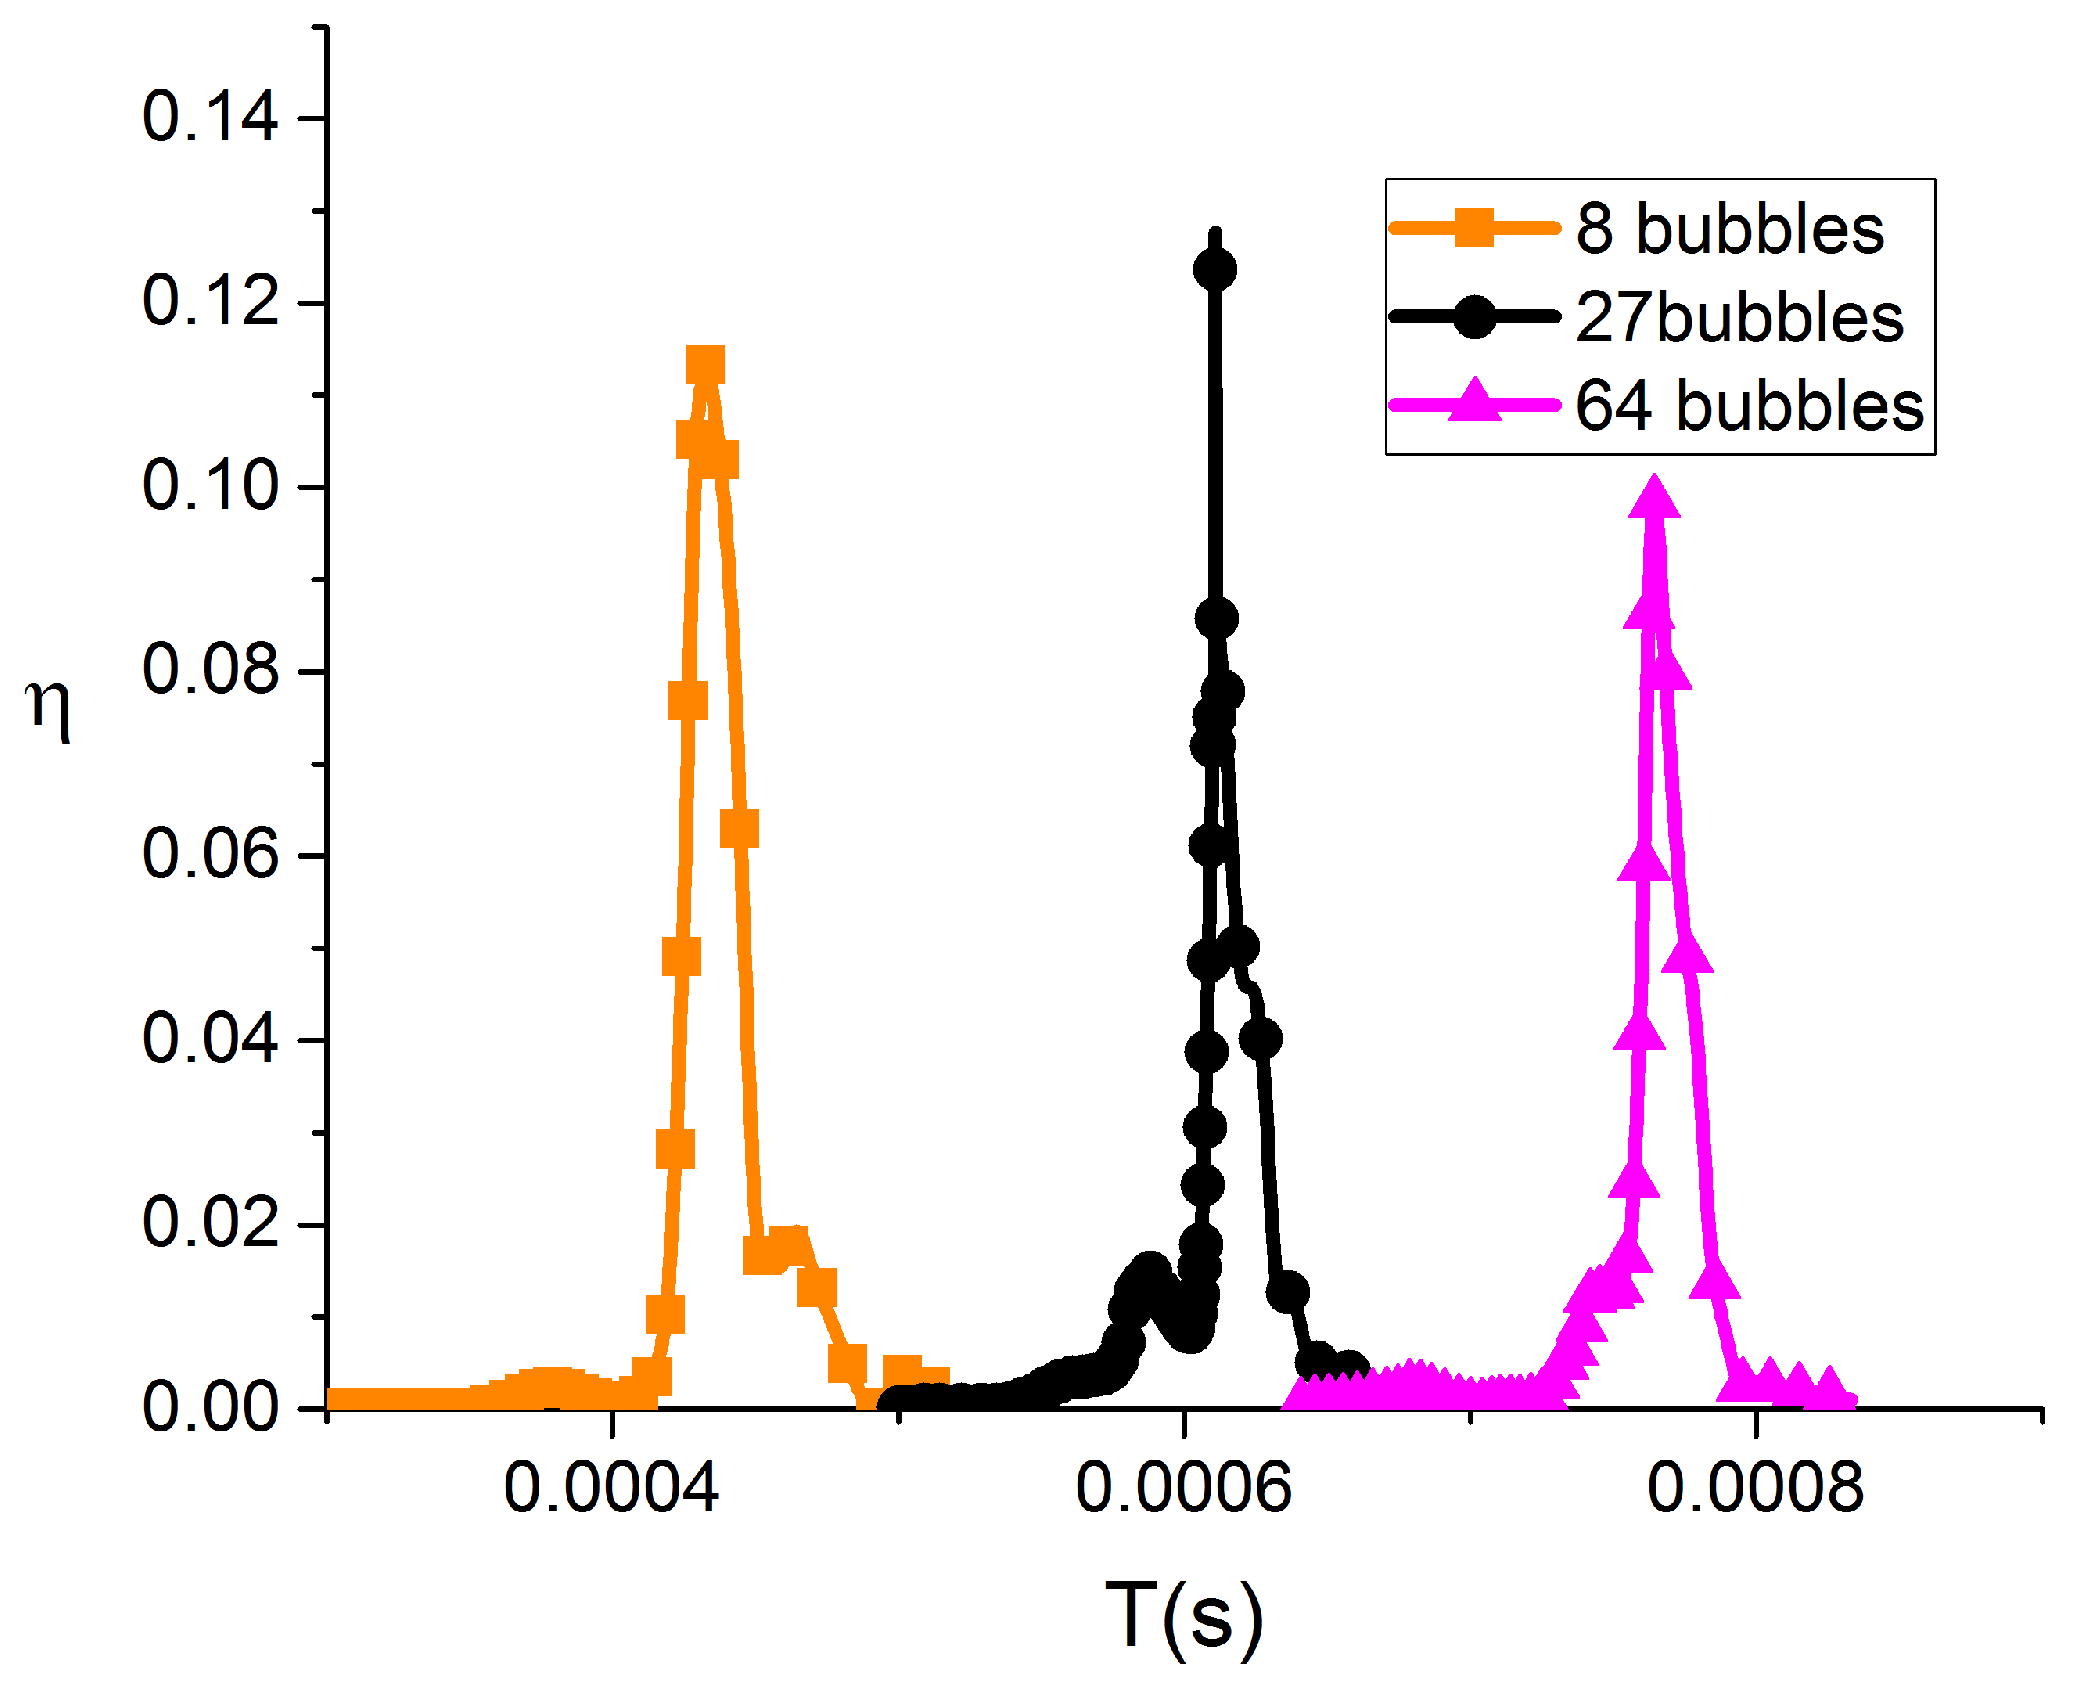
Figure 6 illustrates the collapse process of cubic bubble clusters with different sizes. Comparative analysis reveals that the energy conversion rate is approximately identical for all three different-sized cubic bubble clusters. When = 1.5 and D = 2.5, this value remains consistently around 10%. However, it is worth noting that there are minor differences in the energy conversion rate among the three bubble cluster sizes. We have made two inferences based on the energy evolution mechanism during the vapor bubble collapse. Firstly, for larger-scale bubble clusters, the kinetic energy released during the collapse of outer-layer bubbles tends to dissipate during propagation or have less involvement in the collapse of inner-layer bubbles. Hence, the peak conversion rate of pressure wave energy decreases. Secondly, if the bubble cluster finally collapses in the form of a single bubble, it contributes to generating a pressure wave, leading to a particular increase in the conversion rate . However, the impact of these factors on the conversion rate is limited, and more research is required to validate these inferences in the future.
In general, a cubic bubble collapse under near-wall conditions typically exhibits a layer-by-layer phenomenon, transitioning from the outer layer to the inner layer and from the far-wall layer to the near-wall layer. Cubic bubble clusters of all sizes ultimately display two distinct patterns after the complete collapse of the outer-layer bubbles. One pattern resembles the eight-bubble cluster that maintains strong symmetry throughout the collapse process. The other pattern, similar to the 27-bubble cluster, collapses as a single bubble during the final stage. Notably, the second pattern shows a higher transformation rate of the bubble’s potential energy into pressure wave energy than the first. However, the influence of this collapse pattern on the transformation rate is limited, and further research is required to investigate the existence of a bubble cluster analogous to the 8-bubble cluster, that preserves its extreme symmetry throughout the entire collapse process.
3.2. Columnar Bubble Cluster Collapse
In practice, cloud cavitation will manifest varying shapes based on different flow field conditions. In hydrofoil cavitation, the main form of cloud cavitation is the three-dimensional horseshoe cavitation structure in the hydrofoil’s downstream area, and the two “feet” of the horseshoe structure are located close to the wall. Moreover, the distance between the horizontal connection position of the top of the horseshoe is relatively far, which is generally more significant than the thickness of the reentry jet on the wall. Thus, the bubble cluster at the lower end can effectively cause impact, whose shape is similar to the cylinder. In order to study the possible phenomenon of cloud bubble collapse on the surface of the hydrofoil, the next section of the paper will simulate the collapse of columnar bubble clusters and analyze the energy conversion during the process.
The geometric arrangement of the columnar bubble cluster is shown in Figure 7. The columnar bubble cluster comprises several layers of multi-bubble structures, and the bubbles in each layer are composed of seven bubbles of equal radius arranged in a hexagon. The inter-bubble spacing D remained set at 2.5, and the stand-off distance remained set at 1.5. Then, we systematically investigated the collapse of columnar bubble clusters, which included two, three, and ten layers.
Figure 8 illustrates the collapse dynamics of a two-layer columnar bubble cluster at , with the bubble interface representing the isosurface of = 0.85. The initial collapse of the bubble cluster is directed toward the central axis of the wall, causing simultaneous deformation of the upper and lower bubble layers. Notably, the highest rate of collapse deformation is observed at the external periphery of the upper layer. Concurrently, bubbles on the exterior portion of the lower layer manifest horizontal inward depressions. From the initiation of the collapse until T = 400 s, the bubble cluster retains a hemispherical shape without any deformation or penetration. The collapse progressed into its final stage for T = 500–520 s, leaving only the central bubble in the flow field. The jet flow and pressure release resulting from the collapse of the external layer bubbles ensure varied degrees of depression on the side and top interfaces of the central bubble. The jet flow triggered by the upper layer penetrated in a downward direction, making contact with the solid wall surface. Examination of the overall bubble evolution hints at varying collapse rates for the outer layer bubbles due to differences in their relative positions within the cluster. When the external layer reached the collapse’s final stage, the robust interaction among the bubbles altered the collapse rate, leading to a nearly simultaneous complete collapse of the entire external layer. Further, due to this variation in the collapse rate, the overall shape of the bubble cluster transitions to a hemispherical formation. Ultimately, the bubble cluster collapses as a single bubble.
Figure 9 shows the contracting process of the three-layer bubble cluster at = , and the overall collapse takes approximately 581 s. Compared with the collapse process of the two-layer bubble cluster, the three-layer bubble cluster had a change in the general collapse time, but the overall collapse evolution was the same as the two-layer bubble cluster collapse, from the top to the wall layer by layer. The outer layer of bubbles shrunk horizontally inward and collapsed further, while the central bubbles of each layer collapsed downward after the completion of the outer layer collapse, and the induced jet penetrated the bubbles.
Figure 10 shows the collapse progress of a 10-layer bubble cluster at , and the overall bubble collapse took 676 s. The collapse progress appeared vertically from the top layer to the bottom layer. During the initial collapse step (T = 100–400 s), notable deformation was observed at the top of the cluster. The periphery and central bubbles in the top layer at T = 200–300 s collapsed vertically downwards, quickly producing depressions and further penetration. When T = 500 s, the bubble collapse in the vertical direction accelerated, and the bubble at the top shrunk inward while getting closer to the center. When T = 600–650 s, the peripheral bubbles collapsed entirely, the bubbles at the center collapsed downwards in the form of strings, and the puncture and fusion of the interface involved the four layers of bubbles on the top. Finally, at T = 650 s, the cluster effectively collapsed into a single-point slender air mass. Comparative observation of columnar bubbles at varying heights indicates the directional influence of the bubble height on the overall collapse. However, it can be observed that when adjacent bubbles cover both the upper and lower sides, the bubbles collapse solely in the horizontal direction. As the height increased, the side bubbles’ collapse time was consequentially delayed, from 500 s for two layers to 540 s for three layers and 600 s for ten layers; the height of the columnar bubble cluster can delay the collapse time non-linearly.
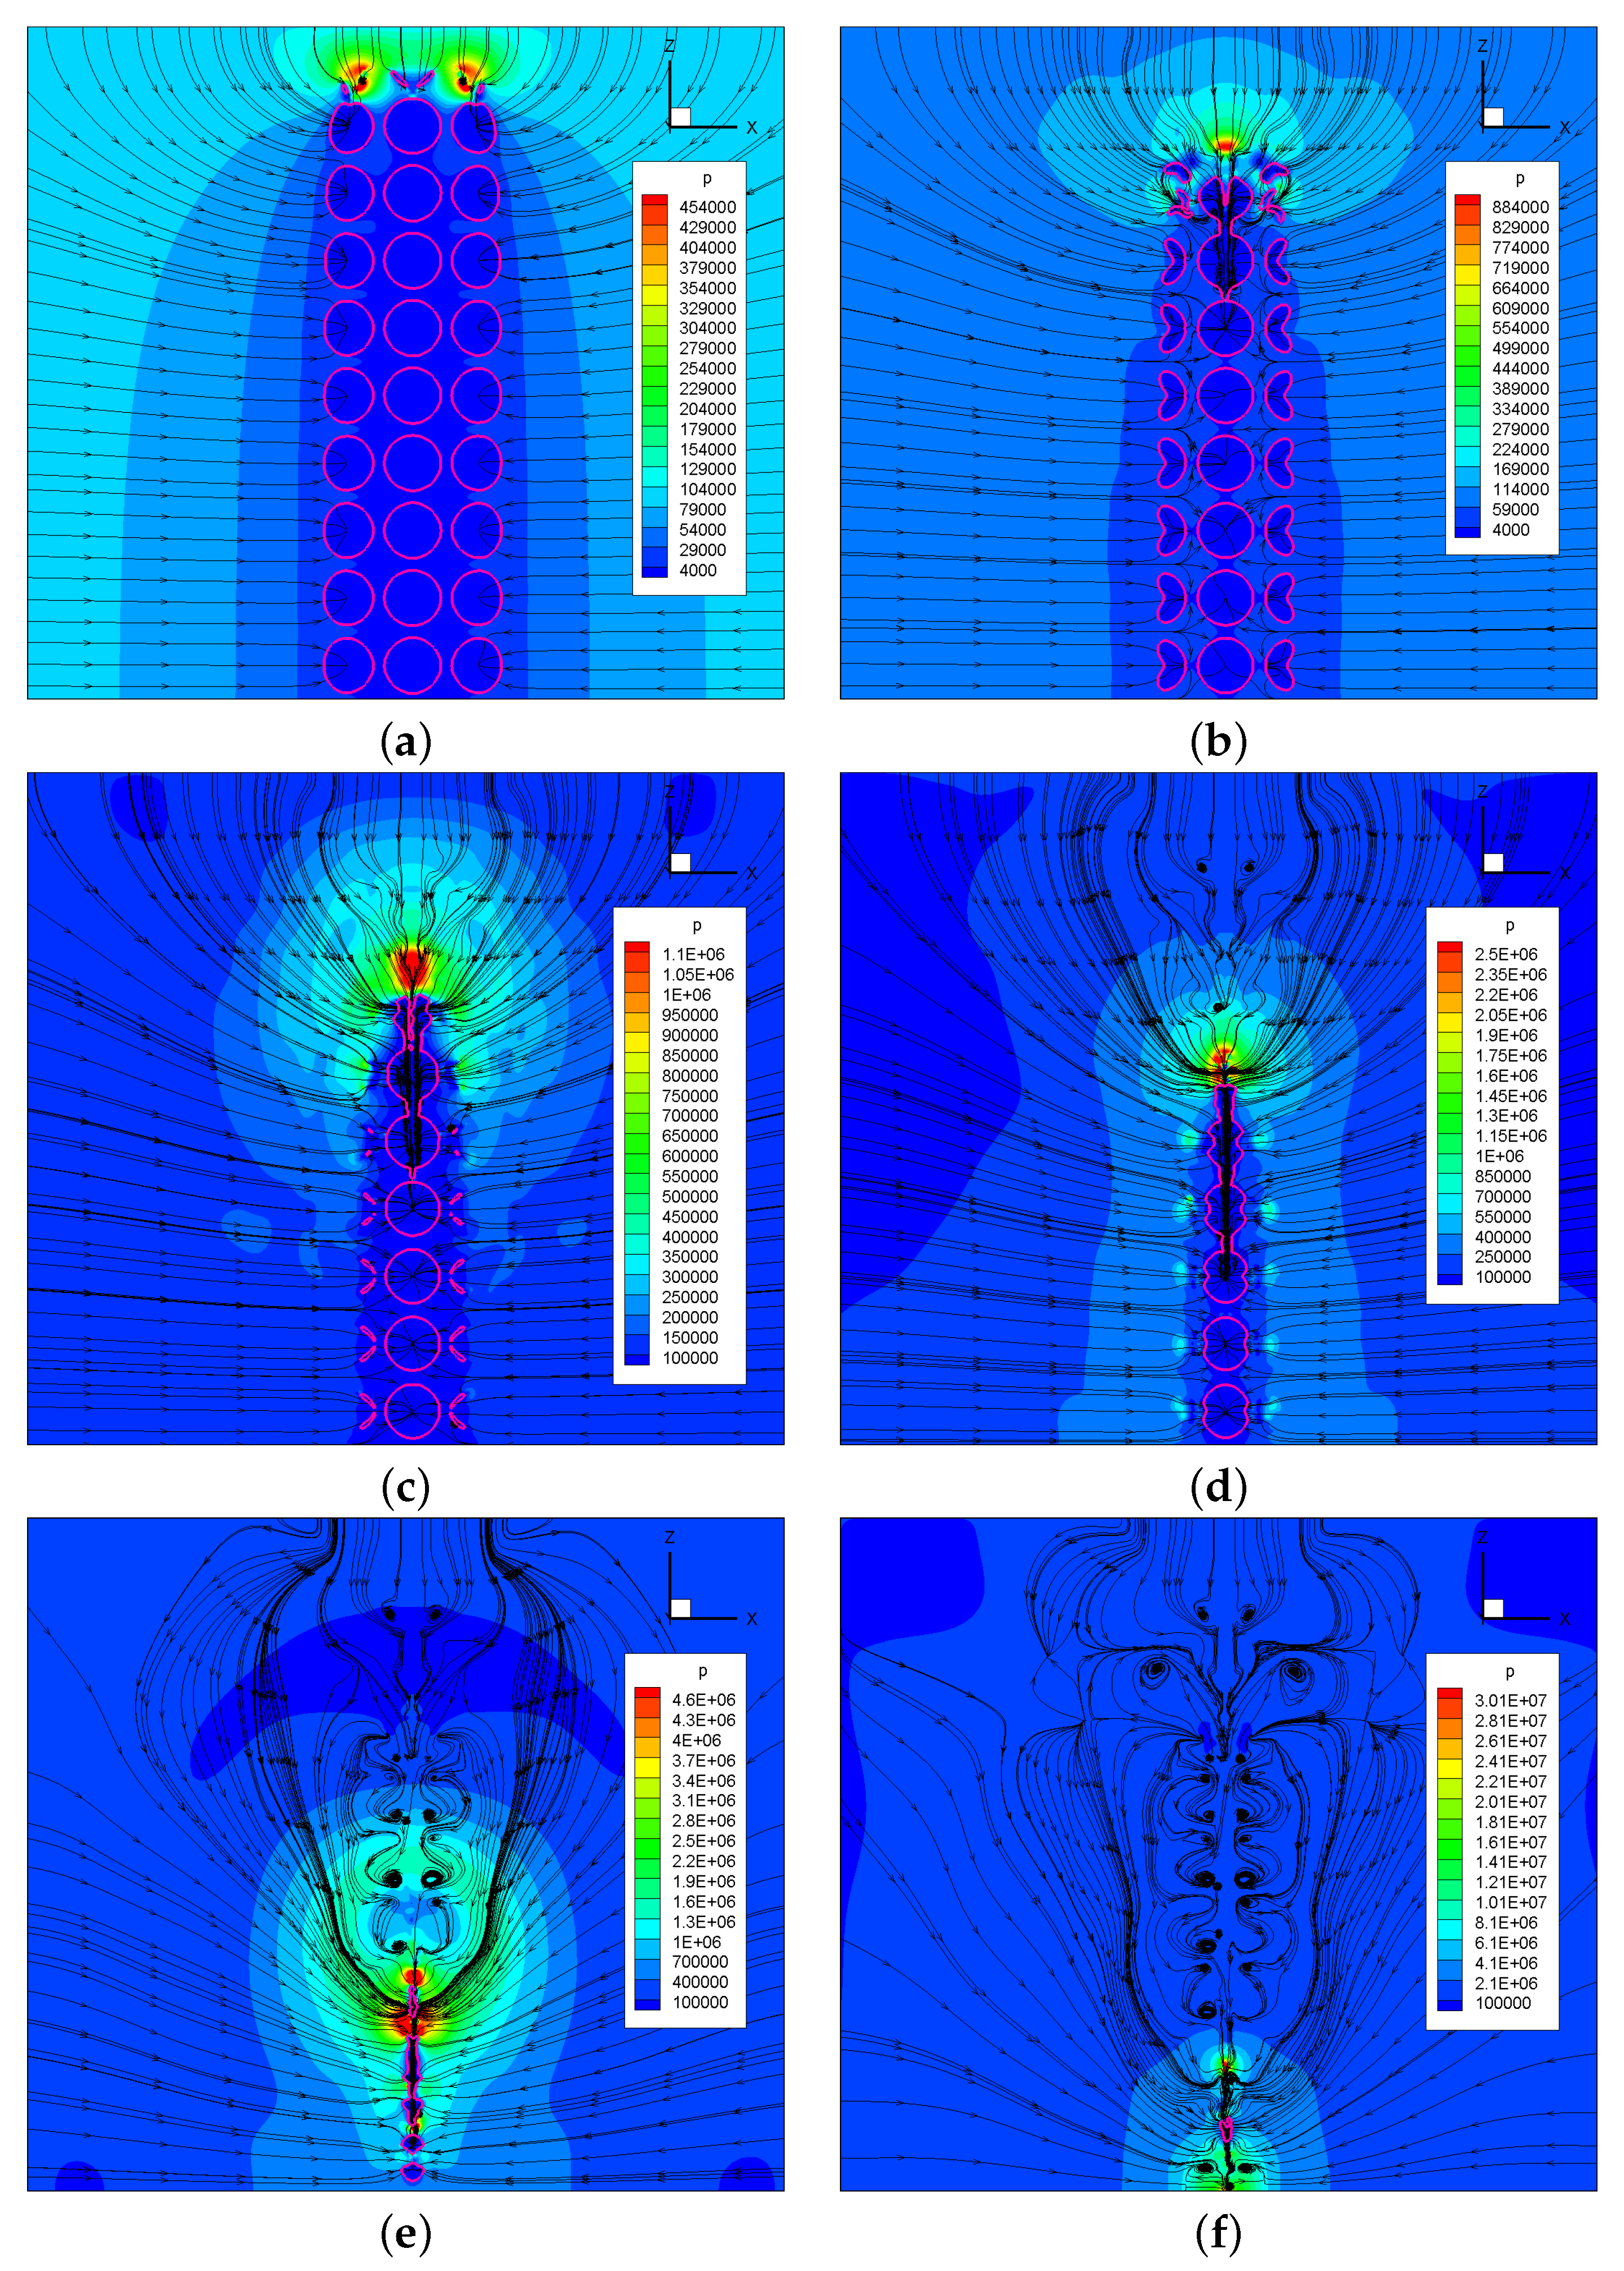
Figure 11 is the central section of the pressure contour and the streamline in the field during the 10-layer bubble collapse. It can be found that from the top of the bubble cluster, every outer layer of bubbles or the central bubble collapse will have an apparent pressure release, and the peak value of the released pressure will continue to rise until the overall bubble cluster completely collapses, ultimately reaching approximately 70 MPa. From T = 650 s (Figure 11e), the final collapse of the bubble cluster did not directly collapse from the top to the bottom; the central bottom bubbles collapsed first at the end of the collapse and finally, the central bubbles above the bottom bubble stayed in the flow field. This phenomenon shows that the continuous layer-by-layer collapse of the columnar bubble cluster has a breakpoint. Furthermore, the collapse time for a cubic bubble cluster consisting of 64 bubbles considerably exceeds that of a ten-layer columnar bubble cluster. Therefore, we can conclude that the total collapse time bears relevance to the horizontal collapse rate, particularly when the vertical scale vastly outmatches the horizontal one in a columnar bubble cluster collapse case.
Figure 12a depicts the evolution of the pressure wave energy conversion rate for columnar bubble clusters of varying heights. As the size of the bubble cluster expands and its height increases, the energy conversion rate shows a marginal decline but consistently hovers at around 10%. Particularly, the of the ten-layer columnar bubble cluster was the lowest at 9.8%. This observation affirms the hypothesis that an expanded bubble cluster scale only incurs a minor reduction in . As the scale of the bubble cluster expands, the kinetic energy released during the outer bubble layers’ collapse dissipates more and contributes less towards the inner bubble collapse, resulting in a reduced pressure wave energy conversion rate . As illustrated in Figure 12b, the for the collapse of a three-layer columnar bubble cluster comprising 21 bubbles is on par with that of the cubic bubble cluster encompassing 27 bubbles. This suggests that the shape of the bubble cluster does not influence the pressure wave energy conversion rate. In contrast, the collapse of a two-layer columnar bubble cluster with 14 bubbles substantially increased compared to the 8-bubble cubic cluster. This confirms our inference that if the bubble cluster’s final collapse stage occurs as a single bubble, it will significantly benefit the release of the pressure wave energy. Furthermore, considering the practical limitations of encountering highly asymmetric and immense columnar bubble cluster structures, the investigated seven-layer bubble cluster with 70 bubbles already represents a rather extreme case. Hence, regardless of variations in the bubble cluster’s shape or scale, when and , the conversion rate of bubble potential energy to pressure wave energy consistently remained within 9% to 15%.
To summarize the above, the collapse of columnar bubble clusters also presents a layer-by-layer collapse phenomenon from the outer layer to the inner layer and from the far-wall layer to the near-wall layer. With the increase in the height of the columnar bubble clusters, the collapse time will grow non-linearly; at the same time, the collapse speed of the bubbles on the far-wall layer will also accelerate. Pertaining to the conversion rate of bubble potential energy to pressure wave energy, through the study of columnar bubble clusters and in combination with the research on cubic bubble clusters, we can preliminarily conclude that both the scale of the bubble cluster and the end-collapse pattern of the bubble cluster collapse will have a limited impact on the conversion rate. Among them, under smaller bubble cluster scales, or when the bubble cluster finally collapses as a single bubble, it will correspond to a higher pressure wave energy conversion rate. Nonetheless, further research is still required to ascertain the contributions of these two factors, along with stand-off distance, inter-bubble spacing, etc., to the conversion rate.
4. Conclusions
This paper simulated the collapse process of the cubic bubble cluster and the columnar bubble cluster in near-wall conditions. The results confirm the shielding effect of the outer-layer bubbles on the inner layer and the shielding effect of the distant-wall bubbles on the near-wall bubbles. The inner-layer and near-wall bubbles maintain a relatively stable shape until the out-layer and distinct-wall bubbles have completely collapsed. The bubble cluster undergoes layer-by-layer collapse progress from the outer layer to the inner layer and from the distinct wall to the near wall. In the case of the columnar bubble clusters, the collapse time increases nonlinearly with the height of the bubble cluster.
An energy analysis approach was used to investigate the energy release process during bubble collapse, specifically focusing on the conversion rate of bubble potential energy to pressure wave energy. Three preliminary inferences have been drawn: (1) The shape of bubble clusters does not affect the conversion rate when the collapse process is similar among different bubble clusters. (2) When bubble clusters of similar scale and structure collapse in the form of a single bubble during the final stages of the bubble cluster collapse, it facilitates the release of pressure wave energy, resulting in a higher conversion rate . (3) Bubble clusters with the same shape and structure experience a limited reduction in the conversion rate as the cluster scale increases. Besides, it is concluded that for the = 1.5 and D = 2.5, the pressure wave energy conversion rates with various scales and shapes range from 9% to 15%. These findings provide valuable data support for predicting the cavitation impact of bubble cluster collapse and demonstrate the feasibility of predicting the energy release from the bubble cluster collapse by capturing the stand-off distance, maximum bubble size, and bubble cluster shape.
To summarize the above, the collapse of columnar bubble clusters also presents a layer-by-layer collapse phenomenon from the outer layer to the inner layer and from the far-wall layer to the near-wall layer. With the increase in the height of the columnar bubble clusters, the collapse time will grow non-linearly; at the same time, the collapse speed of the bubbles on the far-wall layer will also accelerate. Pertaining to the conversion rate of bubble potential energy to pressure wave energy, through the study of columnar bubble clusters and in combination with the research on cubic bubble clusters, we can preliminarily conclude that both the scale of the bubble cluster and the end-collapse pattern of the bubble cluster collapse will have a limited impact on the conversion rate. Among them, under more minor bubble cluster scales, or when the bubble cluster finally collapses as a single bubble, it will correspond to a higher pressure wave energy conversion rate. Nonetheless, further research is still required to ascertain the contributions of these two factors, along with stand-off distance and inter-bubble spacing, etc., to the conversion rate.
Author Contributions
Conceptualization, J.Y. and J.Z.; methodology, J.Y., J.Z., and T.H.; software, J.Y. and J.Z.; validation, J.Y. and J.Z.; investigation, J.Y., J.Z., and T.H.; resources, J.Z.; writing—original draft preparation, J.Y. and J.Z.; writing—review and editing, J.Y.; supervision, J.Z; project administration, J.Y. and J.Z.; funding acquisition, J.Z. All authors have read and agreed to the published version of the manuscript.
Funding
This research was funded by Zhejiang provincial natural science foundation (LQ21A020006).
Data Availability Statement
Not applicable.
Conflicts of Interest
The authors declare no conflict of interest.
Abbreviations
The following abbreviations are used in this manuscript:
| VOF | Volume of Fluid |
| FVM | Finite Volume Method |
| PISO | Pressure-Implicit with Splitting of Operators |
References
- Arndt, R.E. Cavitation in fluid machinery and hydraulic structures. Annu. Rev. Fluid Mech. 1981, 13, 273–326. [Google Scholar] [CrossRef]
- Sreedhar, B.; Albert, S.; Pandit, A. Cavitation damage: Theory and measurements—A review. Wear 2017, 372, 177–196. [Google Scholar] [CrossRef]
- Ye, J.; Zhang, J.; Wang, Y.; Zhao, P. A Numerical Investigation of Supercavitation Vehicle’s Hydrodynamic Noise. J. Mar. Sci. Eng. 2023, 11, 1004. [Google Scholar] [CrossRef]
- Mitragotri, S. Healing sound: The use of ultrasound in drug delivery and other therapeutic applications. Nat. Rev. Drug Discov. 2005, 4, 255–260. [Google Scholar] [CrossRef]
- Tong, S.; Wang, Y.; Zhao, P.; Tao, J.; Guo, X.; Yu, Y. The Power Setting of Focused Ultrasound for the Palliative Treatment of Advanced Pancreatic Cancer: A Study in an Ex Vivo Bovine Liver. Appl. Sci. 2022, 13, 474. [Google Scholar] [CrossRef]
- Ghahramani, E.; Arabnejad, M.H.; Bensow, R.E. A comparative study between numerical methods in simulation of cavitating bubbles. Int. J. Multiph. Flow 2019, 111, 339–359. [Google Scholar] [CrossRef]
- Chahine, G.L. Strong interactions bubble/bubble and bubble/flow. In Proceedings of the Bubble Dynamics and Interface Phenomena: Proceedings of an IUTAM Symposium Held, Birmingham, UK, 6–9 September 1993; Springer: Berlin/Heidelberg, Germany, 1994; pp. 195–206. [Google Scholar]
- Tiwari, A.; Freund, J.B.; Pantano, C. A diffuse interface model with immiscibility preservation. J. Comput. Phys. 2013, 252, 290–309. [Google Scholar] [CrossRef] [Green Version]
- Bui, T.T.; Ong, E.T.; Khoo, B.C.; Klaseboer, E.; Hung, K.C. A fast algorithm for modeling multiple bubbles dynamics. J. Comput. Phys. 2006, 216, 430–453. [Google Scholar] [CrossRef]
- Jian, W.; Petkovšek, M.; Houlin, L.; Širok, B.; Dular, M. Combined numerical and experimental investigation of the cavitation erosion process. J. Fluids Eng. 2015, 137, 051302. [Google Scholar] [CrossRef] [Green Version]
- Zhang, L.; Zhang, J.; Deng, J. Numerical investigation on the collapse of a bubble cluster near a solid wall. Phys. Rev. E 2019, 99, 043108. [Google Scholar] [CrossRef]
- Zhang, J.; Zhang, L.; Deng, J. Numerical study of the collapse of multiple bubbles and the energy conversion during bubble collapse. Water 2019, 11, 247. [Google Scholar] [CrossRef] [Green Version]
- Hammitt, F.G. Observations on cavitation damage in a flowing system. J. Basic Eng. 1963, 85, 347–356. [Google Scholar] [CrossRef]
- Cole, R.H.; Weller, R. Underwater explosions. Phys. Today 1948, 1, 35. [Google Scholar] [CrossRef]
- Vogel, A.; Lauterborn, W. Acoustic transient generation by laser-produced cavitation bubbles near solid boundaries. J. Acoust. Soc. Am. 1988, 84, 719–731. [Google Scholar] [CrossRef]
- Fortes Patella, R.; Reboud, J.L. A new approach to evaluate the cavitation erosion power. J. Fluids Eng. 1998, 120, 335–344. [Google Scholar] [CrossRef]
- Alloncle, A.; Dufresne, D.; Autric, M. Visualisation of laser-induced vapor bubbles and pressure waves. In Proceedings of the Bubble Dynamics and Interface Phenomena, Birmingham, UK, 6–9 September 1993; Springer: Dordrecht, The Netherlands, 1994; pp. 365–371. [Google Scholar]
- Kato, H.; Konno, A.; Maeda, M.; Yamaguchi, H. Possibility of quantitative prediction of cavitation erosion without model test. J. Fluids Eng. 1996, 118, 582–588. [Google Scholar] [CrossRef]
- Fortes-Patella, R.; Challier, G.; Reboud, J.L.; Archer, A. Energy balance in cavitation erosion: From bubble collapse to indentation of material surface. J. Fluids Eng. 2013, 135, 011303. [Google Scholar] [CrossRef]
- Keller, J.B.; Kolodner, I.I. Damping of underwater explosion bubble oscillations. J. Appl. Phys. 1956, 27, 1152–1161. [Google Scholar] [CrossRef]
- Dymond, J.; Malhotra, R. The Tait equation: 100 years on. Int. J. Thermophys. 1988, 9, 941–951. [Google Scholar] [CrossRef]
- Reboud, J.L.; Guelin, P. Impact response of an elastoplastic medium. Mech. Res. Commun. 1988, 15, 253–260. [Google Scholar] [CrossRef]
- Melissaris, T.; Bulten, N.; van Terwisga, T.J. On the applicability of cavitation erosion risk models with a URANS solver. J. Fluids Eng. 2019, 141. [Google Scholar] [CrossRef] [Green Version]
- Schenke, S.; Melissaris, T.; Van Terwisga, T. On the relevance of kinematics for cavitation implosion loads. Phys. Fluids 2019, 31, 052102. [Google Scholar] [CrossRef] [Green Version]
- Leclercq, C.; Archer, A.; Fortes-Patella, R.; Cerru, F. Numerical cavitation intensity on a hydrofoil for 3D homogeneous unsteady viscous flows. Int. J. Fluid Mach. Syst. 2017, 10, 254–263. [Google Scholar] [CrossRef]
- Schenke, S.; van Terwisga, T.J. An energy conservative method to predict the erosive aggressiveness of collapsing cavitating structures and cavitating flows from numerical simulations. Int. J. Multiph. Flow 2019, 111, 200–218. [Google Scholar] [CrossRef] [Green Version]
Figure 1.
Radium variation of bubble collapse under the far-field condition.

Figure 2.
Bubble collapse time under different stand-off distance conditions.

Figure 3.
Geometrical description for the bubble cluster.

Figure 4.
Deformation of 64 bubbles collapse when D = , = . (a) T = 100 s. (b) T = 300 s. (c) T = 400 s. (d) T = 500 s. (e) T = 600 s. (f) T = 700 s.
Figure 4.
Deformation of 64 bubbles collapse when D = , = . (a) T = 100 s. (b) T = 300 s. (c) T = 400 s. (d) T = 500 s. (e) T = 600 s. (f) T = 700 s.

Figure 5.
Energy evolution processfor the bubble cluster.

Figure 6.
Conversion rate of the bubble potential energy to the pressure wave energy in the different cluster sizes (8 bubbles [12], 27 bubbles [11], 64 bubbles).

Figure 7.
Geometry setup of columnar bubble cluster.

Figure 8.
Collapse evolution of 2-layer (14 bubbles) columnar bubble cluster. (a) T = 100 s. (b) T = 320 s. (c) T = 460 s. (d) T = 480 s. (e) T = 500 s. (f) T = 520 s.
Figure 8.
Collapse evolution of 2-layer (14 bubbles) columnar bubble cluster. (a) T = 100 s. (b) T = 320 s. (c) T = 460 s. (d) T = 480 s. (e) T = 500 s. (f) T = 520 s.

Figure 9.
Collapse evolution of 3-layer (21 bubbles) columnar bubble cluster. (a) T = 100 s. (b) T = 300 s. (c) T = 350 s. (d) T = 450 s. (e) T = 500 s. (f) T = 550 s.
Figure 9.
Collapse evolution of 3-layer (21 bubbles) columnar bubble cluster. (a) T = 100 s. (b) T = 300 s. (c) T = 350 s. (d) T = 450 s. (e) T = 500 s. (f) T = 550 s.

Figure 10.
Evolution of 10-layer (70 bubbles) columnar bubble cluster.(a) T = 100 s. (b) T = 200 s. (c) T = 250 s. (d) T = 350 s. (e) T = 400 s. (f) T = 450 s. (g) T = 500 s. (h) T = 600 s. (i) T = 650 s.
Figure 10.
Evolution of 10-layer (70 bubbles) columnar bubble cluster.(a) T = 100 s. (b) T = 200 s. (c) T = 250 s. (d) T = 350 s. (e) T = 400 s. (f) T = 450 s. (g) T = 500 s. (h) T = 600 s. (i) T = 650 s.

Figure 11.
Central section of the pressure contour and the streamline in the field during the 10-layer (70 bubbles) columnar bubble cluster collapse. (a) T = 250 s. (b) T = 450 s. (c) T = 550 s. (d) T = 600 s. (e) T = 640 s. (f) T = 650 s.
Figure 11.
Central section of the pressure contour and the streamline in the field during the 10-layer (70 bubbles) columnar bubble cluster collapse. (a) T = 250 s. (b) T = 450 s. (c) T = 550 s. (d) T = 600 s. (e) T = 640 s. (f) T = 650 s.

Figure 12.
Time distribution of the energy conversion rate from bubble potential energy to pressure wave energy. (a) columnar bubble cluster; (b) columnar bubble cluster and cubic bubble cluster.
Figure 12.
Time distribution of the energy conversion rate from bubble potential energy to pressure wave energy. (a) columnar bubble cluster; (b) columnar bubble cluster and cubic bubble cluster.


Table 1.
Flow Field Parameter Settings.
| Initial bubble radius () | Initial bubble pressure () | Background pressure () |
| 0.002 mm | 3540 Pa | 101,325 Pa |
| The number of bubbles | Stand-off distance () | Inter-Bubble spacing (D) |
| 64 | 1.5 | 2.5 |
Table 2.
Boundary Conditions Settings.
| Every Field Components | Computational Domain Boundary | Right Wall Boundary |
|---|---|---|
| Alpha.water field | Zerogradient | fixedValue |
| Velocity field | Zerogradient | noSlip |
| Pressure field | non-reflective | zerogradient |
Disclaimer/Publisher’s Note: The statements, opinions and data contained in all publications are solely those of the individual author(s) and contributor(s) and not of MDPI and/or the editor(s). MDPI and/or the editor(s) disclaim responsibility for any injury to people or property resulting from any ideas, methods, instructions or products referred to in the content. |
© 2023 by the authors. Licensee MDPI, Basel, Switzerland. This article is an open access article distributed under the terms and conditions of the Creative Commons Attribution (CC BY) license (https://creativecommons.org/licenses/by/4.0/).
Share and Cite
MDPI and ACS Style
Ye, J.; Zhang, J.; Huang, T. Direct Numerical Simulation of Bubble Cluster Collapse: Shape Evolution and Energy Transfer Mechanisms. Processes 2023, 11, 2191. https://0-doi-org.brum.beds.ac.uk/10.3390/pr11072191
AMA Style
Ye J, Zhang J, Huang T. Direct Numerical Simulation of Bubble Cluster Collapse: Shape Evolution and Energy Transfer Mechanisms. Processes. 2023; 11(7):2191. https://0-doi-org.brum.beds.ac.uk/10.3390/pr11072191
Chicago/Turabian StyleYe, Jiacheng, Jing Zhang, and Tianyang Huang. 2023. "Direct Numerical Simulation of Bubble Cluster Collapse: Shape Evolution and Energy Transfer Mechanisms" Processes 11, no. 7: 2191. https://0-doi-org.brum.beds.ac.uk/10.3390/pr11072191
Note that from the first issue of 2016, this journal uses article numbers instead of page numbers. See further details here.