
Prediction Model of the Remaining Useful Life of the Drill Bit during Micro-Drilling of the Packaging Substrate

1
State Key Laboratory of Radio Frequency Heterogeneous Integration, Shenzhen University, Shenzhen 518060, China
2
Institute of Nanosurface Science and Engineering, Shenzhen University, Shenzhen 518060, China
3
Shennan Circuits Co., Ltd., Shenzhen 518117, China
*
Author to whom correspondence should be addressed.
Processes 2023, 11(9), 2653; https://0-doi-org.brum.beds.ac.uk/10.3390/pr11092653
Submission received: 22 July 2023
/
Revised: 22 August 2023
/
Accepted: 1 September 2023
/
Published: 5 September 2023
(This article belongs to the Special Issue Micro/Nano Manufacturing Processes: Theories and Optimization Techniques)
Abstract
:The packaging substrate plays a significant role in electrical connection, heat dissipation, and protection for the chips. With the characteristics of high hardness and the complex material composition of packaging substrates, drill bit failure is an austere challenge in micro-drilling procedures. In order to monitor the health state of the drill bit and predict its remaining useful life (RUL) in micro-drilling of packaging substrate, an improved RUL prediction model is established based on the similarity principle, degradation rate, and offset coefficient. And then, a micro-drilling experiment on packaging substrate is carried out to collect the axial drilling force through the precision drilling force measurement platform. Axial drilling force signals, which are processed via the Wiener filtering method, are used to analyze the effectiveness of the improved RUL prediction model. The experiment results indicate that, compared to the curves of the traditional RUL prediction model, the curves of the improved RUL prediction model present a higher fitting degree with the actual RUL curves. The average relative errors of the improved RUL prediction model are small and stable in all groups; all of the values are less than 15%, while the fluctuation of the average relative errors of the traditional model is greatly large, and the maximum value even reaches 74.43%. Therefore, taking the degradation rate and offset coefficient into account is a proper method to enhance the accuracy of the RUL prediction model. Furthermore, the improved RUL prediction model is a reliable theoretical support for the health state monitoring of drill bits during the micro-drilling of packaging substrates, which also acts as a potential method to improve micro hole processing efficiency for packaging substrates.
1. Introduction
Micro hole drilling is the critical procedure in printed circuit board (PCB) fabrication, and the micro hole is essential to the electrical connection of PCBs [1,2]. Considering the requirements of heat dissipation and high-quality signal transmission, packaging substrates, as one kind of PCB, generally consist of low-outline copper foil, modified resin, modified glass fiber, and hard fillers. Additionally, the diameter of the micro hole in the packaging substrate is smaller than that of conventional PCBs. Therefore, the issue of drill bit life has drawn extensive attention in the micro-drilling of packaging substrates.
When it comes to the tool life and health state, many studies focused on the change in tool wear [3,4,5,6,7,8], and researchers believed that the range of oscillation [9] and vibration signal [10] were practical to explore the service state of tools. While considering the influence of the wear status of cutting tools on axial drilling force, Tansel et al. [11] presented a relationship model of axial force and tool wear in micro milling based on a BP neural network. The research result indicated that it was better to predict the tool status in cutting soft metal compared to the processing of hard metal. Malekian et al. [12] proposed a tool wear monitoring method utilizing various sensors, such as accelerometers, force, and acoustic emission sensors, in micro-milling. Comparison between the actual tool wear and the simulated results exhibited good agreement, particularly when the force, acceleration, and acoustic emission signals were fused together. In addition, this method could be extended to predict high-frequency bandwidth cutting forces. More importantly, Shi et al. [13] confirmed that drilling force was the vital reference to the failure of the micro drill bit, which could be the failure signal to the drill bit in micro-drilling of PCBs. Actually, the change in drill bit wear would finally reflect on the variation of axial drilling force, just as the aggravation of drill bit wear would generally lead to an increment of axial drilling force. Thereupon, the variation of axial drilling force is an intuitionistic reflection of the health state of the drill bit.
In research regarding health state and life prediction, RUL prediction is an effective methodology to ensure equipment safety, enhance the utilization rate, and reduce the maintenance cost [14,15]. In the area of batteries, the data-driven method for RUL prediction for lithium-ion batteries through an improved autoregressive model by particle swarm optimization was presented by Long et al. [16], and it was concluded that this prognostic approach could predict the RUL of batteries with a small error and was appropriate for on-board applications. However, Chen et al. investigated the RUL of lithium-ion batteries based on the hybrid deep learning model, and a new hybrid lithium-ion battery RUL prediction model that considered the channel attention mechanism and long short-term memory networks was proposed. Verification indicated that the prediction performance of the model was stable and was less influenced by different prediction starting points [17]. The research on the hybrid model on RUL of proton exchange membrane fuel cells showed that the maximum error in RUL prediction was 2.01% for the hybrid model, which provided credible RUL predictions with the highest accuracy [18].
Practical engineering applications face numerous challenges because of the complicated and unknown failure mechanisms under harsh working conditions. However, an effective method for enhancing the RUL prediction accuracy of machinery was provided by Zeng et al. [19], particularly in a noisy environment. In view of the fact that the RUL-prediction data of the planetary gearbox will result in statistical differences in the data distribution under the different service conditions and that the prediction accuracy will be greatly influenced, Liu et al. [20] proposed a domain-adaptive LSTM-DNN (a long, short-term memory network deep neural networks)-based method for remaining useful life prediction of planetary transmission. The experimental result exhibited that the proposed model was able to effectively extract degradation features from condition monitoring data under various operating conditions, and the generalization capability of the data-driven RUL prediction model was improved. Furthermore, it could adapt to the RUL prediction tasks under different operating conditions to a certain extent, which made up for the limitations of the traditional data-driven model. Eker et al. [21] presented a modification of a pure data-driven similarity-based prognostic approach. Their experimental results indicated that the modifications lessened the root mean squared error of the RUL estimations in two out of three datasets. It was also suggested that future studies would focus on the integration of a physics-based model with the modified similarity-based approach to achieve improved prediction of RUL. Xiong et al. [22] proposed a data analysis method to predict the RUL of aircraft engines based on running data. The experimental result verified that this approach showed excellent prognostic ability in predicting remaining life, so it was an effective reference for subsequent engine maintenance decisions. In the study on RUL of rolling bearings, a novelty RUL prediction model based on a bi-channel hierarchical vision transformer was established for the sake of improving prediction accuracy. Two different validation experiments were carried out by Hao et al., and it was found that the prediction accuracy of the novelty RUL prediction model could be increased by up to 9.43% and 43.10%, respectively, when compared with the current standard method [23]. Li et al. [24] utilized a support vector machine approach to accurately identify the tool wear state, followed by a Bayesian framework to deduce the RUL of the tool. Combining the preprocessing techniques, Bayesian hyperparameter optimization, and forward feature selection, Zegarra et al. [25] also provided a methodology to accurately predict tool wear at a lower computational cost. Experiments concerning the degradation modeling and RUL estimation approach using available degradation data for a deteriorating system indicated that the proposed approach could effectively model the degradation process for the individual system and acquire better results for RUL estimation [26].
Studies concerning RUL prediction, which takes the variation of axial drilling force as an object, are seldom reported, and the degradation rate and offset coefficient are of significance in the RUL prediction model. In this article, therefore, we focus on the establishment of the improved RUL prediction model of the drill bit during micro-drilling of packaging substrate, which is based on the similarity principle, degradation rate, and offset coefficient. Following that, a micro-drilling experiment on packaging substrate is carried out to validate the effectiveness of the improved RUL prediction model. The results indicate that the improved RUL prediction model is effective for the RUL prediction of drill bits during the micro-drilling of packaging substrates.
2. Establishment of the RUL Prediction Model
2.1. Traditional RUL Prediction Model
The prediction method based on similarity theory is a new direction in the research field of equipment remaining useful in recent years [27]. The basic idea based on the similarity principle is that the performance degradation curve of the current tool is matched with the historical failure data set by curve similarity, and the RUL of the current tool is predicted by weighting the RUL of each historical data set according to the similarity.
In this research, Euclidean distance is used for the quantification of similarity matching (Equation (1)):
where is the weighting function of distance, is the current recording spot of the tool, is the collection point of the tool historical data of the current calculation similarity matching, and is the failure point of the tool history data. The similarity matching of each collection point is traversed to obtain the distance of the best matching between the current machining tool and the health state of each tool in the historical failure data set (Equation (2)):
where is the most matchable collection point in health state from the tool’s historical data. Furthermore, the RUL of the most matchable data collection point of each tool in the tool historical failure data set can be expressed by Equation (3), and the weighting function is shown as Equation (4).
is the time interval between two adjacent collection points. Finally, the RUL of current tool can be calculated by the following Equation (5):
2.2. Improved RUL Prediction Model
Under the condition of a limited size of the tool historical failure data set, the influence of the difference in performance degradation rate of similar performance degradation curves is necessary to be considered in the RUL prediction model, which is based on the similarity principle. However, in order to quantify the influence of the difference in performance degradation rate on the prediction model, the ratio of degradation rate of tool performance and the function of variation on the ratio of tool degradation rate need to be calculated.
Since the time-varying property of the performance degradation rate function, Peng et al. [20] suggested that the performance degradation process of a tool could be expressed by , where, is the mean value function of the performance degradation curve, which can be calculated by the following Equation (6):
Additionally, can be expressed precisely by Equation (7) when the degradation curve has the properties of uncertainty and nonlinearity. Meanwhile, the average performance degradation rate over a longer time interval is selected to estimate the performance degradation rate of the tool, as Equation (8) shows.
where = 1,2,…, is the current processing parameter collection point, is the initial value of the tool health index.
The Equation (5) would be described as the Equation (9) shown, while function is used to quantify the influence of the tool’s performance degradation rate on the prediction results.
Moreover, due to the performance degradation rates from the performance degradation curve of the current processing tool and the historical tool , are main factors in the prediction result, Equation (9), therefore, can be expressed as Equation (10).
We assume that the future performance degradation rate of the current tool is the relative function of the tool performance degradation rate at the current processing parameter collection point, expressed by . Here, is the future performance degradation rate of the tool, is the tool performance degradation rate of the current processing parameter collection point, and is a sequenced variate. Thus, is described as the Equation (11) shown.
Combining the Equations (10) and (11), the Equation (9) can be expressed by Equation (12) as follows:
Because the RUL of tool and performance degradation rate is negatively correlated, so Equation (12) can be transferred into Equation (13):
Meanwhile, if , so Equation (13) can be described as the following:
The RUL prediction value of the tool would skew to the intermediate value because of the limitation of historical data. To solve this issue, the offset coefficient of the tool RUL is proposed:
where is the mean value of the RUL collection point in tool historical data, is the maximum value of the RUL collection point in tool historical data. Therefore, the improved RUL prediction model based on the similarity principle, the degradation rate, and the offset coefficient can be described as:
3. Validation on the Improved RUL Prediction Model
Variation of axial drilling force is largely caused by drill bit wear, which also acts as a significant feature of the health state of the drill bit in micro-drilling of packaging substrate. Consequently, axial drilling force is used as the supporting data in validation of the RUL prediction model.
3.1. Experiment on Collection of Axial Drilling Force
3.1.1. Micro-Drilling Experiment
In this micro-drilling experiment, a drill bit diameter of 0.11 mm (Table 1) and packaging substrate with a specification of HL832NSF are selected. The properties of HL832NSF are shown in Table 2. In terms of processing parameters of the machine tool (HANS-F6MH, Shenzhen Han’s CNC Technology Co., Ltd., Shenzhen, China), the spindle speed is 170 krpm, the feed rate is 45 mm/s (in order to acquire more breakage data of drill bits in a relative short time, the feed rate would be larger than the general value), and the main property parameters of the HANS-F6MH are as shown in Table 3.
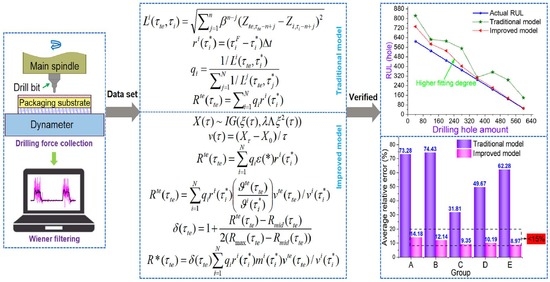
In micro-drilling of packaging substrate, obtaining the original signals of drilling force precisely is the most critical process for the study of axial drilling force since those signals are extremely weak and the signal-to-noise ratio (SNR) is very low. Therefore, a high-precision dynameter system, manufactured by Kistler Company (Winterthur, Switzerland), is used to measure the axial drilling force; the corresponding product models are shown in Table 4. In consequence, the schematic diagram of axial drilling force measurement is shown in Figure 1.
In this experiment, 25 drill bits are used for drilling holes in sequence, but if the drill bit breakage does not occur until the finished 1800 holes, drilling processes will be stopped, and this drill bit will be deemed to have reached a failure state. That is because the drill bit wear became very serious while finishing 1800 holes, and the micro hole quality could not satisfy the requirement. Since each drill bit will fail in different drilling stages, all drill bits are going to be divided into different groups via the drilling hole amount before failure appearance for the data analysis. Because the cyclic autocorrelation Wiener filter with time-domain accumulation was validated as a suitable method for weak and complex signals by the previous investigation of our team [28], it would be used for the processing of axial drilling force signals in this study. Moreover, the average force of 15 data points from 10 drilled holes during hole processing at different drilling stages was extracted for the analysis of RUL.
3.1.2. Results of Drill Bit Failure and Signal Processing of Axial Drilling Force Signal
The failure situation of 25 drill bits is shown in Table 5. It is clear that 19 drill bits fail before finishing 1800 holes, but failure does not occur in 6 drill bits while finishing 1800 holes. Furthermore, there are five groups for the 25 drill bits: the A group belongs to the failure appearance of about 650 holes; similarly, the B group is about 800 holes; the C group is in range of 1100–1450 holes; the D group is in range of 1600–1800 holes; and the E group belongs to the failure that does not appear while finishing 1800 holes.
Packaging substrate is a kind of composite material, and the noise source of drilling force signals in processing is complex, resulting in weak axial drilling force signals and quite low SNR. Simple filtering methods generally cannot effectively improve the SNR of axial drilling force signals. The Wiener filter principle holds excellent noise reduction performance, but before using of the Wiener filter to filter the axial drilling force signal, obtaining the desired signal of the original axial drilling force is needed first. Since the desired signals of the original axial drilling force cannot be acquired directly via drilling experiments, and the noise reduction process of the original axial drilling force signals cannot be completed by a single Wiener filter. Therefore, the original axial drilling force signal processed by a cyclic autocorrelated Wiener filter is needed, and the process flow is as follows:
- (1)
- Calculating the periods of the axial drilling force signals through the cyclic stationary theory;
- (2)
- Based on accumulation theory in the time domain, if the axial drilling force signals are sliced according to the calculated periods and the average value of each signal segment is acquired after time domain superposition, the preliminary filtered signal would be obtained;
- (3)
- The signal accumulated in the time domain is used as the desired signal, and the original axial drilling force signals are filtered by the Wiener filter to obtain the final filtered signals.
The merit of this filtering method is that, while a single time-domain accumulation principle is used for filtering, although the SNR of the output signal is raised after filtering, the waveform of the output signal is difficult to match with the different original axial drilling force signal segments. When the average signal filtered by the time-domain accumulation principle is taken as the expected signal of the original axial drilling force signal and the original axial drilling force signal is filtered via the Wiener filter. Therefore, this filtering method improved the SNR of the output signal by 11.76 dB, and the consistency with the original axial force signal waveform would be enhanced [28].
In the collection of drilling force, the original signal of axial drilling force is as shown in Figure 2, and some of the Wiener-filtered signals of axial drilling force in the A group are as shown in Figure 3. It can be found that the Wiener-filtered signal is in good agreement with the original signal. Meanwhile, the Wiener-filtered signal also retains the advantage of a high signal-to-noise ratio. These results propose reliable support for the verification of the RUL prediction model.
Extracting the axial drilling force in each drill bit when the interval of drilling hole amount is 80, and the first extraction of axial drilling force begins with drilling hole amount of 40. Thereupon, the variations of axial drilling force for each drill bit in different drilling stages are shown in Figure 4 and Figure 5. In this study, testing failure data sets are selected at random for each group, and the remaining data sets are regarded as historical failure data sets. It means that the historical failure data sets are the reference library for the RUL prediction model of drill bits.
3.2. Validation Results of the RUL Prediction Model
The RUL prediction method for cutting tools based on a degradation model was effective, but it took the roughness of the cutting surface as the failure criterion [29]. In this article, the testing failure data sets of all drill bits are put into the traditional RUL prediction model and the improved RUL prediction model, and their comparisons with the actual RUL are shown in Figure 6 and Figure 7. From the changes in curves in each group, it can be seen that all curves of the improved RUL prediction model have higher fitting degrees with the actual RUL curve compared to the traditional RUL prediction model. Also, the RUL prediction based on the similarity principle was successfully used in cutting tools [30], aircraft engines [31], and many other machinery fields. Remarkably, it is found that the output results of the improved RUL prediction model generally have large deviations at the beginning stage. The main reasons for this phenomenon are that the increment of drill bit performance degradation rate in the same collection point interval within the initial range is less than that in the later period, which leads to a matching error when matching the drill bit performance degradation curve and then affects the calculation of the drill bit performance degradation rate function. So, under the combined effects of the two kinds of errors, the prediction results of the RUL of the drill bit have a large error at the beginning stage. But the higher fitting degree between the improved model curve and the actual RUL curve is going to be obtained with an increment in the drilling hole amount.
The average relative errors of the two prediction models are calculated too, as shown in Figure 8. The average relative errors of the improved RUL prediction model are much smaller than those of the traditional RUL prediction model, which are also stable with a range of 8.97–14.18%. Conversely, the average relative errors of the traditional RUL prediction model for all groups hold a much larger fluctuation range, and the biggest one reaches 74.43%, while the smallest value is 31.81%.
Therefore, the output results of the improved RUL prediction model based on the similarity principle proposed in this paper are closer to the actual RUL curves, and its average relative error is less than 15%, which proves that considering the degradation rate difference and offset coefficient can significantly improve the performance of the RUL prediction model based on the similarity principle. However, in the case of a limited number of historical failure data samples, the traditional prediction model based on the similarity principle does not take into account the impact of sample performance degradation speed differences and data migration, so the accuracy of the prediction results is much lower than the method proposed in this paper. The RUL curves predicted by the improved model based on the similarity principle are reliable.
4. Conclusions
Based on the similarity principle and taking the degradation rate and offset coefficient into account, an improved RUL prediction model is established. And then, in order to verify the effectiveness of that model, a micro-drilling experiment on packaging substrate is carried out, the axial drilling force is collected through the precision measuring platform, and a cyclic autocorrelation Wiener filter with time-domain accumulation, which increased the SNR of the processed axial drilling force signal by 11.76 dB, is used for the signal processing. The validation results show that, compared to the traditional RUL prediction model, the curves of the improved RUL prediction model exhibit a higher fitting degree with the actual RUL curves. The average relative errors of the traditional RUL prediction model for all groups hold a much larger fluctuation range, and the biggest one reaches 74.43%, while the smallest value is 31.81%. But the average relative errors of the improved RUL prediction model are small and stable in all groups; all of the values are less than 15%. Therefore, the improved RUL prediction model is a reliable theoretical support for the health state monitoring of drill bits during the micro-drilling of packaging substrates, and it is also a potential method to improve micro hole processing efficiency for packaging substrates.
However, since the axial drilling force is classified linearly during the selection of the testing failure data set, it is untoward to the engineering application of this improved model. Thus, the extraction of testing failure data in a more reasonable way is expected to be investigated. Meanwhile, reducing the matching error of the drill bit performance degradation curve may be a feasible method to improve the prediction accuracy of the beginning stage.
Author Contributions
Conceptualization, H.S. and X.L.; methodology, X.L. and S.T.; validation, X.L. and S.T.; Investigation, S.T. and T.Z.; resources, H.S.; data curation, T.Z. and Z.W.; writing—original draft preparation, X.L.; writing—review and editing, H.S.; visualization, H.S.; supervision, H.S.; funding acquisition, H.S. All authors have read and agreed to the published version of the manuscript.
Funding
The research proposed in this paper was supported by the National Key Research and Development Program of China (No. 2020YFB1708500) and the National Natural Science Foundation of China (No. 52075344).
Data Availability Statement
Not applicable.
Conflicts of Interest
The authors declare no conflict of interest.
References
- Kenny, S.; Baron, D.; Roelfs, B. A comprehensive packaging solution for next generation IC substrates. Microelectron. Packag. Conf. 2011, 9, 1–4. [Google Scholar]
- Chang, J.Y.; Chang, T.H.; Chang, T.C. An Investigation into the package and printed circuit board assembly solutions of an ultrathin coreless flip-chip substrate. J. Electron. Mater. 2015, 44, 3855–3862. [Google Scholar] [CrossRef]
- Iliescu, D.; Gehin, D.; Gutierrez, M.E.; Girot, F. Modeling and tool wear in drilling of CFRP. Int. J. Mach. Tools Manuf. 2010, 50, 204–213. [Google Scholar] [CrossRef]
- Liu, X.W.; Shi, H.Y.; Huang, G.; Tao, S.; Gao, Z.S. Investigation on Drill Wear and Micro Hole Quality in High Speed Drilling of High Frequency Printed Circuit Board. IOP Conf. Ser. Mater. Sci. Eng. 2020, 825, 012034. [Google Scholar] [CrossRef]
- Zheng, L.J.; Wang, C.Y.; Fu, L.Y.; Yang, L.P.; Qu, Y.P.; Song, Y.X. Wear mechanisms of micro-drills during dry high speed drilling of PCB. J. Mater. Process. Technol. 2012, 212, 1989–1997. [Google Scholar] [CrossRef]
- Shi, H.Y.; Liu, X.W.; Gao, Z.S.; Huang, G.; Tao, S.; Fu, L.Y.; Liang, X. Micro hole drilling of high frequency printed circuit board containing hard fillers. J. Micromech. Microeng. 2021, 31, 055005. [Google Scholar] [CrossRef]
- Imran, M.; Mativenga, P.T.; Withers, P.J. Assessment of machining performance using the wear map approach in micro-drilling. Int. J. Adv. Manuf. Technol. 2012, 59, 119–126. [Google Scholar] [CrossRef]
- Li, J.; Lu, J.; Chen, C.; Ma, J.; Liao, X. Tool wear state prediction based on feature-based transfer learning. Int. J. Adv. Manuf. Technol. 2021, 113, 3283–3301. [Google Scholar] [CrossRef]
- Shi, H.Y.; Lin, X.K.; Wang, Y. Characterization of drill bit breakage in pcb drilling process based on high speed video analysis. Circuit World 2017, 43, 89–96. [Google Scholar] [CrossRef]
- Ren, Z.H.; Zheng, X.H.; An, Q.L.; Wang, C.Y.; Chen, M. Tool breakage feature extraction in pcb micro-hole drilling using vibration signals. Adv. Mater. Res. 2012, 497, 126–131. [Google Scholar] [CrossRef]
- Tansel, I.; Arkan, T.; Bao, W. Tool wear estimation in micro-machining: Part I: Tool usage–cutting force relationship. Int. J. Mach. Tools Manuf. 2000, 40, 599–620. [Google Scholar] [CrossRef]
- Malekian, M.; Park, S.; Jun, M. Tool wear monitoring of micro-milling operation. J. Mater. Process. Tech. 2009, 209, 4903–4914. [Google Scholar] [CrossRef]
- Shi, H.Y.; Song, F.M.; Fu, L.Y. Experimental study on drilling force in printed circuit board micro drilling process. Circuit World 2011, 37, 24–29. [Google Scholar] [CrossRef]
- Xue, B.; Xu, H.; Huang, X.; Zhu, K.; Xu, Z.; Pei, H. Similarity-based prediction method for machinery remaining useful life: A review. Int. J. Adv. Manuf. Technol. 2022, 121, 1501–1531. [Google Scholar] [CrossRef]
- Lei, J.; Zhang, W.; Jiang, Z.; Gao, Z. A Review: Prediction method for the remaining useful life of the mechanicalsystem. J. Fail. Anal. Prev. 2022, 22, 2119–2137. [Google Scholar] [CrossRef]
- Long, B.; Xian, W.M.; Jiang, L.; Liu, Z. An improved autoregressive model by particle swarm optimization for prognostics of lithium-ion batteries. Microelectron. Reliab. 2013, 53, 159–168. [Google Scholar] [CrossRef]
- Chen, C.; Wei, J.; Li, Z.H. Remaining useful life prediction for lithium-ion batteries based on a hybrid deep learning model. Processes 2023, 11, 2333. [Google Scholar] [CrossRef]
- Du, Q.; Zhan, Z.G.; Wen, X.F.; Zhang, H.; Tan, Y.; Li, S.; Pan, M. A hybrid model to assess the remaining useful life of proton exchange membrane fuel cells. Processes 2023, 11, 1583. [Google Scholar] [CrossRef]
- Zeng, F.; Li, Y.; Jiang, Y.; Song, G. A deep attention residual neural network-based remaining useful life prediction of machinery. Measurement 2021, 181, 109642. [Google Scholar] [CrossRef]
- Liu, Z.X.; Tan, C.B.; Liu, Y.X.; Li, H.; Cui, B.; Zhang, X. A study of a domain-adaptive LSTM-DNN-based method for remaining useful life prediction of planetary gearbox. Processes 2023, 11, 2002. [Google Scholar] [CrossRef]
- Eker, O.F.; Camci, F.; Jennions, I.K. A Similarity-based prognostics approach for remaining useful life prediction. PHM Soc. Eur. Conf. 2014, 2. [Google Scholar] [CrossRef]
- Xiong, X.; Yang, H.; Cheng, N.; Li, Q. Remaining useful life prognostics of aircraft engines based on damage propagation modeling and data analysis. In Proceedings of the 2015 8th International Symposium on Computational Intelligence and Design (ISCID), Hangzhou, China, 12–13 December 2015; pp. 143–147. [Google Scholar]
- Hao, W.; Li, Z.X.; Qin, G.H.; Ding, K.; Lai, X.; Zhang, K. A novel prediction method based on bi-channel hierarchical vision transformer for rolling bearings’ remaining useful life. Processes 2023, 11, 1153. [Google Scholar] [CrossRef]
- Li, Y.; Xiang, Y.; Pan, B.; Shi, L. A hybrid remaining useful life prediction method for cutting tool considering the wear state. Int. J. Adv. Manuf. Technol. 2022, 121, 3583–3596. [Google Scholar] [CrossRef]
- Zegarra, F.C.; Vargas-Machuca, J.; Coronado, A.M. Tool wear and remaining useful life (RUL) prediction based on reduced feature set and Bayesian hyperparameter optimization. Prod. Eng. Res. Devel. 2022, 16, 465–480. [Google Scholar] [CrossRef]
- Pan, D.; Liu, J.; Cao, J. Remaining useful life estimation using an inverse Gaussian degradation model. Neurocomputing 2016, 8, 185–194. [Google Scholar] [CrossRef]
- Zhong, X.H. Research on Equipment Remaining Useful Life Prediction Methods Based on Limited Failure Historical Data. Master’s Thesis, Heifei University of Technology, Heifei, China, 2020. [Google Scholar]
- Tao, S.; Gao, Z.; Shi, H. Characterization of printed circuit board micro-holes drilling process by accurate analysis of drilling force signal. Int. J. Precis. Eng. Manuf. 2022, 23, 131–138. [Google Scholar] [CrossRef]
- Huang, Y.; Lu, Z.; Dai, W.; Zhang, W.; Wang, B. Remaining useful life prediction of cutting tools using an inverse Gaussian process model. Processes 2021, 11, 5011. [Google Scholar] [CrossRef]
- Liu, Y.C.; Hu, X.F.; Zhang, W.J. Remaining useful life prediction based on health index similarity. Reliab. Eng. Sys. Saf. 2019, 185, 502–510. [Google Scholar] [CrossRef]
- Chen, Z.Z.; Cao, S.C.; Mao, Z.J. Remaining useful life estimation of aircraft engines using a modified similarity and supporting vector machine (SVM) approach. Energies 2018, 11, 28. [Google Scholar] [CrossRef]
Figure 1.
Schematic diagram of the axial drilling force measurement.

Figure 2.
Original signal of the axial drilling force at different drilling stages.

Figure 3.
Wiener-filtered signals of axial drilling force in different drilling stages (drill bit number: A-1). (a) 80 holes; (b) 240 holes; (c) 480 holes; (d) 600 holes.
Figure 3.
Wiener-filtered signals of axial drilling force in different drilling stages (drill bit number: A-1). (a) 80 holes; (b) 240 holes; (c) 480 holes; (d) 600 holes.

Figure 4.
Axial drilling force at different drilling stages. (a) Drill bits in the A group; (b) drill bits in the B group.
Figure 4.
Axial drilling force at different drilling stages. (a) Drill bits in the A group; (b) drill bits in the B group.

Figure 5.
Axial drilling force at different drilling stages. (a) Drill bits in the C group; (b) drill bits in the D group; (c) drill bits in the E group.
Figure 5.
Axial drilling force at different drilling stages. (a) Drill bits in the C group; (b) drill bits in the D group; (c) drill bits in the E group.

Figure 6.
RUL prediction results of the two prediction models and actual RUL. (a) A group; (b) B group.
Figure 6.
RUL prediction results of the two prediction models and actual RUL. (a) A group; (b) B group.

Figure 7.
RUL prediction results of the two prediction models and the actual RUL. (a) C group; (b) D group; (c) E group.
Figure 7.
RUL prediction results of the two prediction models and the actual RUL. (a) C group; (b) D group; (c) E group.

Figure 8.
The average relative errors of the traditional prediction model and the improved prediction model in different groups.
Figure 8.
The average relative errors of the traditional prediction model and the improved prediction model in different groups.


Table 1.
Drill bit structure parameters.
| Drill Diameter | Point Angle | Helix Angle | Flute Land Ratio | Overall Length |
|---|---|---|---|---|
| 0.11 mm | 120° | 40° | 1:2 | 38.15 mm |
Table 2.
Properties of the packaging substrate (HL832NSF).
| Dielectric Constant | Dissipation Factor | Young’s Modulus | Density | Bending Strength |
|---|---|---|---|---|
| 4.4 | 0.008 | 32 Gpa | 2.0 g/cm3 | 510 Mpa |
Table 3.
The main property parameters of HANS-F6MH.
| Spindle Speed | Repeatability | Movement Speed | Range of Drill Diameter |
|---|---|---|---|
| 200 krpm | 5 μm | 85 m/min | 0.10–2.0 mm |
Table 4.
Equipment and software of the high precision dynameter system.
| Equipment | Dynameter | Amplifier | A/D Card | Software |
|---|---|---|---|---|
| Product model | Kistler 9256 CQ01 | 5080A108004 | 2855A5 | DynoWare 2825A-02-2 |
Table 5.
Failure situation of the drill bits.
| Drill Bit Number | Failure (Hole Amount) | Drill Bit Number | Failure (Hole Amount) |
|---|---|---|---|
| A-1 | 650 | C-4 | 1123 |
| A-2 | 652 | C-5 | 1440 |
| A-3 | 639 | D-1 | 1608 |
| A-4 | 642 | D-2 | 1795 |
| A-5 | 643 | D-3 | 1692 |
| B-1 | 799 | D-4 | 1769 |
| B-2 | 808 | E-1 | 1800 |
| B-3 | 804 | E-2 | 1800 |
| B-4 | 808 | E-3 | 1800 |
| B-5 | 803 | E-4 | 1800 |
| C-1 | 1154 | E-5 | 1800 |
| C-2 | 1436 | E-6 | 1800 |
| C-3 | 1389 |
Disclaimer/Publisher’s Note: The statements, opinions and data contained in all publications are solely those of the individual author(s) and contributor(s) and not of MDPI and/or the editor(s). MDPI and/or the editor(s) disclaim responsibility for any injury to people or property resulting from any ideas, methods, instructions or products referred to in the content. |
© 2023 by the authors. Licensee MDPI, Basel, Switzerland. This article is an open access article distributed under the terms and conditions of the Creative Commons Attribution (CC BY) license (https://creativecommons.org/licenses/by/4.0/).
Share and Cite
MDPI and ACS Style
Liu, X.; Tao, S.; Zhu, T.; Wang, Z.; Shi, H. Prediction Model of the Remaining Useful Life of the Drill Bit during Micro-Drilling of the Packaging Substrate. Processes 2023, 11, 2653. https://0-doi-org.brum.beds.ac.uk/10.3390/pr11092653
AMA Style
Liu X, Tao S, Zhu T, Wang Z, Shi H. Prediction Model of the Remaining Useful Life of the Drill Bit during Micro-Drilling of the Packaging Substrate. Processes. 2023; 11(9):2653. https://0-doi-org.brum.beds.ac.uk/10.3390/pr11092653
Chicago/Turabian StyleLiu, Xianwen, Sha Tao, Tao Zhu, Zhaoguo Wang, and Hongyan Shi. 2023. "Prediction Model of the Remaining Useful Life of the Drill Bit during Micro-Drilling of the Packaging Substrate" Processes 11, no. 9: 2653. https://0-doi-org.brum.beds.ac.uk/10.3390/pr11092653
Note that from the first issue of 2016, this journal uses article numbers instead of page numbers. See further details here.