Article

Study of Mid-Pressure Ar Radiofrequency Plasma Used in Plasma-Enhanced Atomic Layer Deposition of α-Al2O3

Institute of Physics, University of Tartu, W. Ostwaldi Str. 1, 50411 Tartu, Estonia
*
Author to whom correspondence should be addressed.
Submission received: 29 February 2024 / Revised: 15 March 2024 / Accepted: 16 March 2024 / Published: 20 March 2024

Abstract

:
This study investigated the characteristics of radiofrequency, middle-pressure argon plasma used in the atomic layer deposition (ALD) of Al2O3 films. Based on the electrical characteristics—the current, voltage, and phase shift between them—and the stability of the plasma plume, the optimum plasma power, allowing reliable switching on of the plasma for any step of an ALD cycle, was determined. Spectral measurements were performed to determine the gas temperature and reactive species that could be important in the ALD process. The density of metastable argon atoms was estimated using tunable laser absorption spectroscopy. It was concluded that plasma heating of substrates did not affect film growth. The crystallization-enhancing effect of plasma observed in these experiments was due to the action of OH radicals produced in the plasma.

1. Introduction

Extensive research has been conducted on aluminum oxide as a thin-film material with diverse applications, including protective coatings [1,2], diffusion barriers [3,4,5], and electronic and optical devices [6,7,8,9]. Crystalline Al2O3 films offer clear advantages in applications that require elevated chemical stability [2,10], specific optical or electronic attributes [7,11,12], and superior mechanical properties [13,14]. However, the deposition of crystalline Al2O3 thin films using traditional thermal atomic layer deposition (ALD), often used for coating surfaces with complex shapes and/or deposition of ultrathin films, is challenging [10,14]. The use of plasma during the ALD process (PEALD) has the potential to facilitate the process, as it can reduce energy consumption and enable the growth of crystalline thin films with higher density at a reduced growth temperature (TG) compared to thermal ALD processes [15]. The main functions of plasma in ALD process are as follows:
(i)
Generation of reactive species that participate in surface reactions [16,17,18,19,20,21];
(ii)
Energy delivery to the treated surface.
Reactive plasma species, such as metastable state atoms and molecules, and vibrationally excited molecules, can promote film growth by delivering their potential energy to the film via Auger processes [22], thereby reducing the activation energy of the reactions [16]. When the ALD process occurs in the active plasma region, energy transfer to the film surface can also occur via ions and heavy particles impacting the surface with high kinetic energy. In this case, the temperature of the impact site increases locally because of the momentum exchange between these particles and film lattice atoms, enabling crystalline film growth at lower substrate temperatures [15]. Plasmas offer the flexibility to produce specific reactive species, for example, by choosing a suitable gas composition and gas pressure and tailoring gas-phase chemistry with ALD surface reactions to obtain thin films with specific properties [23].
Capacitively coupled plasma is a commonly used plasma source in PEALD reactors, which, based on geometry, can be divided into direct and indirect treatment devices [15]. In the case of direct treatment, the substrate is placed directly into the plasma on an electrode; therefore, the deposited films experience reactions of neutral plasma species diffused onto the film as well as the impact of ions. Indirect-treatment devices utilize remote plasma sources, and substrates are placed in the plasma particle effluent, which mostly consists of long-lifetime reactive species. The production of reactive species (e.g., O, O3, H, OH, N, N2(A), and NHx) occurs in the plasma of molecular gas or inert gas with a molecular gas admixture [23,24,25,26], whereas higher concentrations of molecular gas have been found to be favorable with respect to the reactive species yield [27]. At the same time, the increase in the molecular content impedes discharge ignition, which forces an increase in the voltage needed for discharge ignition and to sustain this process [28], which, in turn, could increase the plasma switching time jitter and force the plasma to run in the high-current, γ-mode. The high-current mode has been found to worsen the film uniformity compared to that produced using a low-current α-mode [29]. A possible solution for lowering the plasma ignition voltage while still producing reactive species is to use remote inert gas plasma mixed with molecular gases downstream from the plasma source. Such an arrangement has rarely been studied, although it has been found to provide a more stable discharge and even increase the yield of reactive species [30].
In our previous study [31], we investigated the influence of capacitively coupled Ar plasma applied during different steps of the ALD process on the growth of Al2O3 from trimethylaluminum (TMA) and water (H2O) vapor. The Ar plasma was mixed with the precursors downstream of the plasma source. According to X-ray reflection (XRR) studies of the films deposited on Si(100) at a substrate temperature of TG = 650 K, the application of plasma during the H2O pulse and during the purge periods following the TMA and H2O pulses caused an increase in the densities of the films compared with the densities of the films deposited via thermal ALD, that is, without plasma excitation. However, all the films obtained on bare Si(100) substrates were amorphous, and the increase in density caused by plasma excitation did not exceed 2%. More remarkable changes were caused by plasma excitation to the properties of the Al2O3 thin films deposited on the α-Cr2O3 seed layers. According to X-ray diffraction (GIXRD) studies, the films deposited at TG ≥ 600 K on α-Cr2O3 seed layers using Ar plasma during the purge after the H2O pulse contained the α-Al2O3 phase, whereas the films deposited using thermal ALD were amorphous.
As the growth of α-Al2O3 at these relatively low TG values is of marked importance for many applications, a more extensive characterization of plasma processes causing this effect was performed in this study. Electrical measurements, spatiotemporal optical emission spectroscopy, and tunable diode laser absorption spectroscopy (TDLAS) were used to determine the plasma parameters that could influence the PEALD process.

2. Materials and Methods

The experimental setup (Figure 1) is described in our previous study [18]. Here, the more specific details are focused on. The plasma was ignited using a 13.6 MHz RF generator coupled with a BDS-AMN 750 automatic matching network (both produced by the BDISCOM SRL).
The generator output power, fixed at 30 W, was switched on and off using a signal from the ALD process controller. At this generator power, the output voltage was sufficiently high for instant ignition of the plasma. A coaxial electrode configuration was used for plasma generation in our experiments. The diameter of the powered central stainless-steel electrode was 6.4 mm, and the inner diameter of the grounded surrounding stainless-steel tube was 16 mm (hereafter, “plasma tube”). The length of each electrode was 500 mm. The diameter of the quartz tube isolating the reactor from ambient air was 47 mm. The overall flow of Ar (99.999%) through the reactor was 300 standard cubic centimeters per minute (sccm), whereas the flow through the plasma tube was 150 sccm. The gas pressure in the reactor was 1.9–2.1 Torr. TMA (98%) and H2O were used as precursors in the ALD film deposition and carried into the reaction zone by the Ar flow. The durations of the TMA and H2O pulses and the TMA purge were 2 s, whereas that of the H2O purge was 5 s. Al2O3 films were deposited on a Si(100) substrate covered with an α-Cr2O3 seed layer. The deposition of the seed layer is described in a previous study [13]. The samples were inserted into the reaction chamber on a SiO2 holder. The temperature of the samples was recorded, prior to the ALD cycles and after temperature stabilization, using a K-type thermocouple.
The phase composition, thickness, density, and roughness of the films were measured using a SmartLab (Rigaku) diffractometer and analyzed using the GIXRD and XRR methods. The optical emission spectra of the plasma were recorded along the plasma axis at different distances (x) from the plasma tube orifice (Figure 1a) using Ocean Insight HR4 PRO (spectral range 274–414 nm, resolution approximately 0.1 nm) and Ocean Optics USB4000 (spectral range 185–850 nm, resolution approximately 1 nm) spectrometers. Because of the moderate spectral resolution of the USB4000 spectrometer, some spectral lines were not resolved and were deconvoluted using a nonoverlapped Ar spectral line at 696.5 nm as an instrumental function. An example of the deconvoluted lines is shown in Figure 2.
The fitting of the experimental and calculated spectra used to estimate the rotational temperature and the concentration of Ar atoms in the metastable state 1s5 (Paschen notation) was performed using the MathCad 15.0 software function Minimize. Electrical characteristics were recorded using an oscilloscope Tektronix TDS-540B. The voltage (u) was measured using a 1:100 Tektronix voltage probe P5100, whereas the current (i) was measured using a McPherson current monitor 6585. The concentration of Ar 1s5 state atoms was estimated using a TDLAS unit. The scan range of the Littman-type external cavity diode laser Thorlabs TLK-L780M with a power of 50 mW was 740–800 nm, and the line width was <130 kHz. The free spectral range and finesse of Fabry–Perot interferometer Thorlabs SA-200, used to check the laser operation stability and to calibrate the relative wavelength, were 1.5 GHz and 200, respectively. A photodetector Thorlabs APD110A2 coupled with an interference filter with a central wavelength of 763.5 nm and a full width at half maximum of 40 nm was used to register the laser signal.

3. Results and Discussion

3.1. Plasma Characteristics

3.1.1. Discharge Appearance and the Choice of Generator Power

The appearance of the discharge depended on the generator power. At low power values, the radiation intensity in the plasma tube was low, and the space between the electrodes was only partially filled with plasma. An increase in the generator power caused the gradual filling of the tube with plasma and, finally, the emergence of a plasma plume outside the tube. At a generator power of 30 W and after a long-term Ar purge, the bright plasma plume of the Ar discharge extended outside the tube to a distance of 20–30 mm, whereas the diameter of the plume was somewhat larger than that of the outer electrode, as shown in Figure 1b. A low-intensity plasma column was observed at longer distances (up to 100 mm). By further increasing the generator power, randomly located irregular plasma sparks, in addition to homogenous plasma, appeared between the electrodes. With the appearance of sparks, instabilities were observed in the plasma plume outside the tube. Therefore, ALD was conducted at a generator power of 30 W. Outside the tube, the discharge appearance also depended on the ALD step. The TMA and H2O pulses caused a rapid reduction in the extent of the plasma plume outside the plasma tube and changed the plasma color. During the following purge, plasma extension was gradually restored.

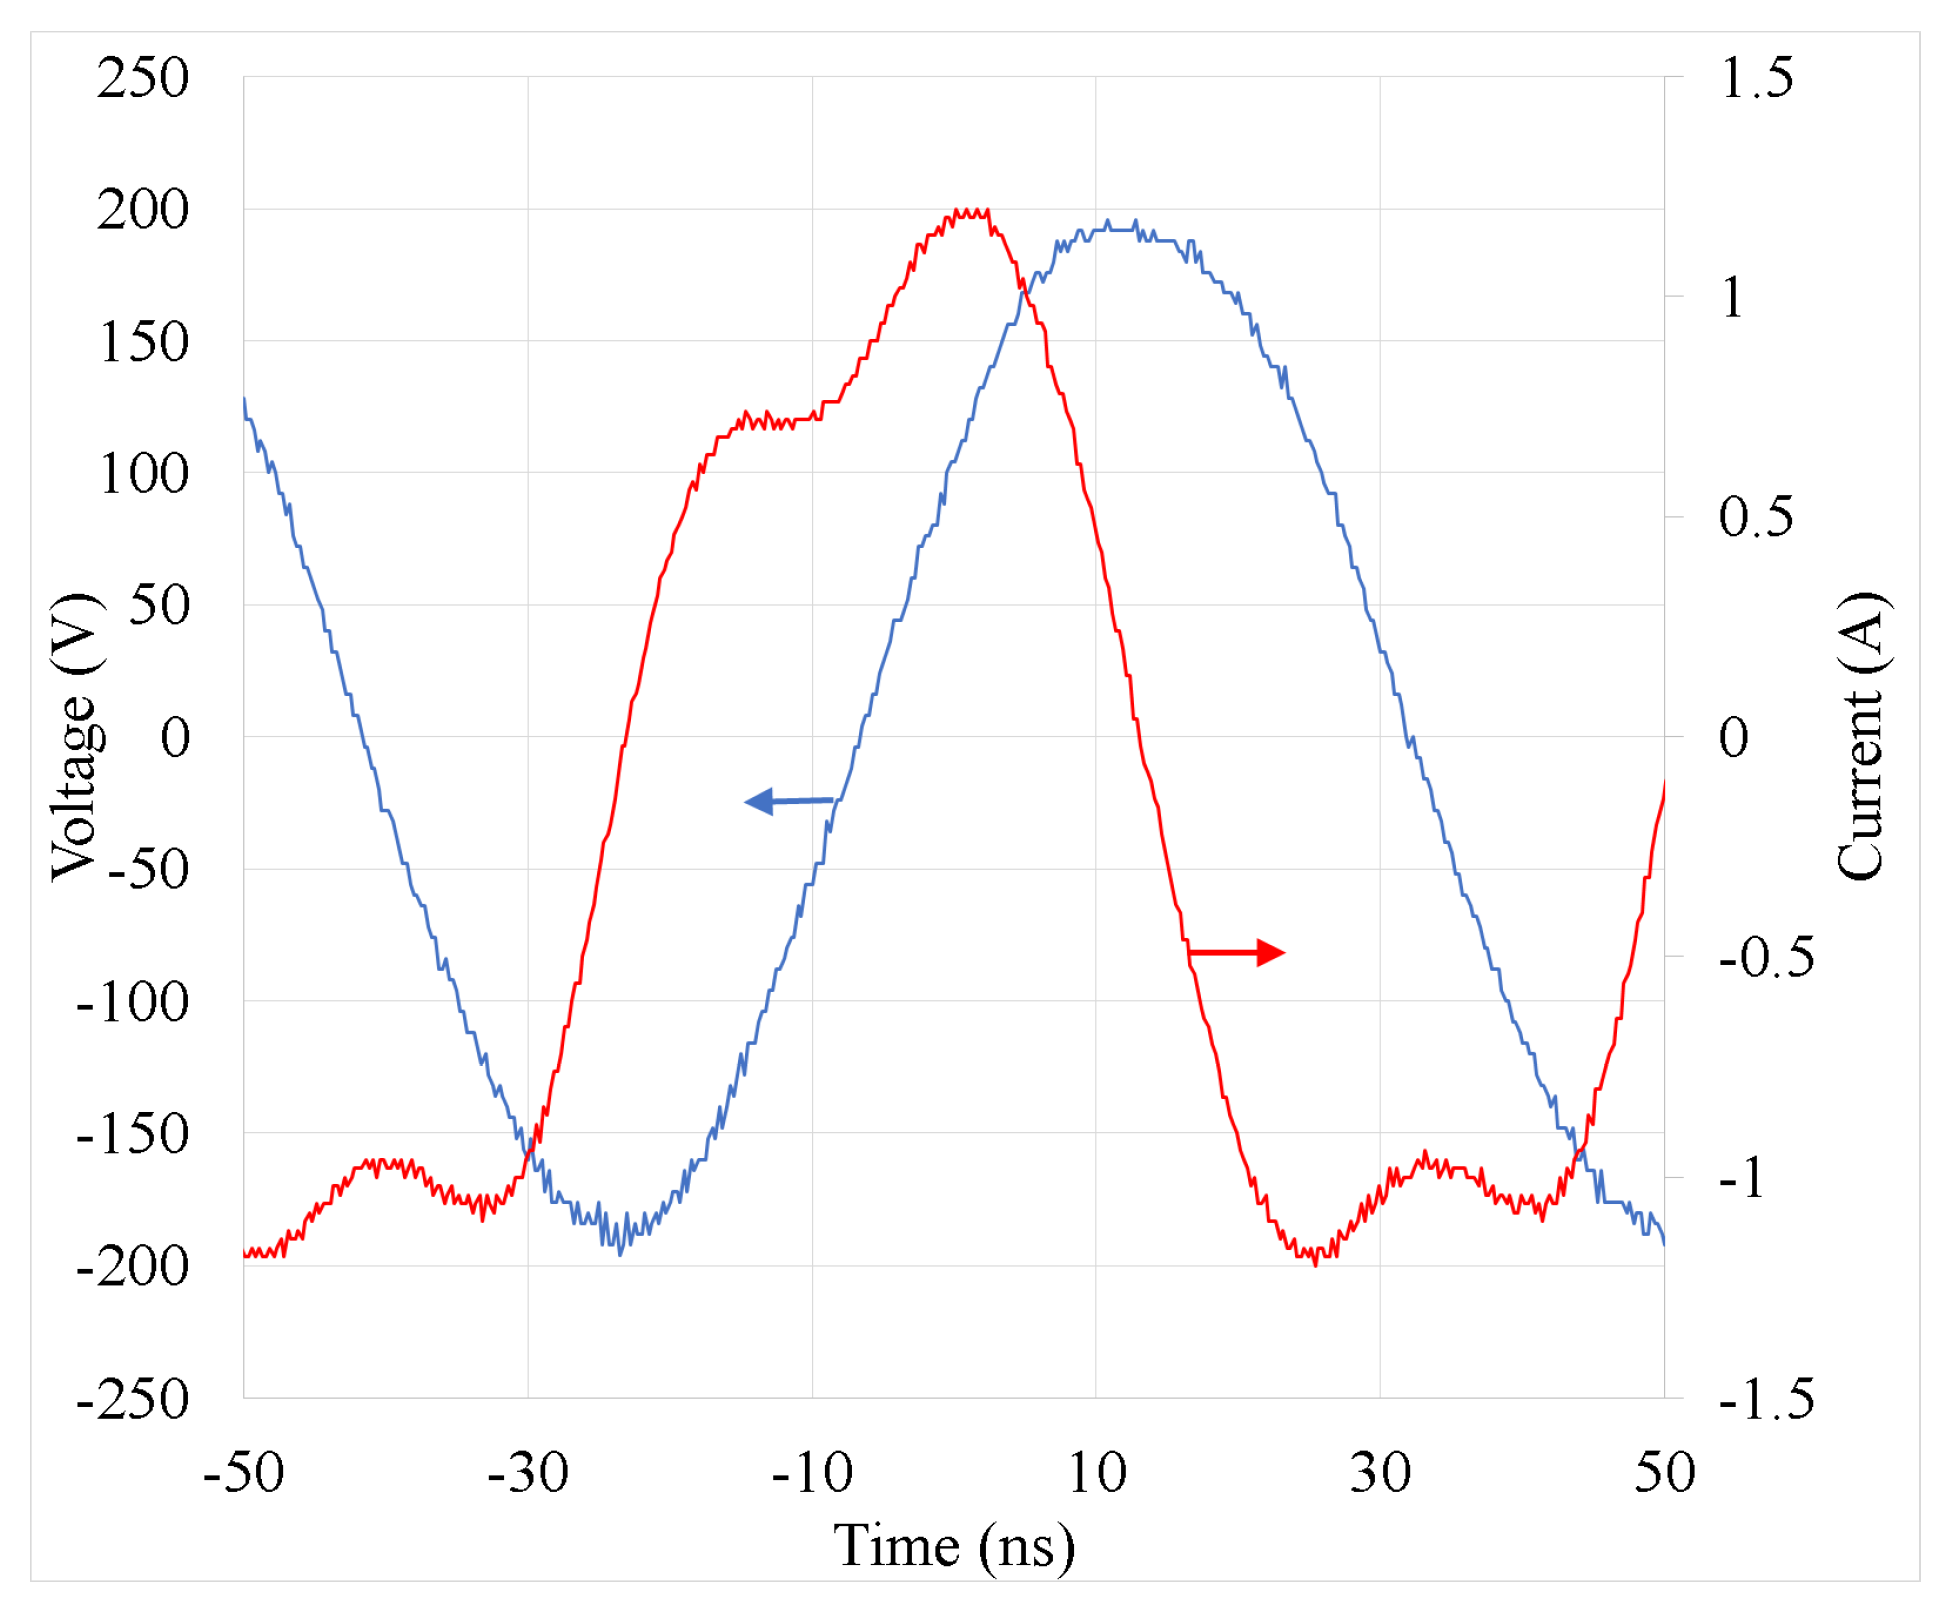
3.1.2. Electrical Characteristics

Plasma power was calculated from the current and voltage waveforms as described in our previous study [32]. When the plasma was produced at a low generator power, the waveforms exhibited a sinusoidal shape, similar to that observed without discharge. At a generator power of 30 W, the current waveform deviated significantly from a sinusoidal waveform, as shown in Figure 3. The irregular shape of the current waveform can be explained by the different areas of powered and grounded electrodes.
Plasma power was estimated using the formula P = 1 T 0 T i p t   u p t d t . The phase shift component caused by different lengths of the connecting cables, parasitic capacitance, etc., was determined from the measured u and i waveforms without discharge, and it was considered in the plasma power calculation. At a generator power of 30 W, the phase shift between i and u was 84.2 ± 1.0°, and the plasma power was 11.6 ± 1.8 W. The plasma power did not depend on the Ar plasma gas flow rate in the plasma tube (tested in the range of 100–300 sccm) or on the gas composition outside the plasma tube in the reactor. Hence, the plasma power was completely determined by the Ar discharge inside the plasma tube.

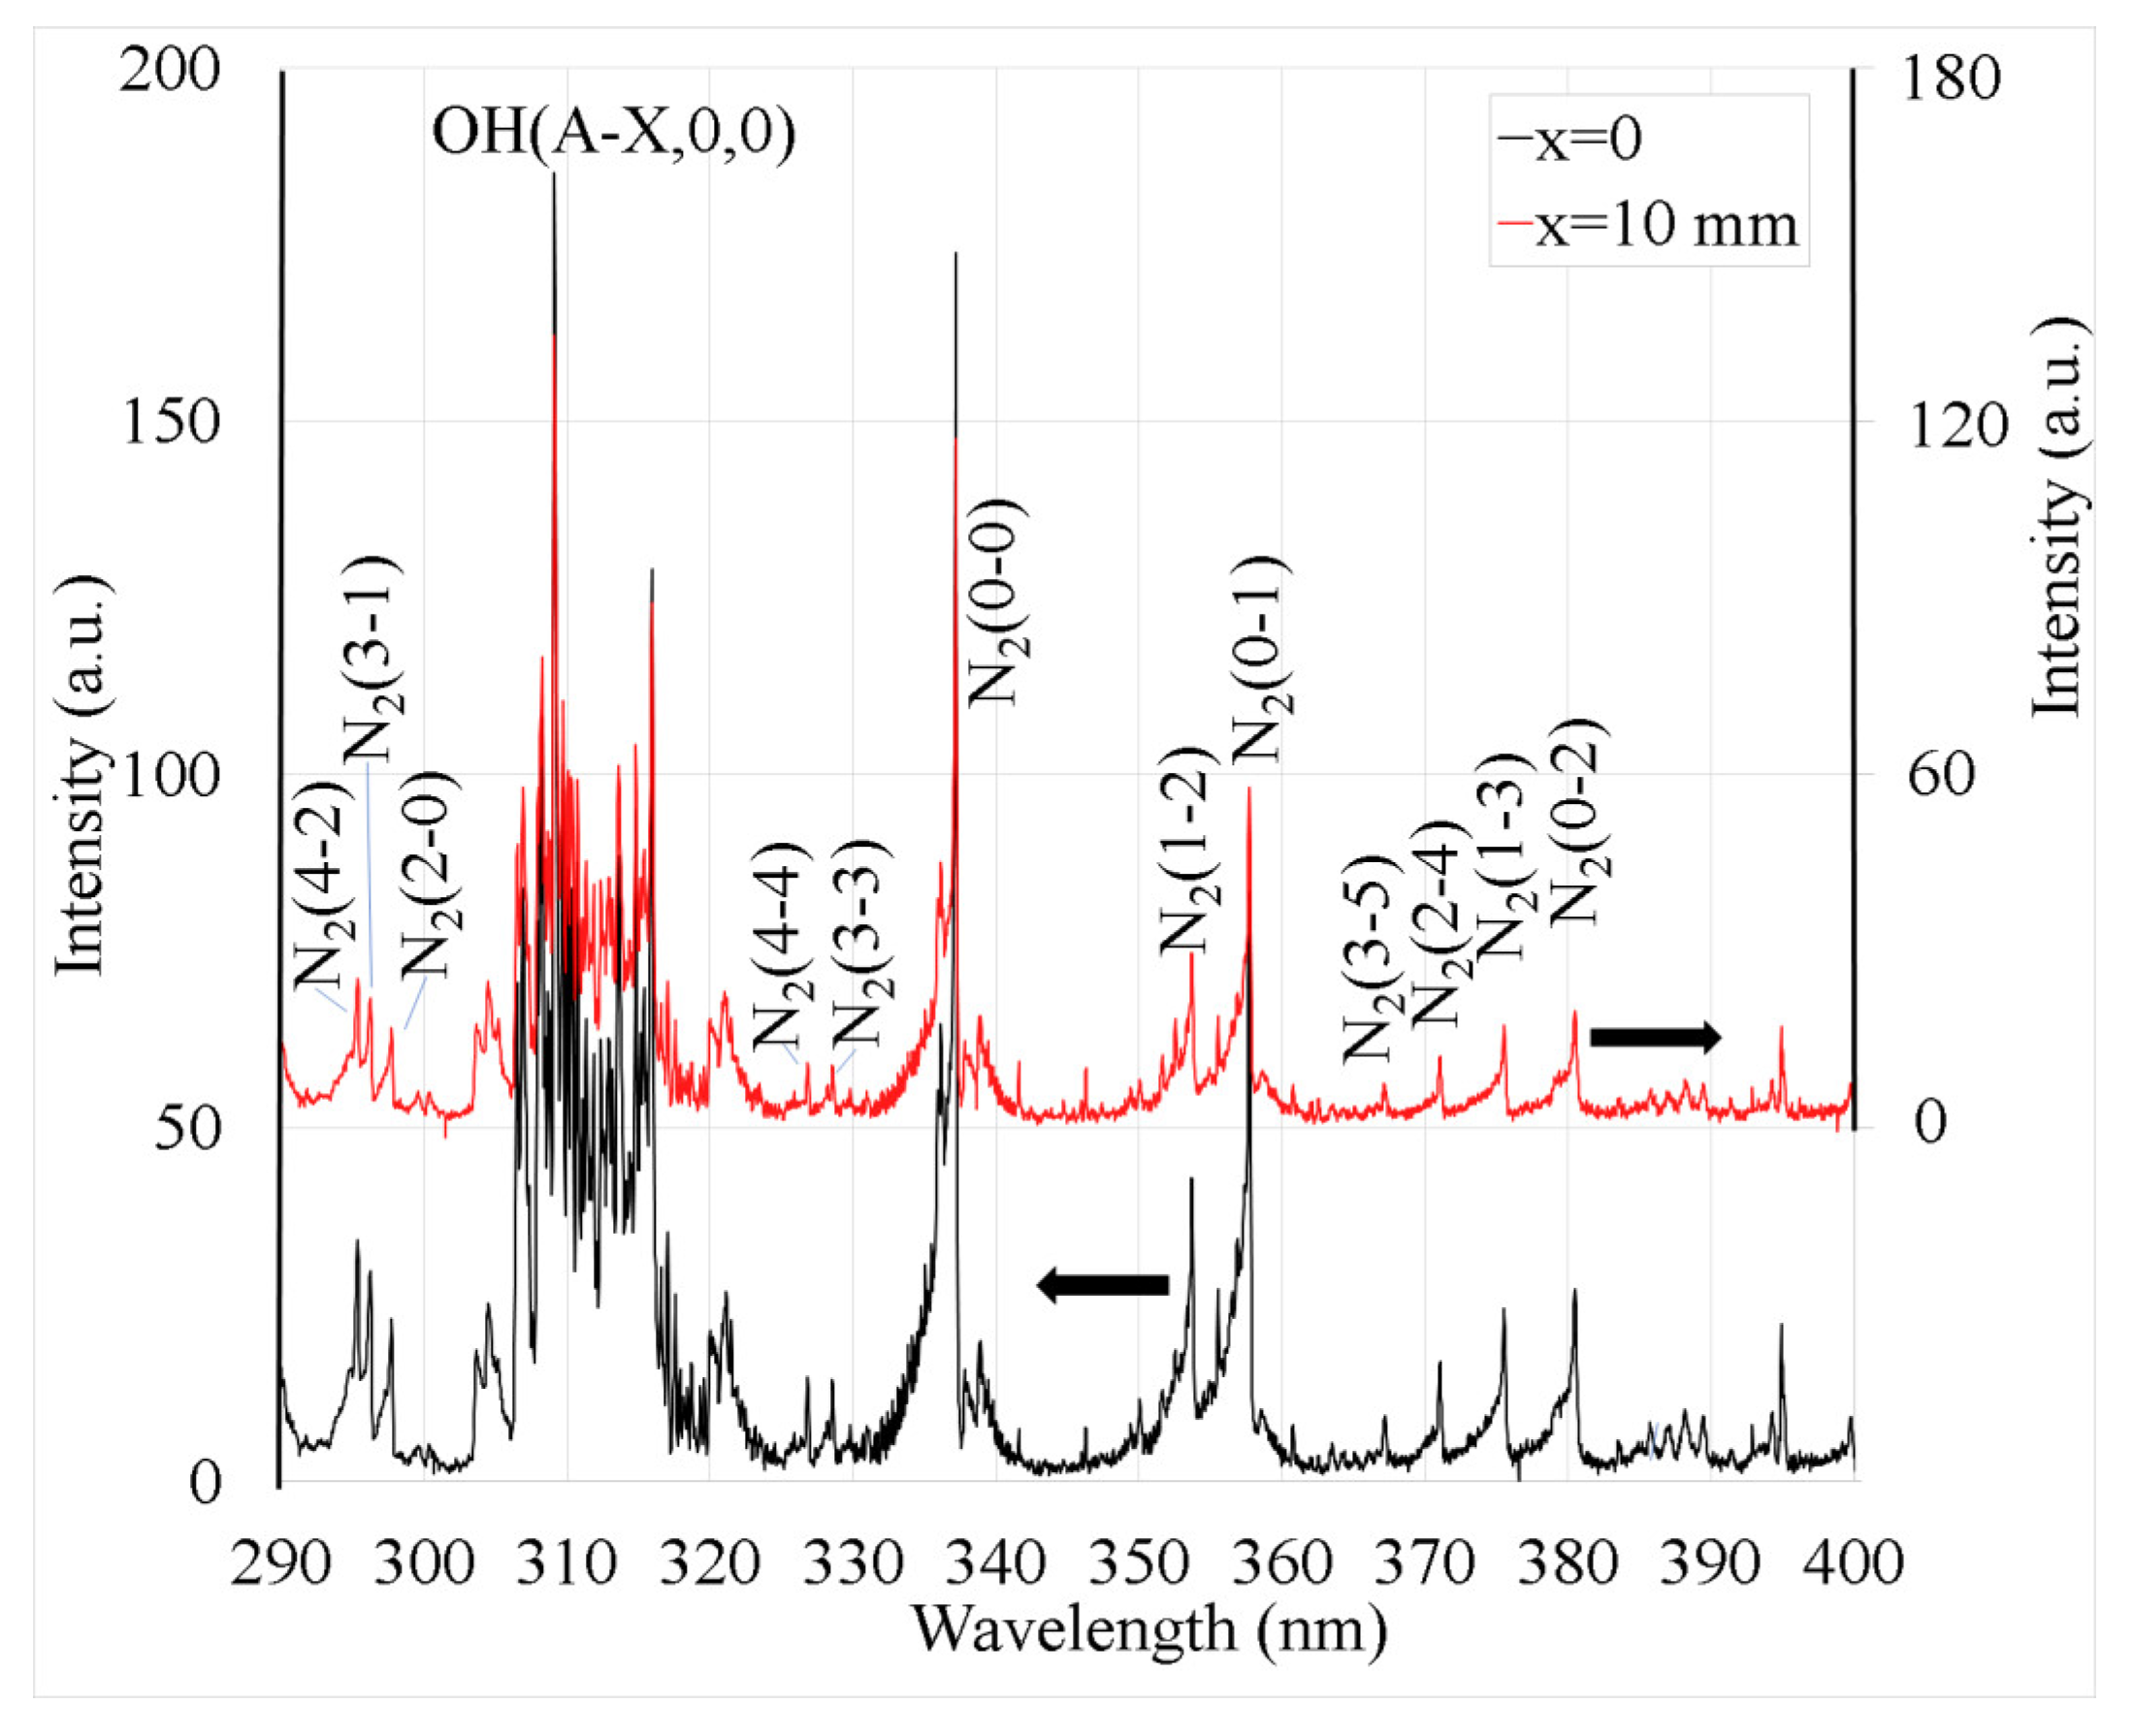
3.1.3. Plasma Spectrum

The optical emission spectra recorded at distances of 5 and 50 mm are shown in Figure 4a,b, respectively. In the case of the Ar plasma, the most intense spectral lines belonged to Ar. Because of the impurities in Ar (due to leakage, etc.), a weak atomic oxygen line at 777 nm, and bands of OH at 308 nm, a N2 first positive system (FPS) at 550–700 nm and a N2 second positive system (SPS) at 300–400 nm were observed. Deconvolution of the N2(C-B,0-0) band also revealed the presence of an NH(A-X,0-0) band at 336 nm (Figure S1). The start of the TMA pulse caused a rapid decrease in the intensity of the aforementioned molecular bands and atomic lines (Figure 4c, time interval Δt = 10–15 s). As a result of TMA (Al2(CH3)6) decomposition, bright Al lines at 308.22, 309.27, 394.40, and 396.15 nm [33] appeared in the spectra. During the following purge (Δt = 15–25 s), the intensity of the Ar lines and N2 bands gradually increased and became even more intense than before the ALD pulses, whereas the OH intensity decreased due to H2O removal in the reaction with TMA. The emission of CN radical at 358, 388, and 416 nm, CH at 386 and 431 nm, and C2 at 516.2 nm were identified from the molecular bands [34,35,36,37]. Interestingly, although the appearance of these bands is also related to TMA decay, they were not observed during the TMA pulse but during the TMA purge. A possible reason for this observation is the increase in electron temperature and density during the TMA purge, which enabled the production and excitation of these molecules. Similar to the TMA pulse, the H2O pulse (Δt = 25–30 s) reduced the intensities of all the spectral lines and N2 bands, with the exception of the OH band. The increased production of OH excited-state molecules can be attributed primarily to the reaction between Ar 1s2…5 atoms and H2O molecules [38,39,40]. During the purge following the H2O pulse (Δt = 30–40 s), the intensities of the Ar lines and N2 bands gradually increased, whereas the OH intensity reached a sharp maximum ~1 s after the end of the H2O pulse and then started to decrease.
With an increase in the distance x, the intensities of all bands and lines decreased; however, the general trends remained similar, as described above (Figure 4b,d).

3.1.4. Gas Temperature

The plasma gas temperature (Tgas) was estimated using various methods. First, Tgas was estimated based on the N2(C) rotational temperature (Trot) calculated for several vibrational transitions, as described in our previous study [41]. In the case of electron impact excitation of N2(C), TrotTgas. However, in Ar discharges, Trot of these molecules could be influenced by the energy transfer from the metastable Ar atoms, which can result in remarkably higher Trot values than Tgas [41]. The rotational temperatures of the N2 SPS vibrational transitions 0-2 (bandhead at 380 nm), 1-3 (375 nm), and 2-4 (371 nm) (Figure 5) were estimated for Ar discharge (after a long-term Ar purge) to reduce the interference of TMA/H2O additives on the rotational spectra. The temperature near the plasma tube orifice estimated under such conditions is expected to be somewhat higher than that during ALD pulses because the plasma plume extension outside the plasma tube was the largest in the case of pure Ar discharge, and the plasma power was insensitive to the gas composition outside the plasma tube (Section 3.1.2).
Examples of the recorded and calculated spectra of the N2 SPS vibrational transitions 0-2 and 2-4 are shown in Figure 6a. The lowest rotational temperature, Trot ≈ 450 ± 100 K, among the studied N2 SPS vibrational transitions was found for N2(C,v = 2) near the plasma tube orifice (x = 0 mm), and it diminished with increasing distance (Figure 6b). At x > 10 mm, the N2(C-B,2-4) band intensity was too low to estimate temperature reliably.
Considerably higher Trot values were found for the N2(C,v < 2) vibrational states, reaching ≈ 1300 K for N2(C,v = 0) and ≈1100 K for N2(C,v = 1) (Figure 6b). This dependence of Trot on the number of vibrational states v can be explained by the excitation transfer from the Ar excited state atoms A r 1 s 2 5 + N 2 X A r + N 2 ( C ) , which can cause an overpopulation of higher rotational levels when comparing the population distribution corresponding to equilibrium with Tgas [41]. From an energetic perspective, the ability to populate higher rotational states via this reaction decreases for higher values of v, as shown in the inset of Figure 6b, and the reaction rate coefficient also decreases with the vibrational number. For example, at 300 K, the ratio of the rate coefficients for the population v = 0, 1, and 2 states is 1:0.25:0.1 [42]. Therefore, with trace amounts of N2 in Ar plasmas, lower vibrational levels are more susceptible to the overpopulation of higher rotational levels than higher vibrational levels. At higher pressures, the neutral particle collisions can still thermalize the rotational population distribution even for the vibrational state N2(C,v = 0) and enable Trot to be used as a Tgas estimate [43]. At the low pressure used in our experiment, the thermalization is apparently too slow, and Trot from N2(C,v < 2) overestimates Tgas.
An attempt to determine Tgas was made using the OH(A-X,0-0) transition, which has been used to estimate Tgas at higher pressures [44]. In our spectra, the OH(A-X,0-0) band at 307 nm is one of the brightest peaks during the H2O pulse and the following purge (Figure 4). Similar to N2(C,v < 2), higher rotational levels of OH(A,0) can be excited by energy transfer from excited Ar atoms, which results in Trot higher than that expected from Tgas [39]. The radiative lifetime of OH(A,v = 0) is remarkably longer than that of the N2 SPS bands [41]. Therefore, the rotational relaxation can still be expected to achieve a population distribution equilibrium with Tgas. However, in our plasma, OH(A, v = 0) Trot also overestimated Tgas, as the temperature determined using Lifbase 2.1 software [45], Trot(x = 0) = 1300 K, was remarkably higher than that of N2(C,v = 2). Consequently, the relaxation was still too slow at the gas pressure used in our ALD reactor.
The gas temperature was additionally estimated by analyzing the absorption shape of the 763.5 nm line, which was determined using the TDLAS technique. The shape of the line depends on Tgas [46,47], and the temperature estimation procedure is described below Figure S2. The remarkable fluctuation in the laser emission of our TDLAS setup (Figure S3) and the low signal-to-noise ratio prevented the reliable determination of Tgas as a function of distance x. At x = 0, the determined temperature was 700 ± 200 K (Figure S2). This coincided with Trot of N2(C,v = 2) within the uncertainty margins.
Knowledge of plasma power also allows a rough estimation of Tgas [48]. Under stationary conditions, T g a s = T E + w n 0 · C p · ν H , where TE is the temperature of the plasma tube wall, w 0.14 W cm−3 is the power density, n0 is the gas density, Cp ≈ 3.3 × 10⁻²³ J/K is the specific heat of Ar at constant pressure per atom, and ν H = 8 · λ A r n 0 · c p · r 2 + 2 · v g a s L is the heat removal frequency. Here, λ A r is the thermal conductivity of Ar (0.0177 W/(K · m)), r = 8 mm is the inner radius of the plasma tube, vgas is the linear velocity of the gas (5.9 m/s) in the plasma tube, and L = 500 mm is the length of the plasma tube. The first and second terms in the formula used for the calculation of ν H provide the heat removal frequency by heat conduction and convective heat transport, respectively. Under our conditions, the contribution of heat removal by convective heat transport was ≈ 2.3%. Therefore, Tgas depended only slightly on n0. Presuming TE is stabilized at room temperature, the calculated Tgas near the plasma tube orifice is Tgas ≈ 360 K. Actually, TE is probably higher owing to the poor cooling of the plasma tube; however, it is expected to be lower than the maximum temperature of the O-rings of our vacuum system (ERIKS’ 51,414 green, Tmax = 473 K). This gives the upper limit of Tgas as 540 K, which also coincides with the Trot of N2(C,v = 2) within the uncertainty margins. Therefore, in the following, we used the Trot of N2(C,v = 2) as Tgas.

3.1.5. Line-Integrated Concentration of Ar Metastable 1s5 State Atoms

The concentration of metastable Ar 1s5 state atoms ([Ar(1s5]) was determined in the Ar discharge on the basis of Ar spectral line λ0 = 763.5106 nm [33] absorption (transition 1s5  2p6) using the TDLAS technique [46]. The estimation was performed between distances of 0–10 mm, because, at x > 10 mm, the absorption was below the detection limit of the TDLAS apparatus. The optical depth (OD) (Figure 7a) was determined as O D = l n I 0 I t = k λ · l , where It and I0 are the laser intensities with and without plasma, respectively, and k and l are the absorption coefficient and absorption length, respectively.
The concentration of Ar(1s5) state atoms was calculated using the experimentally determined OD according to the formula A r ( 1 s 5 ) = 8 · π · g i · c λ 0 4 · g j · A i j · l k ( λ ) · l · d λ [46]. Here, gi = 5 and gj = 5 are the statistical weights of the upper and lower states, respectively; c is the speed of light; Aij = 2.45 × 10⁷ s−1 [33] is the Einstein coefficient; and l = 20 mm is the absorption length. The concentration of Ar(1s5) atoms decreased almost exponentially with increasing x from 4.5 × 10¹⁰ to 4 × 109 cm−3 when x increased from 0 to 10 mm.
The introduction of any ALD precursor caused a decrease in the concentration of Ar(1s5) to below the detection limit of our TDLAS apparatus. However, the spectral measurements indicated that, during the TMA and H2O pulses, the Ar(1s2…5) concentrations were very low. Compared with the other Ar spectral lines, the intensity of the Ar line at 750.4 nm was less sensitive to the introduction of TMA and H2O. The rate coefficient for the population of the upper state of this transition, 2p1, via the direct electron impact excitation from the ground state, is higher than that for other 2p-1s transitions observed in the spectra; for other transitions, stepwise excitation from Ar 1s2…5 is more important [49]. As an example, Figure 2 shows the intensities of spectral lines at 750.4 (transition 2p1 → 1s2) and 751.5 nm (transition 2p5 → 1s4) registered from Ar plasma and during a TMA pulse. The 751.4 nm line was more intense in the Ar discharge prior to the ALD pulses and also during the purge periods, but during the TMA and H2O pulse the 750.4 nm line dominated. Notably, the ratio of the rate coefficients for direct electron impact excitation to 2p1 and 2p5 was approximately 2 [49] in the electron temperature range Te = 2.5–3.5 eV. This is close to the intensity ratio of the transitions 2p1 → 1s2 and 2p5 → 1s4 (Figure 2b). Considering similar Einstein coefficients of these transitions (A750.4 = 4.5 × 10⁷s−1; A751.5 = 4.0 × 10⁷s−1 [33]), this finding indicates negligible stepwise excitation of Ar states during the TMA and H2O pulse due to the very efficient quenching of the 1s2…5 states.

3.2. Effect of Plasma on Film Properties

The ALD process used for the deposition of films for post-growth studies consisted of 1000 ALD cycles. Each cycle contained the following steps: TMA pulse (duration 2 s), purge (2 s), H2O pulse (2 s), and purge (5 s); it was possible to switch the plasma on for any step. Our previous study [31] revealed that plasma applied during the TMA pulse caused TMA decomposition, resulting in low-density amorphous Al2O3 films. It was also found that plasma had a detrimental effect on crystal growth when applied during TMA purge, whereas, in this case, the film growth per cycle (GPC) and density were similar to those of thermal ALD. As indicated by the intensity decay of the Al spectral lines (Figure 4c), the TMA residuals were removed from the gas within 1–2 s of the TMA pulse. Similarly, fast TMA removal after the TMA pulse was also concluded from Q-pod quartz crystal microbalance (QCM) measurements [31]. With a decrease in the intensity of the Al lines during the TMA purge, CH, CN, and C2 bands appeared in the spectrum (Figure 4c) and were observed throughout the TMA purge step. The appearance of these bands, but not Al lines, indicates that plasma applied during the TMA purge caused decomposition of surface intermediate species formed during the TMA (Al2(CH3)6) pulse. The decomposition of surface species led to the formation of excited CH, CN, and C2 molecules via plasma–chemical reactions involving desorbed CHx species. The Al atoms remained on the surface, which explains why the GPC and density of the film were not affected by the plasma applied during the purge following the TMA pulse.
The plasma excitation, applied during the purge following the H2O pulse or during the H2O pulse and the following purge, most significantly contributed to the increase in the density and crystallization of the Al2O3 films grown on the α-Cr2O3 seed layers. This effect enabled us to obtain α-Al2O3 in films deposited at 600 K (Figure 8).
The film growth depended on the distance between the samples and the orifice of the plasma tube. At x = 20 mm, the plasma applied during the purge following the H2O pulse significantly enhanced the growth of α-Al2O3, as shown in Figure 9. In contrast, the GIXRD diffractograms of the films deposited via PEALD and thermal ALD at x = 70 mm were similar. Consequently, the influence of plasma on crystal growth was negligible in the latter case.
Our previous study showed that, compared with the purge following the TMA pulse, a markedly longer purge period was needed after the H2O pulse to obtain self-limited film growth [31]. Spectral measurements in the present study confirmed this result, as the OH band intensity decay after the H2O pulse was substantially slower than that of the Al lines observed after the TMA pulse (Figure 4). The likely reason for this is the gradual release of H2O to the gas phase from the surface due to the reaction between the OH groups formed during the H2O pulse [50]:
2 O H a d s . O a d s . + H 2 O ( g a s )
and the subsequent formation of excited OH in gas-phase reactions, as explained in Section 3.1.3. As the surface hydroxyl groups are absorption sites for TMA [51], the decrease in the site concentration on the surface causes a reduction in GPC. The plasma applied during the H2O purge caused a significant (~10%) decrease in GPC compared with that obtained via thermal ALD (Table 1). However, the density of the film deposited via PEALD on the substrates located at x = 20 mm was approximately 7% higher than the densities of other films (Table 1). Thus, the plasma applied during the H2O purge insignificantly influenced the mass growth per cycle (MGPC) at x = 20 mm; at x = 70 mm, the effect of plasma on MGPC was considerable.
A possible explanation for this difference is the plasma enhancement of the reaction described by Equation (1) and the re-adsorption of OH radicals formed in the plasma. At x = 20 mm, the concentration of OH radicals in the gas phase was probably high enough to compensate for the loss of surface OH groups; at x = 70 mm, this kind of compensation was evidently not obtained. As the concentration of OH in the gas phase could not be very high, even at x = 20 mm, the re-adsorption was obviously a site-sensitive process supporting crystallization. With increasing x, the concentration of OH in the gas phase decreased (Figure 4); therefore, the contribution of OH re-adsorption to the crystal growth also decreased and became negligible.
The effect of possible plasma heating that could also promote the crystallization and influence GPC is not probable because the GPC values of the films deposited at higher gas temperatures (inside the plasma plume at x = 20 mm) and at lower gas temperatures (at x = 70 mm) are the same; although, according to the results of our previous study, the GPC should considerably decrease with increasing TG. For example, the increase in TG from 620 to 650 K caused the GPC to decrease from 0.115 to 0.089 nm [31]. In addition, the plasma turned on during the purge period following the TMA pulse did not cause changes in the GPC.
A possible explanation for the fast decay of the plasma effect on crystallization, observed with increasing x, is the corresponding decrease in the concentration of reactive species and the short lifetime of those species. The formation of long-living H2O2 has also been observed in plasma at atmospheric pressure in the presence of water vapor [52]. However, under our conditions, the corresponding reaction is relatively slow (rate coefficient k1 ≈ 4 × 10⁻¹⁴ cm3s−1 at 400 K [53]).The lifetime of OH appears to determine the concentration profile of the reactive species in the gas phase. Although the quenching of the ground state OH radical, OH(X), is slower than that of the OH(A) state [54,55], the convective transport of OH(X) from the OH-rich plasma plume region to the sample location at x = 70 mm is still unlikely. For example, in the case of an Ar: 9% H2O mixture plasma at 200 Torr pressure, the OH density decay to 10% took up approximately 500 µs, whereas the OH diffusion losses were insignificant [56]. Considering the 100 times lower pressure and linear velocity of gas in our reactor (1.1 m/s), such decay occurs within 55 mm. Actually, this distance is expected to be even smaller as, at our low pressure, additional OH diffusion losses should be significant. Spectral measurements that revealed a rapid decrease in the OH intensity and, consequently, in the OH concentration with increasing x (Figure 4c,d) confirmed this estimation.

4. Conclusions

The present study investigated the properties of low-pressure argon RF plasma used in the plasma-enhanced atomic layer deposition of Al2O3 films. The plasma power, estimated from the recorded electrical characteristics, was approximately 12 W. The argon metastable atom density in pure Ar plasma decreased 10 times with increasing distance from the plasma tube orifice from 0 to 10 mm. The addition of the ALD precursors reduced the density of metastable atoms to a level below the detection limit of the apparatus used. The gas temperature was estimated using the N2(C,v = 2) rotational temperature, which was near the plasma tube orifice ≈ 400 K. Plasma spectra, measured during the TMA pulse, revealed TMA disintegration, as concluded from the appearance of Al lines and CN(B-X) bands. The H2O pulse caused a rapid increase in the intensity of the OH(A-X,0-0) band, indicating effective OH production.
In respect to Al2O3 film crystallization, the following conclusions are drawn:
(i)
Under our conditions, the plasma gas temperature does not affect Al2O3 crystallization.
(ii)
The main plasma agents that helped Al2O3 crystallization were OH radicals. Plasma-enhanced Al2O3 crystallization was observed only for samples located near the plasma tube orifice, inside the plasma plume where the OH concentration was high. Because of the rapid decay in the OH concentration with distance, the plasma effect on crystallization was negligible at 70 mm from the tube orifice.

Supplementary Materials

The following supporting information can be downloaded at: https://0-www-mdpi-com.brum.beds.ac.uk/article/10.3390/pr12030612/s1, Figure S1: NH(A-X,0-0) band spectrum. Figure S2: Temperature estimation from Ar (1s5 2p6) line shape analysis. Figure S3: TDLAS laser stability on the basis of Fabry–Pérot interferometer signal. (See Refs. [33,47,57]).

Author Contributions

Conceptualization, L.A. and J.A.; methodology, L.A., J.A. and J.R.; software, C.-T.P. and J.R.; validation, C.-T.P., J.R., L.A., I.J., R.T. and J.A.; formal analysis, C.-T.P., J.R., L.A., I.J., R.T. and J.A.; investigation, C.-T.P., J.R. and L.A.; resources, L.A.; data curation, C.-T.P. and J.R.; writing—original draft preparation, J.R.; writing—review and editing, C.-T.P., J.R., L.A., I.J., R.T. and J.A.; visualization, C.-T.P., J.R. and. L.A.; supervision, J.R. and L.A.; project administration, L.A.; funding acquisition, L.A. All authors have read and agreed to the published version of the manuscript.

Funding

This research was funded by Estonian Research Council grant PSG448.

Data Availability Statement

Data will be made available upon reasonable request.

Acknowledgments

The authors are thankful to Alma-Asta Kiisler and Aivar Tarre for technical assistance and to Hugo Mändar for access to X-ray analysis equipment and software.

Conflicts of Interest

The authors declare that they have no known competing financial interests or personal relationships that could have appeared to influence the work reported in this paper.

References

  1. Carcia, P.F.; Mclean, R.S.; Li, Z.G.; Reilly, M.H.; Marshall, W.J. Permeability and corrosion in ZrO2/Al2O3 nanolaminate and Al2O3 thin films grown by atomic layer deposition on polymers. J. Vac. Sci. Technol. A 2012, 30, 041515. [Google Scholar] [CrossRef]
  2. Correa, G.C.; Bao, B.; Strandwitz, N.C. Chemical Stability of Titania and Alumina Thin Films Formed by Atomic Layer Deposition. ACS Appl. Mater. Interfaces 2015, 7, 14816–14821. [Google Scholar] [CrossRef] [PubMed]
  3. Meyer, A.R.; Chaukulkar, R.P.; Leick, N.; Nemeth, W.; Young, D.L.; Stradins, P.; Agarwal, S. Chemical Passivation of Crystalline Si by Al2O3Deposited Using Atomic Layer Deposition: Implications for Solar Cells. ACS Appl. Nano Mater. 2021, 4, 6629–6636. [Google Scholar] [CrossRef]
  4. Dingemans, G.; Kessels, W.M.M. Status and Prospects of Al2O3-Based Surface Passivation Schemes for Silicon Solar Cells. J. Vac. Sci. Technol. A Vac. Surf. Film. 2012, 30, 040802. [Google Scholar] [CrossRef]
  5. Kim, J.; Lim, J.W.; Kim, G.; Shin, M. Effects of Moisture-Proof Back Passivation Layers of Al2O3 and AlxTi1-xOy Films on Efficiency Improvement and Color Modulation in Transparent A-Si:H Solar Cells. ACS Appl. Mater. Interfaces 2021, 13, 4968–4974. [Google Scholar] [CrossRef] [PubMed]
  6. Liu, H.; Ma, P.; Pu, Y.; Zhao, Z. Atomic Layer Deposition of Al2O3 and HfO2 for High Power Laser Application. J. Alloys Compd. 2021, 859, 157751. [Google Scholar] [CrossRef]
  7. Ćirić, A.; Stojadinović, S.; Dramićanin, M.D. Luminescence of Ti-Sapphire Coatings Prepared by Plasma Electrolytic Oxidation and Their Application in Temperature Sensing. J. Alloys Compd. 2022, 900, 163544. [Google Scholar] [CrossRef]
  8. Song, H.; Song, Y.J.; Hong, J.; Kang, K.S.; Yu, S.; Cho, H.E.; Kim, J.H.; Lee, S.M. Water Stable and Matrix Addressable OLED Fiber Textiles for Wearable Displays with Large Emission Area. npj Flex. Electron. 2022, 6, 66. [Google Scholar] [CrossRef]
  9. Lien, Y.C.; Wu, T.T.; Wong, S.S. 3-D Vertical via Nitrogen-Doped Aluminum Oxide Resistive Random-Access Memory. IEEE Trans. Electron. Devices 2021, 68, 2712–2716. [Google Scholar] [CrossRef]
  10. Broas, M.; Kanninen, O.; Vuorinen, V.; Tilli, M.; Paulasto-Kröckel, M. Chemically Stable Atomic-Layer-Deposited Al2O3 Films for Processability. ACS Omega 2017, 2, 3390–3398. [Google Scholar] [CrossRef]
  11. Chen, Y.Z.; Bovet, N.; Kasama, T.; Gao, W.W.; Yazdi, S.; Ma, C.; Pryds, N.; Linderoth, S. Room Temperature Formation of High-Mobility Two-Dimensional Electron Gases at Crystalline Complex Oxide Interfaces. Adv. Mater. 2014, 26, 1462–1467. [Google Scholar] [CrossRef] [PubMed]
  12. Ngo, T.Q.; Goble, N.J.; Posadas, A.; Kormondy, K.J.; Lu, S.; McDaniel, M.D.; Jordan-Sweet, J.; Smith, D.J.; Gao, X.P.A.; Demkov, A.A.; et al. Quasi-Two-Dimensional Electron Gas at the Interface of γ-Al2O3/SrTiO3 Heterostructures Grown by Atomic Layer Deposition. J. Appl. Phys. 2015, 118, 2–9. [Google Scholar] [CrossRef]
  13. Aarik, L.; Mändar, H.; Tarre, A.; Piirsoo, H.M.; Aarik, J. Mechanical Properties of Crystalline and Amorphous Aluminum Oxide Thin Films Grown by Atomic Layer Deposition. Surf. Coat. Technol. 2022, 438, 128409. [Google Scholar] [CrossRef]
  14. Jin, P.; Xu, G.; Tazawa, M.; Yoshimura, K.; Music, D.; Alami, J.; Helmersson, U. Low Temperature Deposition of α-Al2O3 Thin Films by Sputtering Using a Cr2O3 Template. J. Vac. Sci. Technol. A Vac. Surf. Film. 2002, 20, 2134–2136. [Google Scholar] [CrossRef]
  15. Boris, D.R.; Wheeler, V.D.; Nepal, N.; Qadri, S.B.; Walton, S.G.; Eddy, C.C.R. The Role of Plasma in Plasma-Enhanced Atomic Layer Deposition of Crystalline Films. J. Vac. Sci. Technol. A Vac. Surf. Film. 2020, 38, 040801. [Google Scholar] [CrossRef]
  16. Chang, J.; Chang, J.P. Achieving Atomistic Control in Materials Processing by Plasma-Surface Interactions. J. Phys. D Appl. Phys. 2017, 50, 253001. [Google Scholar] [CrossRef]
  17. Faraz, T.; Arts, K.; Karwal, S.; Knoops, H.C.M.; Kessels, W.M.M. Energetic Ions during Plasma-Enhanced Atomic Layer Deposition and Their Role in Tailoring Material Properties. Plasma Sources Sci. Technol. 2019, 28, 024002. [Google Scholar] [CrossRef]
  18. Faraz, T.; Knoops, H.C.M.; Verheijen, M.A.; Van Helvoirt, C.A.A.; Karwal, S.; Sharma, A.; Beladiya, V.; Szeghalmi, A.; Hausmann, D.M.; Henri, J.; et al. Tuning Material Properties of Oxides and Nitrides by Substrate Biasing during Plasma-Enhanced Atomic Layer Deposition on Planar and 3D Substrate Topographies. ACS Appl. Mater. Interfaces 2018, 10, 13158–13180. [Google Scholar] [CrossRef]
  19. Profijt, H.B.; Kudlacek, P.; van de Sanden, M.C.M.; Kessels, W.M.M. Ion and Photon Surface Interaction during Remote Plasma ALD of Metal Oxides. J. Electrochem. Soc. 2011, 158, G88. [Google Scholar] [CrossRef]
  20. Knoops, H.C.M.; Faraz, T.; Arts, K.; Kessels, W.M.M. Status and Prospects of Plasma-Assisted Atomic Layer Deposition. J. Vac. Sci. Technol. A Vac. Surf. Film. 2019, 37, 030902. [Google Scholar] [CrossRef]
  21. Profijt, H.B.; Potts, S.E.; van de Sanden, M.C.M.; Kessels, W.M.M. Plasma-Assisted Atomic Layer Deposition: Basics, Opportunities, and Challenges. J. Vac. Sci. Technol. A Vac. Surf. Film. 2011, 29, 050801. [Google Scholar] [CrossRef]
  22. Wang, Z.B.; Li, J.T.; Zhu, X.M.; Pu, Y.K. Determination of the de-Excitation Probability of Argon Metastable (1s5 and 1s3) Atoms on Aluminum, Stainless Steel, Silicon, Quartz and Pyrex Surfaces. J. Phys. D Appl. Phys. 2015, 48, 105203. [Google Scholar] [CrossRef]
  23. Wheeler, V.D.; Nepal, N.; Boris, D.R.; Qadri, S.B.; Nyakiti, L.O.; Lang, A.; Koehler, A.; Foster, G.; Walton, S.G.; Eddy, C.R.; et al. Phase Control of Crystalline Ga2O3 Films by Plasma-Enhanced Atomic Layer Deposition. Chem. Mater. 2020, 32, 1140–1152. [Google Scholar] [CrossRef]
  24. Nepal, N.; Mahadik, N.A.; Nyakiti, L.O.; Qadri, S.B.; Mehl, M.J.; Hite, J.K.; Eddy, C.R. Epitaxial Growth of Cubic and Hexagonal InN Thin Films via Plasma-Assisted Atomic Layer Epitaxy. Cryst. Growth Des. 2013, 13, 1485–1490. [Google Scholar] [CrossRef]
  25. Fang, Z.; Williams, P.A.; Odedra, R.; Jeon, H.; Potter, R.J. Gadolinium Nitride Films Deposited Using a PEALD Based Process. J. Cryst. Growth 2012, 338, 111–117. [Google Scholar] [CrossRef]
  26. Fan, Q.; Sang, L.; Jiang, D.; Yang, L.; Zhang, H.; Chen, Q.; Liu, Z. Plasma Enhanced Atomic Layer Deposition of Cobalt Nitride with Cobalt Amidinate. J. Vac. Sci. Technol. A Vac. Surf. Film. 2019, 37, 010904. [Google Scholar] [CrossRef]
  27. Boris, D.R.; Wheeler, V.D.; Avila, J.R.; Qadri, S.B.; Eddy, C.R.; Walton, S.G. Role of Plasma Properties in Controlling Crystallinity and Phase in Oxide Films Grown by Plasma-Enhanced Atomic Layer Epitaxy. J. Vac. Sci. Technol. A Vac. Surf. Film. 2019, 37, 060909. [Google Scholar] [CrossRef]
  28. Raud, S.; Raud, J.; Aarik, L.; Jõgi, I.; Kivimäe, M.; Piller, C.T.; Plaas, M.; Plank, T.; Talviste, R.; Teesalu, T.; et al. The Production of Reactive Chlorine Species (RCS) by Argon and Helium Plasma Jets and the Sensitivity of Liver Cancer Cell HepG2 to RCS and H2O2 Treatment. Plasma Process. Polym. 2023, 20, e2300068. [Google Scholar] [CrossRef]
  29. Napari, M.; Tarvainen, O.; Kinnunen, S.; Arstila, K.; Julin, J.; Fjellvåg, S.; Weibye, K.; Nilsen, O.; Sajavaara, T. The α and γ Plasma Modes in Plasma-Enhanced Atomic Layer Deposition with O2-N2 Capacitive Discharges. J. Phys. D. Appl. Phys. 2017, 50, 095201. [Google Scholar] [CrossRef]
  30. Catalin, C.; Dumitrache, C.; Bazavan, M.; Mitu, B.; Marascu, V.; Stancu, S.; Vizireanu, S.; Dinescu, G. Maximization of RONS Generation by Selection of Gas Nature and Injection Type in One-Electrode Tubular RF Cold Plasma Source. In Proceedings of the 2nd Annual Meeting of COST Action PlasTHER “Therapeutical Applications of Cold Plasmas”, Bologna, Italy, 4–7 September 2023. [Google Scholar]
  31. Aarik, L.; Piller, C.T.; Raud, J.; Talviste, R.; Jõgi, I.; Aarik, J. Atomic Layer Deposition of α-Al2O3 from Trimethylaluminum and H2O: Effect of Process Parameters and Plasma Excitation on Structure Development. J. Cryst. Growth 2023, 609, 6–11. [Google Scholar] [CrossRef]
  32. Jõgi, I.; Raud, J.; Hein, K.; Laan, M. Spectral Characterization of Medium-Pressure RF Discharge in Argon-Oxygen Mixture. J. Phys. D Appl. Phys. 2014, 47, 335206. [Google Scholar] [CrossRef]
  33. Kramida, A.; Ralchenko, Y.; Reader, J.; NIST ASD Team NIST. Atomic Spectra Database. Available online: https://physics.nist.gov/asd (accessed on 17 January 2024).
  34. Rezaei, F.; Gorbanev, Y.; Chys, M.; Nikiforov, A.; Van Hulle, S.W.H.; Cos, P.; Bogaerts, A.; De Geyter, N. Investigation of Plasma-Induced Chemistry in Organic Solutions for Enhanced Electrospun PLA Nanofibers. Plasma Process. Polym. 2018, 15, 1700226. [Google Scholar] [CrossRef]
  35. Thimsen, E.; Kortshagen, U.R.; Aydil, E.S. Nonthermal Plasma Synthesis of Metal Sulfide Nanocrystals from Metalorganic Vapor and Elemental Sulfur. J. Phys. D. Appl. Phys. 2015, 48, 314004. [Google Scholar] [CrossRef]
  36. Kokai, F.; Yamamoto, K.; Koga, Y.; Fujiwara, S.; Heimann, R.B. Characterization of Ablation Plumes and Carbon Nitride Films Produced by Reactive Pulsed Laser Deposition in the Presence of a Magnetic Field. Appl. Phys. A Mater. Sci. Process. 1998, 66, 403–406. [Google Scholar] [CrossRef]
  37. Pearse, R.W.B.; Gaydon, A.G. The Identification of Molecular Spectra, 2nd ed.; Chapman & Hall LTD.: London, UK, 1950. [Google Scholar]
  38. Morozov, A.; Krücken, R.; Ottenthal, T.; Ulrich, A.; Wieser, J. Ultraviolet Emission from Argon Water-Vapor Mixtures Excited with Low-Energy Electron Beams. Appl. Phys. Lett. 2005, 86, 3–5. [Google Scholar] [CrossRef]
  39. Tabayashi, K.; Shobatake, K. Dissociative Excitation of Water by Metastable Rare Gas Atoms: Rg(3P0,2) +H2O→Rg+OH(A 2Σ+) +H (Rg=Ar,Kr). J. Chem. Phys. 1988, 88, 835–844. [Google Scholar] [CrossRef]
  40. Mikhailov, D.V.; Pastor, A.A.; Serdobintsev, P.Y.; Timofeev, N.A.; Khodorkovskii, M.A. Discharge Plasma in an Argon–water Vapor Mixture as a Gas Laser Medium. Russ. J. Phys. Chem. B 2015, 9, 593–595. [Google Scholar] [CrossRef]
  41. Raud, J.; Laan, M.; Jõgi, I. Rotational Temperatures of N2(C,0) and OH(A,0) as Gas Temperature estimates in the Middle Pressure Ar/O2 Discharge. J. Phys. D Appl. Phys. 2011, 44, 345201. [Google Scholar] [CrossRef]
  42. Nguyen, T.D.; Sadeghi, N. Rotational and Vibrational Distributions of N2(C) Excited by State-Selected Ar(3P2) and Ar(3P0) Metastable Atoms. Chem. Phys. 1983, 79, 41–55. [Google Scholar] [CrossRef]
  43. Yuji, T.; Suzaki, Y.; Yamawaki, T.; Sakaue, H.; Akatsuka, H. Experimental Study of Temperatures of Atmospheric-Pressure Nonequilibrium Ar/N2 Plasma Jets and Polyethylene Terephtalate-Surface Processing. Jpn. J. Appl. Phys. Part 1 Regul. Pap. Short Notes Rev. Pap. 2007, 46, 795–798. [Google Scholar] [CrossRef]
  44. Xiong, Q.; Nikiforov, A.Y.; Lu, X.P.; Leys, C. High-Speed Dispersed Photographing of an Open-Air Argon Plasma Plume by a Grating-ICCD Camera System. J. Phys. D Appl. Phys. 2010, 43, 415201. [Google Scholar] [CrossRef]
  45. Luque, J.; Crosley, D.R. LIFBASE: Database and Spectral Simulation Program (Version 1.6). SRI International Report MP-99-009 (1999). Available online: https://www.sri.com/platform/lifbase-spectroscopy-tool (accessed on 21 March 2023).
  46. Miura, N.; Hopwood, J. Spatially Resolved Argon Microplasma Diagnostics by Diode Laser Absorption. J. Appl. Phys. 2011, 109, 2458–2464. [Google Scholar] [CrossRef]
  47. Muñoz, J.; Dimitrijević, M.S.; Yubero, C.; Calzada, M.D. Using the van Der Waals Broadening of Spectral Atomic Lines to Measure the Gas Temperature of an Argon-Helium Microwave Plasma at Atmospheric Pressure. Spectrochim. Acta—Part B At. Spectrosc. 2009, 64, 167–172. [Google Scholar] [CrossRef]
  48. Raizer, Y.P. Gas Discharge Physics; Allen, J.E., Ed.; Springer: Berlin/Heidelberg, Germany; New York, NY, USA, 1991; ISBN 3-540-19462-2. [Google Scholar]
  49. Zhu, X.M.; Pu, Y.K. A Simple Collisional-Radiative Model for Low-Temperature Argon Discharges with Pressure Ranging from 1 Pa to Atmospheric Pressure: Kinetics of Paschen 1s and 2p Levels. J. Phys. D. Appl. Phys. 2010, 43, 015204. [Google Scholar] [CrossRef]
  50. Puurunen, R.L. Surface Chemistry of Atomic Layer Deposition: A Case Study for the Trimethylaluminum/water Process. J. Appl. Phys. 2005, 97, 121301. [Google Scholar] [CrossRef]
  51. Gosset, L.G.; Damlencourt, J.F.; Renault, O.; Rouchon, D.; Holliger, P.; Ermolieff, A.; Trimaille, I.; Ganem, J.J.; Martin, F.; Séméria, M.N. Interface and Material Characterization of Thin Al2O3 Layers Deposited by ALD Using TMA/H2O. J. Non. Cryst. Solids 2002, 303, 17–23. [Google Scholar] [CrossRef]
  52. Talviste, R.; Raud, S.; Jõgi, I.; Plank, T.; Raud, J.; Teesalu, T. Investigation of a He Micro Plasma-Jet Utilized for Treatment of Prostate Cancer Cells. Plasma Res. Express 2019, 1, 045002. [Google Scholar] [CrossRef]
  53. Atkinson, R.; Baulch, D.L.; Cox, R.A.; Hampson, R.F.; Kerr, J.A.; Troe, J. Evaluated Kinetic and Photochemical Data for Atmospheric Chemistry: Supplement III. IUPAC Subcommittee on Gas Kinetic Data Evaluation for Atmospheric Chemistry. J. Phys. Chem. Ref. Data 1989, 18, 881–1097. [Google Scholar] [CrossRef]
  54. Bruggeman, P.; Schram, D.; González, M.Á.; Rego, R.; Kong, M.G.; Leys, C. Characterization of a Direct Dc-Excited Discharge in Water by Optical Emission Spectroscopy. Plasma Sources Sci. Technol. 2009, 18, 025017. [Google Scholar] [CrossRef]
  55. Del Greco, F.P.; Kaufman, F. Lifetime and Reactions of OH Radicals in Discharge-Flow Systems. Discuss. Faraday Soc. 1962, 33, 128–138. [Google Scholar] [CrossRef]
  56. Tochikubo, F.; Uchida, S.; Watanabe, T. Study on Decay Characteristics of OH Radical Density in Pulsed Discharge in Ar/H2O. Jpn. J. Appl. Phys. Part 1 Regul. Pap. Short Notes Rev. Pap. 2004, 43, 315–320. [Google Scholar] [CrossRef]
  57. Sekiya, H.; Nishiyama, N.; Tsuji, M.; Nishimura, Y. Nascent Vibrational and Rotational Distributions of NH(A) in the Dissociative Excitation of NH3 by Ar(3P2,0) at Thermal Energy. J. Chem. Phys. 1987, 86, 163–169. [Google Scholar] [CrossRef]
Figure 1. (a) Schematic representation of the experimental device; (b) Photo of PEALD.
Processes 12 00612 g001
Figure 2. Example of experimental and deconvoluted Ar spectral lines at 750.4 and 751.5 nm: (a) in Ar discharge; (b) during TMA pulse (2 s after opening TMA valve).
Processes 12 00612 g002
Figure 3. An example of measured current and voltage waveforms. The phase shift component due to different lengths of connecting cables and parasitic capacitance was considered in the graph.
Processes 12 00612 g003
Figure 4. (a,b) Spectra of Ar plasma after long-term Ar purging and during H2O (Ar + H2O) or TMA (Ar + TMA) pulses recorded at x = 5 mm (a) and x = 50 mm (b). The spectra describing the effect of the H2O and TMA pulses were recorded 2 s after the corresponding valve was opened. The intensity scale of the corresponding spectrum is indicated by the black arrow. (c,d) Intensities of OH (307 nm), N2 (337 nm), CH (431 nm) bandheads, Al (397 nm), and Ar (750 nm) lines recorded prior to ALD pulses (0–10 s) and during the TMA pulse (10–15 s); the first purge (15–25 s); H2O pulse (25–30 s); the second purge (30–40 s); and TMA pulse (40–45 s) at x = 5 mm (c) and x = 50 mm (d). Plasma was turned on for the entire measurement period (0–45 s).
Processes 12 00612 g004
Figure 5. Spectra of OH(A-X,0-0) and several bands of N2 SPS registered using an Ocean Insight HR4 PRO spectrometer at distances x = 0 and x = 10 mm. The reaction chamber heater was turned off. In brackets, N2 SPS vibrational transitions are shown. The intensity scales of corresponding spectra are shown by black arrows.
Processes 12 00612 g005
Figure 6. (a) Example of registered and calculated spectra of N2(C-B) 0-2 and 2-4 vibrational transitions at the distance x = 0. (b) Rotational temperature of N2(C, v = 0, 1, 2) as a function of x. Inset depicts the energy levels of Ar metastable (1s3 and 1s5) and resonant (1s2 and 1s4) state atoms and N2 rotational states (up to J = 60) for vibrational states v = 0, 1, 2.
Processes 12 00612 g006
Figure 7. (a) Optical depth (OD) of Ar absorption line at 763.5 nm for different x. The absorption line profile was fitted with the Voigt function shown using solid lines. (b) Ar 1s5 state atom concentration [Ar(1s5)] as a function of x. The solid line represents the exponential trendline of data points. Error bars shown in the figure are found as differences of Ar(1s5) concentrations calculated on the basis of experimental OD and the Voigt fitting.
Processes 12 00612 g007
Figure 8. GIXRD diffractograms of Al2O3 films deposited on α-Cr2O3 at substrate temperatures of 600 and 650 K via thermal ALD and PEALD (plasma turned on during the H2O purge). During deposition, the samples were located at a distance of 20 mm from the outlet of the plasma tube. Reflections peaking at 35.3 and 57.6° indicate the formation of α-Al2O3.
Processes 12 00612 g008
Figure 9. GIXRD diffractograms of Al2O3 films deposited at a substrate temperature of 650 K on α-Cr2O3: (a) PEALD (plasma turned on during H2O purge); (b) thermal ALD. During the deposition, the samples were located at distances of 20 and 70 mm from the outlet of the plasma tube.
Processes 12 00612 g009
Table 1. Growth per cycle (GPC), density ( ρ ), mass growth per cycle ( M G P C = ρ · G P C ), and surface roughness of films grown via thermal ALD and PEALD (plasma switched on during H2O purge) on substrates positioned at different distances from the plasma tube orifice. Films were deposited at 650 K on substrates coated with α-Cr2O3.
ALD Processx, mmGPC, nm ρ , g/cm3MGPC, ng/cm2Roughness, nm
Thermal ALD200.104 ± 0.0023.21 ± 0.0633.4 ± 0.92.4 ± 0.1
PEALD200.094 ± 0.0023.43 ± 0.0732 ± 13.3 ± 0.1
Thermal ALD700.105 ± 0.0023.27 ± 0.0634.3 ± 0.91.5 ± 0.1
PEALD700.092 ± 0.0023.25 ± 0.0629.9 ± 0.91.5 ± 0.1
Disclaimer/Publisher’s Note: The statements, opinions and data contained in all publications are solely those of the individual author(s) and contributor(s) and not of MDPI and/or the editor(s). MDPI and/or the editor(s) disclaim responsibility for any injury to people or property resulting from any ideas, methods, instructions or products referred to in the content.

