Article

Seasonal Operation Strategy Optimization for Integrated Energy Systems with Considering System Cooling Loads Independently

1
Department of Power Consumption and Energy Efficiency, China Electric Power Research Institute, Beijing 100192, China
2
Department of Power Consumption, Zhejiang Electric Power Company, Hangzhou 310007, China
*
Author to whom correspondence should be addressed.
Submission received: 25 September 2018 / Revised: 18 October 2018 / Accepted: 18 October 2018 / Published: 20 October 2018
(This article belongs to the Section Process Control and Monitoring)

Abstract

:
With the rapid growth of energy consumption, how to utilize energy in an efficient and cheap way becomes an intensive problem. This paper proposes an optimal operation strategy to reduce system fuel costs and increase system stability by independently considering cooling loads and adjusting CHP heat to power ratio seasonally. In this paper, a mathematical model of CHP operation is introduced to reveal the relationship between the supplementary volume of diesel oil and CHP heat to power ratio. Meanwhile, by analyzing the influence of seasonal factor on energy consumption, CHP heat to power ratio is optimized seasonally. Then, by independently considering the impacts of the cooling loads on system operation, the particle swarm optimization (PSO) algorithm is used to optimize the operation strategy of each device. Finally, this paper validates the positive effects of storage devices on improving system economy and stability under the premise of the time-of-use gas price. Results show that system fuel costs can be reduced by 5.2% if the seasonal factor is considered. Additionally, by optimizing the operation strategy, the peak valley gap of electrical loads in summer reduces by 40.7%. Moreover, the proposed strategy successfully utilizes storage capacity to shift loads and respond to gas price.

1. Introduction

In recent years, the rapid technical improvement of renewable generation and diversified energy consumption patterns have promoted the integration of energy systems; at the same time, the clearer concepts of Energy Hub and integrated energy system have further accelerated the pace of energy reform [1,2]. As the most urgent and difficult problems to be solved, the mismatch of power generation and consumption, insufficient coupling of different forms of energy, and inappropriate configuration of energy carriers seriously restrict integrated energy systems’ efficiency. Therefore, how to design a highly integrated energy system and realize the coordination operation of different energy carriers has currently become a hot issue [3].
In existing research of integrated energy systems, CHP has attracted attention widely for its outstanding advantages of high efficiency and low pollution. In Reference [4], a rule-based control algorithm was proposed to optimize the operational costs of domestic buildings with CHP installations. A novel approach using continuous time notation was applied to size a CHP unit with a hot water tank installation in Reference [5]. A combined energetic and economic approach was proposed in Reference [6] to design and manage CHP systems for district heating networks, to obtain an economically feasible system, as well as to avoid the occurrence of oversizing, undersizing, and some other unpleasant influences. Additionally, the mixed integer linear programming (MILP) model was applied to a local energy system to determine the optimal operation strategy of CHP in Reference [7]. The aforementioned studies have clearly addressed CHP modeling-, configuring-, and operating-related problems, but the heat to power ratio of CHP used in aforementioned studies is assumed to be a constant. Since energy consumption patterns are in great difference of a year, it is less efficient to set the CHP heat to power ratio as a constant. In this paper, by considering different heat to power ratio of system demands in four seasons, the CHP heat to power ratio is optimized seasonally.
Additionally, the existing studies have successfully optimized system thermal and electrical loads by proposing different optimization algorithms. For example, by considering weather conditions, time-based tariffs, and grid/technical constraints, a Markovian integrated energy management approach is reported in Reference [8] to reduce the energy bill while maintaining the satisfaction of residential consumers. Based on the modeling of detailed devices, an integrated energy system operation strategy is proposed and transformed into a mixed-integer linear programming model by linearization of nonlinear equations to solve the integrated energy system optimal scheduling problem [9]. To improve the overall energy efficiency and realize regional coordination optimization, an integrated strategy is proposed, which combines the linear weighted sum and the grasshopper optimization algorithms to solve the energy management problem in Reference [10]. The aforementioned papers have comprehensively considered system thermal and electrical loads when optimizing the operation of the integrated energy system, while they neglect the influence of cooling loads on system operation. However, at peak cooling demand time, power system stability can be seriously affected because most cooling loads are normally supplied by electricity. Therefore, in this paper, the cooling loads are independently considered and an ice storage system is introduced to the integrated energy system to shave peak cooling loads so as to reduce the burden of the electrical system.
Finally, to suppress renewable generation and load fluctuations, as well as to improve system stability, a growing number of energy storage devices are installed in integrated energy storage systems. Hu. K et al. introduced a phase–change heat storage facility into the CHP plant to improve the adjustability of an integrated thermal and power system whose heat generation is not consistent to thermal loads at each moment [11]. After installing the heat storage device, the flexibility of energy system increased and system wind loss reduced significantly, as well. Additionally, the MILP method was proposed in Reference [12] to assess and compare the technical and economic feasibility of domestic energy storage and community energy storage so as to improve the self-consumption of photovoltaic generation and reduce the imbalance between supply and demands. In Reference [13], by comprehensively analyzing key factors that can affect battery lifetime and operation, Yu. D. et al. proposed a novel configuration and operation method for a battery–supercapacitor hybrid energy storage system. Moreover, under battery–exchange operating mode, the probabilistic model of available energy in batteries of a vehicle-to-grid station was proposed in Reference [14] to enhance the reliability performance of distribution systems. These studies have made great contributions to reducing energy consumption and improving system reliability; however, all of these papers ignore the installation costs of energy storage systems and treat the gas price as a constant. Considering the fact that the installation costs of the battery system are much higher than the hot water tank, and the shortage of nature gas may lead to the use of gas prices based on time of use in future, it is the first time that the time-of-use nature gas price and installation costs of energy storage devices are both considered to optimize the operation of hybrid energy storage system.
The main contributions of this paper can be summarized as follow:
(1)
In most previous studies, the CHP heat to power ratio and energy system heat to power ratio in different seasons were selected as a constant when optimizing CHP operation. In this paper, the state of the art CHP unit with an additionally fired waste heat boiler was introduced to optimize the CHP heat to power ratio in different seasons. The results showed that the average daily fuel costs could be reduced by 5.2% if the CHP heat to power ratio was optimized seasonally.
(2)
Compared to the existing literature, system cooling loads were independently considered rather than treated as a part of thermal or electrical loads when optimizing a system operation. Results showed that the peak–valley gap of the power system could be significantly reduced, especially in summer (about 40.7% reduction) if the cooling loads were independently considered.
(3)
Different from early research, this paper adopted a time-of-use gas price rather than a constant gas price to optimize the energy system operation. This is because it is believed that the rapid development of CHP and gas boilers can lead to the shortage of natural gas at peak time. Simulation results showed that the average daily thermal production costs could be reduced by 7% when applying the time-of-use gas price. Additionally, adopting time-of-use gas price was conductive to optimizing system configuration.
The rest of this paper is organized as follows. In Section 2, the Energy Hub model and energy carrier’s power flow models are introduced in detail. In Section 3, the system optimal operation strategy, including the objective function and the optimization algorithm, is subsequently demonstrated. After that, a real case study is applied in Section 4 to verify the proposed method. Then, simulation results and a discussion of results are shown in Section 5. Finally, this paper is summarized in Section 6.

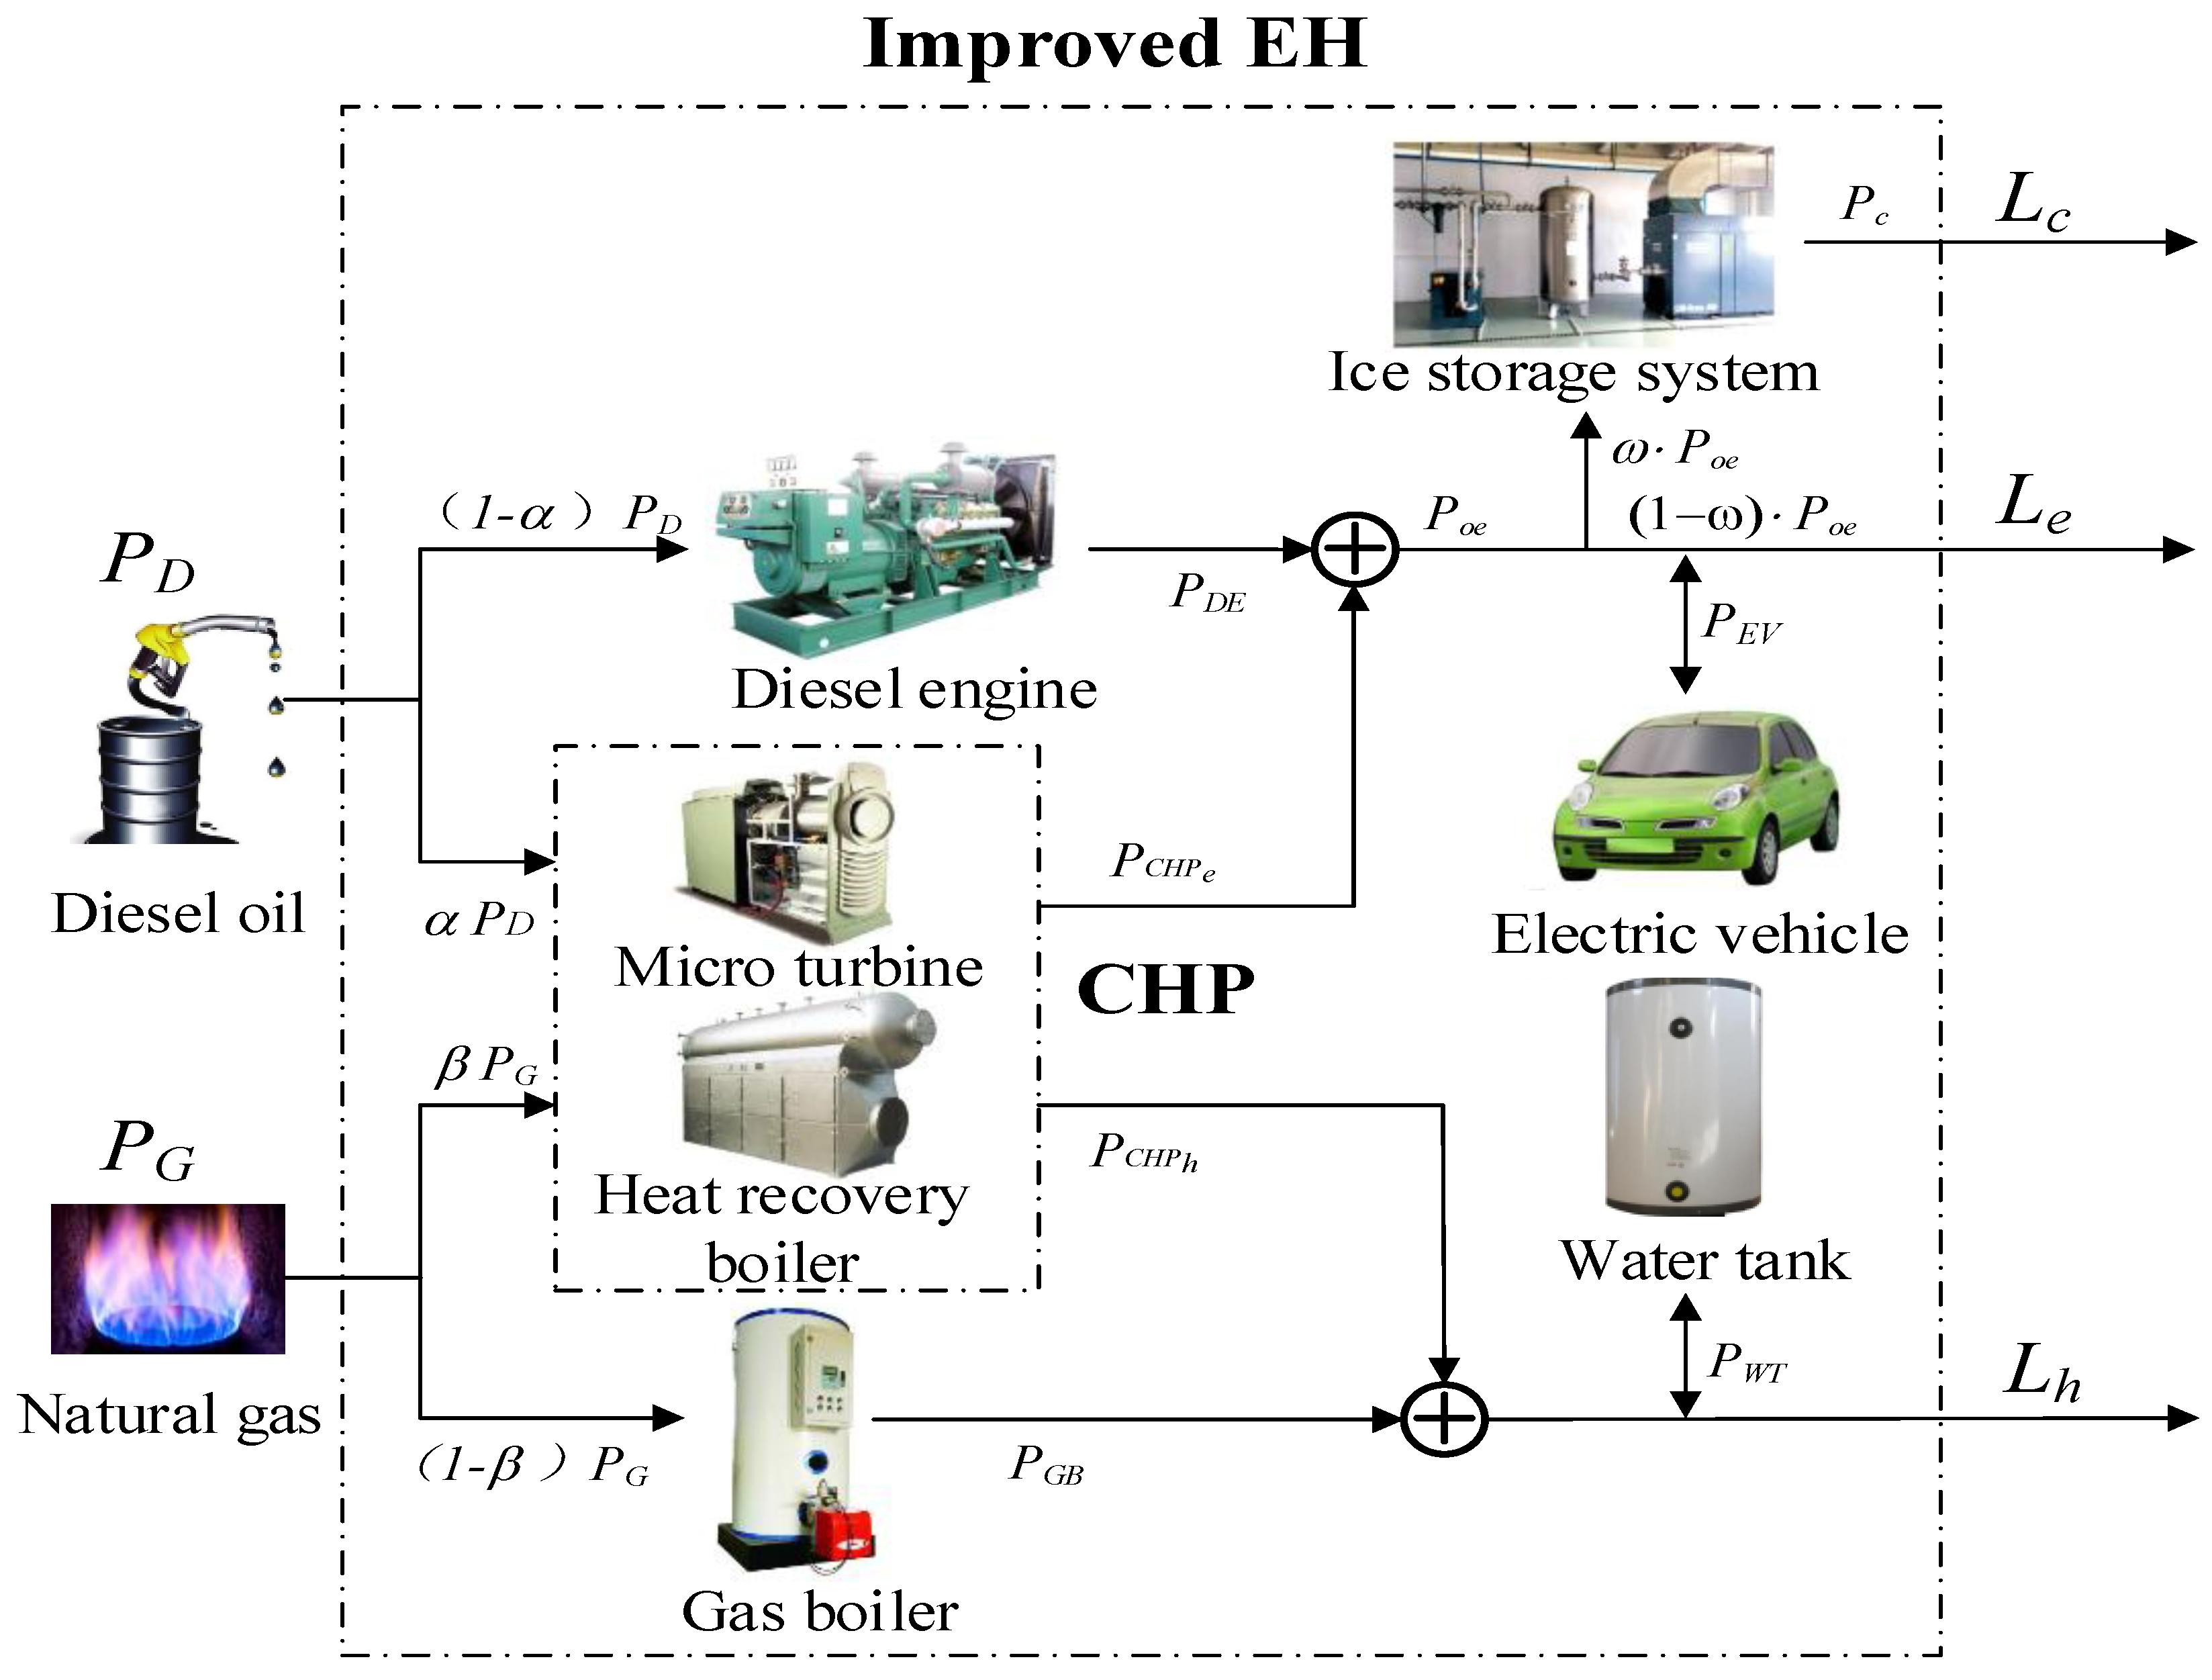
2. Energy Hub Modeling for an Integrated Energy System

2.1. The Energy Hub Model

To find an effective way to optimize the power flow within an integrated energy system, the Energy Hub model was firstly developed by Geidl et al. to model energy system transmission, conversion, and storage. By connecting energy system outputs and inputs via different energy carriers, the Energy Hub model successfully increases the paths of energy supply, which improves energy system economy, flexibility, and security [15]. Figure 1 shows a typical Energy Hub model.
In addition to increasing the paths of energy supply, the Energy Hub model can be used to couple different types of energy, and this can help to improve the overall efficiency of integrated energy systems. As the key infrastructures to couple electricity and heat in Figure 1, CHP units have attracted many scholars’ research interest. However, as mentioned in the introduction, a CHP system’s heat to power output ratio is normally selected as a constant value in most existing work, and its dynamic characteristic is often ignored by researchers. This can lead to the nonconformity between theoretical operation and actual operation, and ultimately can affect the efficiency and economy of integrated energy systems.
Moreover, when optimizing the operation strategy of an integrated energy system like that shown in Figure 1, the influences of the thermal loads and the electrical loads on system operation are both considered, but the influences of the cooling loads on system operation are neglected. Since different forms of energy requested by systems can lead to different selections of energy carriers and different ways of implementing generators, it is essential to consider the cooling loads separately in the Energy Hub model and to comprehensively study the operational characteristics of the cooling loads.
The reliability of an integrated energy system can be strengthened by installing energy storage devices. As two typical storage devices, hot water tanks and batteries are widely deployed in integrated energy systems to store heat and electricity. However, the relatively high installation costs of a battery and lower requirements of connecting renewable generations to the main grid significantly reduce battery installation capacity in integrated energy systems. Instead of installing a large-scale battery system, properly sizing a cheaper thermal storage system can also improve an integrated energy system’s reliability and economy [16]. Therefore, in this paper, an electrical vehicle power exchange station is introduced to store electricity on a small scale; meanwhile, a hot water tank is installed in the improved Energy Hub to store redundant heat on a large scale. Figure 2 is a diagram of the improved Energy Hub model.
As shown in Figure 2, the mathematical expression of the improved Energy Hub model can be expressed as:
[ L e L h L c ] = [ ( 1 ω ) ( 1 α ) η D E 0 0 ( 1 ω ) β η C H P e β η C H P h + ( 1 β ) η G B 0 ] [ P D P G ] + [ P E V P W T P C ] .
It is worth noting that in this paper, when PEV and PWT are greater than zero, the electric vehicle power exchange station and hot water tank are in discharge state. In addition, when PC is greater than zero, the ice storage system is in an ice melting state. Moreover, diesel consumed in CHP cannot increase CHP electricity output efficiency, but it can improve combustion efficiency, and this will be introduced in detail in the next part.

2.2. Different Energy Carriers’ Output Power Modeling and Operation Constraints

As shown in Figure 2, the improved Energy Hub model contains six energy carriers, which are CHP, diesel generator, gas boiler, ice storage system, hot water tank, and electric vehicle power exchange station. In this section, the mathematical expressions of their output power and operation constraints will be introduced.

2.2.1. CHP Output Power and Operation Constraints Modeling

CHP is a kind of high energy efficiency generator, because it can collect the redundant heat generated by the microturbine in the process of generating electricity through a waste heat boiler. However, in the previous studies, due to technology limitations, the equipped waste heat boilers were non-additionally fired waste heat boilers, which made the heat to power ratio of CHP not adjustable. In this situation, the heat to power ratio of the CHP and the integrated energy system can differ greatly, which affects the overall efficiency of CHP to some extent [17]. In this paper, in order to couple the heat to power ratio of the CHP and the integrated energy system, an improved CHP unit with an additionally fired waste heat boiler was installed in the Energy Hub.
The heat to power ratio of CHP is defined as the ratio of the actual thermal output power to the actual electrical output power, which can be represented as follows:
R C H P = P CHPh / P CHPe = ( η CHPh P C H P in ) / ( η C H P e P C H P in ) = η CHPh / η C H P e .
To change the heat to power ratio of CHP, it is usually required to increase the supplementary volume of diesel oil to improve the heat conversion efficiency of CHP. However, with the increase of the supplementary volume of diesel oil, the system operational costs will increase, as well. To reveal the relationship between the heat to power ratio of CHP and the supplementary volume of diesel oil, Shi et al. conducted an experiment [18]. Equation (3) shows the experiment results:
R C H P ( t ) = K a 1 ( K b 1 P 0 ( t ) + K b 2 ) + K a 2 .
Ka1, Ka2, Kb1, and Kb2 are set as 4.4483, 1.2857, 0.0051209, and 0.00038 in this paper [18]. Therefore, the mathematical expression of CHP heat conversion efficiency and the supplementary volume of diesel oil can be expressed as:
η CHPh = η CHPe R C H P = η CHPe [ K a 1 ( K b 1 P 0 ( t ) + K b 2 ) + K a 2 ] .
It is worth noting that the electricity conversion efficiency of CHP is a constant in Equation (4). By increasing the supplementary volume of diesel oil, only the CHP heat conversion efficiency can be improved. Therefore, by changing the CHP heat conversion efficiency, the CHP heat to power ratio can be adjusted.

2.2.2. Diesel Generator Output Power and Operation Constraints Modeling

Diesel generator systems have the advantages of easy operation, fast generation, cheap maintenance, and being less affected by the ambient environment and topographic conditions, which make them widely used in power systems [19]. By installing diesel generators, power system loss of load probability (LOLP) can be significantly reduced and system reliability can be improved, as well [20]. The mathematical expression of diesel generator output power can be expressed as:
P DE = η DE P DEin .
The output power of a diesel generator is limited by the maximum operating power and the minimum starting power, which can be written as:
P DEmin P DE P DEmax .

2.2.3. Gas Boiler Output Power and Operation Constraints Modeling

Gas boilers are widely installed in integrated energy systems due to their lower operational costs, environmental friendliness, relatively high heat efficiency, and strong reliability characteristics [21]. To reduce the overall energy costs and improve the reliability of an integrated energy system, a gas boiler, as an auxiliary heat generator, is added to the Energy Hub to supply system thermal loads. Equation (7) is the mathematical expression of a gas boiler’s output power.
P G B = η G B P GBin ,
where:
η G B = ( 100 a 1 a 2 a 3 ) % .
In this paper, a1, a2, and a3 are set as 9.87, 0.95, and 2.18, respectively [22].
The operation of a gas boiler is constrained by its capacity, which can be expressed as:
Q GB _ Hmin Q G B _ H ( t ) Q GB _ Hmax .
In addition, the operation of a gas boiler can also be limited by boiler’s minimum ON/OFF time.
T G B _ O N ( t ) T G B _ O N min  
T G B _ O F F ( t ) T G B _ O F F min  

2.2.4. Ice Storage System Output Power and Operation Constraints Modeling

Compared with other refrigeration systems, ice storage systems have the significant advantage of flexible operation. Specifically, by making ice in advance and melting ice when needed, the ice storage system can be used to shift electrical loads [23]. In addition, the ice storage system is a kind of space-saving equipment, which makes it popular for small integrated energy systems. To reduce land occupation and smooth electrical load curve, the ice storage system is installed in the Energy Hub to supply system cooling loads. The output refrigerating power of the ice storage system (PCout) can be expressed as:
P C o u t = P C i n E E R .
In this paper, EER is set as 3.1 [24].
Ice making and melting are mainly completed in an ice storage tank. The operation of an ice storage tank is restricted by its capacity and its work condition.
Q C i c e min Q C i c e ( t ) Q Cicemax  
Q C w min Q C w ( t ) Q C w max  
M C _ I C E ( t ) + M C _ W ( t ) 1  

2.2.5. Hot Water Tank Output Power and Operation Constraints Modeling

As mentioned in Section 2.1, to improve the reliability of the system operation, energy storage systems are installed in the Energy Hub to suppress energy fluctuation. However, considering the relatively high installation costs of an electrical energy storage system, this paper reduced the installation capacity of the battery storage system and increased the installation capacity of the thermal storage system. By coupling heat and power, redundant energy generated by generators can be stored in the form of thermal energy on a large scale. In this way, system loads are regulated and system reliability is improved, as well. Equation (16) shows total thermal energy stored in the hot water tank:
Q W T ( t ) = ( 1 ε W T ) Q W T ( t 1 ) + Q W T h ( t ) Q W T r ( t ) .
The operation of a hot water tank is mainly limited by the water tank’s installation capacity and maximum/minimum charging/discharging capacity, which can be represented as:
Q WTmin Q W T ( t ) Q WTmax ,
Q WThmin Q W T h ( t ) Q WThmax ,
Q WTrmin Q W T r ( t ) Q WTrmax .

2.2.6. Electric Vehicle Power Exchange Station Output Power and Operation Constraints Modeling

An electric vehicle power exchange station can participate in a demand response program with the help of its battery storage capacity. At peak demand time, the electric vehicle power exchange station plays a role as a power source to supply electrical power. When system electrical demand is low, the electric vehicle power exchange station can also work as a load [25]. In this paper, an electric vehicle power exchange station is added to the Energy Hub to improve the stability of the integrated energy system.
In this paper, electric vehicles are supposed to be charged/discharged with the constant power in proper order to optimize system power fluctuation and to reduce the peak–valley difference of power system. Equations (20) and (21) are the mathematical expressions of the specific operation strategy for electric vehicles:
t S C = { t c 1 + k ( t c 2 t chg t c 1 ) 0 < t chg < T g t c 1 t chg T g ,
t S D = { t d 1 + k ( t d 2 t chd t d 1 ) 0 < t chd < T f t d 1 t chd T f .
Since the electric vehicle power exchange station needs to prepare enough energy for electric vehicles, its operation is mainly limited by electric vehicles’ daily energy consumption and battery state of charge (SOC).
Q E V ( t ) L E V  
S O C min Q E V ( t ) Q E V S O C max  
In this paper, in order to encourage the electric vehicle power exchange station to participate in the demand response program, SOCmin and SOCmax are set as 10% and 100%, respectively.

3. System Optimal Operation Strategy

3.1. Objective Function

Based on the proposed Energy Hub model, while taking the purchasing costs of natural gas and diesel oil into account, this paper tried to optimize the fuel costs of the integrated energy system in different seasons. The objective function is formulated as follows:
min   F = t = 1 24 Q G ( t ) C G ( t ) + Q D ( t ) C D ( t )   s . t . ( 1 ) ( 23 ) .

3.2. Optimization Algorithm
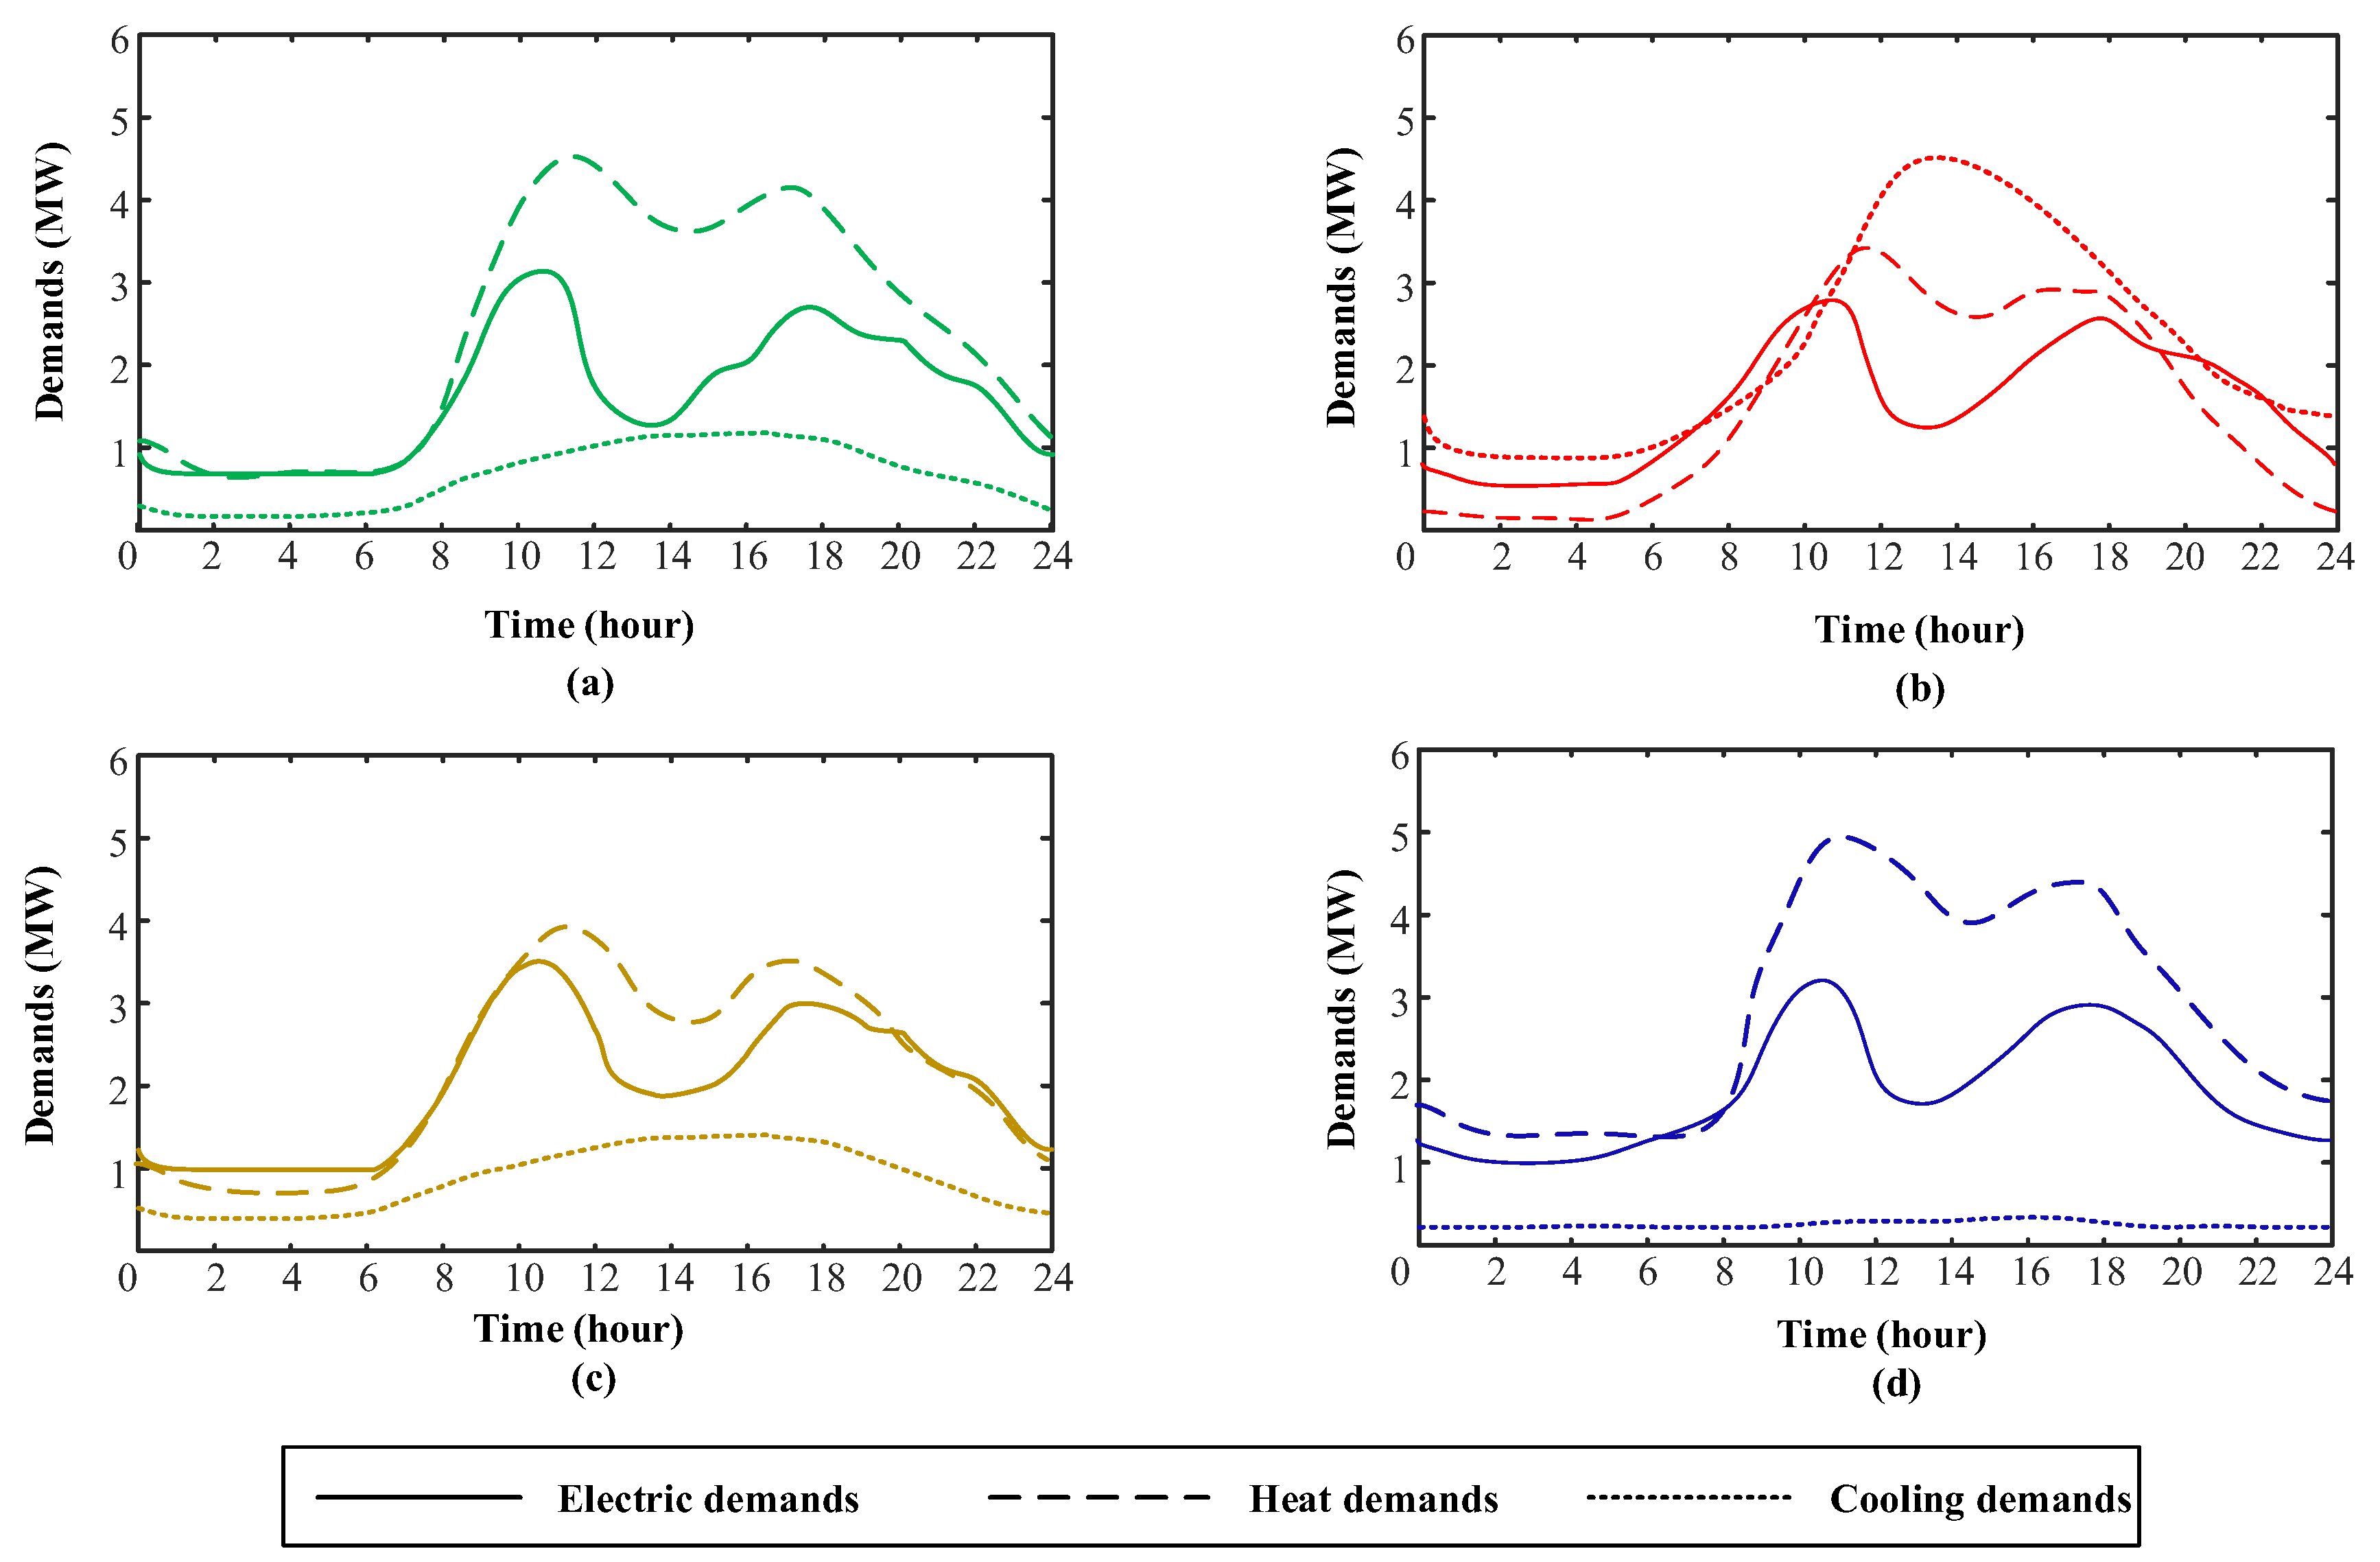
The particle swarm optimization (PSO) is normally used to solve the mathematical problems with high dimensions and complex constraints. Compared with other metaheuristic algorithms, it has the clear competitive advantages of fast calculation speed, high efficiency, and easy implementation. Therefore, it is widely applied to deal with power system optimal-operation-related problems [26]. The PSO algorithm first initializes the optimization variables as a group of random particles to participate in the iteration, and then determines the position and velocity of the particles during the iteration process. Finally, simulation results are obtained through multiple iterations. It is worth noting that the simulation results may not be the exactly a true global minimum, but the accuracy of the results is relatively high.
In order to obtain the optimal fuel costs of the integrated energy system, this paper took the objective function min F, defined in Section 3.1, as the fitness function, and selected a different energy carriers’ hourly power consumption as the optimization variable to optimize the fuel costs of the integrated energy system by the PSO. In addition, to make full use of fossil energy and to improve energy efficiency, it was necessary to verify whether the overall efficiency of CHP met the minimum requirement. If the overall efficiency of CHP cannot meet the minimum requirement, the minimum CHP heat to power ratio should be adjusted and the PSO iteration process should be repeated. Equation (25) is the mathematical expressions of the overall efficiency of CHP:
η o = Q e + Q h Q i n .
Figure 3 is a flow diagram of the PSO optimization algorithm for reducing the fuel costs of an integrated energy system. The simulation results were acquired by implementing a MATLAB (R2016b, MathWorks company, Nettie, MA, USA) Simulation.

4. Case Study

In this paper, an off-grid integrated energy system located in the central of China was selected as an example to verify the proposed Energy Hub model and operation strategy. All energy carriers used to supply, convert, and store energy for the integrated energy system are shown in Figure 2. In addition, the integrated energy system was equipped with a state-of-the-art CHP unit, whose waste heat boiler is an additionally fired waste heat boiler. This made the heat to power ratio of CHP adjustable. The rated power of CHP was 3 MW and its rated electrical output efficiency was 33%. The thermal output efficiency was constrained by the supplementary volume of diesel oil, which is shown in Equation (4). A 10 MW diesel generator was installed in the integrated energy system to supply additional power and its energy conversion efficiency was 40% [27]. In order to make full use of the capacity of gas boiler and ice storage system, the integrated energy system deployed a 5 MW gas boiler to generate additional heat and two sets of ice storage air conditioning units with the rated power of 5 MW and 4 MW to supply cooling demands. Moreover, since the installation cost of the hot water tank is relatively cheap and the recovery of waste heat is conducive to improving the overall energy efficiency, this paper assumed that the installation capacity of the hot water tank was large enough to collect redundant heat generated by the integrated energy system. Conversely, due to the high installation cost of the battery and the limited number of electric vehicles, the maximum storage capacity of the electric vehicle power exchange station was set as 900 kWh, and the daily electrical energy needed to be supplied by the electric vehicle power exchange station was set as 500 kWh. Figure 4 shows the seasonal cooling, thermal, and electrical load curves of the integrated energy system.
Since diesel price is less sensitive to loads and relatively cheap, it was assumed that diesel price was only affected by seasons in this paper. The purchasing costs of diesel were 1.034, 0.983, 1.025, and 1.051 US $/L in spring, summer, autumn, and winter [28]. However, with the rapid development of distributed CHP and gas boilers, there is a significant increase in nature gas consumption, which eventually leads to the shortage of natural gas at peak gas demand time [29]. Therefore, by analogy to the time-of-use electricity price, this paper formulated the time-of-use gas price according to the daily cooling, thermal, and electrical loads to optimize daily fuel costs. Figure 5 shows the seasonal time-of-use natural gas purchasing costs.

5. Results and Analysis

5.1. Optimization Results of CHP Heat to Power Ratio

Figure 6 reveals the relationship of CHP heat to power ratio and its overall efficiency. As can be seen from Figure 6, with the increase of the CHP heat to power ratio, CHP overall efficiency (ηo) increased at first and then decreased. The overall efficiency of CHP can reach its maximum value of 78.2% when the heat to power ratio of CHP is 337%. However, CHP overall efficiency started to decrease shortly after it reached its maximum value. This was because, with the increase of the supplementary volume of diesel oil, the temperature of the waste heat boiler’s exhaust smoke rose as well, which made the supplemented diesel oil have a lesser effect on improving the waste heat boiler’s efficiency and eventually reduced CHP overall efficiency.
Figure 6 also shows the optimal CHP heat to power ratio of different seasons. In Figure 6, points a, b, c, and d represent the optimal CHP heat to power ratio in spring, summer, autumn, and winter, respectively. Specifically, the optimal CHP heat to power ratio is 267%, 251%, 276%, and 304% in the four seasons, with optimal fuel costs of 11,275.9 US $, 12,847.6 US $, 12,226.9 US $, and 13,701.2 US $. Therefore, the average daily energy cost of a year is 12,512.9 US $ if the seasonal factor is considered. Alternatively, if the seasonal factor is ignored, point M shows that the optimal average yearly CHP heat to power ratio is 271% and the optimal average daily energy cost of a year is 13,159.3 US $. It can be concluded from the aforementioned results that the seasonal factor can result in a 20% difference of CHP heat to power ratio, which indicates that the seasonal factor has a decisive impact on the forms of energy demands. Moreover, taking the seasonal factor into consideration, the average daily energy cost of a year can be reduced by 5.2% compared with when ignoring the seasonal factor.
In summary, the seasonal factor has a significant influence on selecting the CHP heat to power ratio, and system fuel costs can be effectively reduced by matching system heat to power ratio and CHP heat to power ratio.

5.2. The Influence of Cooling Loads on System Operation

Figure 7 shows the seasonal output power of the ice storage system and the equivalent average daily electrical load curve before and after the cooling loads were independently considered. In Figure 7, PC1 and PC2 represent the operation states of two ice storage devices. When the cooling loads are greater than zero, the ice storage system is in the ice melting state; otherwise, the ice storage system is in the ice making state. In addition, PT1 is the equivalent average daily electrical load curve before independently considering cooling loads (the cooling loads are converted to real time electrical loads). PT2 is the equivalent average daily electrical load curve after independently considering cooling loads (the cooling loads can participate in the demand response program).
The optimization results show that the independent analysis of system cooling loads is helpful to shave peak demands and to improve system operation stability. Taking Figure 7b as an example, the ice storage devices make ice with relatively high power during low demand time (10 p.m.–5 a.m. and 12 p.m.–3 p.m.), while during peak demand time (8 a.m.–12 p.m. and 4 p.m.–8 p.m.), the ice making power significantly reduces. By orderly control of the processes of making and melting ice, the cooling loads of system are shifted and the peak of electrical load curve is successfully shaved, which greatly alleviates the burden of power supply. By independently analyzing system cooling loads, results showed that the equivalent maximum power in summer reduced from 4.23 MW to 3.25 MW and the equivalent minimum power increased from 0.89 MW to 1.27 MW. In this situation, the peak–valley gap of the power system reduced from 3.34 MW to 1.98 MW, which is a 40.7% reduction. Although the system peak–valley gap is reduced more obviously in summer, in other seasons, the system peak–valley gap can also be reduced (11.3% in spring, 12.5% in autumn, and 9.6% in winter).
Even though the ice storage system can shift the cooling loads and relieve the pressure of power supply system, it will increase the equivalent daily electrical loads in four seasons. By independently considering the cooling loads, results showed that the equivalent daily electrical loads increased by 0.53%, 1.55%, 0.56%, and 0.3% in spring, summer, autumn, and winter, respectively. This was caused by the following reasons: Firstly, when the cooling loads are not independently considered, the air conditioning is used to supply system cooling loads. But, when the cooling loads are independently considered, the ice storage system is used to supply cooling loads. Since energy conversion efficiency of air conditioning (EER 3.2) is higher than that of the ice storage system (EER 3.1), the ice storage system needs to consume more electricity to supply the cooling loads. Considering the fact that their energy conversion efficiencies are very close to each other, this is not the main reason. Secondly, the ice storage system has a 2.3% loss in the process of storing ice, which leads to consuming additional electricity to compensate for the system loss. For the aforementioned reasons, the electricity consumed in the integrated energy system will increase to some extent. However, since the ice storage system has the ability to shift electrical loads to a low gas price time, the fuel costs of the whole system can be reduced. Taking summer as an example, although independently considering system cooling loads will increase the average daily electrical loads by 1.55%, the system fuel costs will be reduced by 4.3%.
Except for the smoothing daily load curve, independently considering system cooling loads is also helpful for reducing diesel generator installation capacity. Taking summer as an example, PDE1 and PDE2 in Figure 8 represent the average daily output power of diesel generators before and after the cooling loads were independently considered.
It can be concluded from Figure 8 that the maximum output power of the diesel generator before and after independently considering cooling loads was 3.14 MW and 1.98 MW, respectively. This proves that by independently considering the cooling loads, the installation capacity of the diesel generator can be reduced by about 1.16 MW. Therefore, by independently considering system cooling loads, the installation capacity of the diesel generator can be greatly reduced. Meanwhile, results also showed that the ratio of the average output to the maximum output of the diesel generator increased about 29% when cooling loads were independently considered. Therefore, the installation capacity of the diesel generator was fully utilized.

5.3. System Fuel Costs Optimization under the Time-of-Use Gas Price

To reveal the influence of time-of-use gas price on system operation, Figure 9 is plotted to show the relationship between time-of-use gas price and thermal storage output in different seasons. In Figure 9, the hot want tank is in discharge mode if PWT is greater than zero. It is worth noting that the heat stored in the hot water tank is about 8–11% greater than the heat released by the hot water tank. This is because a hot water tank always has standby losses and the standby losses vary between different seasons.
As can be seen from Figure 9, the hourly natural gas price varies greatly in the four seasons. By optimizing the operation of the integrated energy system with the proposed algorithm, the redundant heat generated by the gas boiler and CHP is stored in the hot water tank at a lower gas price time. Therefore, the proposed control algorithm can reduce fuel costs of the system by shifting thermal loads. Results showed that by controlling the CHP and gas boiler with the proposed strategy, about 7.4 MWh thermal energy generated by natural gas could be shifted from the peak price time to a lower price time in a day, which reduced the average daily thermal production costs by 7%.
Except for the hot water tank, the electric vehicle power exchange station also played an important role in shifting loads by responding to time-of-use gas price. Figure 10 shows the output power of the electric vehicle power exchange station and the natural gas price. In the diagram, when PV2G is greater than zero, the power exchange station works as a generator, or alternatively, the power exchange station works as loads.
It can be seen from Figure 10, about 1.3 MWh electrical loads can be shifted from peak gas time to lower gas time in a day, on average. Additionally, electrical energy consumed by the power exchange station is always higher than electrical energy released by the station. This is because a certain amount of electricity is consumed to refuel electric vehicles rather than participates in shifting loads. Since electric vehicles are normally refueled between 5 p.m. and 7 p.m., this leads to a reduction of power exchange between station and system at this period compared with the first peak gas price time. Moreover, the small installation capacity of battery constrains the station’s peak shaving ability and decreases the potential of reducing system fuel costs. However, with the rapid popularization of electric vehicles, electric vehicle power exchange stations are playing a more significant role.

6. Conclusions

Under the premise of time-of-use gas price, this paper tried to optimize energy system fuel costs and to increase the stability of integrated energy systems by independently considering system cooling loads and carefully analyzing the energy system heat to power ratio in different seasons. The three main findings of this paper can be summarized as follow:
(1)
Taking the seasonal factor into consideration when optimizing the CHP heat to power ratio, the average system fuel costs can be reduced by 5.2% and the CHP heat to power ratio will match up to the system heat to power ratio.
(2)
By considering the cooling loads independently and utilizing the ice storage system to participate in the power system demand response, the system electrical load curve can be regulated in an indirect way. Simulation results also revealed that the peak–valley gap of electrical loads was reduced by 40.7% in summer under the premise of ensuring the cooling loads. Meanwhile, by regulating the system electrical load curve, the installation capacity of the diesel generator can be fully utilized.
(3)
The proposed optimal operation strategy makes full use of the load shifting capability of the hot water tank to improve system stability and to respond to the time-of-use gas price simultaneously. However, due to the limited battery installation capacity, the load shifting capability of the electric vehicle power exchange station is constrained.
The proposed work has great significance for improving system reliability and economy; however, it ignores the system’s environmental footprint. Therefore, the authors suggest that carbon emission penalty costs should be considered in future work.

Author Contributions

Conceptualization, K.L; Methodology, G.H.; Validation, K.L., C.Z., and H.Y.; Formal analysis, Y.L.; Writing—original draft preparation, K.L.; Writing—review and editing, Y.L.; Funding acquisition, H.Y.

Funding

This research was funded by the science and technology project of State Grid Corporation of China, grant number YD71-17-023/5211011700KS.

Conflicts of Interest

The authors declare no conflict of interest.

Appendix A. List of Symbols

NomenclatureMeaningNomenclatureMeaning
LeElectrical loadsLhThermal loads
LcCooling loadsωRatio of power consumed by ice storage system to total power consumption
αRatio of diesel consumed by diesel generator to total diesel consumptionβRatio of natural gas consumed by CHP to total natural gas consumption
ηDEDiesel generator output efficiencyηCHPeCHP output electricity efficiency
ηCHPhCHP output heat efficiencyηGBGas boiler generator efficiency
PDInputs of dieselPGInputs of natural gas
PEVDischarge power of electric vehicle power exchange stationPWTDischarge power of hot water tank
PCIce storage system ice making powerRCHPHeat to power ratio of CHP
PCHPhThermal output power of a CHP unitPCHPeElectrical output power of a CHP unit
PCHPinInput power of CHPKa1, Ka2, Kb1 ,Kb2Boost factors of CHP heat to power ratio
P0 (t)Supplementary volume of diesel oil at time tPDEDiesel generator output power
PDEinInput power of a diesel generatorPDEmaxMaximum operating power of a diesel generator
PDEminMinimum starting power of a diesel generatorPGBGas boiler output power
PGBinInput power of a gas boilera1Exhaust smoke heat loss
a2Incomplete combustion lossa3Heat dissipation loss
QGB_H (t)Operation capacity of a gas boilerQGB_HminMinimum operation capacity of a gas boiler
QGB_HmaxMaximum operation capacity of a gas boilerTGB_ON (t)Accumulated operation time of the gas boiler at time t
TGB_OFF (t)Accumulated turn-off time of the gas boiler at time tTGB_ONminMinimum accumulated operation time of the gas boiler
TGB_OFFminMinimum accumulated turn-off time of the gas boilerPCoutOutput refrigerating power of the ice storage system
PCinInput electrical power of the ice storage systemEEREnergy efficiency ratio of the ice storage system
QCiceIce making capacity of the ice storage tankQCiceminMinimum ice making capacity of the ice storage tank
QCicemaxMaximum ice making capacity of the ice storage tankQCwIce melting capacity of the ice storage tank
QCwminMinimum ice melting capacity of the ice storage tankQCwmaxMaximum ice melting capacity of the ice storage tank
MC_ICE (t)Ice making modeMC_W (t)Ice melting mode
QWT (t)Total thermal energy stored in the hot water tank at time tεWTSelf discharge rate of a hot water tank
QWTh (t)Thermal energy stored in the hot water tank at time tQWTr (t)Thermal energy released by the hot water tank at time t
QWTminMinimum amount of thermal energy that can be stored in the hot water tankQWTmaxMaximum amount of thermal energy that can be stored in the hot water tank
QWThminMinimum amount of thermal energy that can flow in the hot water tank within a certain time periodQWThmaxMaximum amount of thermal energy that can flow in the hot water tank within a certain time period
QWTrminMinimum amount of thermal energy that can release by the hot water time within a certain time periodQWTrmaxMaximum amount of thermal energy that can release by the hot water time within a certain time period
tSCStarting time of charging batterytc1Starting time of low power demand
tc2Ending time of low power demandtchgTotal charging time
TgPeriod of low demand timetSDStarting time of discharging battery
td1Starting time of peak power demandtd2Ending time of peak power demand
tchdTotal discharging timeTfPeriod of peak demand time
kRandom number between 0 and 1QEV (t)Electrical energy stored in electric vehicle power exchange station at time t
LEVElectric vehicles’ daily energy consumptionSOCState of Charge
SOCminMinimum state of ChargeSOCmaxMaximum state of Charge
QEVRated energy storage capacity of electric vehicle power exchange stationFTotal fuel costs of the system
QG (t)Amount of natural gas (in cubic meter) consumed by the system at time tQD (t)Amount of diesel (in liter) consumed by the system at time t
CG (t)Real time natural gas price (in US $/cubic meter) at time tCD (t)Real time diesel price (in US $/liter) at time t
ηoOverall efficiency of CHPRCHPminMinimum CHP heat to power ratio
QeTotal electrical energy generated by CHPQhTotal thermal energy generated by CHP
QinSum of the calorific value of diesel and natural gas consumed by CHP--

References

  1. Gu, W.; Wu, Z.; Bo, R.; Liu, W.; Zhou, G.; Chen, W.; Wu, Z. Modeling, planning and optimal energy management of combined cooling, heating and power microgrid: A review. Int. J. Electr. Power Energy Syst. 2014, 54, 26–37. [Google Scholar] [CrossRef]
  2. Gu, W.; Wang, Z.; Wu, Z.; Luo, Z.; Tang, Y.; Wang, J. An Online Optimal Dispatch Schedule for CCHP Microgrids Based on Model Predictive Control. IEEE Trans. Smart Grid 2016, 8, 2332–2342. [Google Scholar] [CrossRef]
  3. Stanislav, P.; Bryan, K.; Tihomir, M. Smart Grids better with integrated energy system. In Proceedings of the 2009 IEEE Electrical Power & Energy Conference (EPEC), Montreal, QC, Canada, 22–23 October 2009; pp. 1–8. [Google Scholar]
  4. Li, D.; Xu, X.; Yu, D.; Dong, M.; Liu, H. Rule Based Coordinated Control of Domestic Combined Micro-CHP and Energy Storage System for Optimal Daily Cost. Appl. Sci. 2018, 8, 8. [Google Scholar] [CrossRef]
  5. Bartnik, R.; Buryn, Z.; Hnydiuk-Stefan, A.; Juszczak, A. Methodology and a Continuous Time Mathematical Model for Selecting the Optimum Capacity of a Heat Accumulator Integrated with a CHP Plant. Energies 2018, 11, 1240. [Google Scholar] [CrossRef]
  6. Franco, A.; Bellina, F. Methods for optimized design and management of CHP systems for district heating networks (DHN). Energy Convers. Manag. 2018, 172, 21–31. [Google Scholar] [CrossRef]
  7. Wang, H.; Zhang, H.; Gu, C.; Li, F. Optimal design and operation of CHPs and energy hub with multi objectives for a local energy system. Energy Procedia 2017, 142, 1615–1621. [Google Scholar] [CrossRef]
  8. Nistor, M.; Antunes, C.H. Integrated Management of Energy Resources in Residential Buildings—A Markovian Approach. IEEE Trans. Smart Grid 2017, 9, 240–251. [Google Scholar] [CrossRef]
  9. Wang, C.; Lv, C.; Li, P.; Song, G.; Li, S.; Xu, X.; Wu, J. Modeling and optimal operation of community integrated energy systems: A case study from China. Appl. Energy 2018, 230, 1242–1254. [Google Scholar] [CrossRef]
  10. Liu, J.; Wang, A.; Qu, Y.; Wang, W. Coordinated Operation of Multi-Integrated Energy System Based on Linear Weighted Sum and Grasshopper Optimization Algorithm. IEEE Access 2018, 6, 2169–3536. [Google Scholar] [CrossRef]
  11. Hu, K.; Chen, L.; Chen, Q.; Wang, X.; Qi, J.; Xu, F.; Min, Y. Phase-change heat storage installation in combined heat and power plants for integration of renewable energy sources into power system. Energy 2017, 124, 640–651. [Google Scholar] [CrossRef]
  12. Stelt, S.V.D.; AlSkaif, T.; Sark, W.V. Techno-economic analysis of household and community energy storage for residential prosumers with smart appliances. Appl. Energy 2018, 209, 266–276. [Google Scholar] [CrossRef]
  13. Yu, D.; Liu, H.; Yan, G.; Jiang, J.; Le Blond, S. Optimization of Hybrid Energy Storage Systems at the Building Level with Combined Heat and Power Generation. Energies 2017, 10, 606. [Google Scholar] [CrossRef]
  14. Farzin, H.; Moeini-Aghtaie, M.; Fotuhi-Firuzabad, M. Reliability Studies of Distribution Systems Integrated with Electric Vehicles Under Battery-Exchange Mode. IEEE Trans. Power Deliv. 2016, 31, 2473–2482. [Google Scholar] [CrossRef]
  15. Geidl, M.; Koeppel, G.; Favre-Perrod, P. Klockl, B.; Andersson, G.; Klaus, F. Energy hubs for the future. IEEE Power Energy Mag. 2007, 5, 24–30. [Google Scholar] [CrossRef]
  16. Hast, A.; Rinne, S.; Syri, S.; Kiviluoma, J. The role of heat storages in facilitating the adaptation of district heating systems to large amount of variable renewable electricity. Energy 2017, 137, 775–788. [Google Scholar] [CrossRef]
  17. Das, B.K.; Al-Abdeli, Y.M. Optimisation of stand-alone hybrid CHP systems meeting electric and heating loads. Energy Convers. Manag. 2017, 153, 391–408. [Google Scholar] [CrossRef]
  18. Shi, J.; Xu, J.; Zeng, B.; Zhang, J. A Bi-Level optimal operation for energy hub based on regulating heat-to-electric ratio mode. Power Syst. Technol. 2016, 40, 2959–2966. [Google Scholar]
  19. Ganesan, P.; Rajakarunakaran, S.; Thirugnanasambandam, M.; Devaraj, D. Artificial neural network model to predict the diesel electric generator performance and exhaust emissions. Energy 2015, 83, 115–124. [Google Scholar] [CrossRef]
  20. Noguera, A.L.G.; Lora, E.E.S.; Cobas, V.R.M.; Cobas, V.R.M. Optimum design of a hybrid diesel-ORC/photovoltaic system using PSO: Case study for the city of Cujubim, Brazil. Energy 2018, 142, 33–45. [Google Scholar] [CrossRef]
  21. Sun, F.; Zhao, J.; Fu, L.; Sun, J.; Zhang, S. New district heating system based on natural gas-fired boilers with absorption heat exchangers. Energy 2017, 138, 405–418. [Google Scholar] [CrossRef]
  22. Chen, W.; Shi, W.; Wang, B.; Shang, S.; Li, X. A deep heat recovery device between flue gas and supply air of gas-fired boiler by using non-contact total heat exchanger. Appl. Energy 2017, 105, 4976–4982. [Google Scholar] [CrossRef]
  23. Shirazi, A.; Najafi, B.; Aminyavari, M.; Rinaldi, F.; Taylor, R.A. Thermal–economic–environmental analysis and multi-objective optimization of an ice thermal energy storage system for gas turbine cycle inlet air cooling. Energy 2014, 69, 212–226. [Google Scholar] [CrossRef]
  24. Du, Y.; Gai, W.; Jin, L.; Sheng, W. Thermal comfort model analysis and optimization performance evaluation of a multifunctional ice storage air conditioning system in a confined mine refuge chamber. Energy 2017, 141, 964–974. [Google Scholar] [CrossRef]
  25. Lin, C.; Yao, C.; Jin, L.; Singh, C. Power system reliability assessment with electric vehicle integration using battery exchange mode. IEEE Trans. Sustain. Energy 2013, 4, 1034–1042. [Google Scholar]
  26. Delgarm, N.; Sajadi, B.; Kowsary, F.; Delgarm, S. Multi-objective optimization of the building energy performance: A simulation-based approach by means of particle swarm optimization (PSO). Appl. Energy 2016, 170, 293–303. [Google Scholar] [CrossRef]
  27. Chen, P.; Wang, J. Observer-based estimation of air-fractions for a diesel engine coupled with aftertreatment systems. IEEE Trans. Control Syst. Technol. 2013, 21, 2239–2250. [Google Scholar] [CrossRef]
  28. Dahl, C.A. Measuring global gasoline and diesel price and income elasticities. Energy Policy 2012, 41, 2–13. [Google Scholar] [CrossRef]
  29. Zhao, B.; Conejo, A.J.; Sioshansi, R. Unit commitment under gas-supply uncertainty and gas-price variability. IEEE Trans. Power Syst. 2017, 32, 2394–2405. [Google Scholar] [CrossRef]
Figure 1. A typical Energy Hub model.
Processes 06 00202 g001
Figure 2. An improved Energy Hub model.
Processes 06 00202 g002
Figure 3. A flow diagram of the proposed particle swarm optimization algorithm.
Processes 06 00202 g003
Figure 4. Seasonal cooling, thermal, and electrical load curves of the integrated energy system.
Processes 06 00202 g004
Figure 5. Seasonal time-of-use natural gas purchasing costs.
Processes 06 00202 g005
Figure 6. Simulation results of the relationship between CHP heat to power ratio and its overall efficiency.
Processes 06 00202 g006
Figure 7. Optimal output of two ice storage devices and average daily electrical load curve of the integrated energy system in (a) spring; (b) summer; (c) autumn; (d) winter.
Processes 06 00202 g007
Figure 8. Output power of the diesel generator before and after cooling loads were independently considered.
Processes 06 00202 g008
Figure 9. Optimal thermal storage output and time-of-use gas price in (a) spring; (b) summer; (c) autumn; (d) winter.
Processes 06 00202 g009
Figure 10. Optimal output power of the electric vehicle power station and time-of-use gas price in (a) spring; (b) summer; (c) autumn; (d) winter.
Processes 06 00202 g010

