Article

Experimental Study of the Microstructural Evolution of Glauberite and Its Weakening Mechanism under the Effect of Thermal-Hydrological-Chemical Coupling

1
College of Mining Engineering, China University of Mining and Technology, Xuzhou 221116, China
2
College of Mining Engineering, Taiyuan University of Technology, Taiyuan 030024, China
3
College of Chemical and Biological Engineering, Taiyuan University of Science and Technology, Taiyuan 030024, China
*
Authors to whom correspondence should be addressed.
Submission received: 19 June 2018 / Revised: 11 July 2018 / Accepted: 19 July 2018 / Published: 24 July 2018
(This article belongs to the Special Issue Fluid Flow in Fractured Porous Media)

Abstract

:
The microstructures of rock gradually evolve with changes in the external environment. This study focused on the microstructure evolution of glauberite and its weakening mechanism under different leaching conditions. The porosity were used as a characteristic index to study the effect of brine temperature and concentration on crack initiation and propagation in glauberite. The research subjects were specimens of ϕ 3 × 10 mm cylindrical glauberite core, obtained from a bedded salt deposit buried more than 1000 m underground in the Yunying salt formation, China. The results showed that when the specimens were immersed in solution at low temperature, due to hydration impurities, cracks appeared spontaneously at the centre of the disc and the solution then penetrated the specimens via these cracks and dissolved the minerals around the crack lines. However, with an increase of temperature, the dissolution rate increased greatly, and crack nucleation and dissolved regions appeared simultaneously. When the specimens were immersed in a sodium chloride solution at the same concentration, the porosity s presented gradual upward trends with a rise in temperature, whereas, when the specimens were immersed in the sodium chloride solution at the same temperature, the porosity tended to decrease with the increase of sodium chloride concentration. In the process of leaching, the hydration of illite, montmorillonite, and the residual skeleton of glauberite led to the expansion of the specimen volume, thereby producing the cracks. The diameter expansion rate and the expansion velocity of the specimen increased with temperature increase, whereas, due to the common-ion effect, the porosity of the specimen decreases with the increase of sodium chloride solution concentration.

1. Introduction

Thermal-hydrological-chemical (THC) interactions are widely recognized and studied by researchers from different fields, including hydraulic engineering, civil engineering and geological environmental engineering [1,2,3,4,5]. The existing research on THC coupling has benefited these different engineering disciplines, with each of them having different key interacting factors influencing various projects. In the area of underground mineral resource development using the method of leach mining, pore structure of geo-materials, solution temperature, and chemical reaction kinetics are the key factors to solution migration, solute diffusion and recovery efficiency [6,7,8,9,10,11]. Leach mining is the extraction of useful minerals (elements or compounds) such as inorganic salt, copper, and uranium which are naturally dissolved in a leaching solution (water, chemical solvents, or microorganisms) [6,7,8]. The method was first used for sodium chloride and copper mining, and in the late 1970s, it was widely used for glauberite mining and refining. Glauberite ( Na 2 Ca ( SO 4 ) 2 ) is an important sulphate deposit with potential industrial value because, not only can it be used as a substitute after the depletion of mirabilite deposits, but it is also recognized as the ideal medium for the storage of oil, natural gas, and carbon dioxide due to its low permeability, simple hydrogeology, and wide geographical distribution (see Figure 1) [12,13,14]. At present, the traditional mining method used in glauberite (blast-cave-leach mining) has many disadvantages, such as a high labour intensity, low recovery rate, and creation of environmental pollution. Therefore, some scholars proposed the adoption of in situ leaching to mine glauberite deposits [13]. In the glauberite mining (or leaching) process using the method of in situ leach mining, the glauberite ore is immersed in different concentrations of sodium chloride solution (or brine) at different temperatures for a few days. Under the effect of hot brine, the microstructure of glauberite minerals is changed due to the dissolution of sodium sulphate and the modification of calcium sulphate structure (i.e., the crystallization of calcium sulphate dihydrate) [13]. It is interesting to note that the leaching process is a typical THC multi-field coupling problem which involved the interaction and multi-influence of fluid migration, mineral dissolution, chemical reaction, solute diffusion, and heat exchange. In this complex process, these influence factors may greatly affect the pore microstructure, eventually resulting in a series of changes in macroscopic properties (i.e., mechanical strength and hydraulic conductivity), as happens with other rocky materials, such as cement-based ones [15,16,17]. Notably, the pore microstructure is closely related with the leaching efficiency and cavity stability of the glauberite deposit. Given all these, it raises questions about how the pore microstructure of glauberite changes under the effect of THC coupling. Will the solution temperature and concentration greatly affect the pore microstructure and eventually affect the mechanical strength and permeability? To address the questions, it is necessary to study the evolution of the pore microstructure of glauberite during the leaching process.
Several researchers previously concentrated on the effect of external environment on rock microstructures under the THC coupling effect. Meer et al. [18] have discussed the microstructure evolution of gypsum in the present of saline pore fluid and NaCl-free pore fluid. They concluded that pressure solution in gypsum is controlled by the precipitation reaction, and diffusion is unlikely to be the rate-controlling mechanism of pressure solution. Zhao et al. [19] investigated evolution characteristics of pores and the residual porous skeleton of glauberite, and concluded that three zones are present from dissolution interface to the outside in the process of glauberite dissolution. Zhang et al. [14] studied the cementation state and the grain arrangement mode of the halite and salt interlayers with scanning electron microscope analyses. They concluded that halite and argillaceous anhydrite are mixed together, and the pores of the halite are filled with argillaceous minerals. Liang et al. [20] have studied the mechanical properties of gypsum soaked in hot brine. They concluded that the weakening coefficient of gypsum increases with the increase of brine temperature, whereas it decreases with the increase of brine concentration. Yu et al. [21] experimentally presented the meso-structure of gypsum rock after treatment with pure water, half saturated brine, and saturated brine. They asserted that the weakening effect of half-saturated brine on gypsum is the most severe. Meng et al. [4] studied the weakening mechanism of gypsum under brine saturation. They concluded that the foremost reason for the weakening of gypsum is that the heat or water can easily separate the hydrogen bonds, which will lead to molecular chain and layer structure separation and dislocation.
In summary, the external environment may greatly affect the physical properties of rock, and the porosity is an important parameters to characterize the microstructure of rock [22,23,24,25]. However, all the research discussed above showed the microscopic damaging behaviours of rock salt, granite, and gypsum under different conditions and, to the authors’ best knowledge, there is little research on microstructural evolution and the weakening mechanism of glauberite under the effect of THC coupling. It is well known that minerals variably respond in the presence of chemicals depending on their crystal structure and chemical composition [4]. Thus, in this study, the micro-computed tomography (MCT) scanning was conducted to obtain the porosity of specimens under different conditions and to discuss the corresponding weakening mechanisms. This study is of great significance to the development of micromechanics, in situ leach mining, and technological progress.

2. Methods and Materials

2.1. Test Pieces and Test Methods

Glauberite ores were selected with the main component (75%) being Na 2 Ca ( SO 4 ) 2 , and the remaining components illite (10%), chlorite (5%), quartz (4%), mica (4%), and montmorillonite (2%). The core containing the glauberite was retrieved by the China National Petroleum Corporation in the Yingcheng Mine. We were not involved in the drilling work. However, we performed the work of core sampling and plug preparation. Note that we did not use the conventional method (a core-drilling machine) because it would cause unavoidable damage to the plug during the sample preparation. Therefore, we used a line cutting machine, which produces less damage, as shown in the figure below. The diameter of steel wire that was used in this paper is 0.3 mm. Glauberite cores were obtained from a bedded salt deposit buried more than 400 m underground in the Yunying salt formation, China, which belongs to a marine precipitate sequence. The Yunying Salt Mine is located in the middle of the Yunying Basin, in the northeast of the Jianghan Basin, Hubei Province. The Yunying Basin is an interior terrestrial faulted saline lake basin formed in Cretaceous and Tertiary systems. Well ZK-1053 was drilled by the China National Petroleum Corporation in the Yingcheng Mine to provide the formation data for the experimental analysis (see Figure 2).
In order to observe the evolution of the meso-structure clearly, the glauberite ores were processed into many small ( ϕ 3 × 10 mm) cylindrical specimens (see Figure 2b,c). The lithology of glauberite is chiefly middle-fine salt with good sorting and low texture maturity. The shape of the crystals is mainly subangular and sub-rounded, and the content of matrix is low; the particle is coarser, and the fractures are very clear; the phenocryst is mainly composed of sodium sulphate, calcium sulphate, and illite, and the matrix is quartz; and the rock is characterized by low porosity and low permeability.

2.2. Test Equipment

The main equipment used in this study was the μCT225kVFCB high-accuracy (μm grade) CT test analysis system (the machine is made in Taiyuan University of Technology, Shanxi province, China) (see Figure 3a). It consists of a digital flat detector, a micro-focus X-ray machine, a high-precision work turntable and fixture, an acquisition and analysis system and other structural components, as shown in Figure 2. The micro-focus X-ray machine in the micro CT test system allowed weak currents (only 0.01–3.00 mA) which issued a small cone beam of X-ray scanning and then projected the scanned image to the digital flat-panel detector for display. The minimum focus size of the micro-focus X-ray machine was 3 μm, the focal length was 4.5 mm, and the maximum power was 320 W. In high-magnification tests for small specimens, a low power of 20–30 W ensured sharp focus. Due to all of these features, the system could realize three-dimensional CT scanning analysis of various metal and non-metallic materials. The magnification is 1–400 times, the rock sample size is φ1–50 mm, and the scanning unit resolution is 0.194 mm per magnification. For a specimen 400 times magnified, the size of the scan cell was 0.5 μm, which could distinguish 0.5 μm pores and cracks.
The basic principle of CT scanning relies on the penetrating power of the X-ray. In the scanned image, the dark areas relate to regions of low density, and the bright colours indicate the high-density regions—in grayscale, the whiter areas represent the higher density. Therefore, by scanning slices and unit analysis in all directions, the morphological distribution of the rock particles and the distribution and connectivity of the pore fissures would be clear.

2.3. Test Method

Then, the specimens were immersed in three different solutions and at three different temperatures; thus, there were nine different sets of experimental conditions. The solutions were pure water, half-saturated brine and saturated brine. The temperatures were 20, 50, and 80 °C. Six specimens were tested under each set of conditions; thus, 54 tests were performed in total.
Firstly in this experiment, MCT scanning was conducted for the specimens in a dry state, and then each specimen was immersed in pure water, semi-saturated, and saturated brine, respectively, at three different temperatures of 20, 50, and 80 °C. An intelligent water bath thermostatic device was used to accurately control the temperature throughout the process. Due to the changes of microstructure of specimens immersed in different conditions, it was important to conduct the MCT scanning of the specimens at regular intervals. The soaking duration for the specimens was 30 h, and the MCT scans of the column specimens were conducted while they were in the dry state and after they had been immersed for 10, 20, and 30 h. In order to ensure the comparability of the results before and after the scanning, the same part of the specimen was selected for comparison, and the corresponding microstructural evolutions were analysed. The detailed experimental procedures are shown below.
Experimental process: (1) Put 2000 mL of the pre-prepared liquid (pure water, half-saturated brine, or saturated brine) into dry and clean reagent bottles and mark them with numbers; (2) Heat each bottle using the SHSWCT (see Figure 3b) for approximately 20 min to ensure that the liquid temperature in each bottle rises to the predetermined temperature; (3) Gently place each specimen into the correct bottle filled with liquid and seal each bottle to ensure that the concentration of the solution in the bottles does not change via heating. Maintain a stable temperature for the predetermined duration; (4) Tweeze the specimens out of the bottles lightly to make sure that the specimens are not damaged by the tweezers, and dry the surface of each specimen with filter paper; (5) Dry the specimens using a drying oven for approximately 10 min at 30 °C to ensure that the specimens are desiccated; (6) Scan the specimens, including the original specimens using MCT; (7) After performing the MCT tests, put the same specimens into the bottle again for the next soaking saturation, and repeat the steps 4–7.
After the MCT tests, the MCT dataset needs to be constructed by binarization, in which a distinct set of classes is created and every single datapoint is assigned to a class. That is, the binarization of an image is to set the gray value of the pixel on the image to 0 (black) or 255 (white). However, the value of the final segmentation result is highly dependent on the thresholding techniques; hence, the porosity partially reflects the choices made by the operator. Note that conventional thresholding techniques (e.g., global thresholding) usually fail to extract narrow cracks and low porosity. In this paper we, therefore, chose to apply 3D voxel-based segmentation using the multiscale Hessian filter (MSHFF) of [26]. This approach, which involves low computational requirements, cannot only precisely extract the fractures and apertures from the MCT database but also better estimate the micro-porosity for rock types with smaller ranges of pore sizes. The MSHFF method has been implemented as macrocode in MATLAB. Second, the areas of the extracted fractures and apertures are calculated by using MATLAB. Then, the porosity may be obtained by dividing the fracture and aperture areas by the total area of the specimen.

3. Test Results

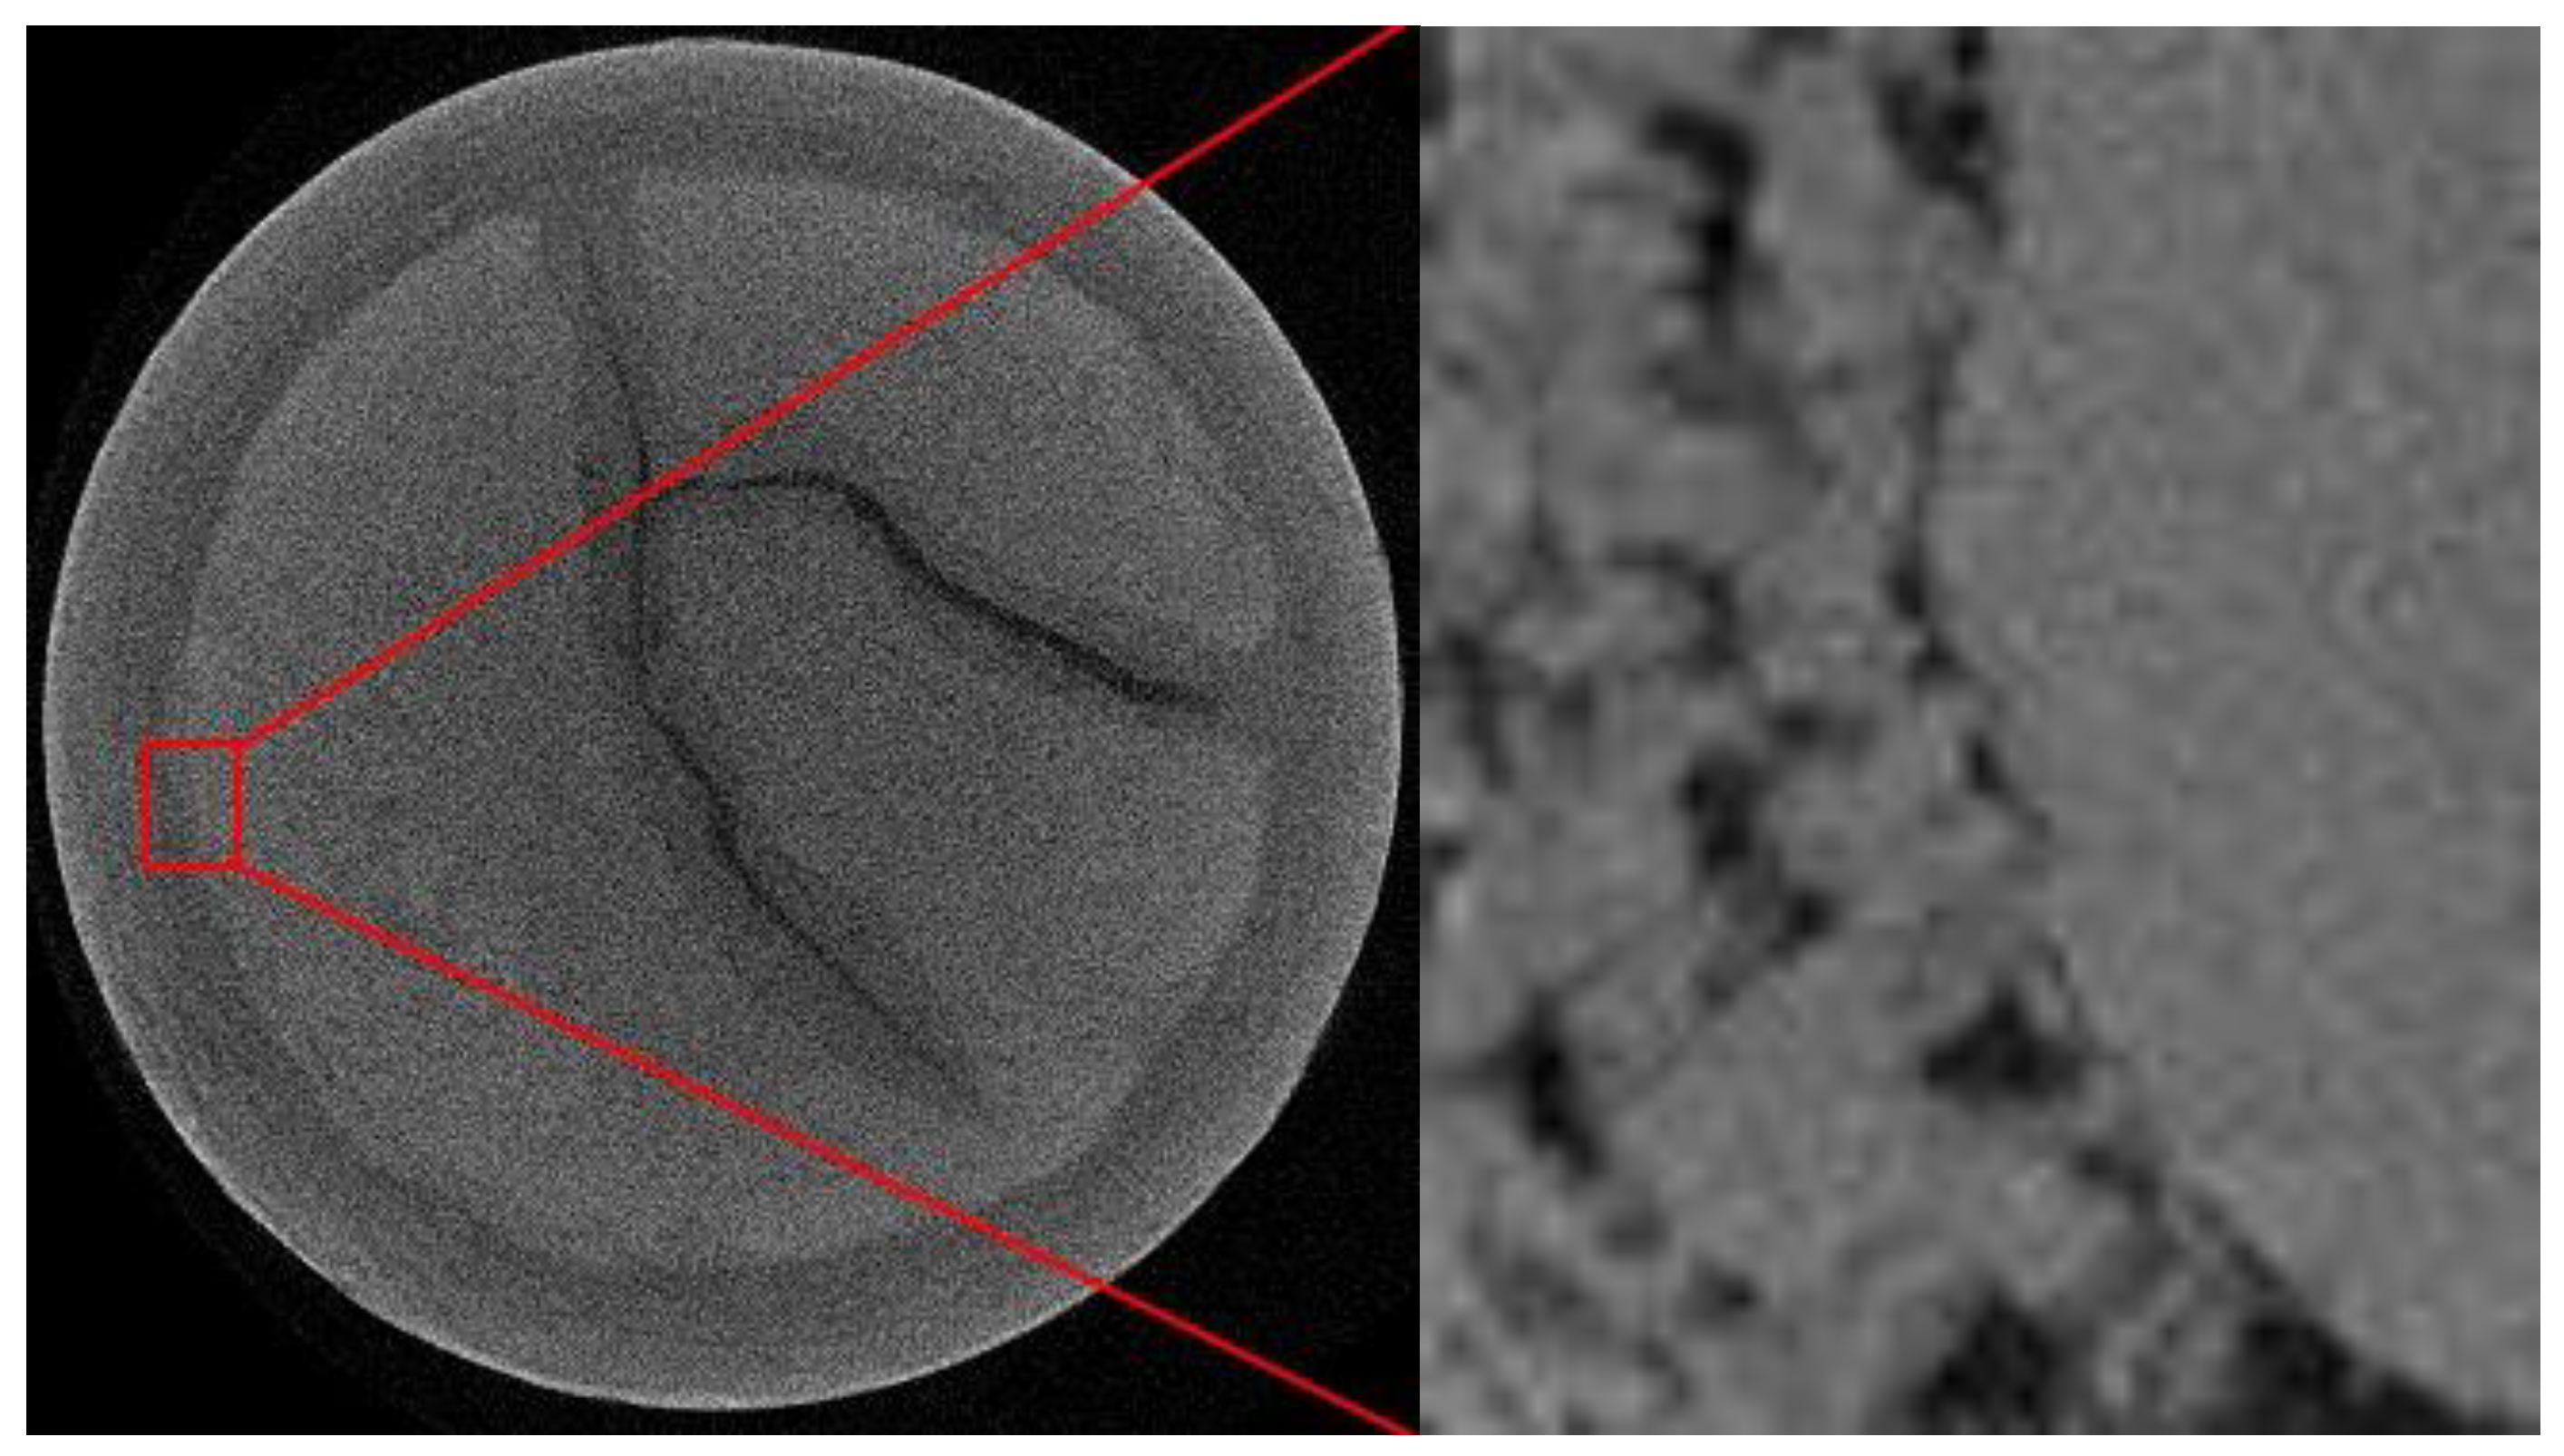
3.1. MCT Analysis of Microstructural Evolution

Figure 4, Figure 5 and Figure 6 show the microstructure evolution of glauberite in pure water at different temperatures. Obviously, the microstructure evolution of glauberite varied greatly according to the pure water temperature. As can been seen in Figure 4, the structure of the specimen was compact with no obvious cracks after 10 h of immersion in pure water. However, when the specimens were immersed for 20 h, arbitrary branched and intersecting micro-cracks appeared inside the specimens. After 30 h, the aperture and length of the cracks increase considerably. In Figure 5, the water temperature was 50 °C. Micro-cracks emerged after 10 h of immersion, and the micro-crack density increased with the soaking time. In addition, after 30 h, banded dissolved areas were formed around the micro-cracks, and secondary branching cracks were nucleated in the main crack. Figure 6 indicates that the crack number greatly increased over time. After 30 h of immersion, the specimen broke up completely, and notches appeared at the edges. However, vastly distinct from Figure 4 and Figure 5, large-scale dissolved areas (i.e., dark areas) were observed in Figure 5 when the specimens were only immersed for 10 h at 80 °C, whereas the dissolved areas in Figure 4 and Figure 5 were negligible when immersed even for 30 h after 30 h of immersion. Overall, from the comparison of these MCT images, it could be determined that temperature may have accelerated the breakdown and dissolution rate of the glauberite.
Figure 6, Figure 7 and Figure 8 display the microstructure evolution of the specimen in a 80 °C solution with various concentrations. It is clear in Figure 7 that there were a great number of internal cracks and point-like dissolved areas inside the specimen after immersion in half saturated brine for 10 h. Additionally, the crack density and dissolution areas increased over time until, finally, the specimen broke up thoroughly. However, as seen in Figure 7, the dissolution areas and the number of cracks were much smaller than those shown in Figure 6, and no notches on the edges occurred. Figure 8 shows that the dissolved areas were only concentrated around the crack lines. The location of dissolved areas was totally different from that of Figure 6 and Figure 7. Furthermore, the dissolved areas appeared after immersion in saturated brine for 30 h. Overall, by comparing the variation trend of dissolved areas, it was concluded that the chloride ion inhibited the dissolution of glauberite.

3.2. The Porosity of Glauberite under Varying Conditions

Figure 9 and Table 1 shows the average porosity evolution of glauberite with different immersion times under different conditions. The porosity refers to the ratio of the total area of the minute voids in the cross section of the specimen to the total area of the cross section. In this paper, the self-developed MCT image analysis software was applied so as to statistically analyse the grey values of the glauberite MCT images, and determine the porosity under different conditions. As can be seen in Table 1, the porosity of glauberite specimens varied greatly depending on the solution temperature and concentration. When immersed in pure water at room temperature, the porosity of glauberite was 7.29% after immersing for 30 h. When the temperature was raised to 50 °C, the porosity of glauberite was 7.52% after immersing for 20 h and the porosity of glauberite after immersing for 10 h at 80 °C was 7.84%. Obviously, temperature played an important role in the dissolution of the glauberite and the evolution of pore microstructure. Furthermore, increasing the temperature shortened the dissolving time.
When comparing the porosity of specimens immersed in solution at 80 °C with different concentrations, it could be found that the porosity reached 19.48% after 30 h of immersion in pure water which was 16.23 times that of the initial porosity (dry condition), while the porosity was, respectively, 7.52% and 6.71% after immersion in half-saturated and saturated sodium chloride solution, which was 8.26 times and 3.92 times higher than the initial porosity. The differences between the porosity growth further proved that the concentration of a solution had an inhibiting effect on the evolution of glauberite pores. The higher the concentration the stronger the inhibition.
In summary, by analysing the micrographs and porosity of glauberite after immersion in pure water at different temperatures, it could be concluded that the dissolution was very slow at low temperature; the cracks appeared to initiate in the centre of the discs, and then acted as seepage channels for further dissolution. The dissolution rate increased greatly as the temperature rose, and the dissolved areas and kinked cracks were generated simultaneously in the specimens. Additionally, the crack density and the dissolution area increased with the temperature. By analysing the micrographs and porosity of glauberite after immersion in brine with varying concentrations, it could be concluded that the crack density and dissolution rate decreased with the increase in brine concentration.

4. Discussion

4.1. Weakening Mechanism of Glauberite

Glauberite ( Na 2 Ca ( SO 4 ) 2 ) is a special rock, with the main components of sodium sulphate (water-soluble) and calcium sulphate (slightly water-soluble) [12,13,14]. The microstructure evolution (or leaching) of glauberite in solution is a complicated process of dissolution-crystallization interaction [13]. Namely, the dissolution of sodium sulphate in glauberite is almost simultaneous with the crystallization of calcium sulphate dehydrate. When the specimen dissolution was totally complete, the surface of the specimen residuals were covered with a layer of white needle-like gypsum crystals. A detailed leaching process of glauberite is as follows:
There are two different kinds of evolution processes for the specimens soaked in liquid. The two evolutionary processes are shown below.
(1) For the intact specimens with no cracks, the microstructural evolution process was very regular and orderly. As can be seen in Figure 10, Figure 11 and Figure 12, the specimens were gradually dissolved from the outside to the inside, and the pores and three zones were formed during the leaching process. The zones were the dissolved area (or residual skeleton, porous structure), the undissolved area (i.e., dense and intact area), and the circular solid-liquid interface (i.e., circular line), respectively. As we all known, glauberite ( Na 2 Ca ( SO 4 ) 2 ) is a special rock, with the main components of sodium sulphate ( NaSO 4 ) (water-soluble) and calcium sulphate ( CaSO 4 ) (slightly water-soluble). The sodium sulphate is water-soluble, whereas the calcium sulphate is poorly soluble in water. Hence, when the glauberite was in contact with water, the sodium ions and calcium ions ( Na + , SO 4 2 ) in the crystal lattice were electrostatically attracted by the water molecules with an opposite charge, and if the attractive force of the water molecule to the ions was sufficient to overcome the attractive force between the ions in the crystal lattice, the glauberite crystal lattice was destroyed and the soluble minerals were dissolved by water. The chemical formula is as follows:
Na 2 Ca ( SO 4 ) 2 2 Na + + SO 4 + Ca SO 4
CaSO 4 Ca 2 + + SO 4 2
After dissolution, the remaining insoluble matter (i.e., CaSO 4 or CaSO 4 · 2 H 2 O ) in glauberite became the residual skeleton. On one hand, this increased the porosity of the specimen and, on the other hand, the penetration resistance of the solution was greatly reduced due to the seepage paths (i.e., residual skeleton) (see Figure 10, Figure 11 and Figure 12). Then, the solution easily flowed via the preferential seepage paths through the dissolved zones and came into contact with the newly-exposed minerals to form a new solid-liquid interface. Eventually, the sodium sulphate would be completely dissolved and removed, whereas the calcium sulphate would completely become the residual skeleton.
(2) For the specimen with cracks, the microstructural evolution process was very irregular and complex. By comparison with the microstructures evolution process at different soaking duration, there were four different zones formed in the MCT images. The zones were dissolved area (or residual skeleton), cracks area, undissolved area, and circular solid-liquid interface, respectively. The reason why the evolution processes is complex is that the cracks formed during the leaching process will greatly affect the flow field and path line of liquid. That is, the liquid will concurrently flow via the preferential seepage paths through the dissolved zones (or residual skeleton) and cracks zones, and come into contact with the newly-exposed minerals to form several new solid-liquid interfaces (i.e., the cracks will become the new solid-liquid interfaces). Then, the dissolution trajectories initiated at the previous circular interface and the crack lines, and spread to the surrounding undissolved areas (see in Figure 6, Figure 7 and Figure 8 and Figure 13). By comparison, there was only one interface during the whole leaching process for the specimens with no cracks. Hence, the evolution process was very irregular and complex. It is worth to note that, primarily due to the clay (i.e., mainly illite and montmorillonite) hydration, swelling and the thermal cracking (more details see in the Section 4.1), the cracking can easily occur to the specimens when soaked in liquid.
As shown in Figure 14, due to the action of dissolution–penetration, sodium sulphate in the specimen was dissolved into the solution or water, and the insoluble calcium sulphate in the specimen formed the residual skeleton (the black parts represent the seepage pathways which resulted from the dissolution of sodium sulphate, whereas the white parts are the calcium sulphate or calcium sulphate dihydrate). Finally, the impermeable glauberite salt rock gradually became a permeable porous medium with calcium sulphate (or calcium sulphate dihydrate) as the solid skeleton, mechanically supporting and sustaining the network of seepage pathways and eventually changing and affecting the physical and mechanical properties of the glauberite. Additionally, the processes of crack initiation, propagation, and coalescence can also be observed on the petrographic thin section. For example, the cracks is not obvious for the dry specimen slice. However, after 5 min of dissolution, several cracks initiated at the centre of the petrographic thin section due to the impurity hydration and swelling. After 10 min of dissolution, the width of the cracks became obviously larger. This is because the pore liquid which infiltrated into the crack zones takes the crack lines as the new solid-liquid interfaces, and then preferentially dissolved the undissolved areas around the cracks. After 15 min of dissolution, the morphology of specimen underwent a considerable change; cracks completely disappeared; a variety of punctate pores were randomly distributed at the centre of microscope images; and a visible deformation occurred at the residual skeleton. This is because the calcium sulphate may have reacted with water to form calcium sulphate dihydrate in the process of leaching (i.e., crystallization, see in the Equation (3)), which will create the swelling force. Furthermore, the specimens contained a large percentage of impurities (mainly illite and montmorillonite) in addition to the glauberite. When the impurities were immersed in water, they absorbed moisture, leading to an increase in volume. Dékány et al. [27] asserted that the free swell ratio of illite and montmorillonite could reach 40% and 56%, respectively. Hence, the porous structures underwent an obvious deformation, and the cracks disappeared.
Ca 2 SO 4 + 2 H 2 O Dissollution Crystallization Ca 2 SO 4 · 2 H 2 O
Undoubtedly, all of these behaviours (i.e., chemical reactions and physical reactions) would greatly improve the porosity of the specimen and further accelerated the dissolution rate. For example, as shown in Table 1, compared with the porosity of the dry specimen, the porosity of the specimen soaked in pure water at 20 °C increased by 1.03 times after 10 h of immersion, 2.59 times after 20 h of immersion, and 4.64 times after 30 h of immersion. Obviously, this may have fully reflected the special permeability characteristics of glauberite during the leaching process.

4.2. The Effect of Temperature on the Microstructure of Glauberite

The MCT scan images of glauberite after immersing in pure water at 20 °C showed that the dissolution rate of glauberite was very slow. After 10 h of immersion, the porosity increased by only 3.8%; after 20 h of immersion, the porosity increased by 159.8%, and the cracks appeared to initiate at the centre of the discs, crisscrossed together. The reason for this is that the specimen contained a large percentage of impurities (mainly illite and montmorillonite, 12%) in addition to glauberite [13]. Dékány et al. [27] asserted that part of the impurities could be characterized by the super-hydrophilic performance and large expansibility factor. Based on their experimental results, the free swell ratio of a specimen could reach 40%. Therefore, when immersed in pure water, the specimen volume expanded, thus, generating cracks inside the specimen. Subsequently, the solution or water accumulated in the crack regions, and as a result, the crack faces (or crack lines) became the new solid-liquid contact surfaces. Thus, after being immersed for 30 h, new dissolving regions appeared around the crack lines (see Figure 4). When the specimens were immersed in pure water at 50 °C and 80 °C for only 10 h, complex cracks appeared at the centre of the discs, and the porosity growth rate of the pore number increased with the temperature. For example, the exponent (i.e., regression equations of glauberite porosity with time) in 80 °C pure water (immersing for 30 h) were 1.19 times and 1.20 times that of 50 °C, and 1.38 times and 1.43 times that of 20 °C. The main reasons are as follows:
(1)
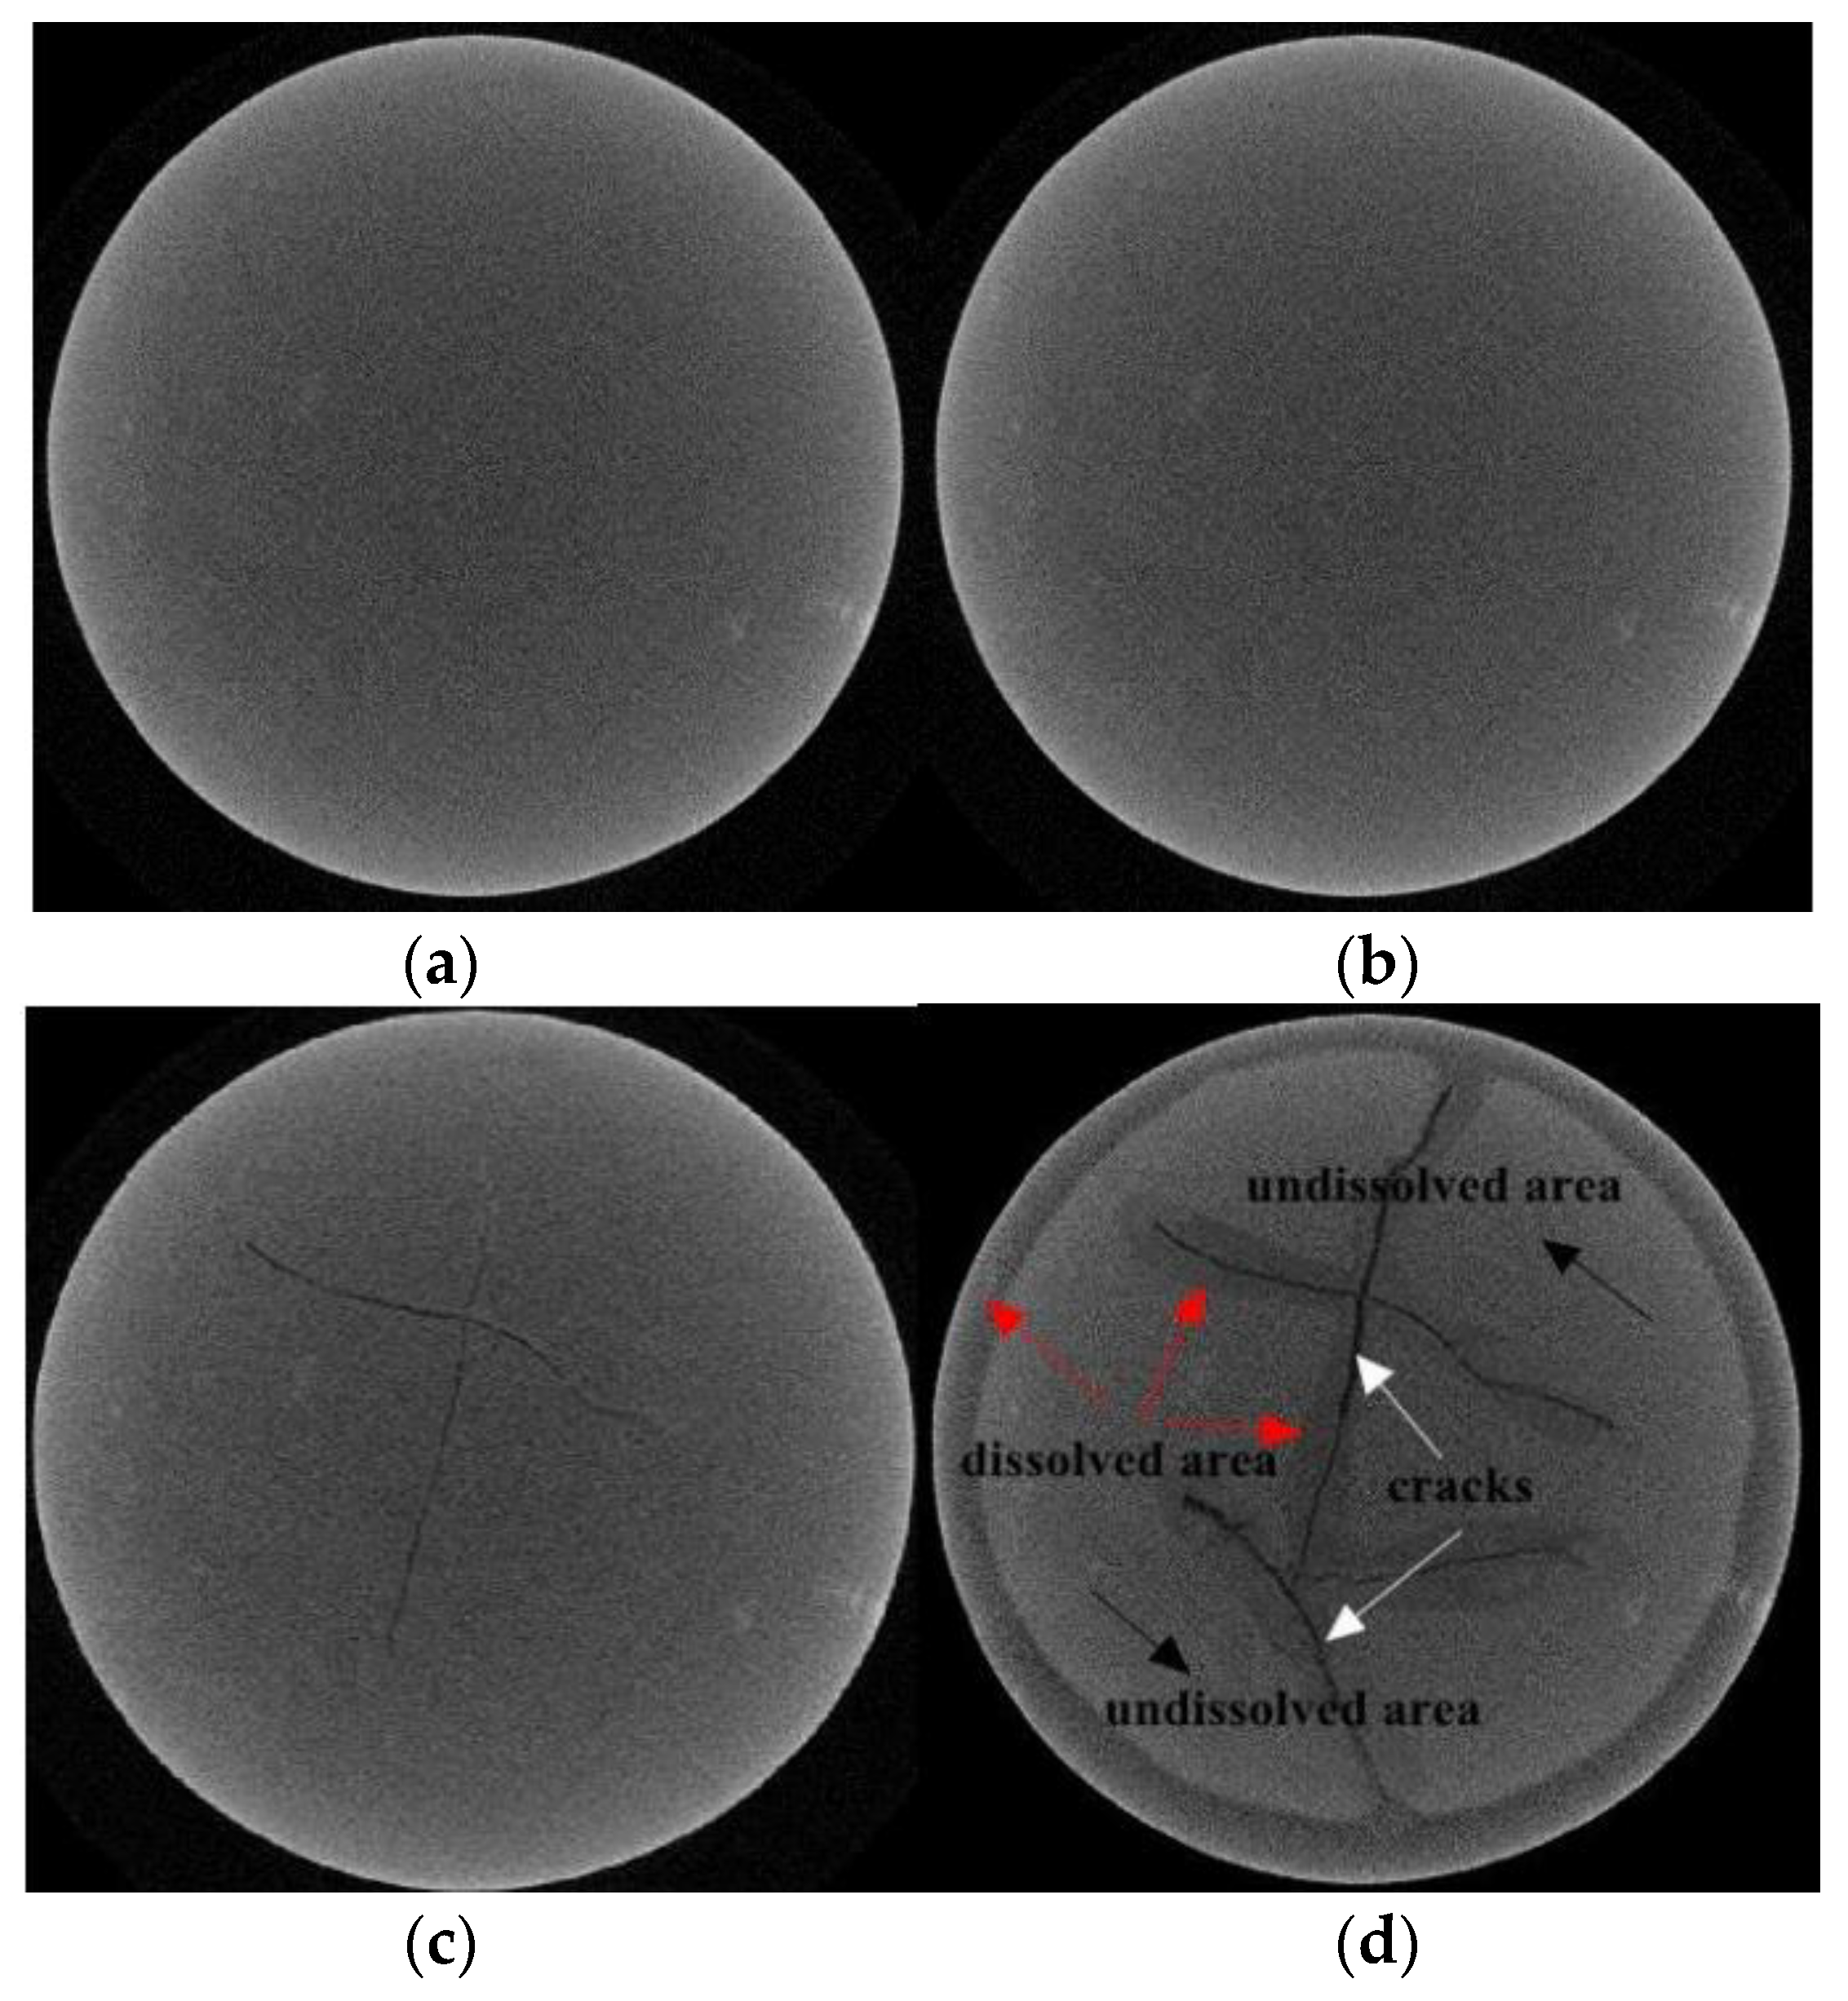
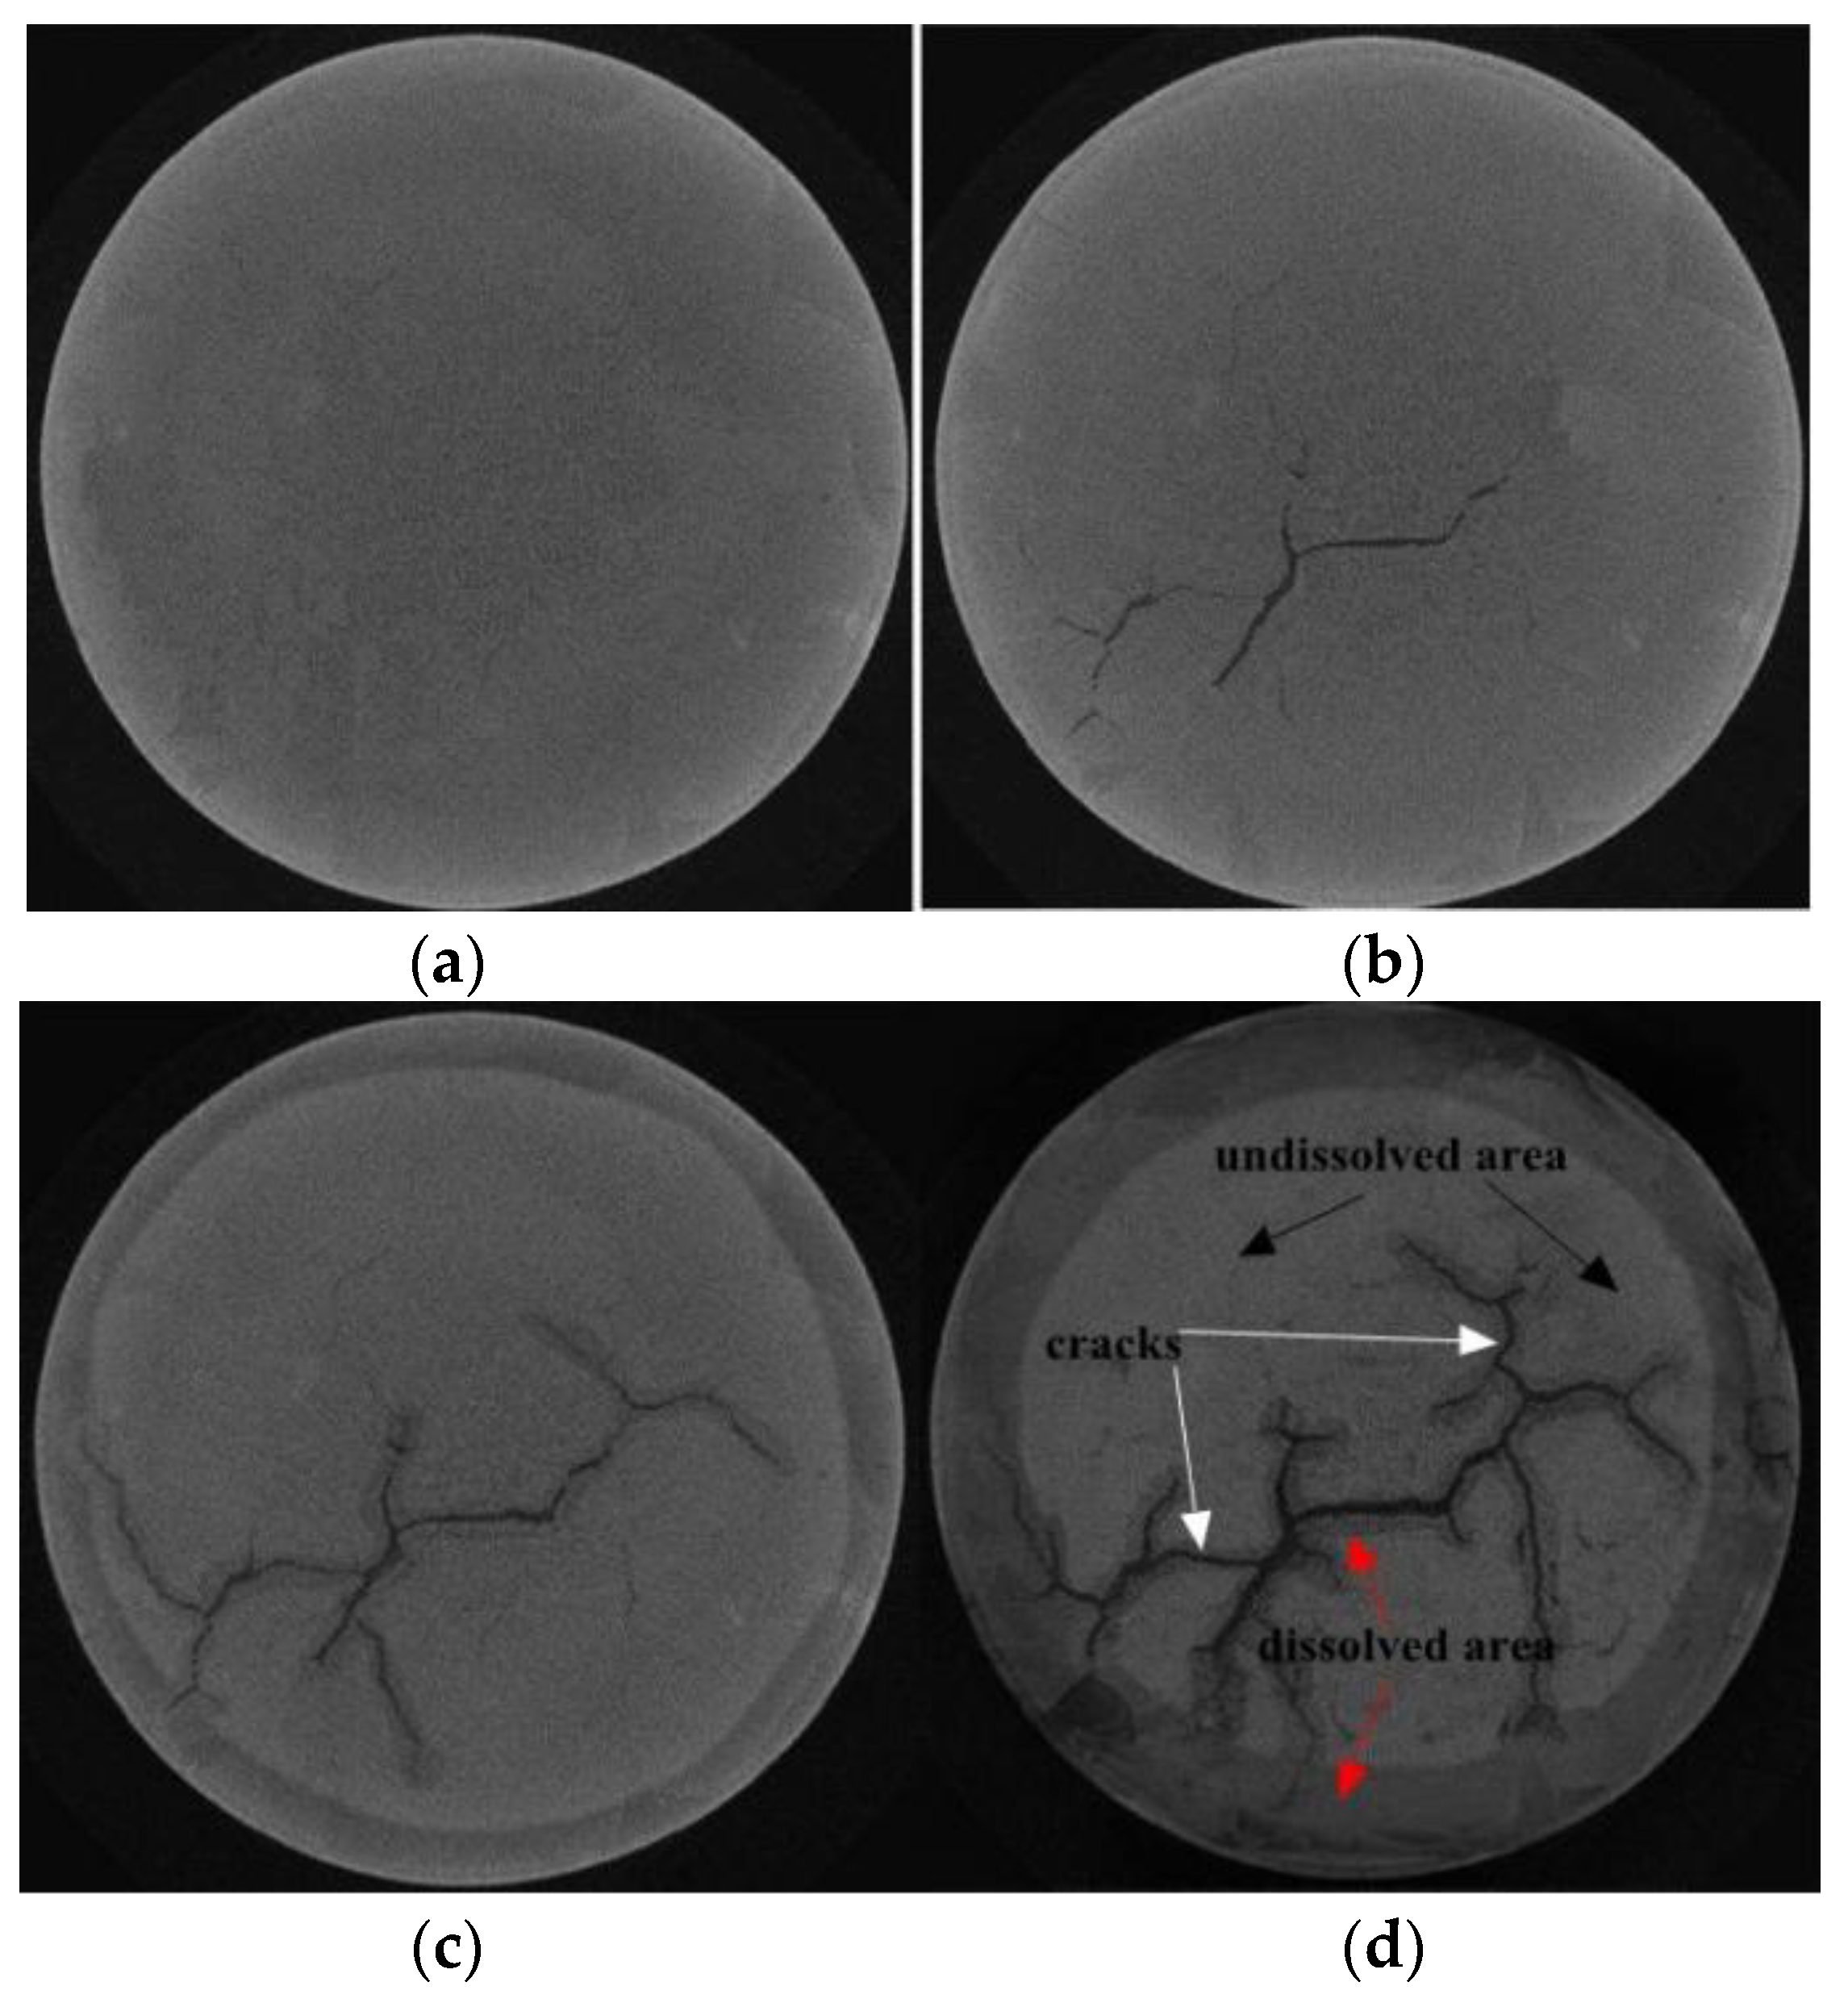
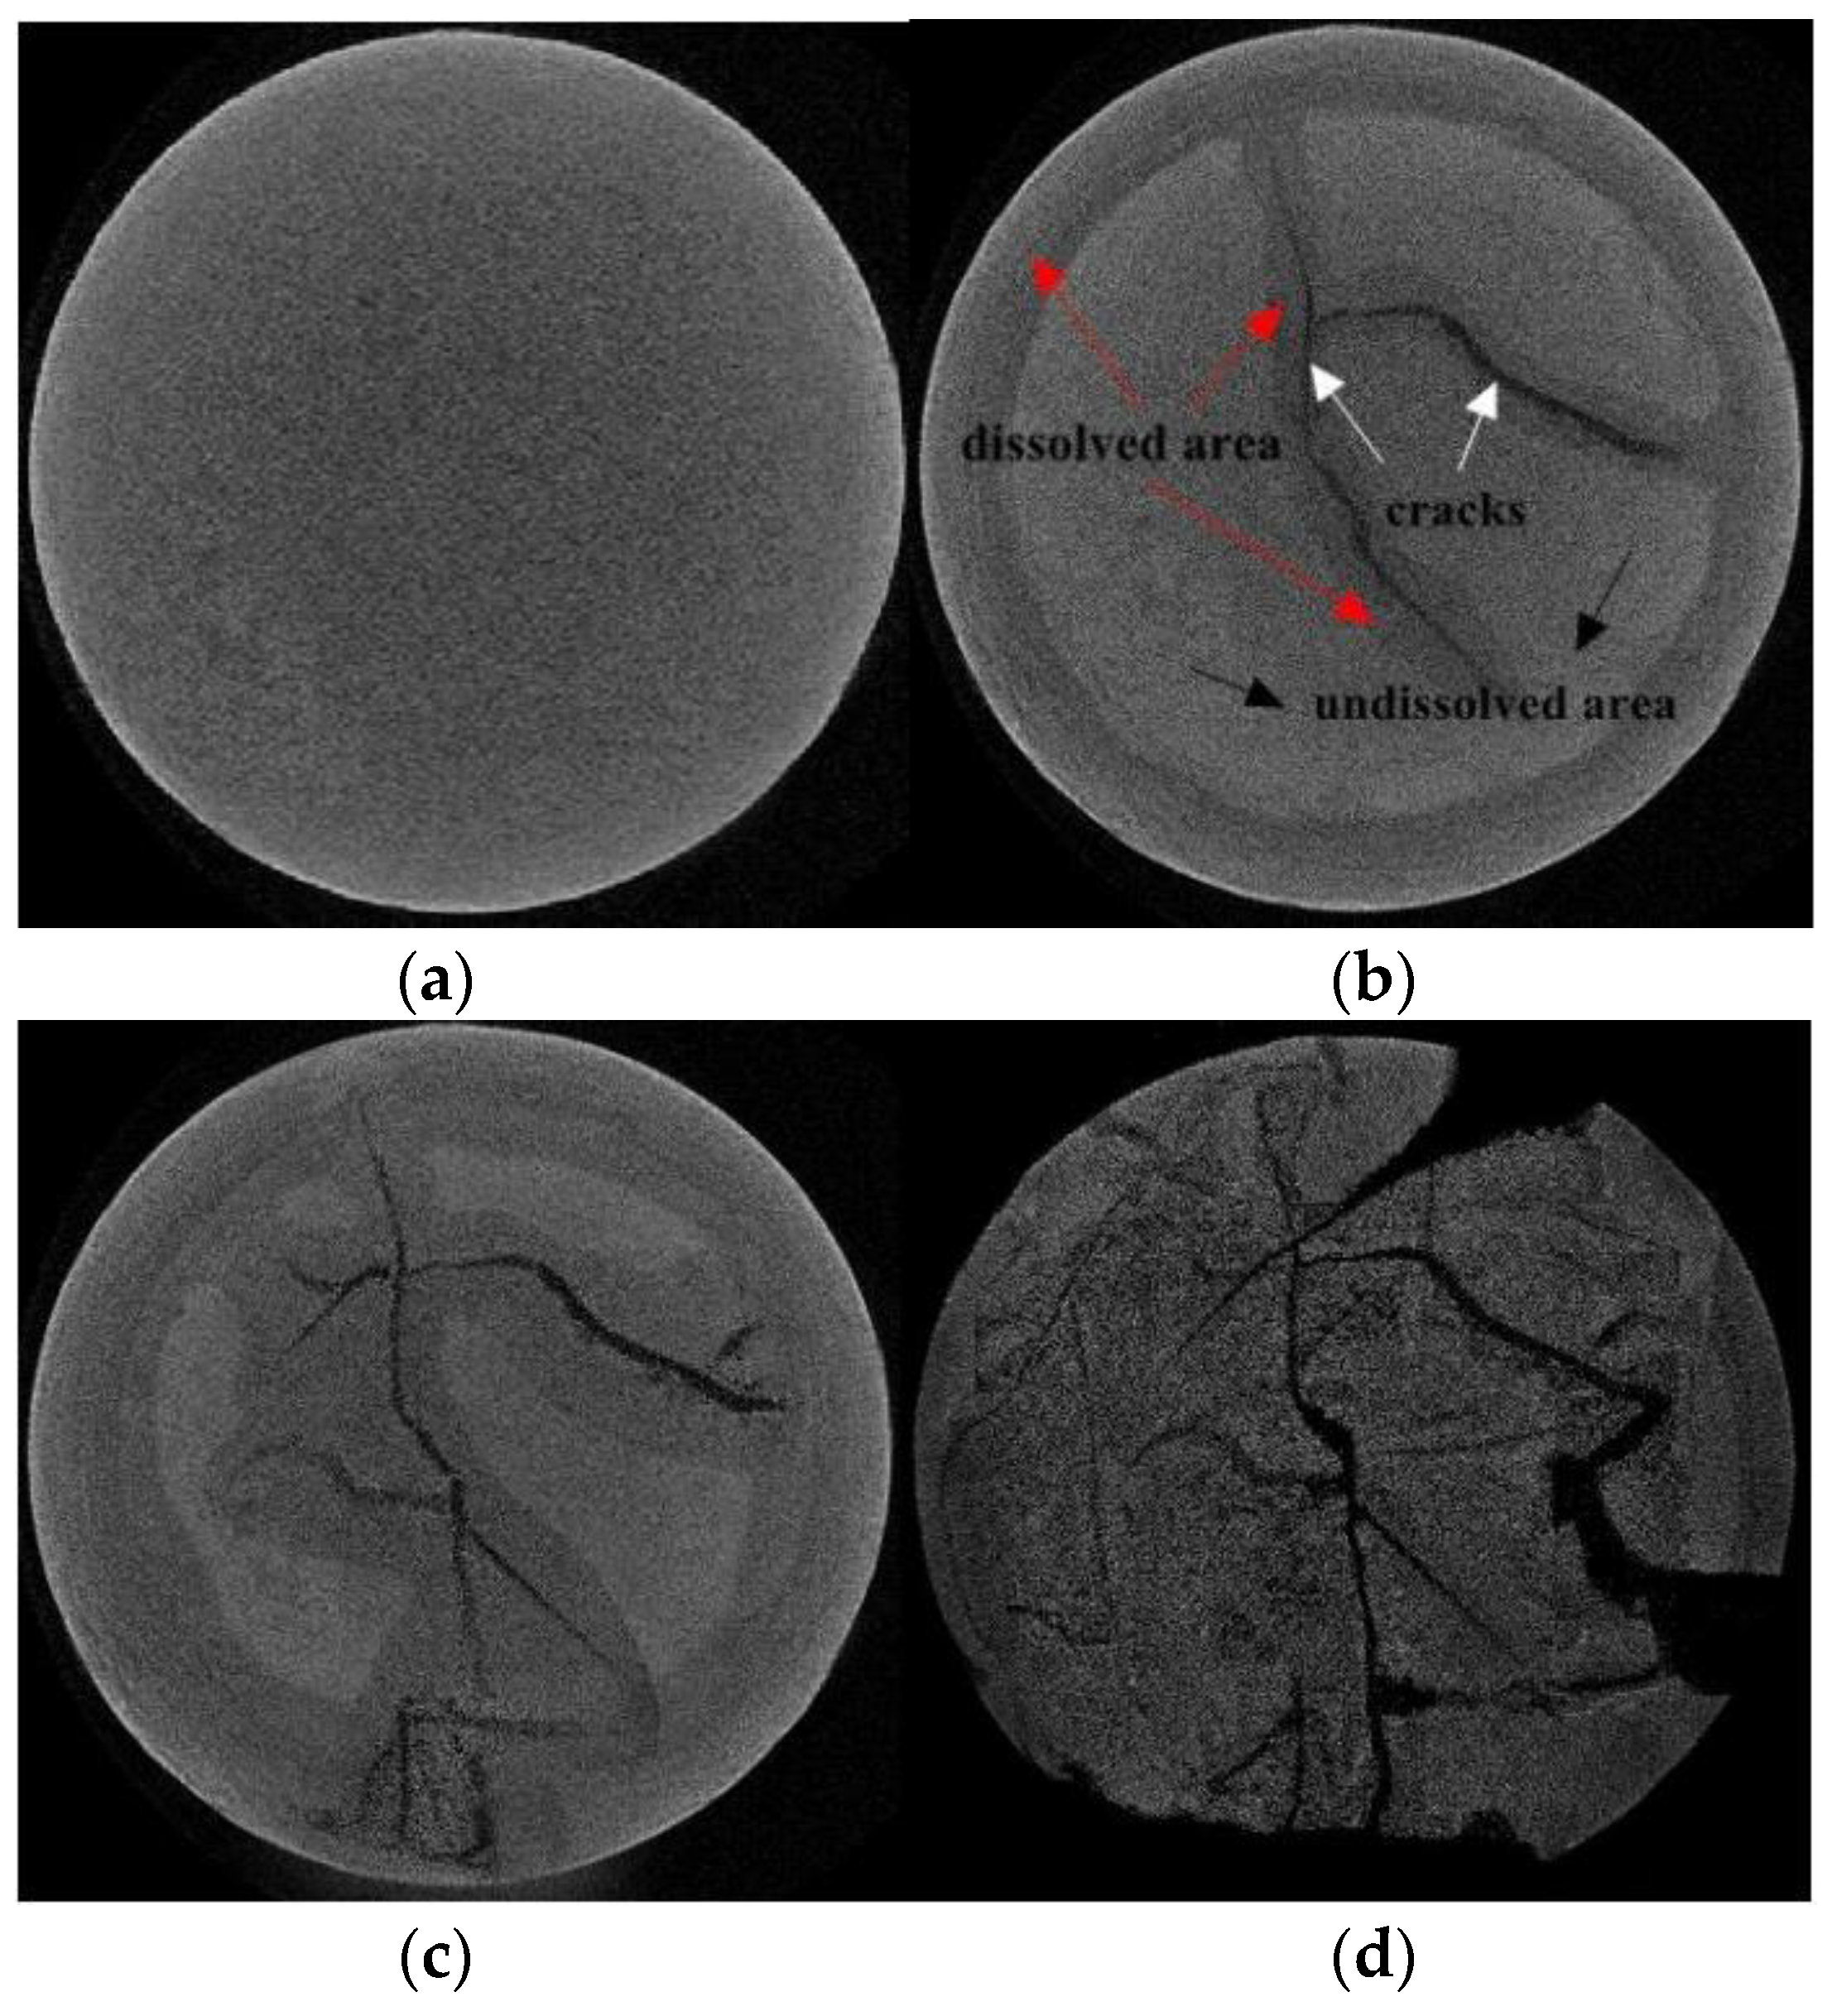
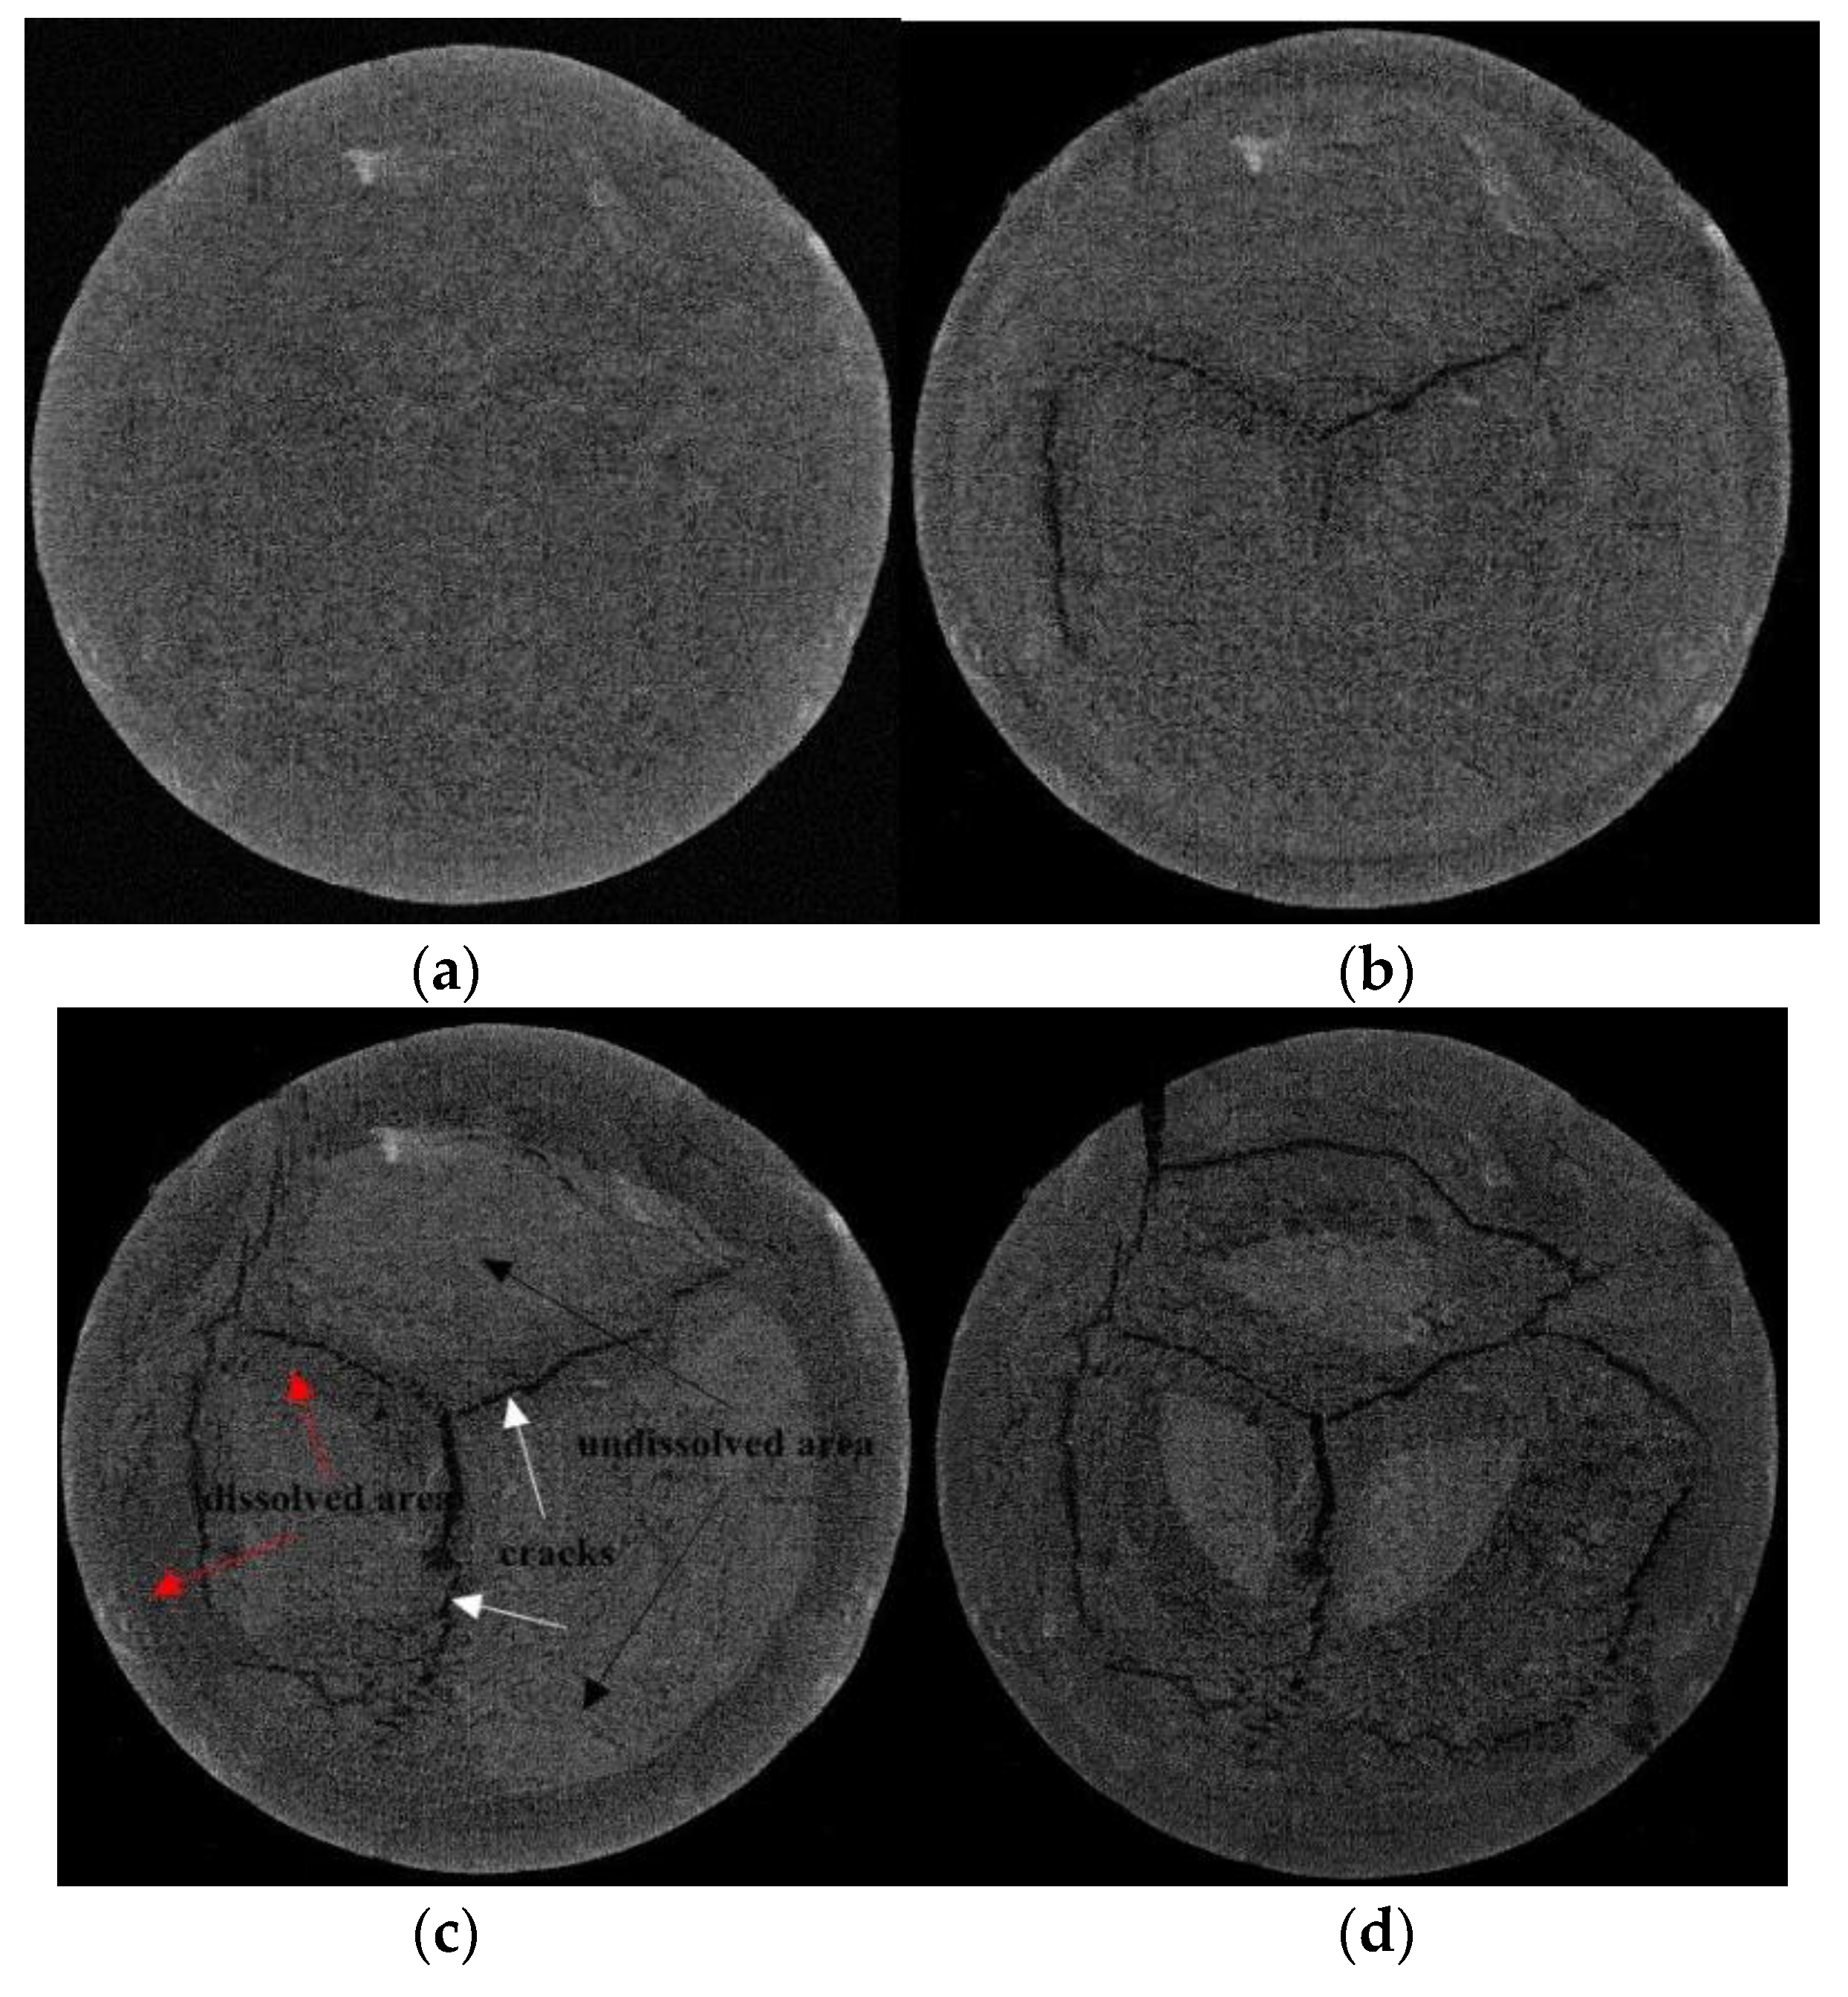
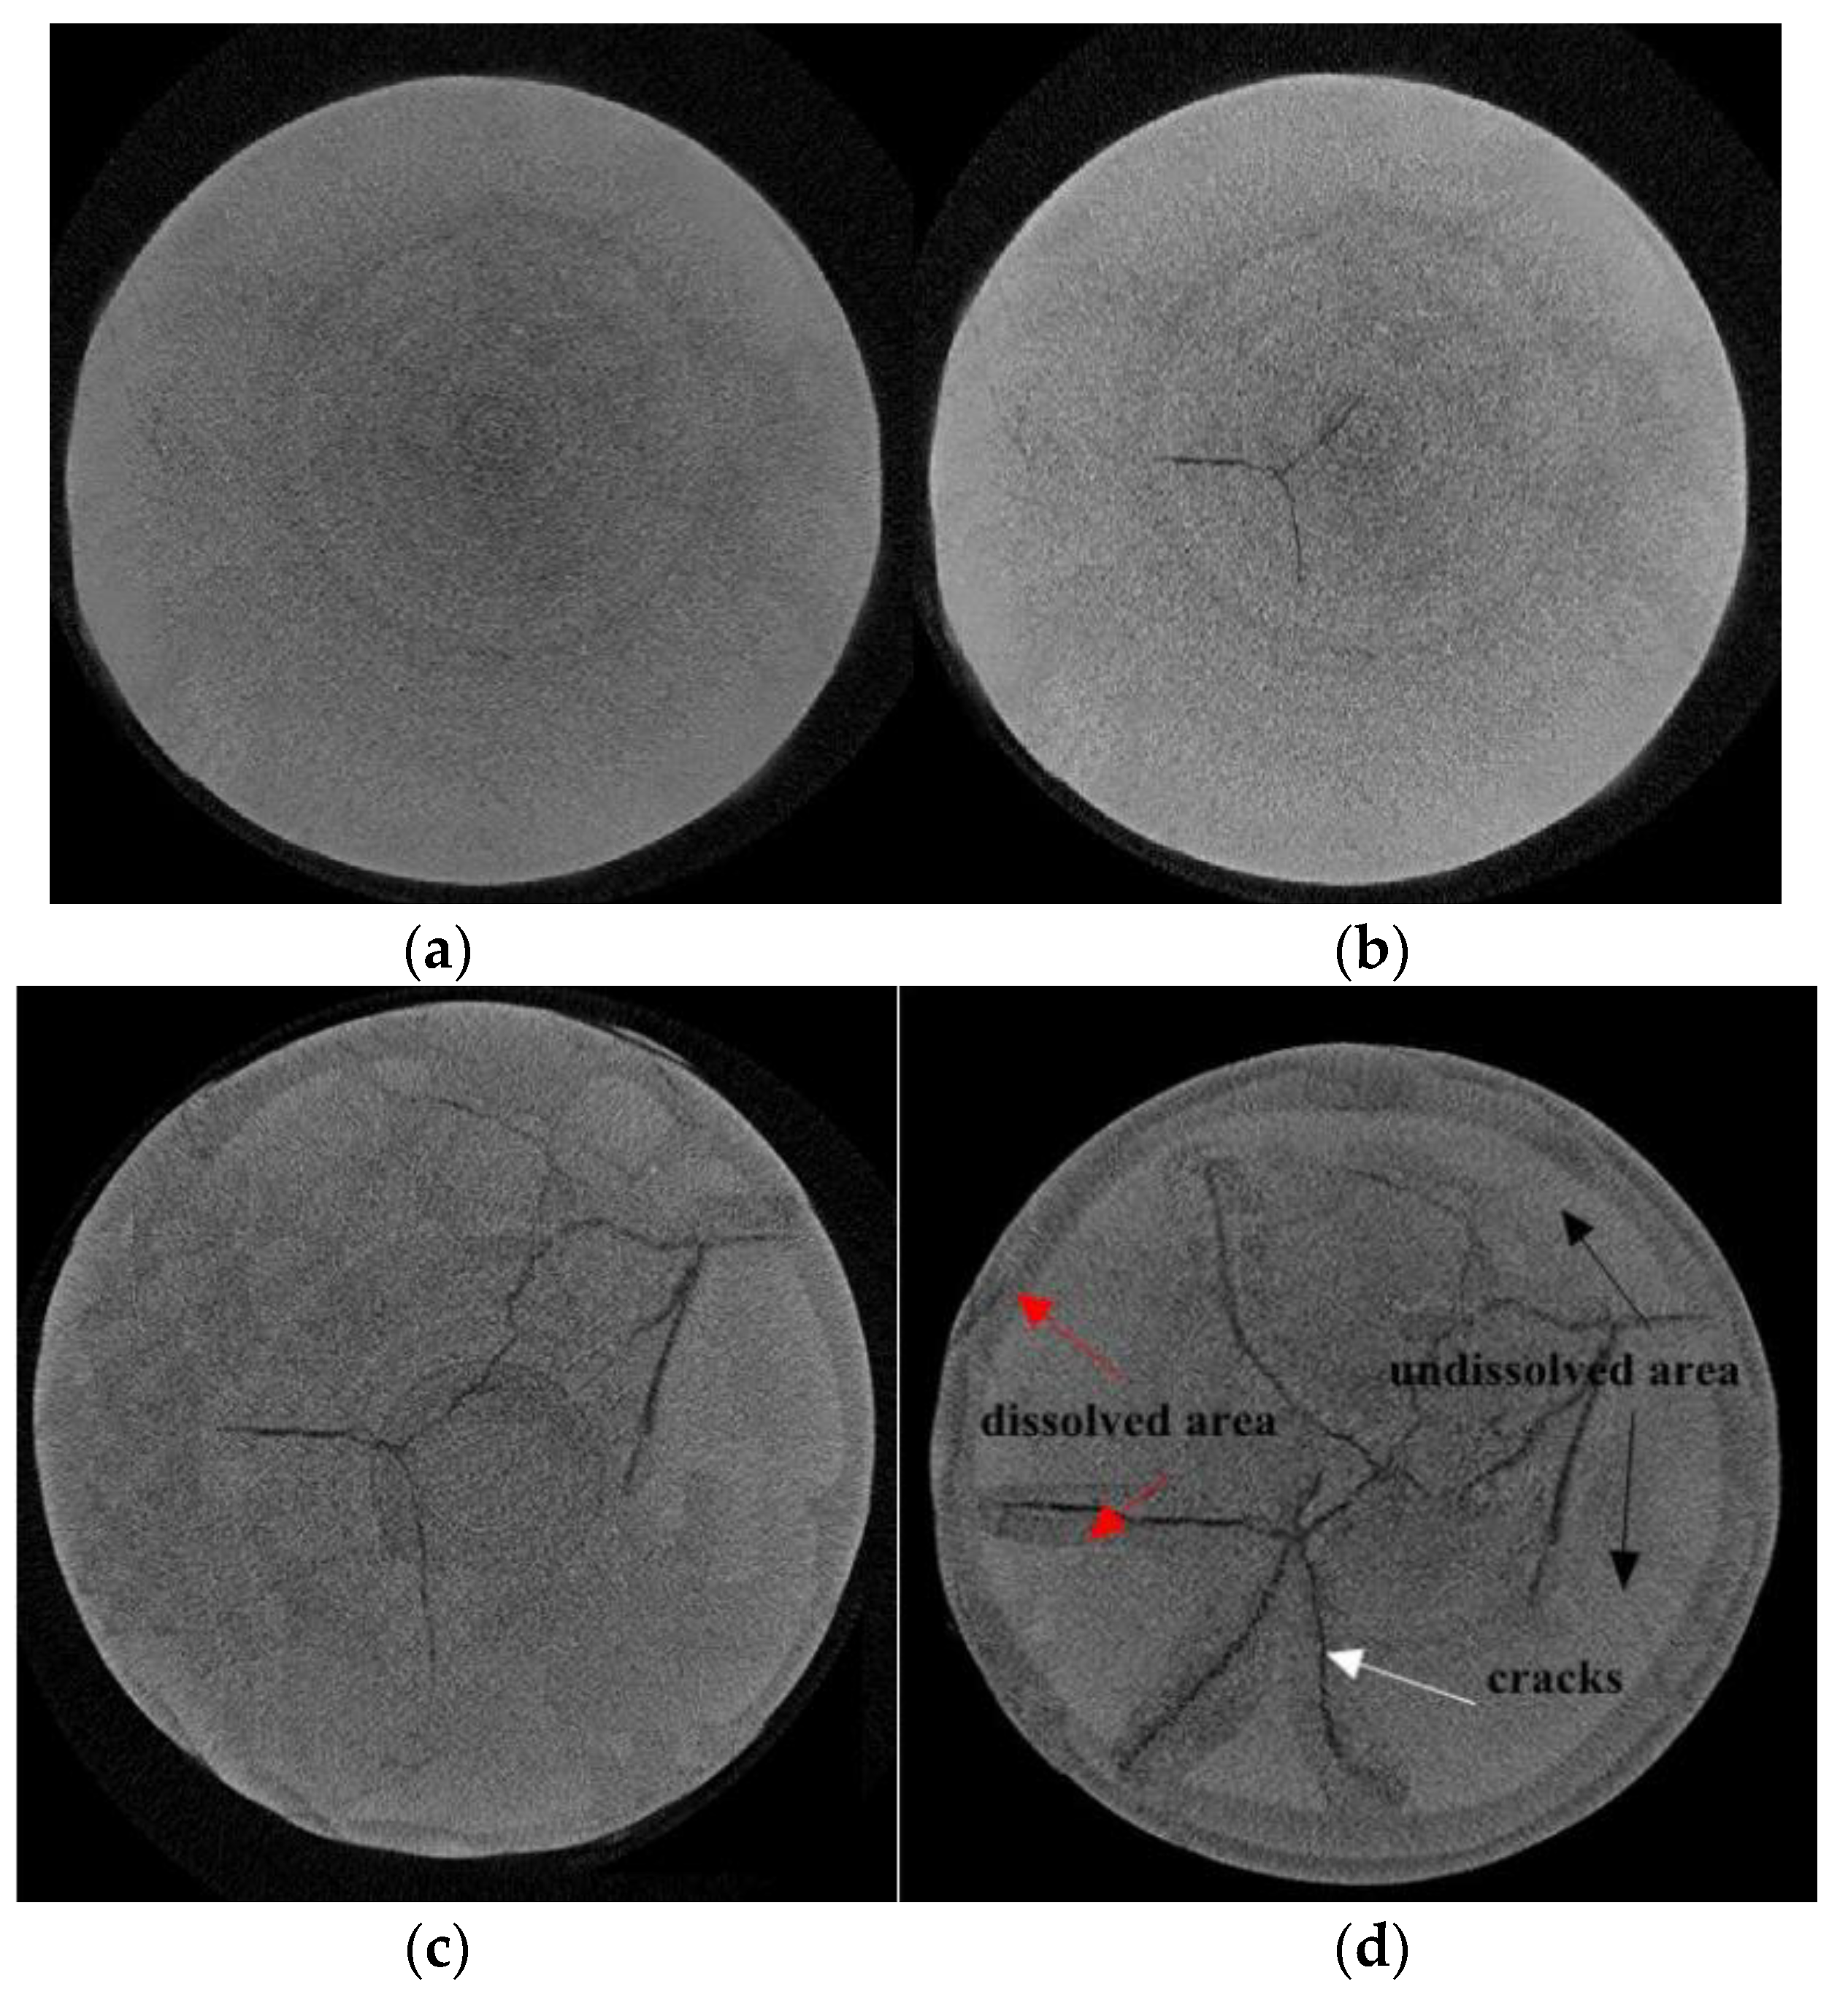
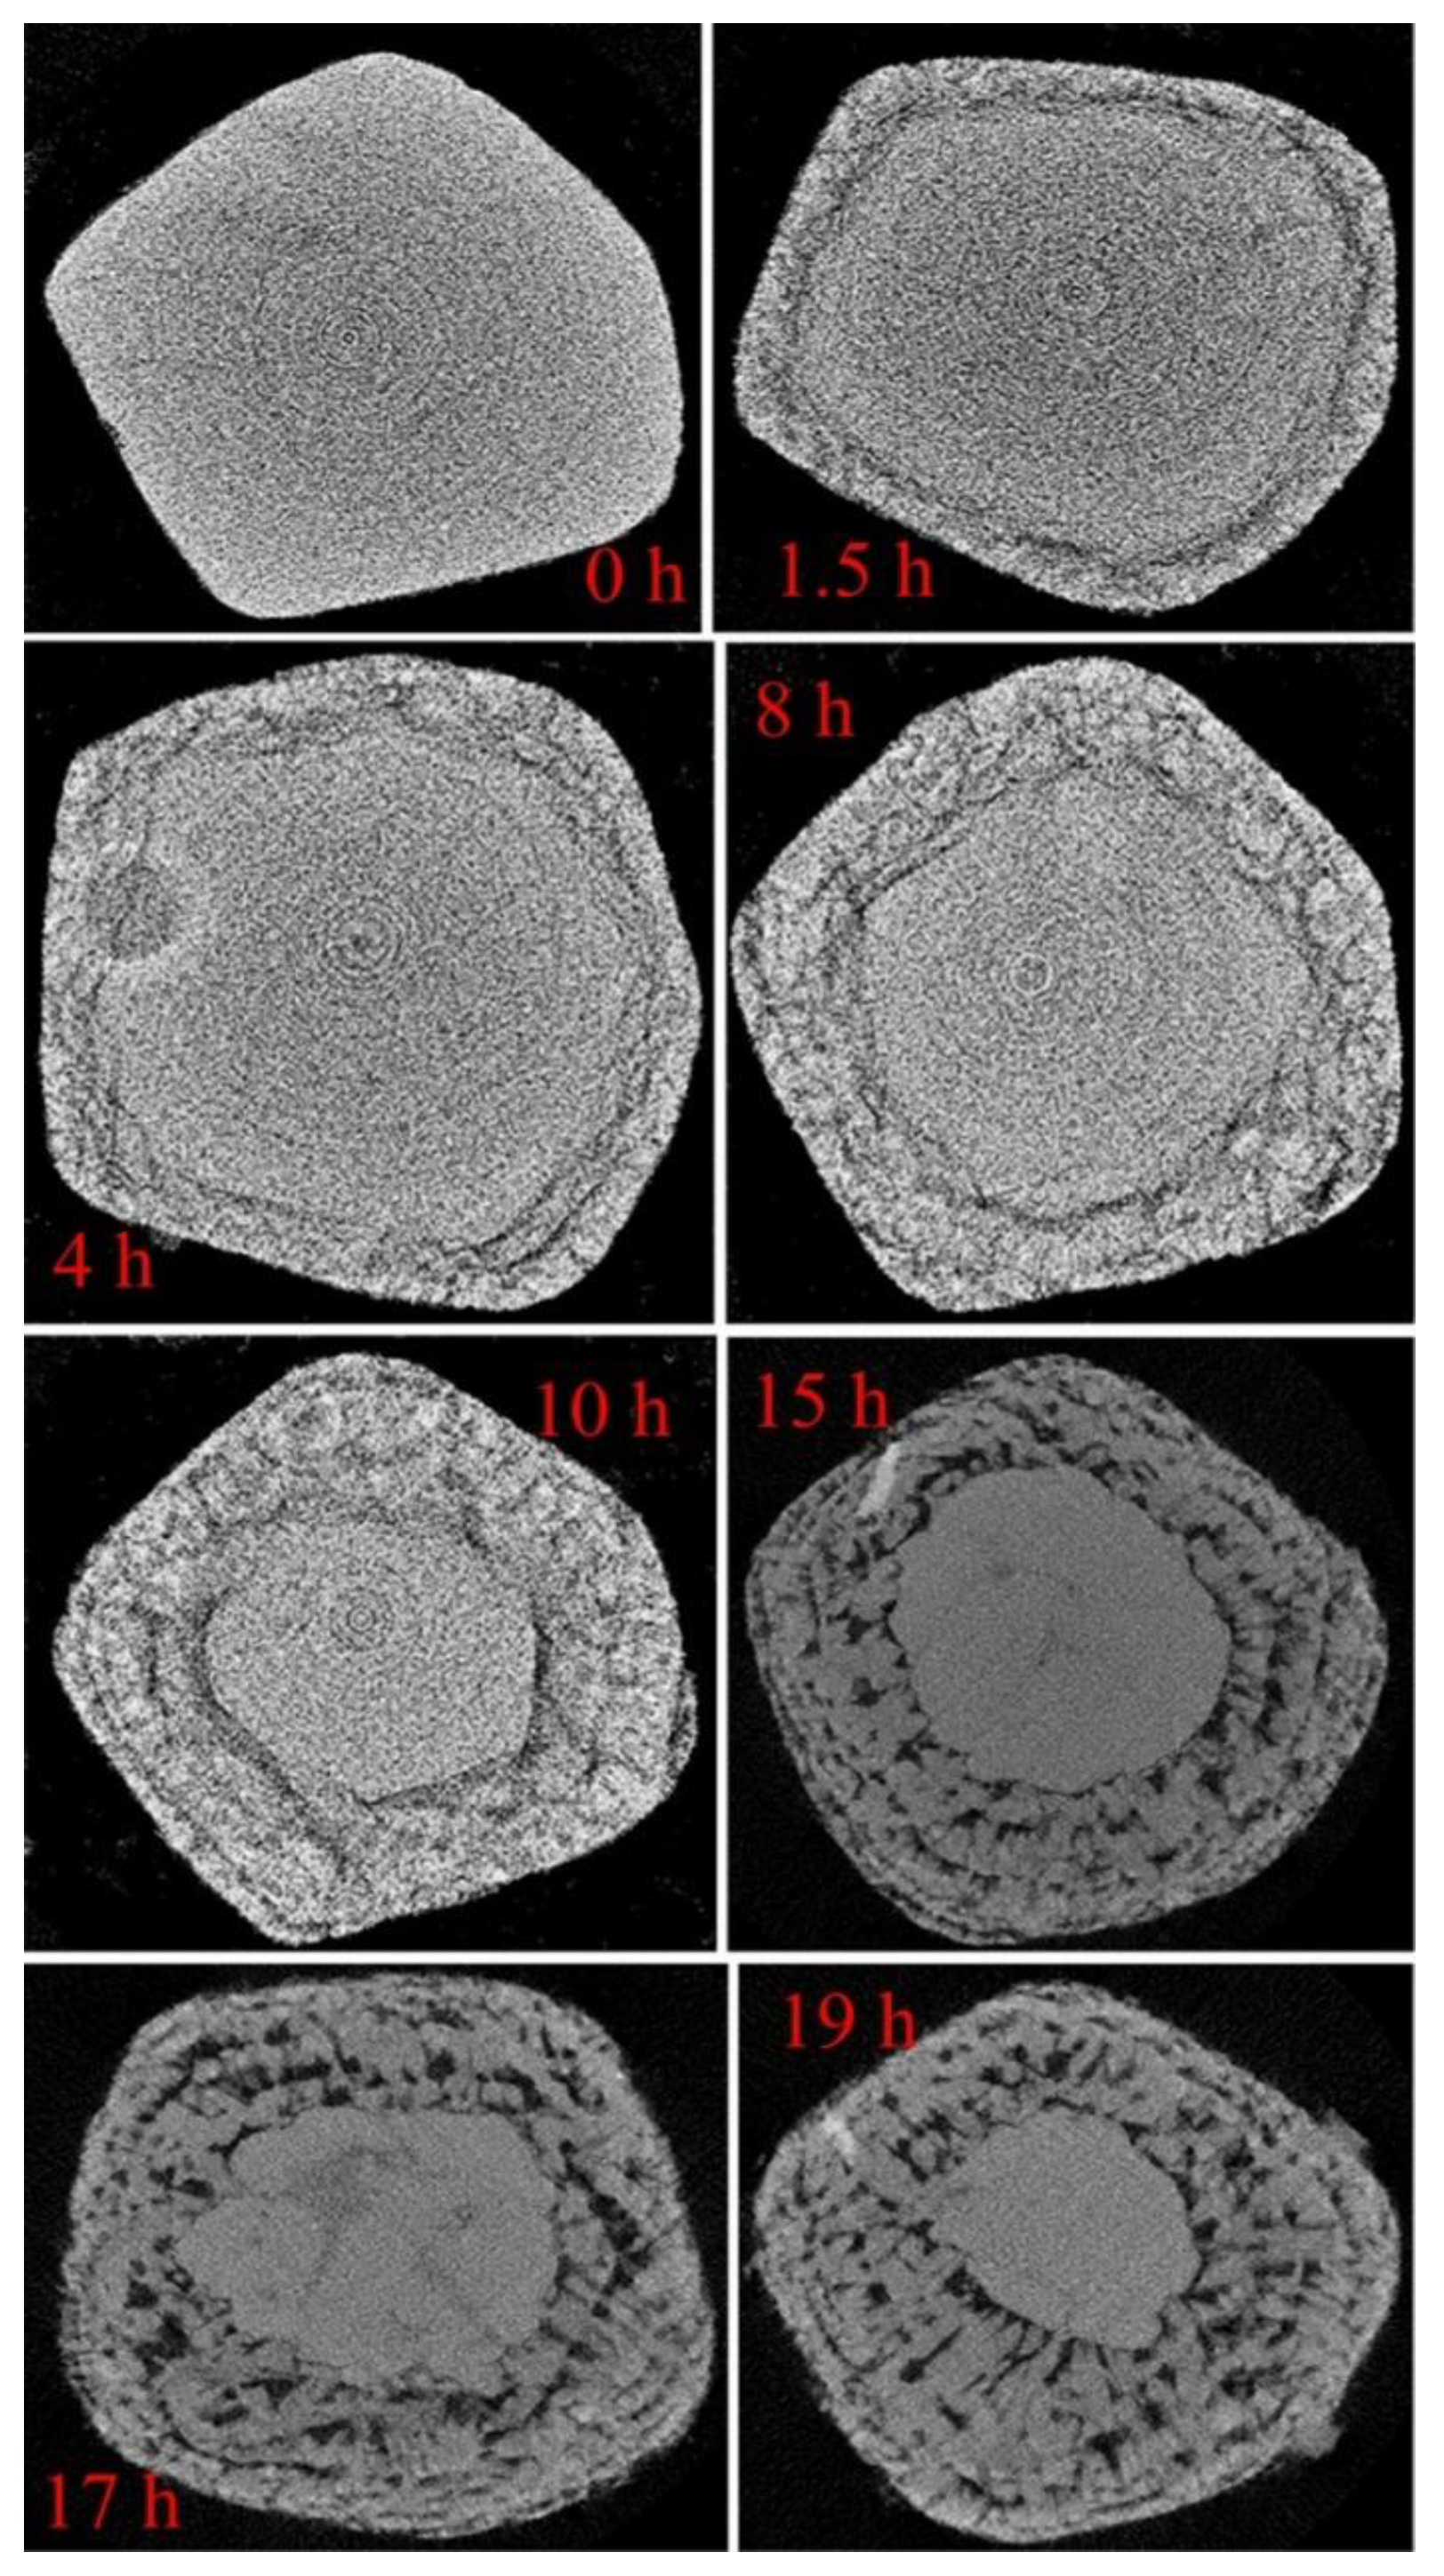
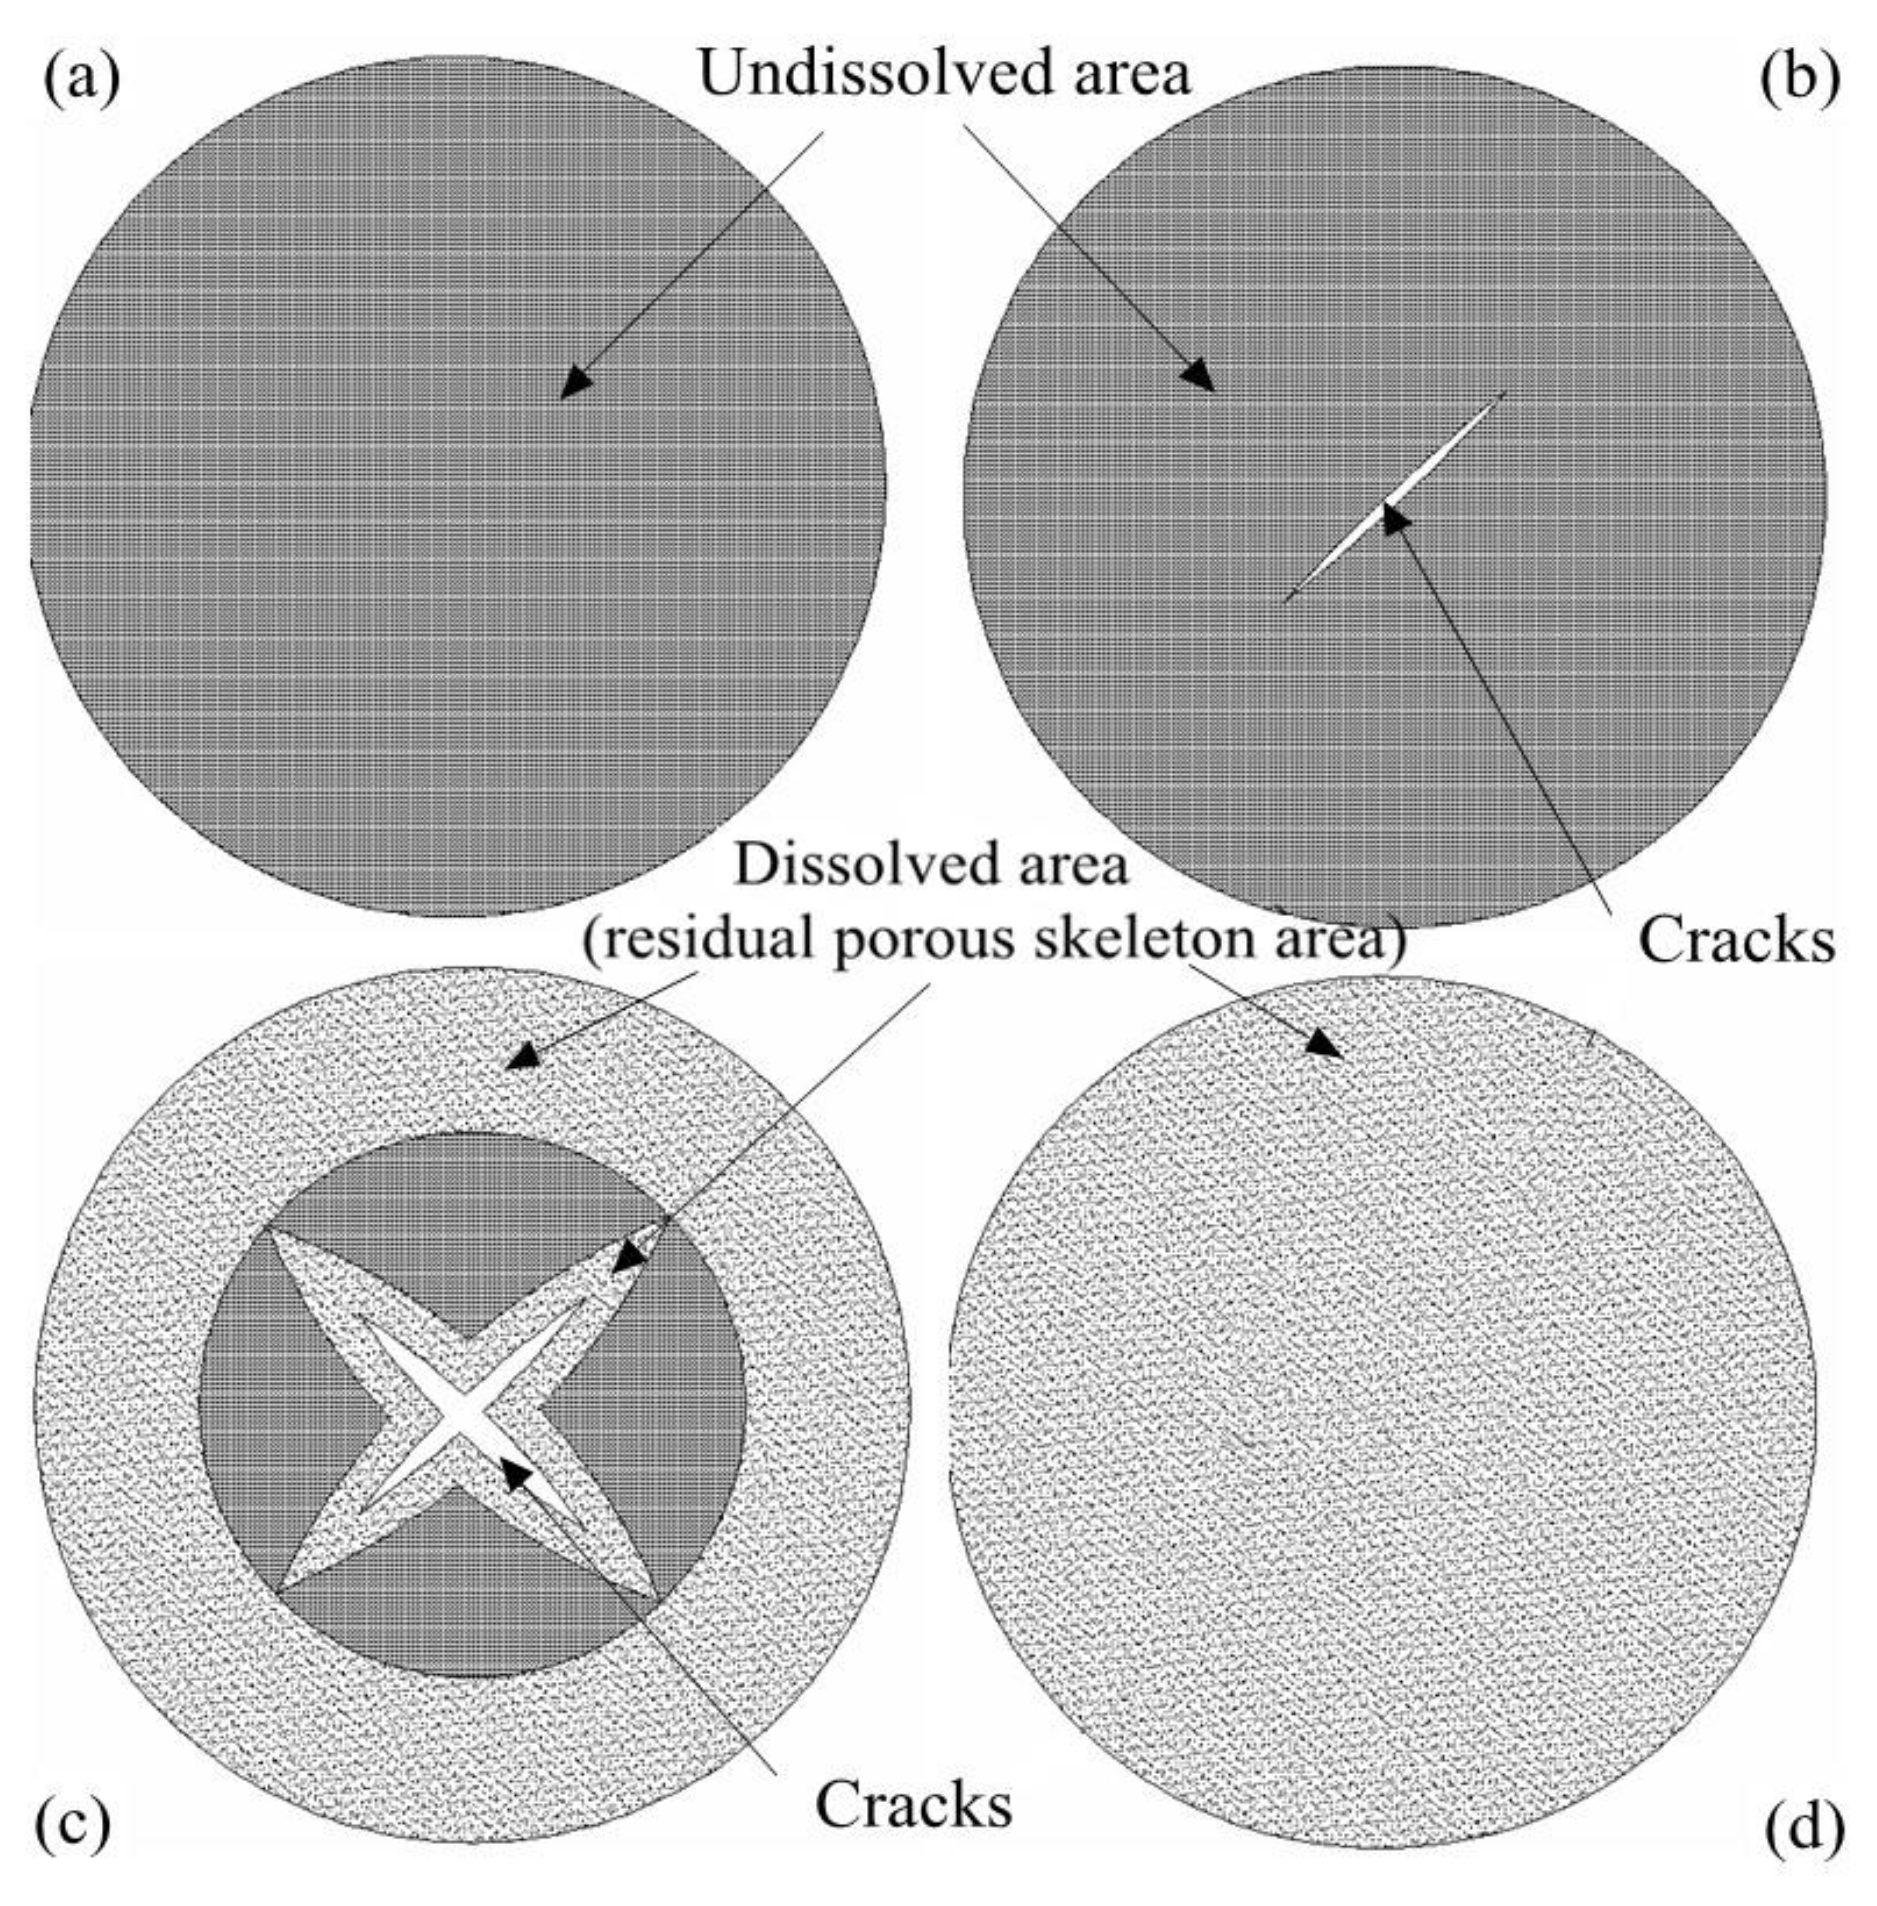
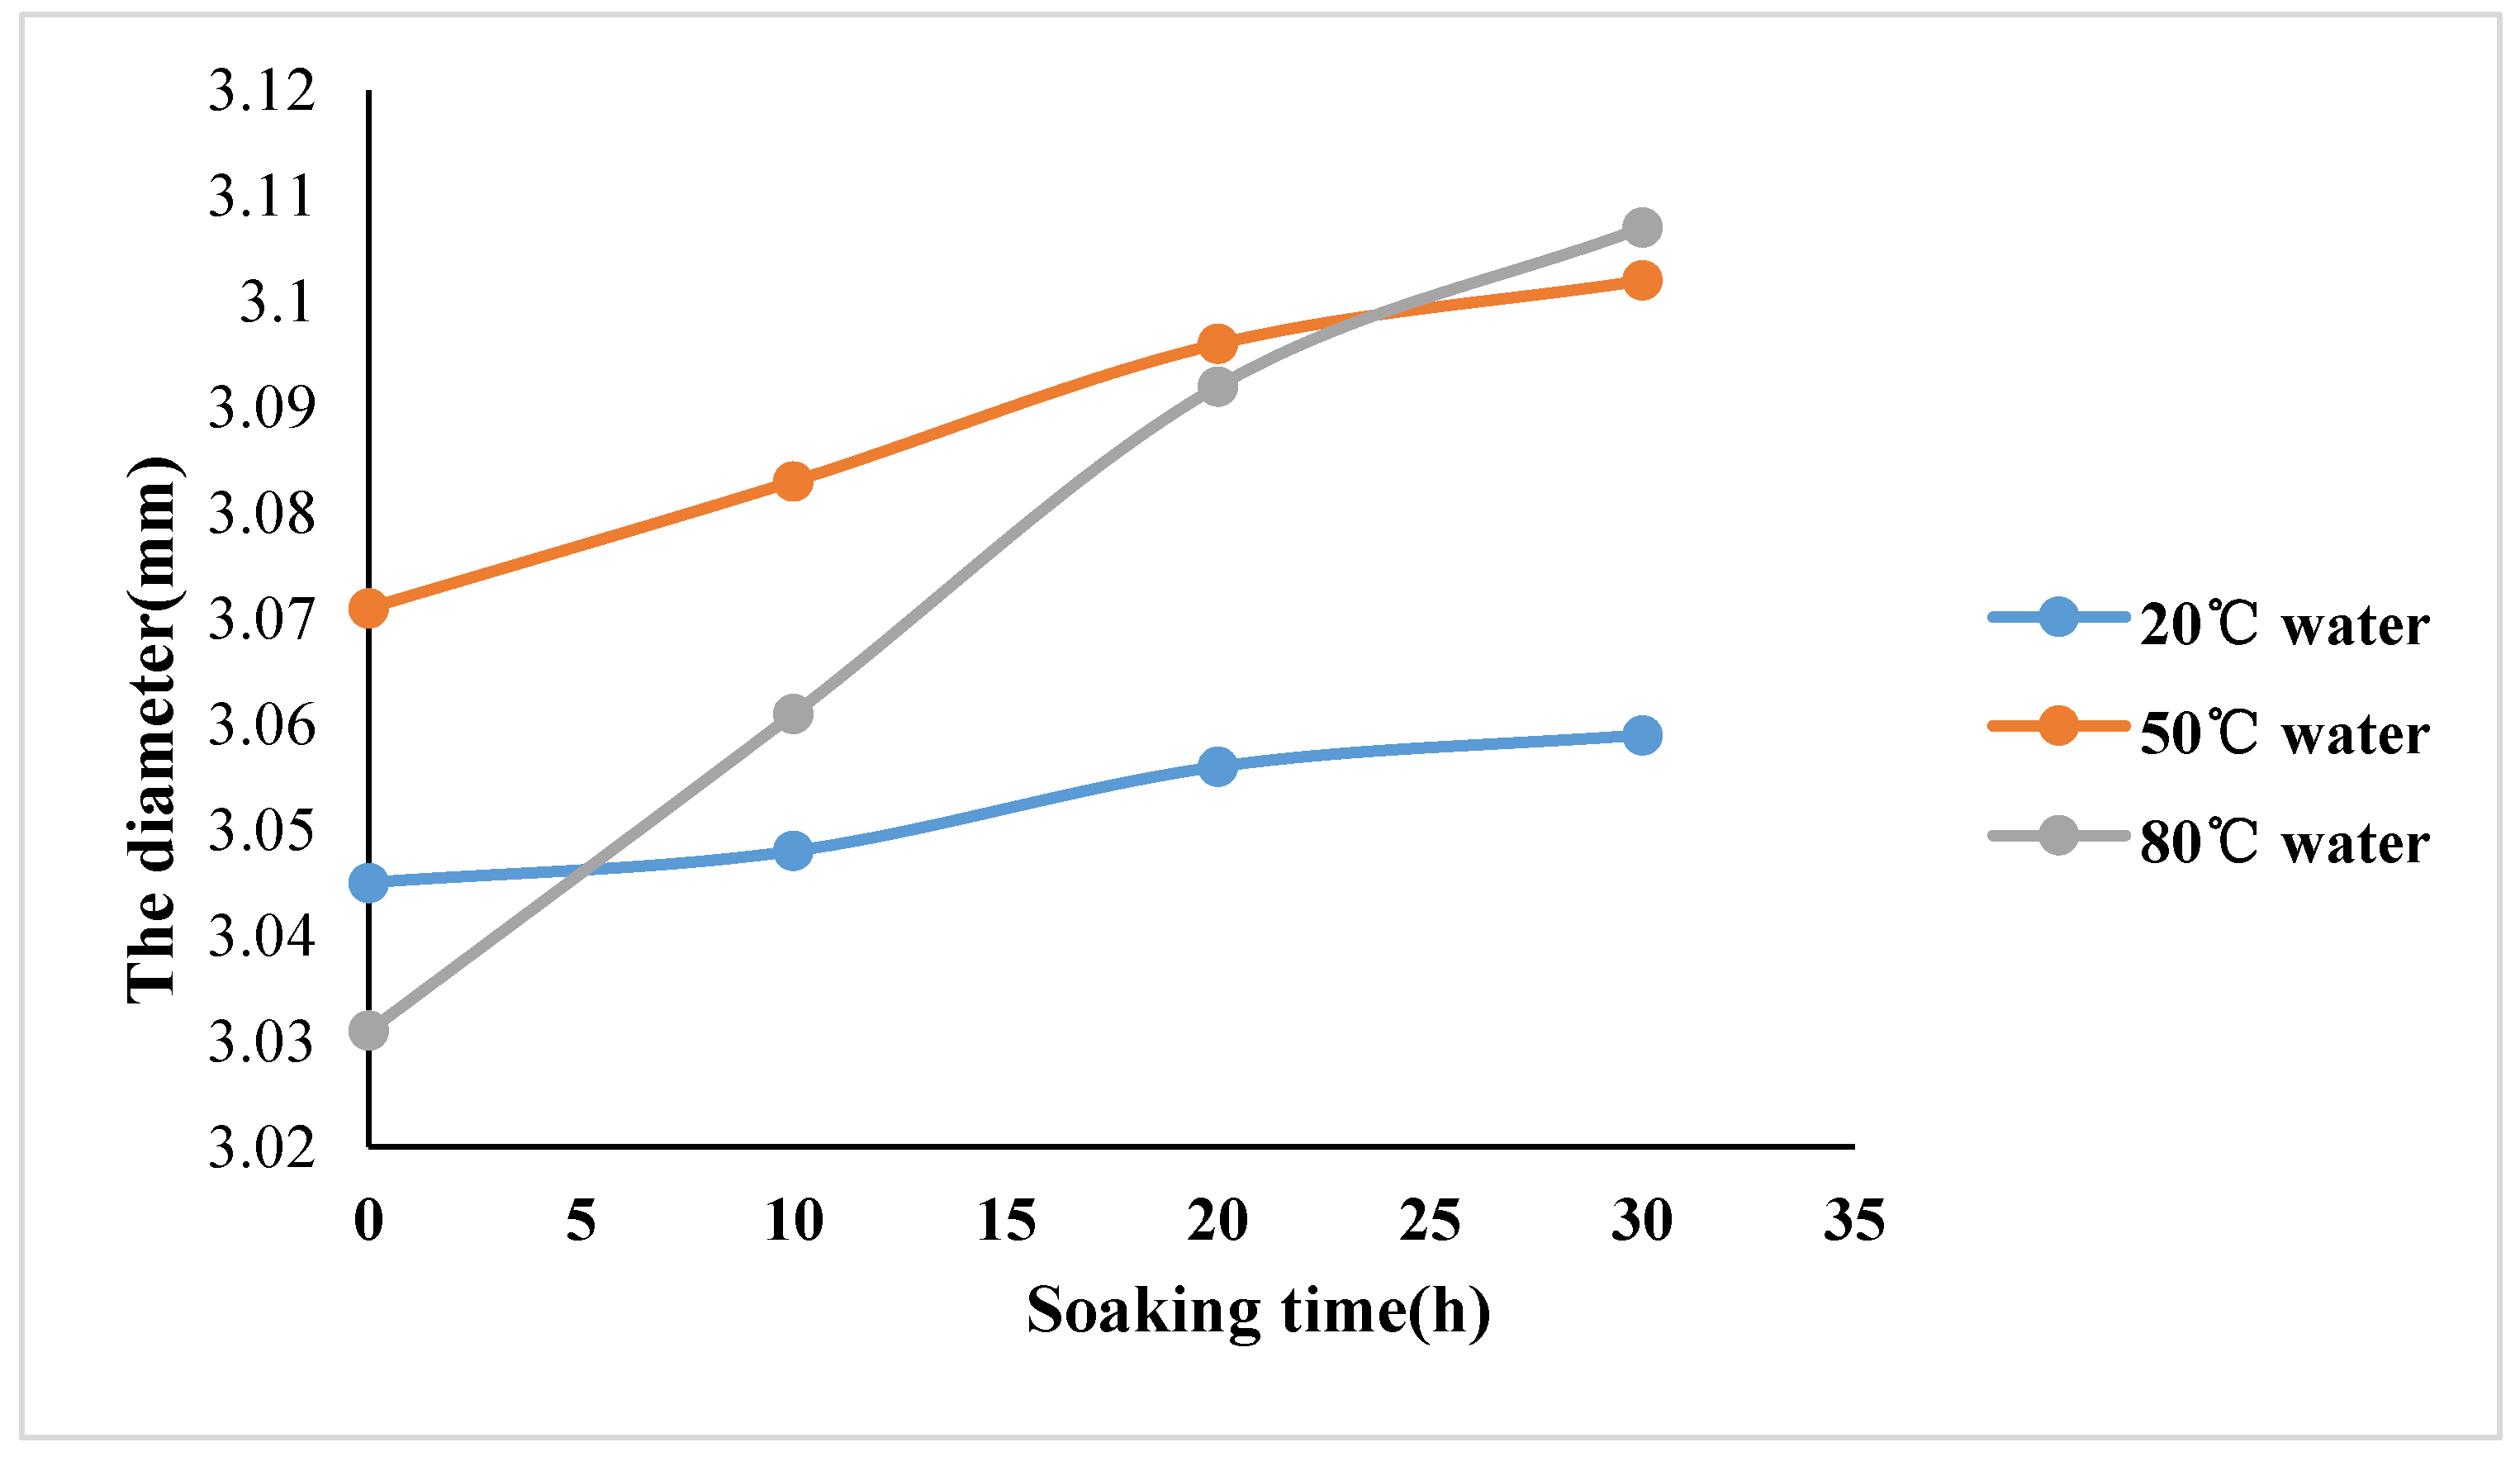
The dissolution rate of the soluble minerals in the specimen increased with the temperature, which eventually resulted in the increase of porosity. As shown in Figure 6, when immersed in pure water at 80 °C for 10 h, it dissolved along the edges from the surface inwardly on a large scale, instead of forming dissolving areas around the crack lines in the specimen; while in 20 °C pure water, the evolution process began with cracks, and then dissolved with the new solid-liquid contact surfaces created by the cracks, inwardly. By comparing the dissolution regions and areas, it could be concluded that the dissolution rate of glauberite increased with the temperature.
(2)
As the temperature increased, the activity of the water and the impurities (illite and montmorillonite) increased, which accelerated the impurity/hydration reaction, and thereby exacerbated the expansion of the specimen [28].
(3)
After the temperature rose, the chemical reaction rate of calcium sulphate and water accelerated. Lewis et al. [29] maintained that the specimen volume could increase by 30% when the calcium sulphate completely turned into dihydrate calcium sulphate, and the swelling force could reach 584–840 kPa. It was the volume expansion that enlarged the lattice spacing of the specimen, and thereby producing cracks.
For quantitative explanation on the expansion characteristics of the specimen at different temperatures, the diameter of the specimens after soaking in pure water at different temperatures were calculated. As shown in Figure 15, the diameter grew gradually with the increasing temperature, which was consistent with the variational trend of the porosity in the paper. Additionally, this strongly supports the analysis mentioned above.

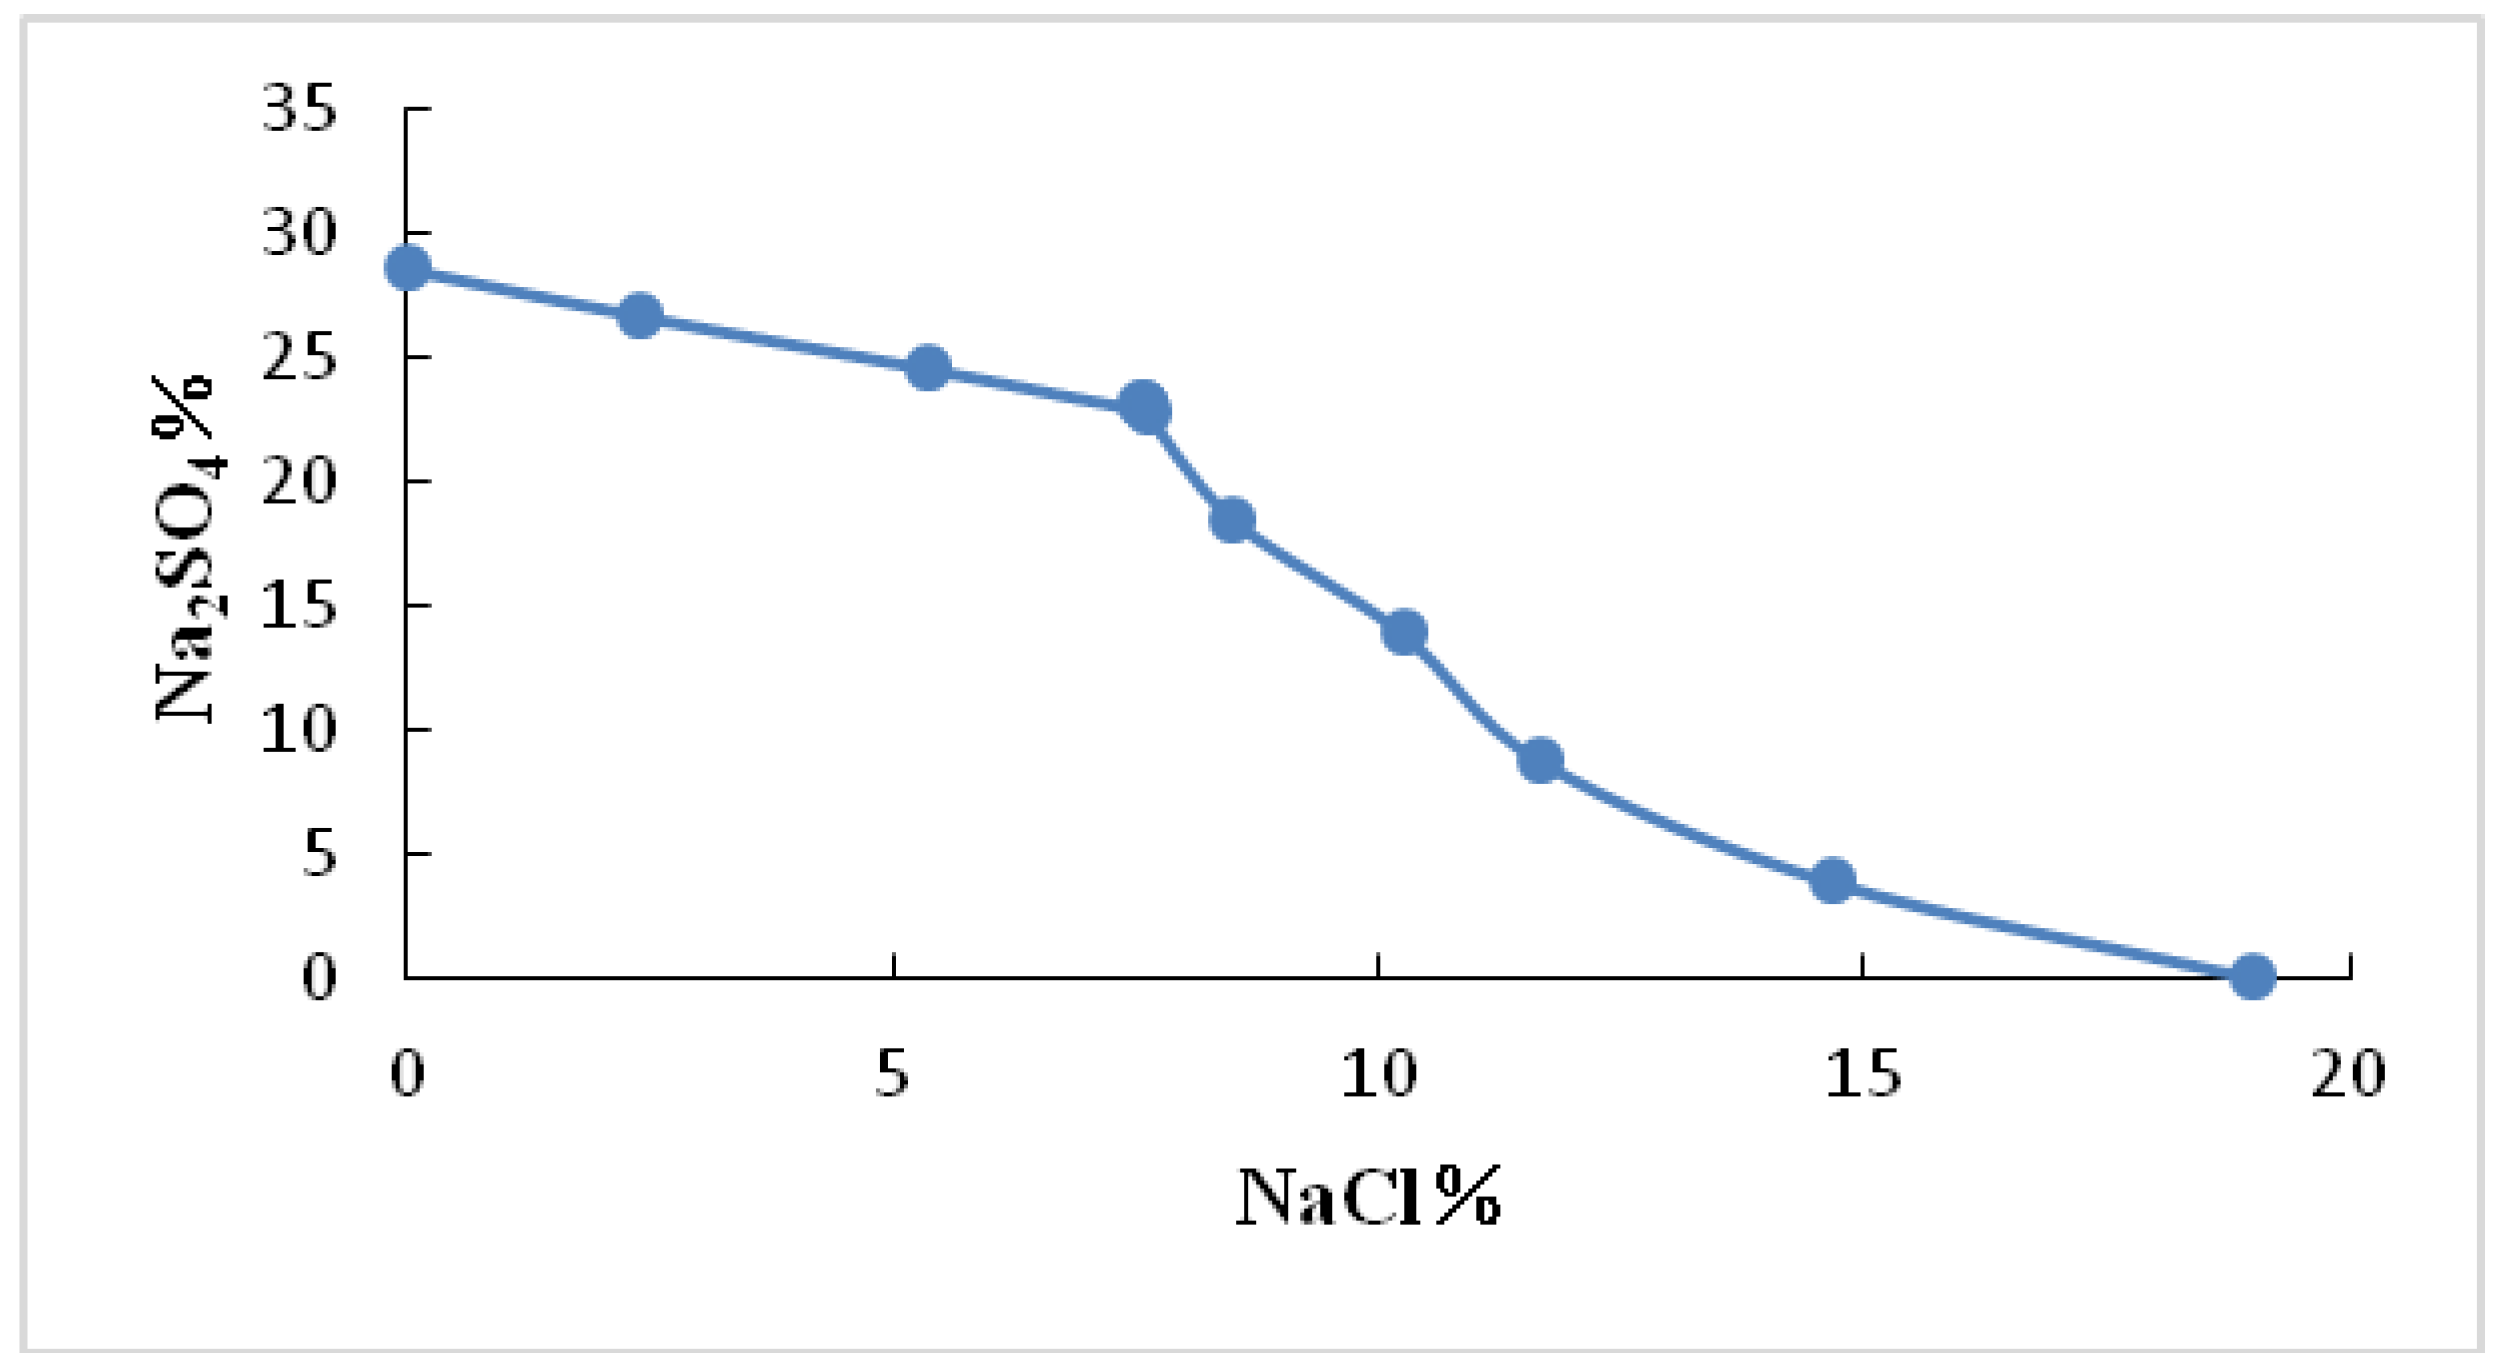
4.3. The Effect of Brine Concentration on Microstructure of Glauberite

By comparing the MCT scanning images of glauberite immersed in 80 °C solution with varying concentrations, it can be determined that, after 10 h of immersion in pure water, a wide range of dissolving areas appeared; after 30 h of immersion, the specimen broke completely, and the dissolution notch was observed. However, this phenomenon was not observed when immersed in semi-saturated brine and saturated brine. By analysing Figure 9 and the data of Table 1, it is revealed that the growth rate of glauberite pore varied greatly—the difference between them is large, even by an order of magnitude. For example, when immersed in pure water, the exponent in the regression equations of glauberite porosity with time was 0.0552; in semi-saturated solution, the exponent decreased to 0.0039; in saturated salt solution, it was as low as 0.0022. From Table 1, the porosity decreased gradually with the increasing brine concentration. For example, when immersed for 30 h, the porosity in pure water at 80 °C were 2.59 times higher than that of half-saturated brine, and were 2.90 times higher than that of saturated brine. The comparison strongly confirmed that the chloride ion had an inhibitory effect on sodium sulphate dissolution, and the phenomenon could be explained by the Debye-Huckel theory, namely, sodium chloride was a symmetrical electrolyte [30,31,32,33]. When the concentration of sodium chloride solution was increased, the activity coefficient of calcium sulphate decreased and calcium sulphate formed ion pairs. Thus, the short-range electrostatic interaction was enhanced, lowering the solubility of the calcium sulphate, thereby accelerating the dissolution rate of sodium sulphate. In summary, the solubility and dissolution rate of sodium sulphate decreased with the increase of sodium chloride concentration (see Figure 16), as did the corresponding porosity of glauberite.

5. Conclusions

Glauberite is a special kind of salt rock. Its microstructure evolution in the process of leaching is not only related to mining efficiency, but also to the deformation and stability of its mineral layer. This paper focused on the microstructural evolution of glauberite under different leaching conditions. The main conclusions are as follows:
(1)
When the specimens were immersed in a low-temperature solution, the dissolution rate was very slow. With the increase of temperature, the dissolution rate greatly improved, and the initiation of micro-cracks and the dissolution regions were produced spontaneously.
(2)
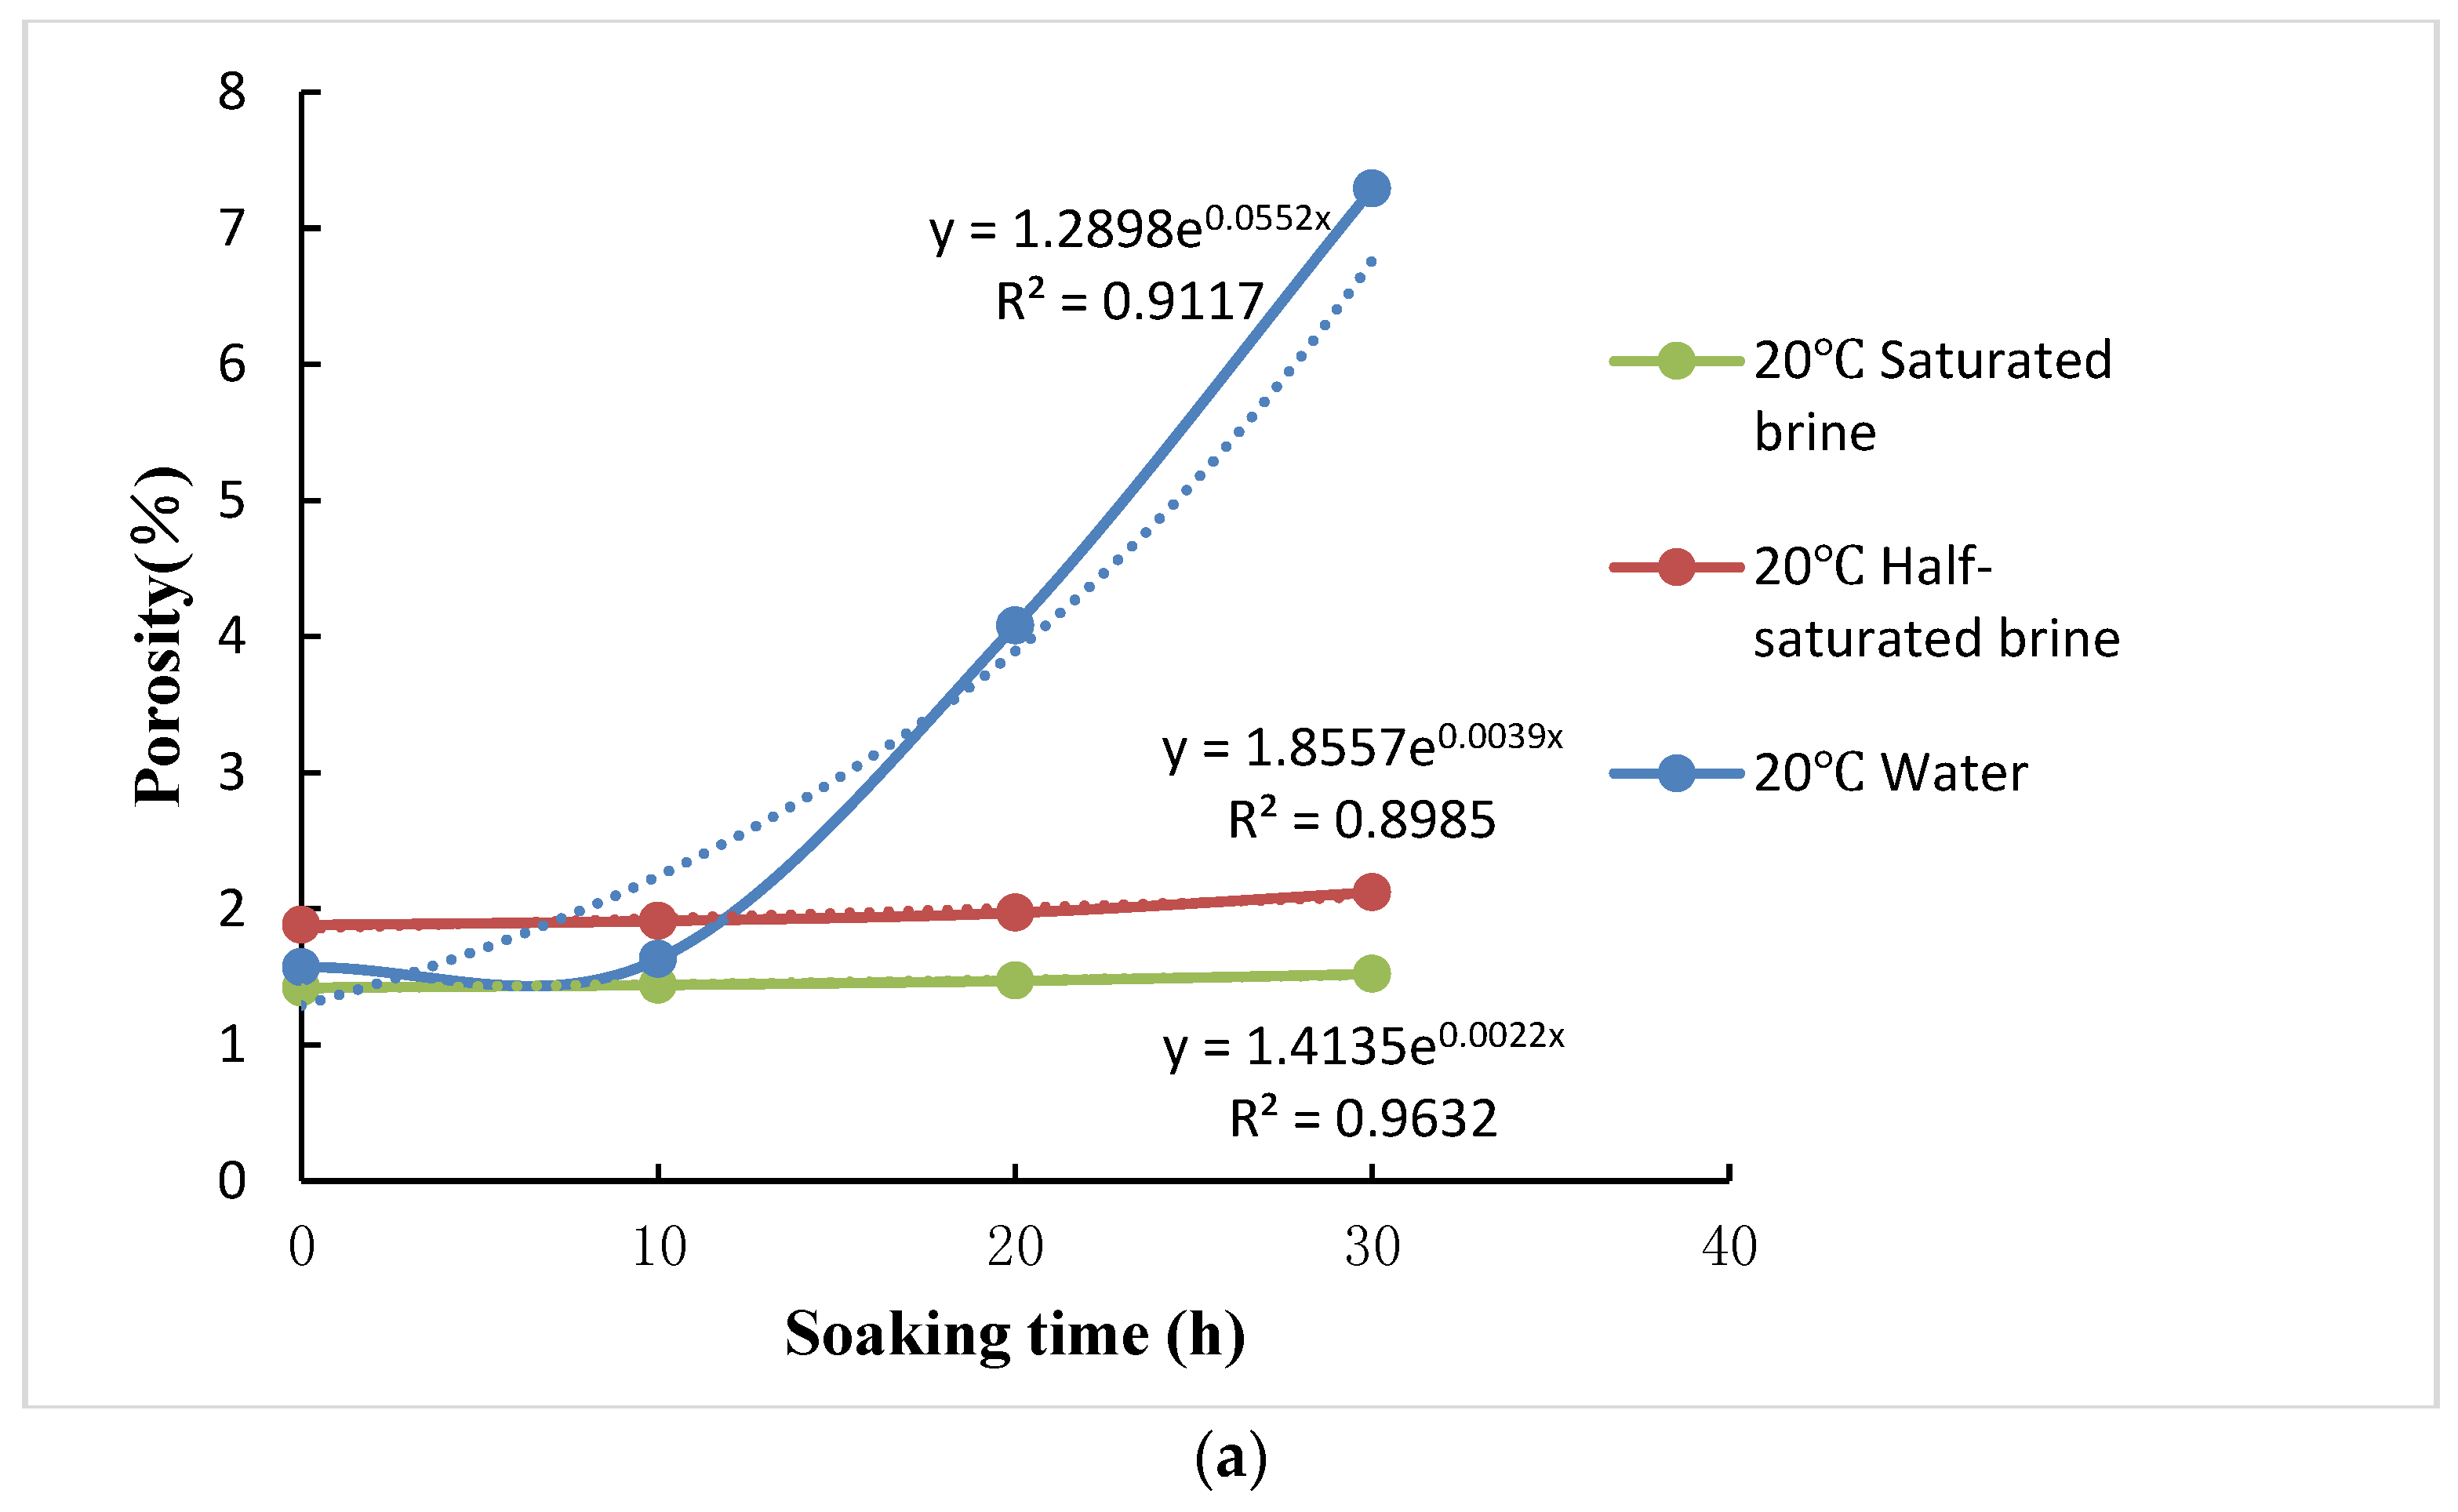
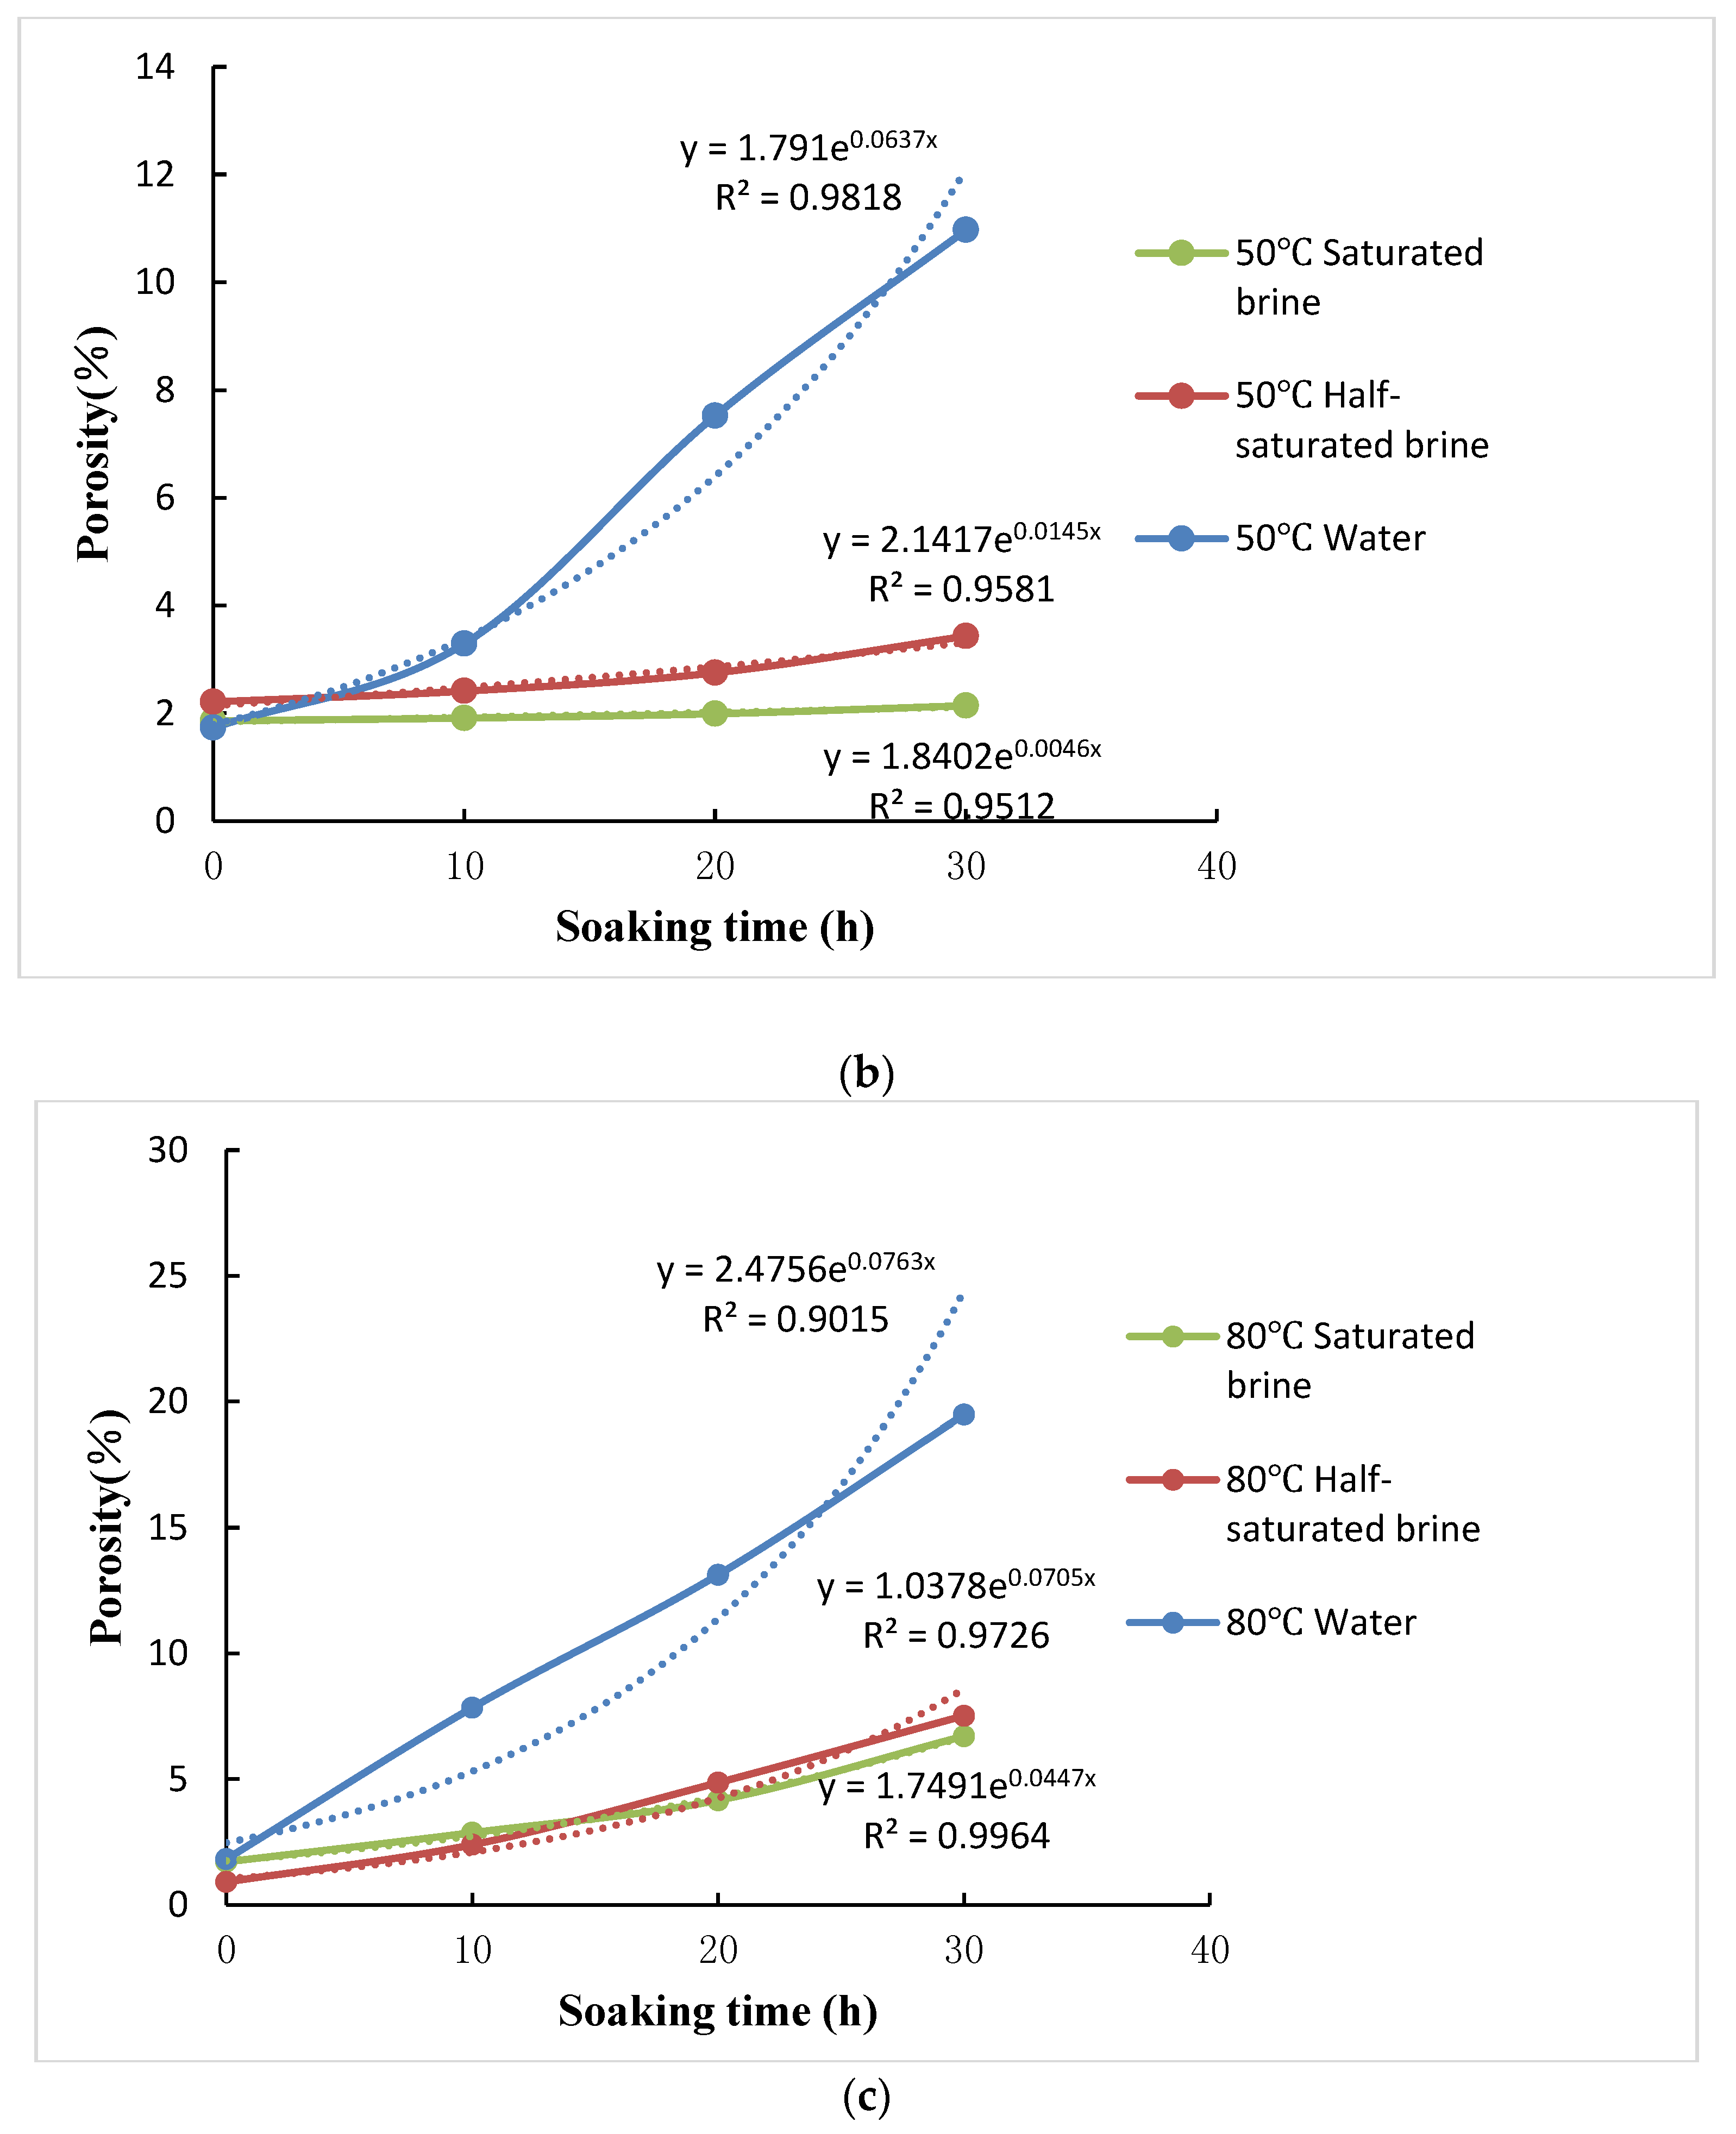
In the process of leaching, the effects of temperature and concentration of solution on the porosity of glauberite was significant. When immersed in brine with the same concentration, the porosity of the specimens increased considerably as the temperature increased; when at the same temperature, the porosity of the specimen decreased with the increase in brine concentration.
(3)
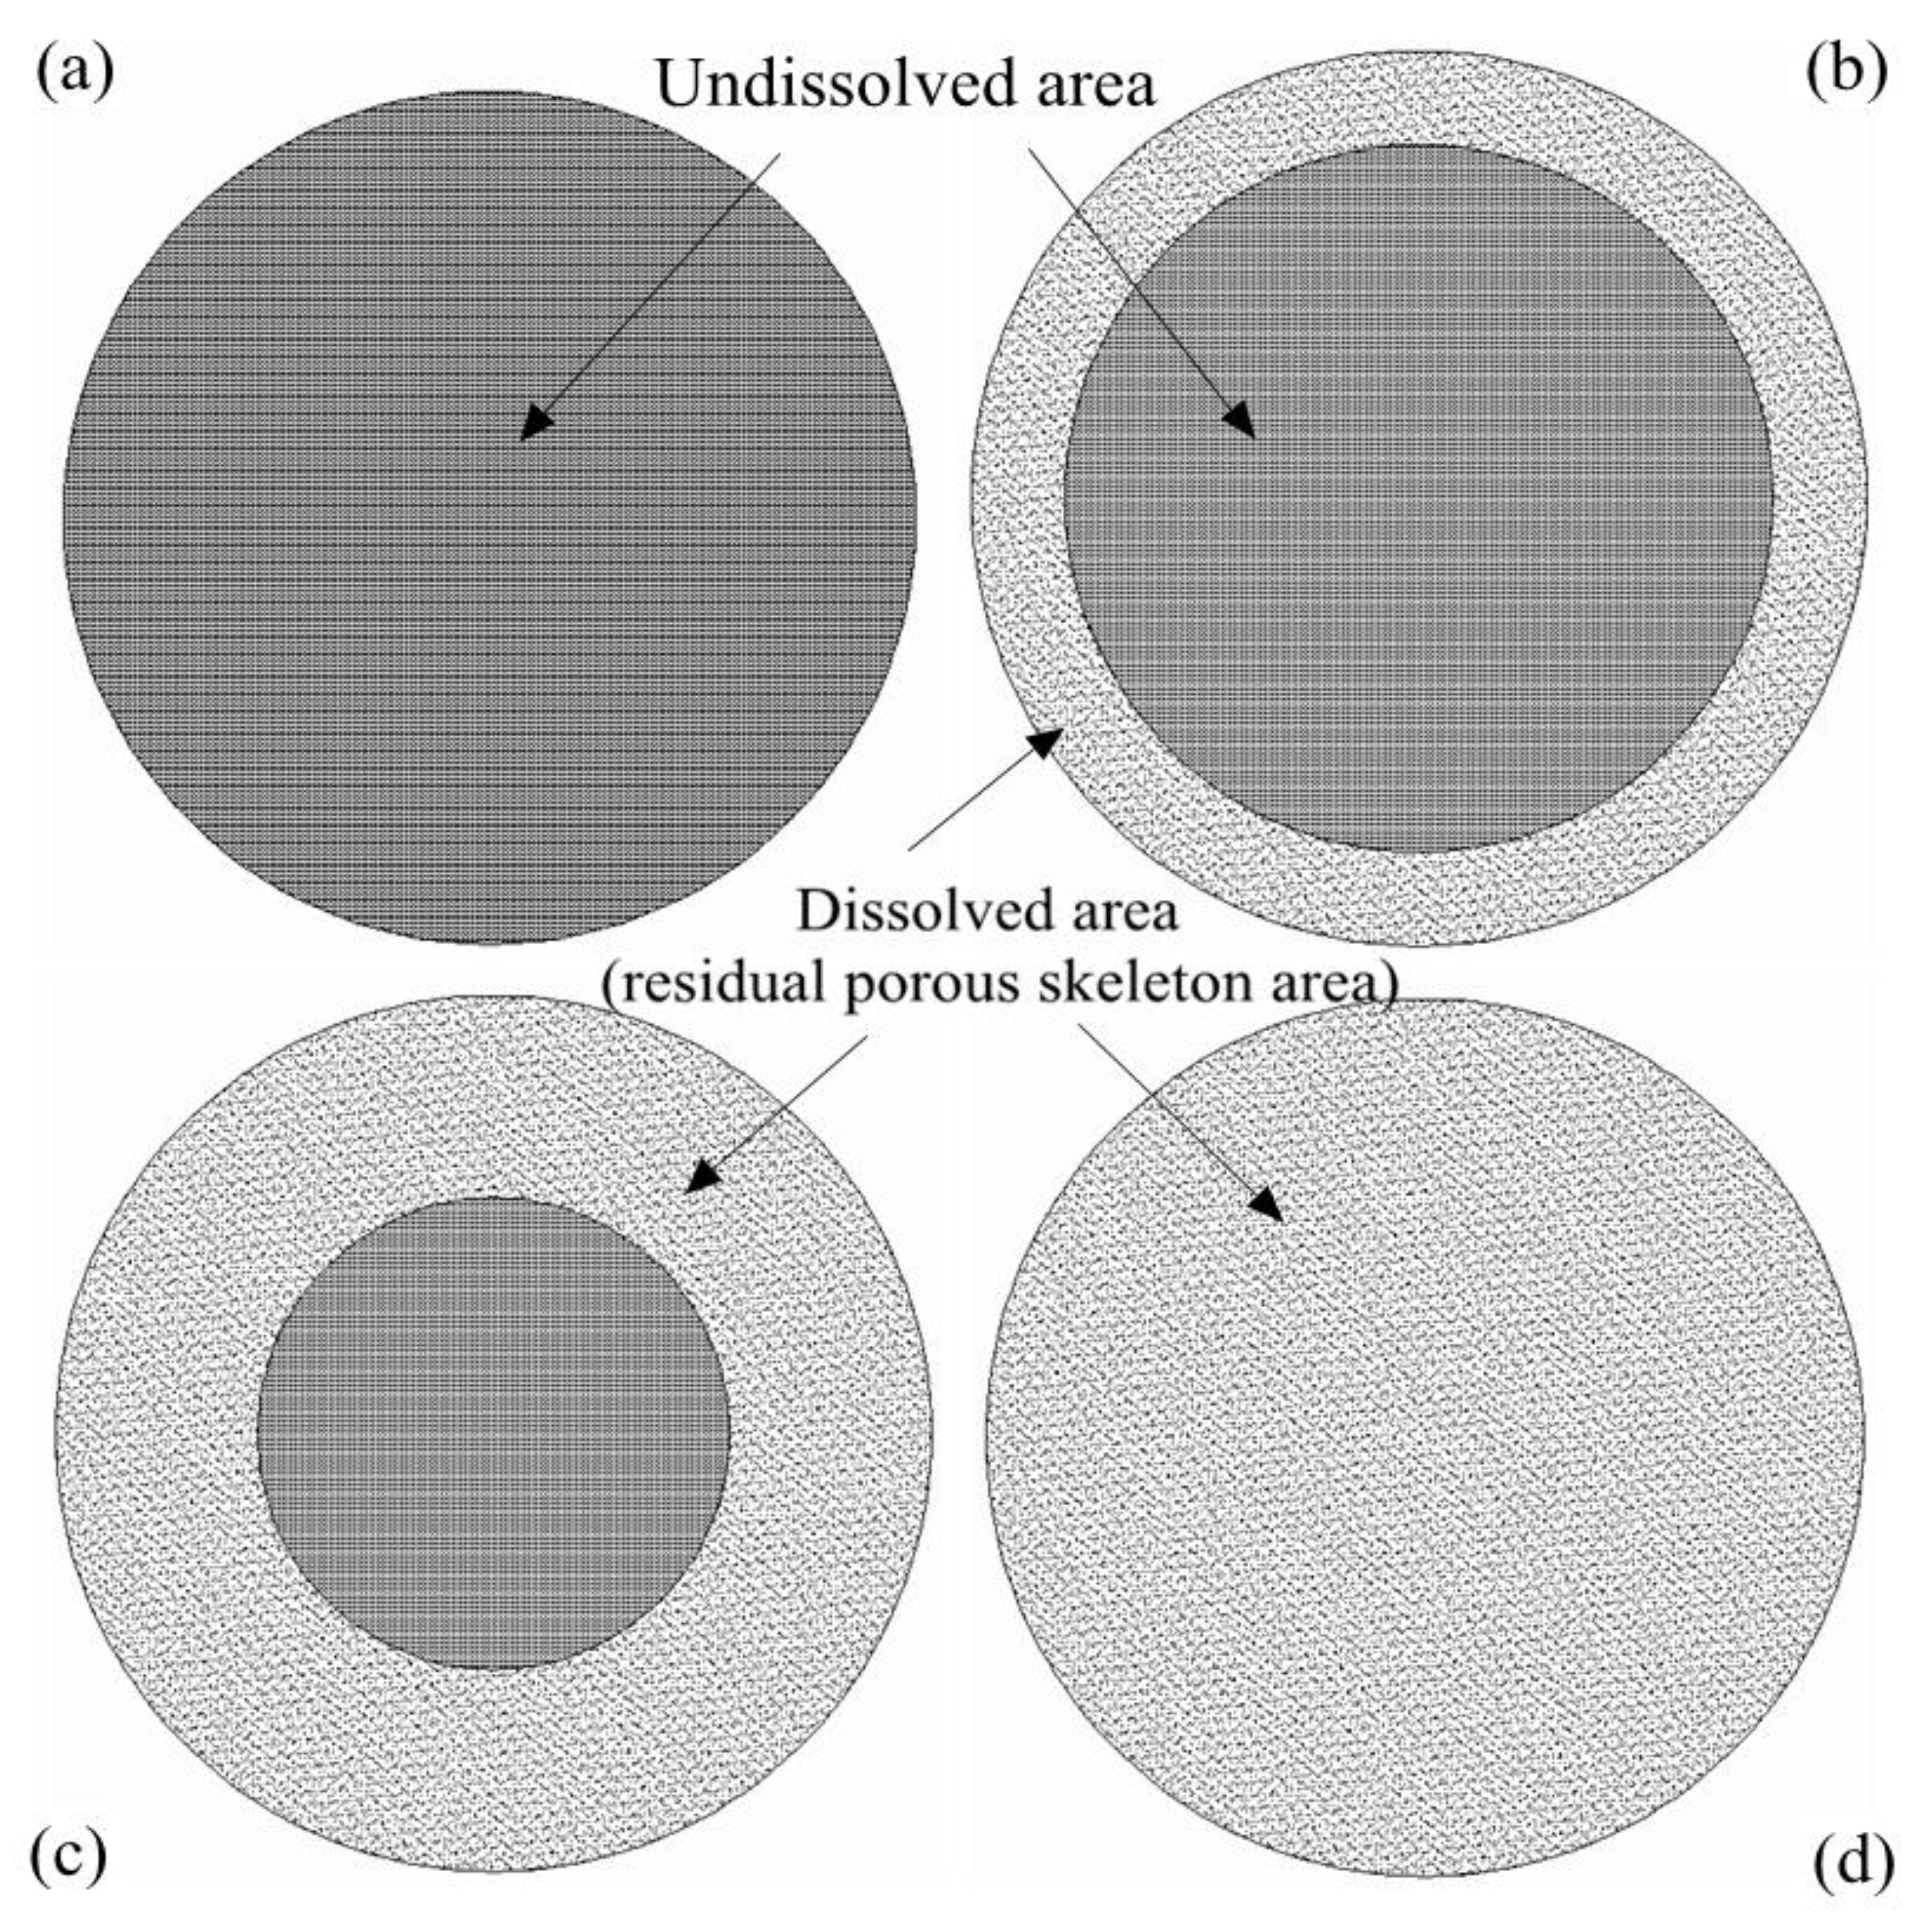
When the specimens were immersed in pure water or brine, the sodium sulphate in glauberite dissolved and the remaining solid insoluble substances became the residual skeleton. The specimens are gradually dissolved from the outside to the inside, and the pores and three zones are formed during the leaching process. The zones are the dissolved area (or residual skeleton, porous structure), the undissolved area (i.e., dense and intact area), and the circular solid-liquid interface (i.e., circular line), respectively.
(4)
With the increase of temperature, the hydration of illite and montmorillonite in glauberite and the hydration of calcium sulphate were improved, resulting in a gradual increase of the expansion rate of glauberite and fracture density increased as well. With the increase of sodium chloride concentration, the porosity of the specimen decreased.

Author Contributions

S.Z.C. contributed to the experimental design and sourcing of the laboratory equipment and raw materials; D.H.Z. contributed to the experimental operation, data collection, and writing of the manuscript; T.S. carried out the CT analysis and the correction and editing of the manuscript; T.M. also contributed in the experimental design and correction of the manuscript.

Funding

This paper was support by the Natural Science Funds for Young Scholar (2016YFC0501103), Major Research and Development Plans of Shanxi Province (grant no. 201603D121031), the School Fund of Tai Yuan University of Technology and Science (no. 20172018, 20182008), Science and technology innovation project of colleges and universities in Shanxi (Grant No. 2017158), Shanxi Scholarship Council of China (Grant No. 2017-086), State Key Laboratory Breeding Base of Coal Science and Technology Co-founded by Shanxi Province and the Ministry of Science and Technology, Taiyuan University of Technology(Grant No. mkx201702).

Acknowledgments

The authors gratefully acknowledge Tao Meng, who has given us many useful ideas and suggestions.

Conflicts of Interest

The authors declare no conflict of interest.

References

  1. MacQuarrie, K.T.B.; Mayer, K.U. Reactive transport modeling in fractured rock: A state-of-the-science review. Earth-Sci. Rev. 2005, 72, 189–227. [Google Scholar] [CrossRef]
  2. Yin, S.; Dusseault, M.B.; Rothenburg, L. Coupled THMC modeling of CO2 injection by finite element methods. J. Pet. Sci. Eng. 2011, 80, 53–60. [Google Scholar] [CrossRef]
  3. Meng, T.; Hu, Y.; Fang, R. Study of fracture toughness and weakening mechanisms in gypsum interlayers in corrosive environments. J. Nat. Gas Sci. Eng. 2015, 26, 356–366. [Google Scholar] [CrossRef]
  4. Meng, T.; Hu, Y.; Fang, R. Weakening mechanisms of gypsum interlayers from Yunying salt cavern subjected to a coupled thermo-hydro-chemical environment. J. Nat. Gas Sci. Eng. 2016, 30, 77–89. [Google Scholar] [CrossRef]
  5. Zhang, R.; Winterfeld, P.H.; Yin, X. Sequentially coupled THMC model for CO2 geological sequestration into a 2D heterogeneous saline aquifer. J. Nat. Gas Sci. Eng. 2015, 27, 579–615. [Google Scholar] [CrossRef]
  6. Russo, A.J. Solution Mining Code for Studying Axisymmetric Salt Cavern Formation; Sandia National Labs: Albuquerque, NM, USA, 1981. [Google Scholar]
  7. Ripley, E.A.; Redmann, R.E. Environmental Effects of Mining; CRC Press: Boca Raton, FL, USA, 1995. [Google Scholar]
  8. Mudd, G.M. Critical review of acid in situ leach uranium mining: 2. Soviet Block and Asia. Environ. Geol. 2001, 41, 404–416. [Google Scholar] [CrossRef]
  9. Guo, J.Y.; Lu, W.X.; Jiang, X. A quantitative model to evaluate mine geological environment and a new information system for the mining area in Jilin province, mid-northeastern China. Arab. J. Geosci. 2017, 10. [Google Scholar] [CrossRef]
  10. Liu, R.; Li, B.; Jiang, Y. Critical hydraulic gradient for nonlinear flow through rock fracture networks: The roles of aperture, surface roughness, and number of intersections. Adv. Water. Resour. 2016, 88, 53–65. [Google Scholar] [CrossRef]
  11. Liu, R.; Li, B.; Jiang, Y. A fractal model based on a new governing equation of fluid flow in fractures for characterizing hydraulic properties of rock fracture networks. Comput. Geotech. 2016, 75, 57–68. [Google Scholar] [CrossRef]
  12. Salvany, J.M.; García-Veigas, J.; Orti, F. Glauberite-halite association of the Zaragoza Gypsum Formation (Lower Miocene, Ebro Basin, NE Spain). Sedimentology 2007, 54, 443–467. [Google Scholar] [CrossRef]
  13. Liang, W.; Zhao, Y.; Xu, S. Dissolution and seepage coupling effect on transport and mechanical properties of glauberite salt rock. Transp. Porous Media 2008, 74, 185–199. [Google Scholar] [CrossRef]
  14. Zhang, G.; Li, Y.; Yang, C. Stability and tightness evaluation of bedded rock salt formations for underground gas/oil storage. Acta Geotech. 2014, 9, 161–179. [Google Scholar] [CrossRef]
  15. Ramezanianpour, A.A.; Malhotra, V.M. Effect of curing on the compressive strength, resistance to chloride-ion penetration and porosity of concretes incorporating slag, fly ash or silica fume. Cem. Concr. Compos. 1995, 17, 125–133. [Google Scholar] [CrossRef]
  16. Ortega, J.M.; Sánchez, I.; Antón, C.; de Vera, G.; Climent, M.A. Influence of Environment on Durability of Fly Ash Cement Mortars. ACI Mater. J. 2012, 109, 647–656. [Google Scholar]
  17. Joshaghani, A.; Balapour, M.; Ramezanianpour, A.A. Effect of controlled environmental conditions on mechanical, microstructural and durability properties of cement mortar. Constr. Build. Mater. 2018, 164, 134–149. [Google Scholar] [CrossRef]
  18. Meer, S.; Spiers, C.J. Influence of pore-fluid salinity on pressure solution creep in gypsum. Tectonophysics 1999, 308, 311–330. [Google Scholar] [CrossRef]
  19. Zhao, Y.; Yang, D.; Liu, Z. Problems of evolving porous media and dissolved glauberite micro-scopic analysis by micro-computed tomography: Evolving porous media (1). Transp. Porous Media 2015, 107, 365–385. [Google Scholar] [CrossRef]
  20. Liang, W.; Yang, X.; Gao, H. Experimental study of mechanical properties of gypsum soaked in brine. Int. J. Rock Mech. Min. Sci. 2012, 53, 142–150. [Google Scholar] [CrossRef]
  21. Yu, W.D.; Liang, W.G.; Li, Y.R.; Yu, Y.M. The meso-mechanism study of gypsum rock weakening in brine solutions. Bull. Eng. Geol. Environ. 2016, 75, 359–367. [Google Scholar] [CrossRef]
  22. Wang, M.; Xue, H.; Tian, S.; Wilkins, R.W. Fractal characteristics of Upper Cretaceous lacustrine shale from the Songliao Basin, NE China. Mar. Pet. Geol. 2015, 67, 144–153. [Google Scholar] [CrossRef]
  23. Ji, W.; Song, Y.; Jiang, Z. Fractal characteristics of nano-pores in the Lower Silurian Longmaxi shales from the Upper Yangtze Platform, south China. Mar. Pet. Geol. 2016, 78, 88–98. [Google Scholar] [CrossRef]
  24. Yang, R.; He, S.; Yi, J.; Hu, Q. Nano-scale pore structure and fractal dimension of organic-rich Wufeng-Longmaxi shale from Jiaoshiba area, Sichuan Basin: Investigations using FE-SEM, gas adsorption and helium pycnometry. Mar. Pet. Geol. 2016, 70, 27–45. [Google Scholar] [CrossRef]
  25. Shao, X.; Pang, X.; Li, Q.; Wang, P.; Chen, D. Pore structure and fractal characteristics of organic-rich shales: A case study of the lower Silurian Longmaxi shales in the Sichuan Basin, SW China. Mar. Pet. Geol. 2017, 80, 192–202. [Google Scholar] [CrossRef]
  26. Voorn, M.; Exner, U.; Barnhoorn, A.; Baud, P.; Reuschlé, T. Porosity, permeability and 3D fracture network characterisation of dolomite reservoir rock samples. J. Pet. Sci. Eng. 2015, 127, 270–285. [Google Scholar] [CrossRef] [PubMed] [Green Version]
  27. Dékány, I.; Szántó, F.; Nagy, L.G. Wetting and adsorption on organophilic illites and swelling montmorillonites in methanol-benzene mixtures. Colloid Polym. Sci. 1988, 266, 82–96. [Google Scholar] [CrossRef]
  28. Buck, B.J.; Brock, A.L.; Johnson, W.H.; Ulery, A.L. Corrosion of depleted uranium in an arid environment: Soil-geomorphology, SEM/EDS, XRD, and electron microprobe analyses. Soil Sediment Contam. 2004, 13, 545–561. [Google Scholar] [CrossRef]
  29. Lewis, K.N.; Thomas, M.V.; Puleo, D.A. Mechanical and degradation behavior of polymer-calcium sulfate composites. J. Mater. Sci. Mater. Med. 2006, 17, 531–537. [Google Scholar] [CrossRef] [PubMed]
  30. Helgeson, H.C.; Kirkham, D.H. Theoretical prediction of the thermodynamic behavior of aqueous electrolytes at high pressures and temperatures; II, Debye-Huckel parameters for activity coefficients and relative partial molal properties. Am. J. Sci. 1974, 274, 1199–1261. [Google Scholar] [CrossRef]
  31. Meng, T.; Bao, X.; Zhao, J. Study of mixed mode fracture toughness and fracture characteristic in gypsum rock under brine saturation. Environ. Earth. Sc. 2018, 77, 364. [Google Scholar] [CrossRef]
  32. Bao, X.; Tao, M.; Zhao, J. Study of mixed mode fracture toughness and fracture trajectories in gypsum interlayers in corrosive environment. Roy. Soc. Open. Sci. 2018, 5, 171374. [Google Scholar] [CrossRef] [PubMed] [Green Version]
  33. Tao, M.; Yechao, Y.; Jie, C. Investigation on the permeability evolution of gypsum interlayer under high temperature and triaxial pressure. Rock Mech. Rock Eng. 2017, 50, 2059–2069. [Google Scholar] [CrossRef]
Figure 1. (a) In situ leach mining with a cavern for oil, natural gas and carbon dioxide storage; (b) Glauberite cores.
Processes 06 00099 g001
Figure 2. (a) Regional geological map of Yunying mine [14]; (b) glauberite ores ( ϕ 3 × 10 mm); (c) the thin section of glauberite (200×).
Processes 06 00099 g002
Figure 3. (a) μ-CT225kvFCB MCT test system. (b) Self-heated system with constant temperature (SHSWCT).
Processes 06 00099 g003
Figure 4. Microstructure evolutions of glauberite specimens immersed in pure water at 20 °C: (a) 20 °C pure water immersion, 0 h; (b) 20 °C pure water immersion, 10 h; (c) 20 °C pure water immersion, 20 h; and (d) 20 °C pure water immersion, 30 h.
Processes 06 00099 g004
Figure 5. Microstructure evolutions of glauberite specimens immersed in pure water at 50 °C: (a) 50 °C pure water immersion, 0 h; (b) 50 °C pure water immersion, 10 h; (c) 50 °C pure water immersion, 20 h; and (d) 50 °C pure water immersion, 30 h.
Processes 06 00099 g005
Figure 6. Microstructure evolutions of glauberite specimens immersed in pure water at 80 °C: (a) 80 °C pure water immersion, 0 h; (b) 80 °C pure water immersion, 10 h; (c) 80 °C pure water immersion, 20 h; and (d) 80 °C pure water immersion, 30 h.
Processes 06 00099 g006
Figure 7. Microstructure evolutions of glauberite specimens immersed in half saturated brine at 80 °C: (a) 80 °C half saturated brine immersion, 0 h; (b) 80 °C half saturated brine immersion,10 h; (c) 80 °C half saturated brine immersion, 20 h; and (d) 80 °C half saturated brine immersion, 30 h.
Processes 06 00099 g007
Figure 8. Microstructure evolutions of glauberite specimens immersed in saturated brine at 80 °C: (a) 80 °C saturated brine immersion, 0 h; (b) 80 °C saturated brine immersion, 10 h; (c) 80 °C saturated brine immersion, 20 h; and (d) 80 °C saturated brine immersion, 30 h.
Processes 06 00099 g008
Figure 9. Variation in the average porosity of glauberite specimens with time under different immersion conditions. (a) 20 °C; (b) 50 °C; (c) 80 °C.
Processes 06 00099 g009aProcesses 06 00099 g009b
Figure 10. The dissolved areas (residual porous skeleton area) and undissolved areas.
Processes 06 00099 g010
Figure 11. The spherical ore specimen (i.e., intact specimen with no cracks) dissolving process and ideal model diagram. (a) liquid immersion, 0 h; (b) liquid immersion, 10 h; (c) liquid immersion, 20 h; and (d) liquid immersion, 30 h.
Processes 06 00099 g011
Figure 12. Dissolution of a small salt-gypsum specimen by pure water after different immersion times [19]. Images were made using MCT (250×).
Processes 06 00099 g012
Figure 13. The spherical ore specimen (i.e., fractured specimen with cracks) dissolving process and ideal model diagram. (a) liquid immersion, 0 h; (b) liquid immersion, 10 h; (c) liquid immersion, 20 h; and (d) liquid immersion, 30 h.
Processes 06 00099 g013
Figure 14. Microscope photos of glauberite sections dissolved by pure water at different times (250×) [13]. (a) Original dry slice; (b) after 5 min of dissolution; (c) after 10 min of dissolution; (d) after 15 min of dissolution.
Processes 06 00099 g014
Figure 15. The relationship between the diameter of the glauberite specimen and the immersing time.
Processes 06 00099 g015
Figure 16. Na 2 SO 4 - NaCl - H 2 O phase diagram of three element system (20 °C).
Processes 06 00099 g016
Table 1. The average porosity of glauberite specimens in different immersion conditions.
TemperatureImmersing ConditionPorosity (%)Regression Equations of Glauberite Porosity with Time
0 h10 h20 h30 h
20 °CPure water1.571.634.087.29 y = 1.2898 e 0.0552 x
Half-saturated brine1.881.911.972.12 y = 1.8557 e 0.0039 x
Saturated brine1.421.441.471.52 y = 1.4135 e 0.0022 x
50 °CPure water1.733.297.5210.97 y = 1.7910 e 0.0637 x
Half-saturated brine2.212.412.753.43 y = 2.1417 e 0.0145 x
Saturated brine1.861.911.992.14 y = 1.8402 e 0.0046 x
80 °CPure water1.827.8413.1319.48 y = 2.4756 e 0.0763 x
Half-saturated brine0.912.394.867.52 y = 1.0378 e 0.0705 x
Saturated brine1.712.874.166.71 y = 1.7491 e 0.0447 x

